Chapter 15
Financial Statement Analysis
Review Questions
1. What are the three main ways to analyze financial statements?
The three main ways to analyze financial statements are horizontal analysis, vertical analysis, and
ratio analysis.
2. What is an annual report? Briefly describe the key parts of the annual report.
An annual report (10-K) is a report required by the Securities and Exchange Commission that
3. What is horizontal analysis, and how is a percentage change computed?
The horizontal analysis is the study of percentage changes in line items from comparative financial
4. What is trend analysis, and how does it differ from horizontal analysis?
5. What is vertical analysis? What item is used as the base for the income statement? What item is used
as the base for the balance sheet?
The vertical analysis of a financial statement shows the relationship of each line item to its base
15-2
6. Describe a common-size statement and how it might be helpful in evaluating a company.
A common-size statement reports only percentages—the same percentages that appear in a vertical
7. What is benchmarking, and what are the two main types of benchmarks in financial statement
analysis?
8. Briefly describe the ratios that can be used to evaluate a company’s ability to pay current liabilities.
The financial measures that are used to evaluate the ability of a company to pay its current liabilities
are:
inventory and collect receivables.
The ratios that are used to evaluate a company’s ability to sell merchandise inventory and collect
receivables are:
10. Briefly describe the ratios that can be used to evaluate a company’s ability to pay long-term debt.
The ratios that can be used to evaluate a company’s ability to pay long-term debt are:
11. Briefly describe the ratios that can be used to evaluate a company’s profitability.
The ratios that can be used to evaluate a company’s profitability are:
• Profit margin ratio—Shows how much net income is earned on every dollar of sales: Net income
/ Net sales revenue.
12. Briefly describe the ratios that can be used to evaluate a company’s stock as an investment.
The ratios that can be used to evaluate a company’s stock as an investment are:
• Price / earnings ratio—The market price of a share of common stock in relation to the company’s
•
13. What are some common red flags in financial statement analysis?
Some of the common red flags in financial statement analysis are:
15-4
Short Exercises
S15-1 Explaining financial statements
Learning Objective 1
Caleb King is interested in investing in Orange Corporation. What types of tools should Caleb use to
evaluate the company?
SOLUTION
Caleb should complete a review of the company’s performance across several periods of time. The
S15-2 Performing horizontal analysis
Learning Objective 2
Verifine Corp. reported the following on its comparative income statement:
(In millions)
2019
2018
2017
Revenue
$ 9,890
$ 9,690
$ 9,135
Cost of Goods Sold
6,250
6,000
5,890
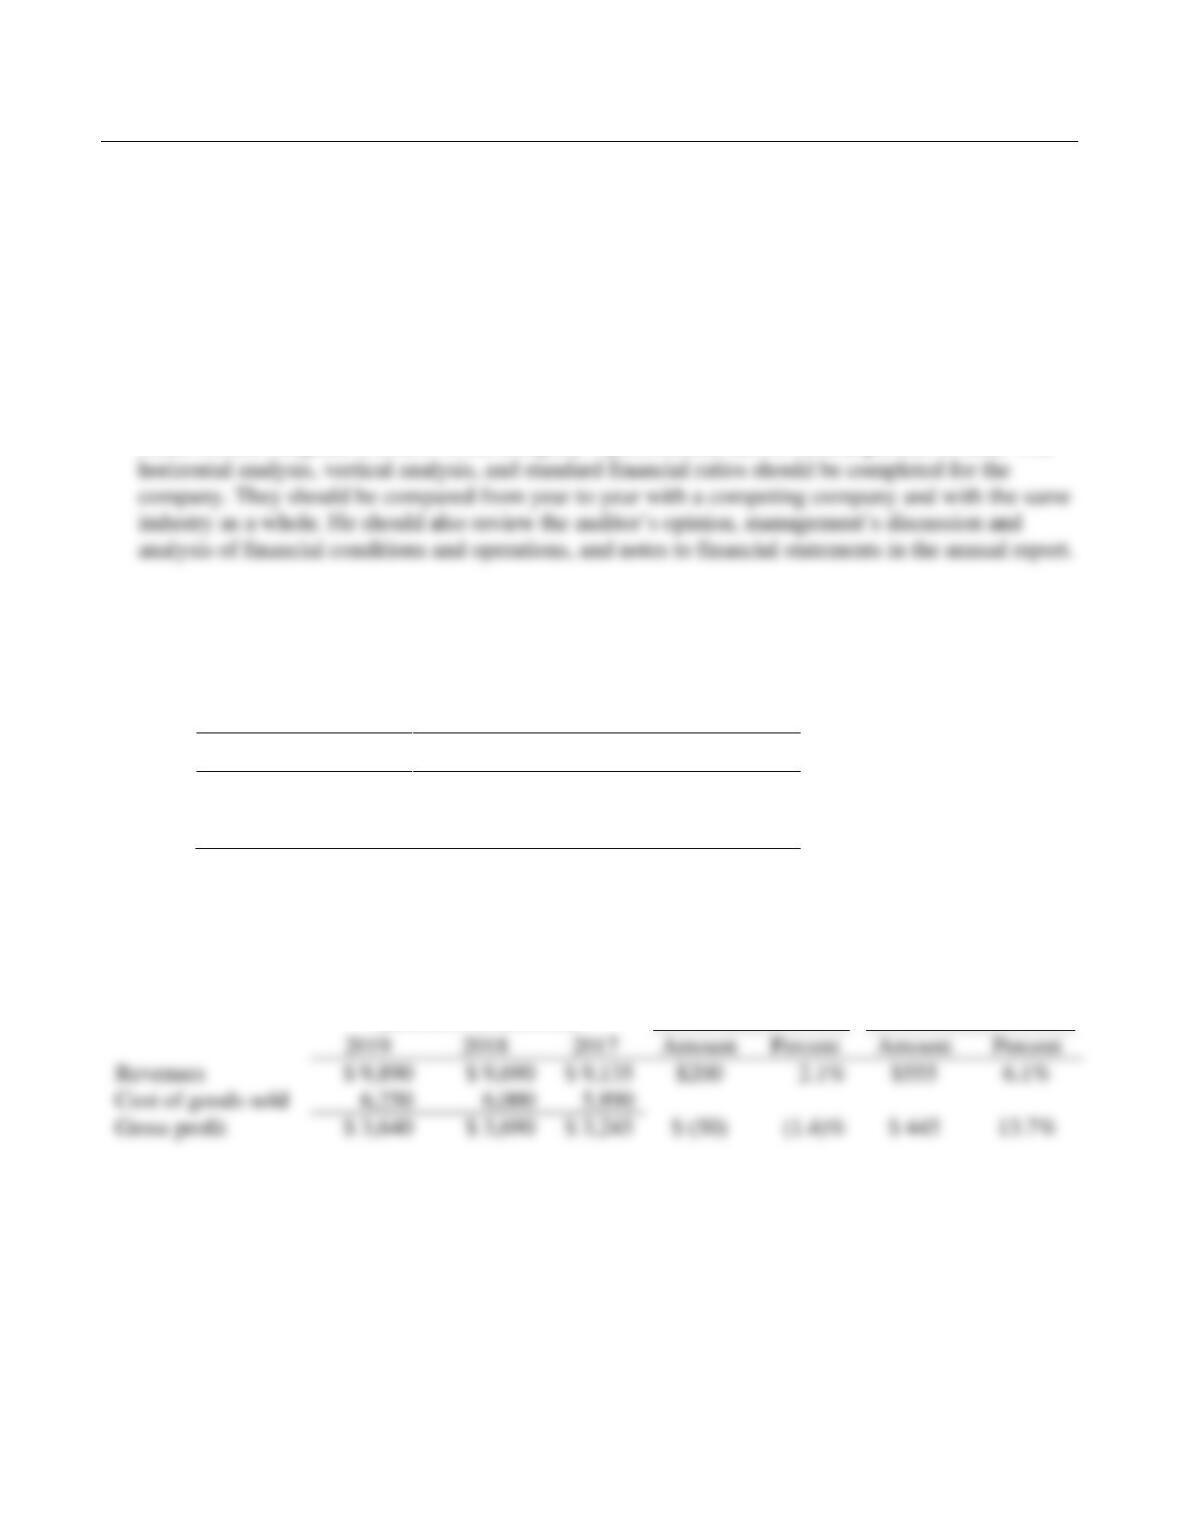
Prepare a horizontal analysis of revenues and gross profit—both in dollar amounts and in percentages—
for 2019 and 2018.
SOLUTION
Increase (Decrease)
(Amounts in millions)
2019
2018
15-5
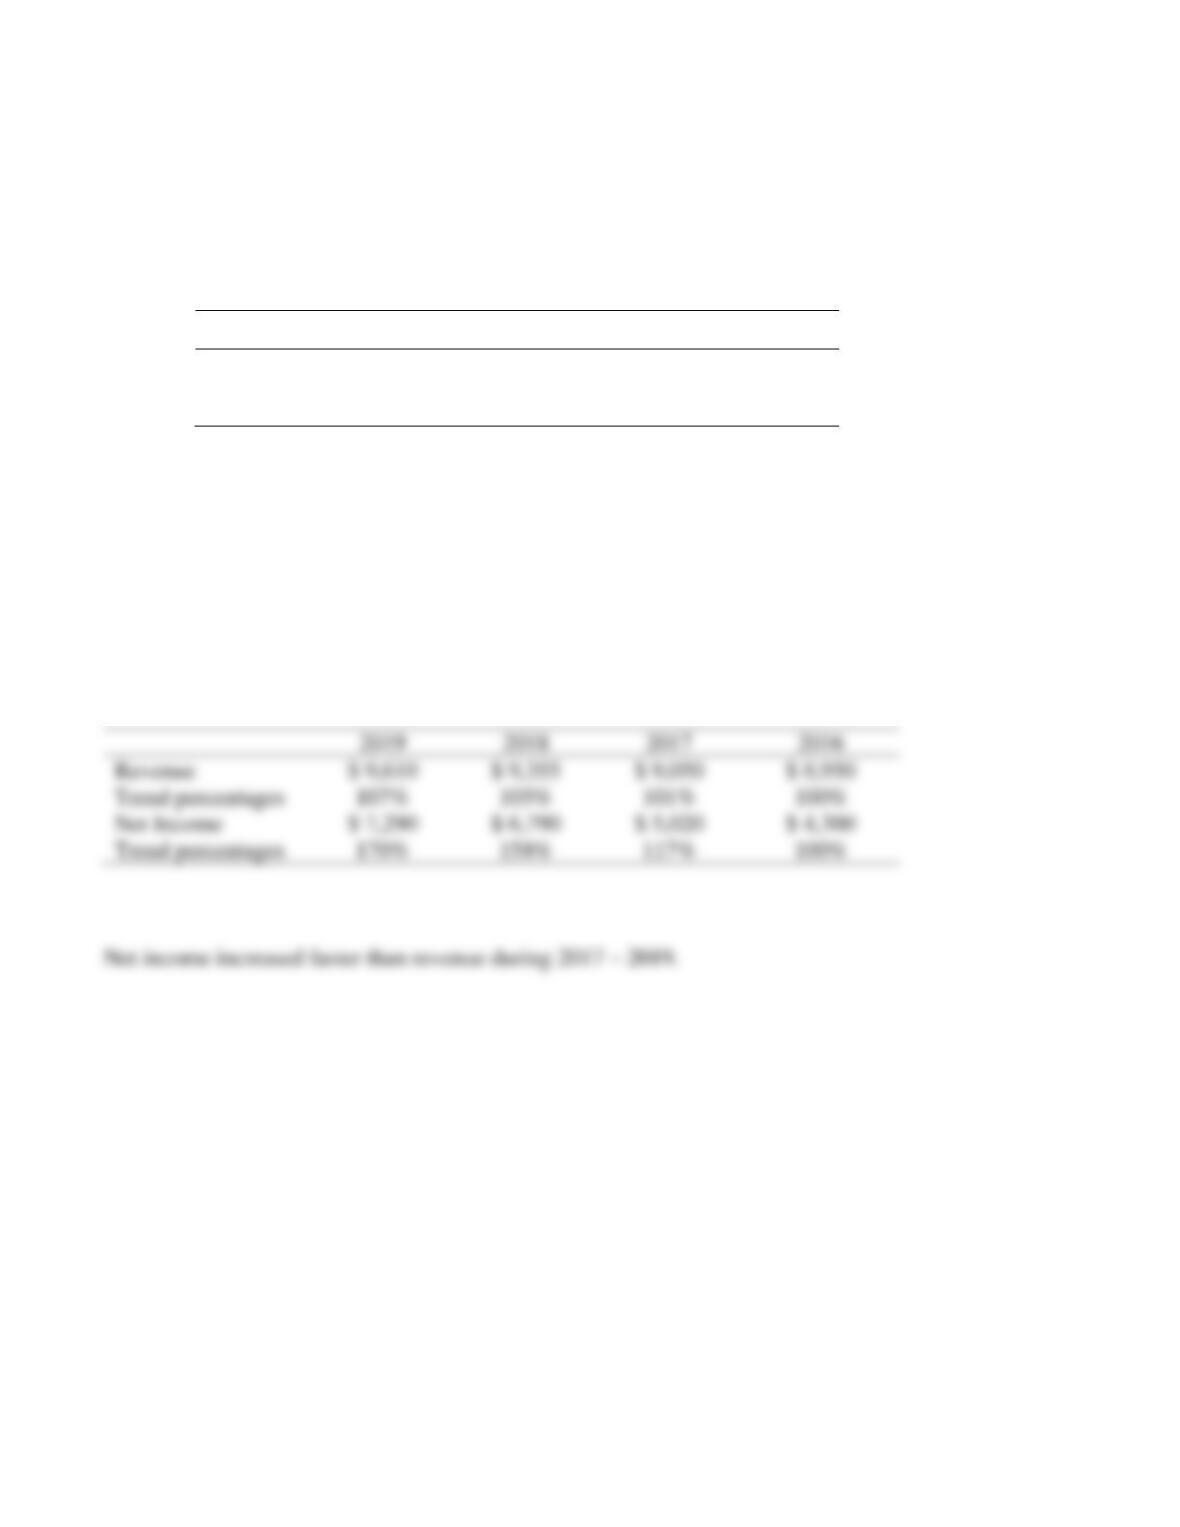
S15-3 Calculating trend analysis
Learning Objective 2
Muscateer Corp. reported the following revenues and net income amounts:
(In millions)
2019
2018
2017
2016
Revenue
$ 9,610
$ 9,355
$ 9,050
$ 8,950
Net Income
7,290
6,790
5,020
4,300
Requirements
1. Calculate Muscateer’s trend analysis for revenues and net income. Use 2016 as the base year, and
round to the nearest percent.
2. Which measure increased at a higher rate during 2017–2019?
SOLUTION
Requirement 1
Requirement 2
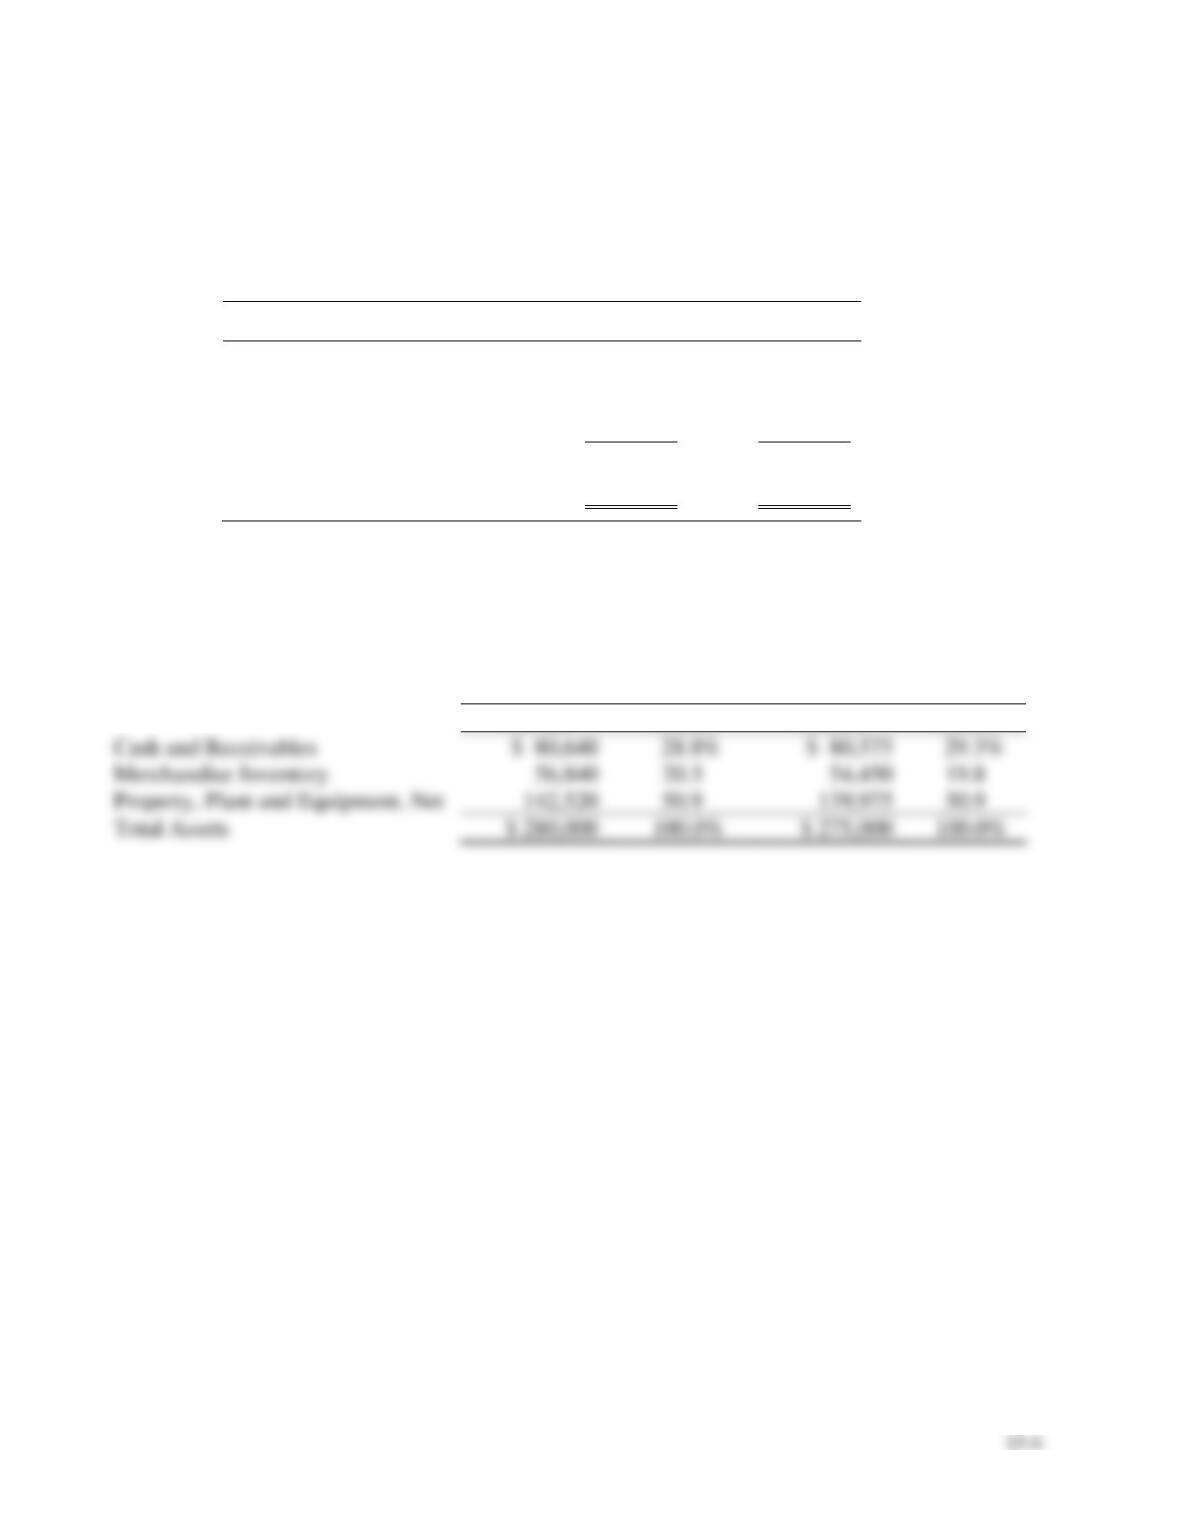
S15-4 Performing vertical analysis
Learning Objective 3
Great Value Optical Company reported the following amounts on its balance sheet at December 31,
2018 and 2017:
2018
2017
Cash and Receivables
$ 80,640
$ 80,575
Merchandise Inventory
56,840
54,450
Property, Plant, and
Equipment, Net
142,520
139,975
Total Assets
$ 280,000
$ 275,000
Prepare a vertical analysis of Great Value’s assets for 2018 and 2017.
SOLUTION
2018
2017
Amount
Percent
Amount
Percent
Cash and Receivables
28.8%
Merchandise Inventory
Property, Plant and Equipment, Net
Total Assets
15-7
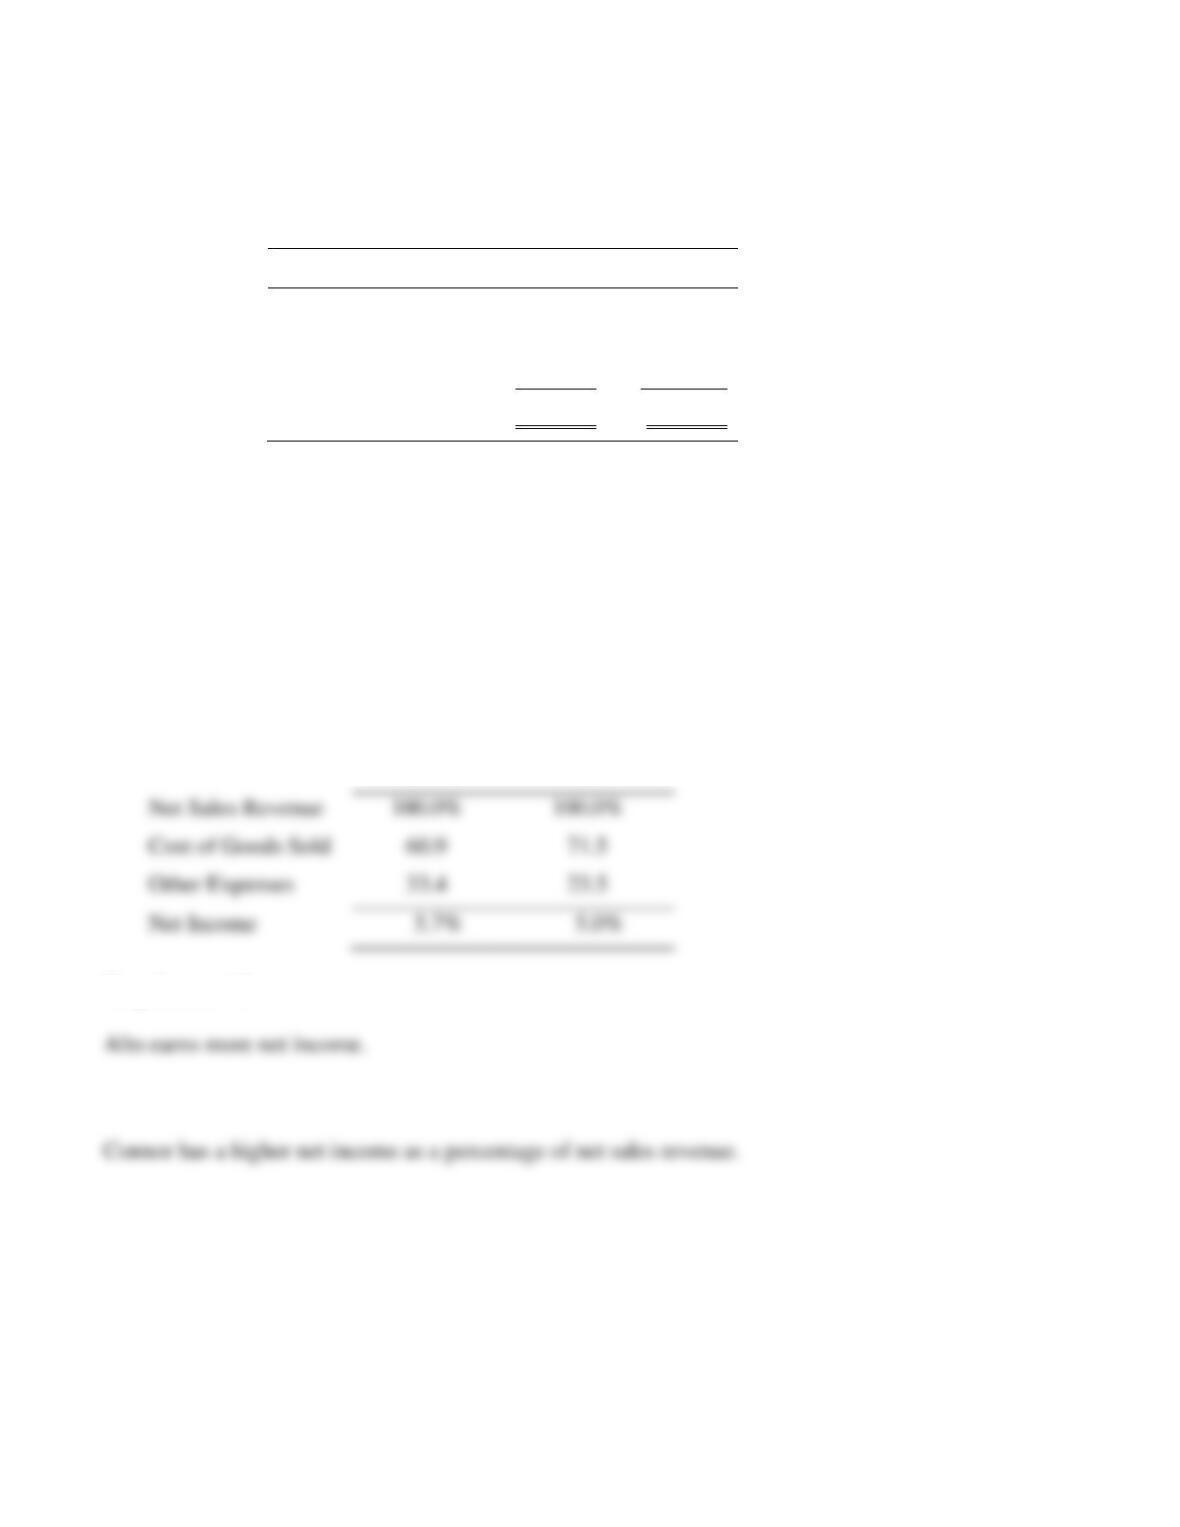
S15-5 Preparing common-size income statement
Learning Objective 3
Data for Connor, Inc. and Alto Corp. follow:
Connor
Alto
Net Sales Revenue
$ 13,000
$ 22,000
Cost of Goods Sold
7,917
15,730
Other Expenses
4,342
5,170
Net Income
$ 741
$ 1,100
Requirements
1. Prepare common-size income statements.
2. Which company earns more net income?
3. Which company’s net income is a higher percentage of its net sales revenue?
SOLUTION
Requirement 1
Connor
Alto
Requirement 2
Requirement 3
Net Sales Revenue
100.0%
Cost of Goods Sold
71.5
Other Expenses
23.5
Net Income
5.7%
15-8
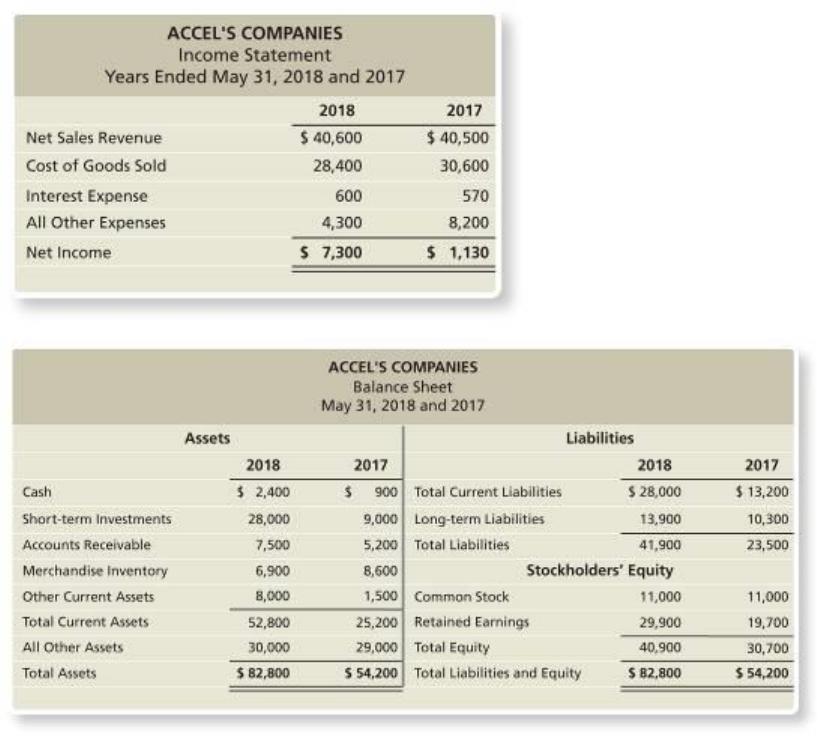
Use the following information for Short Exercises S15-6 through S15-10.
Accel’s Companies, a home improvement store chain, reported the following summarized figures:
Accel’s has 10,000 common shares outstanding during 2018.
S15-6 Evaluating current ratio
Learning Objective 4
Requirements
1. Compute Accel’s Companies’ current ratio at May 31, 2018 and 2017.
2. Did Accel’s Companies’ current ratio improve, deteriorate, or hold steady during 2018?
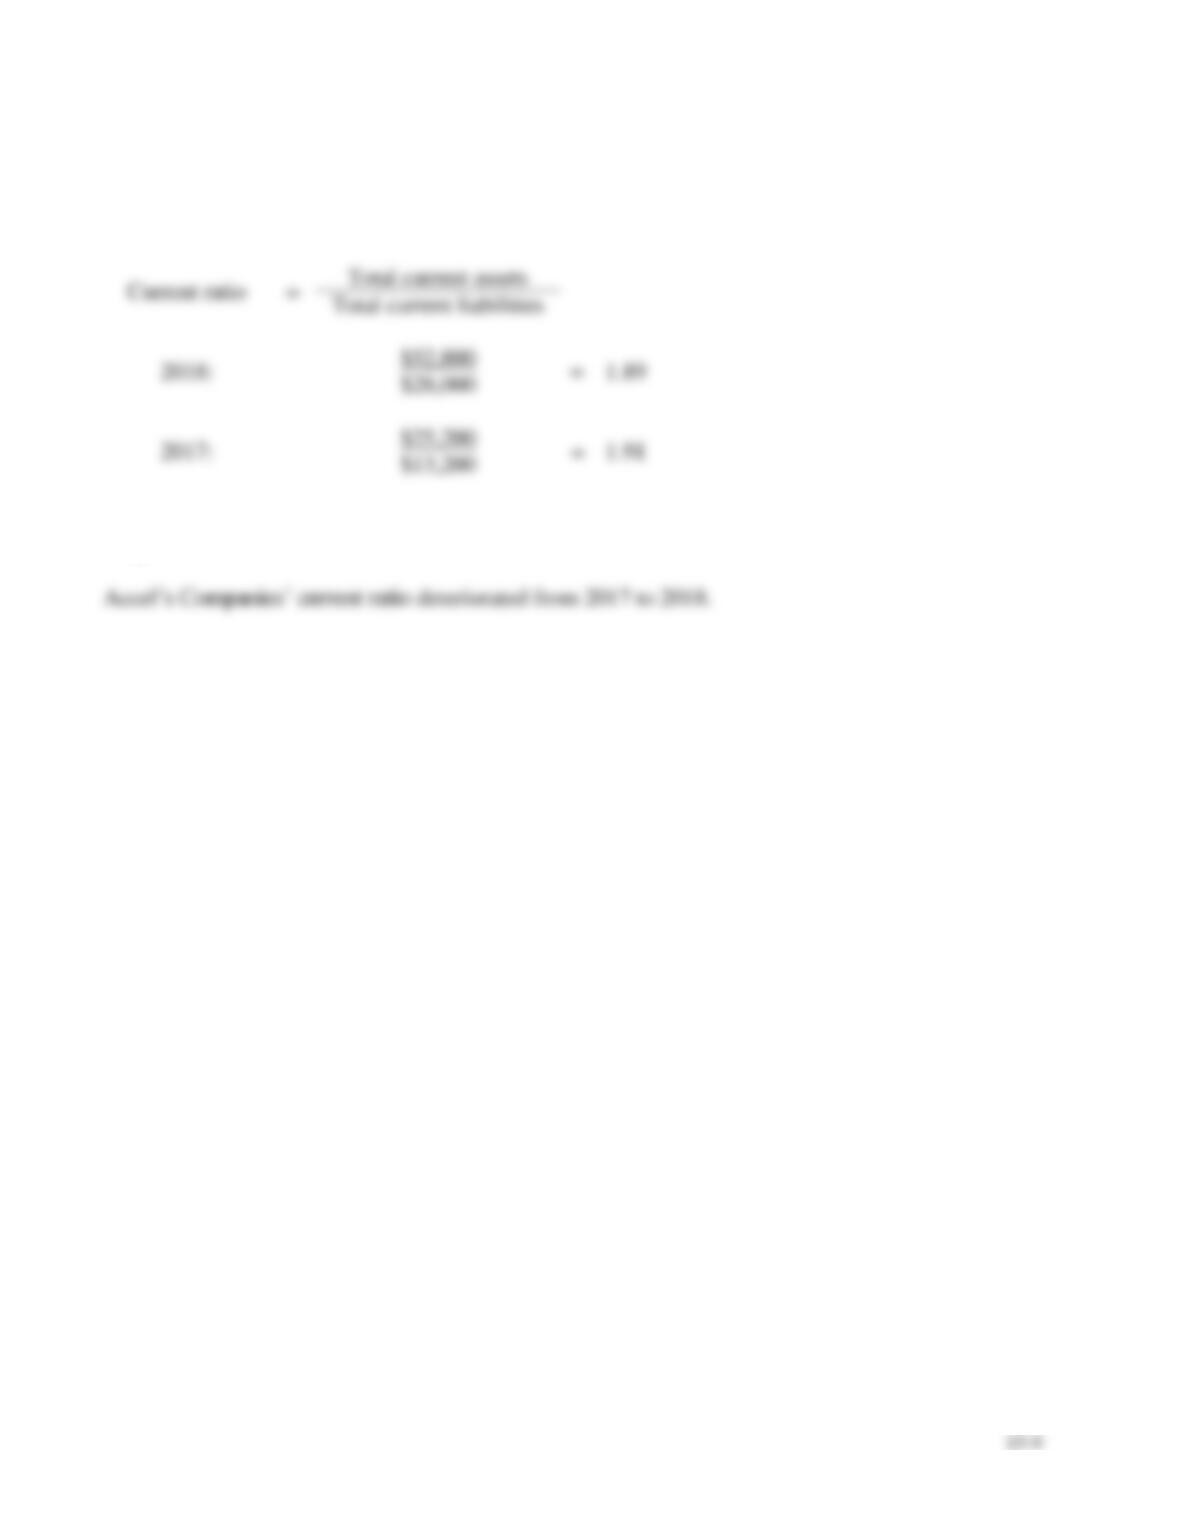
Total current liabilities
S15-6, cont.
SOLUTION
Requirement 1
Requirement 2
S15-7 Computing inventory, gross profit, and receivables ratios
Learning Objective 4
Requirements
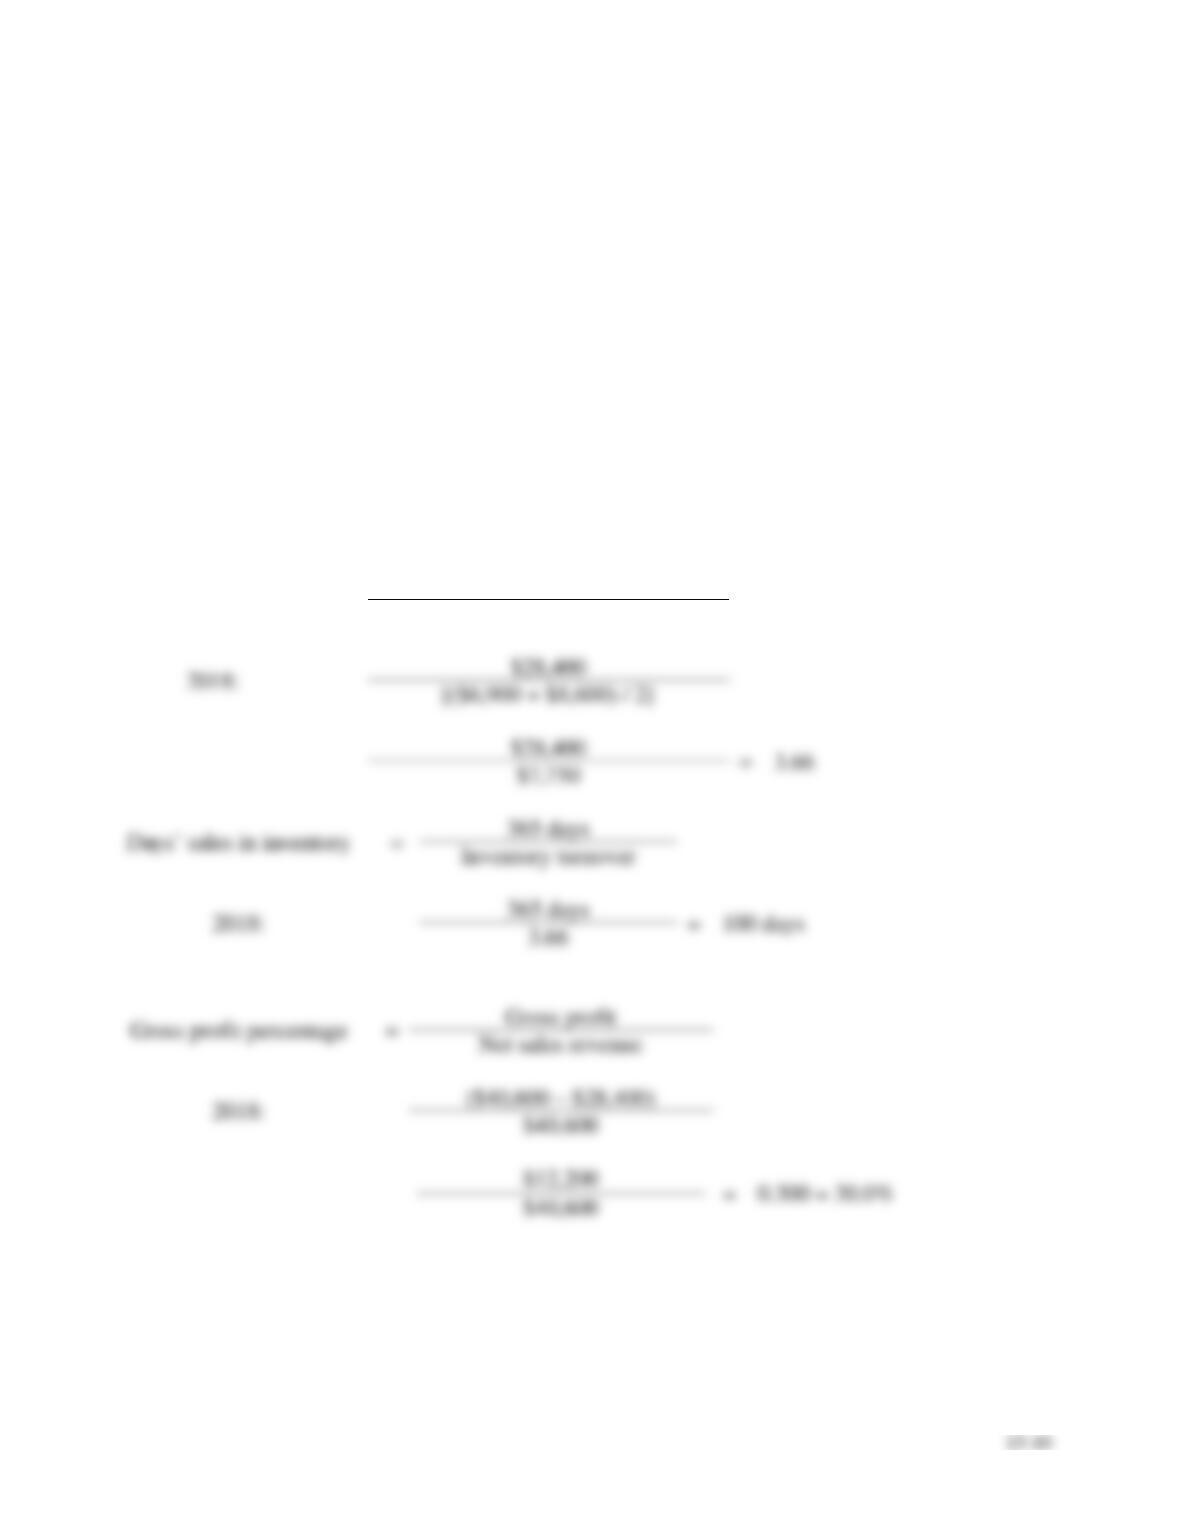
1. Compute the inventory turnover, days’ sales in inventory, and gross profit percentage for Accel’s
Companies for 2018.
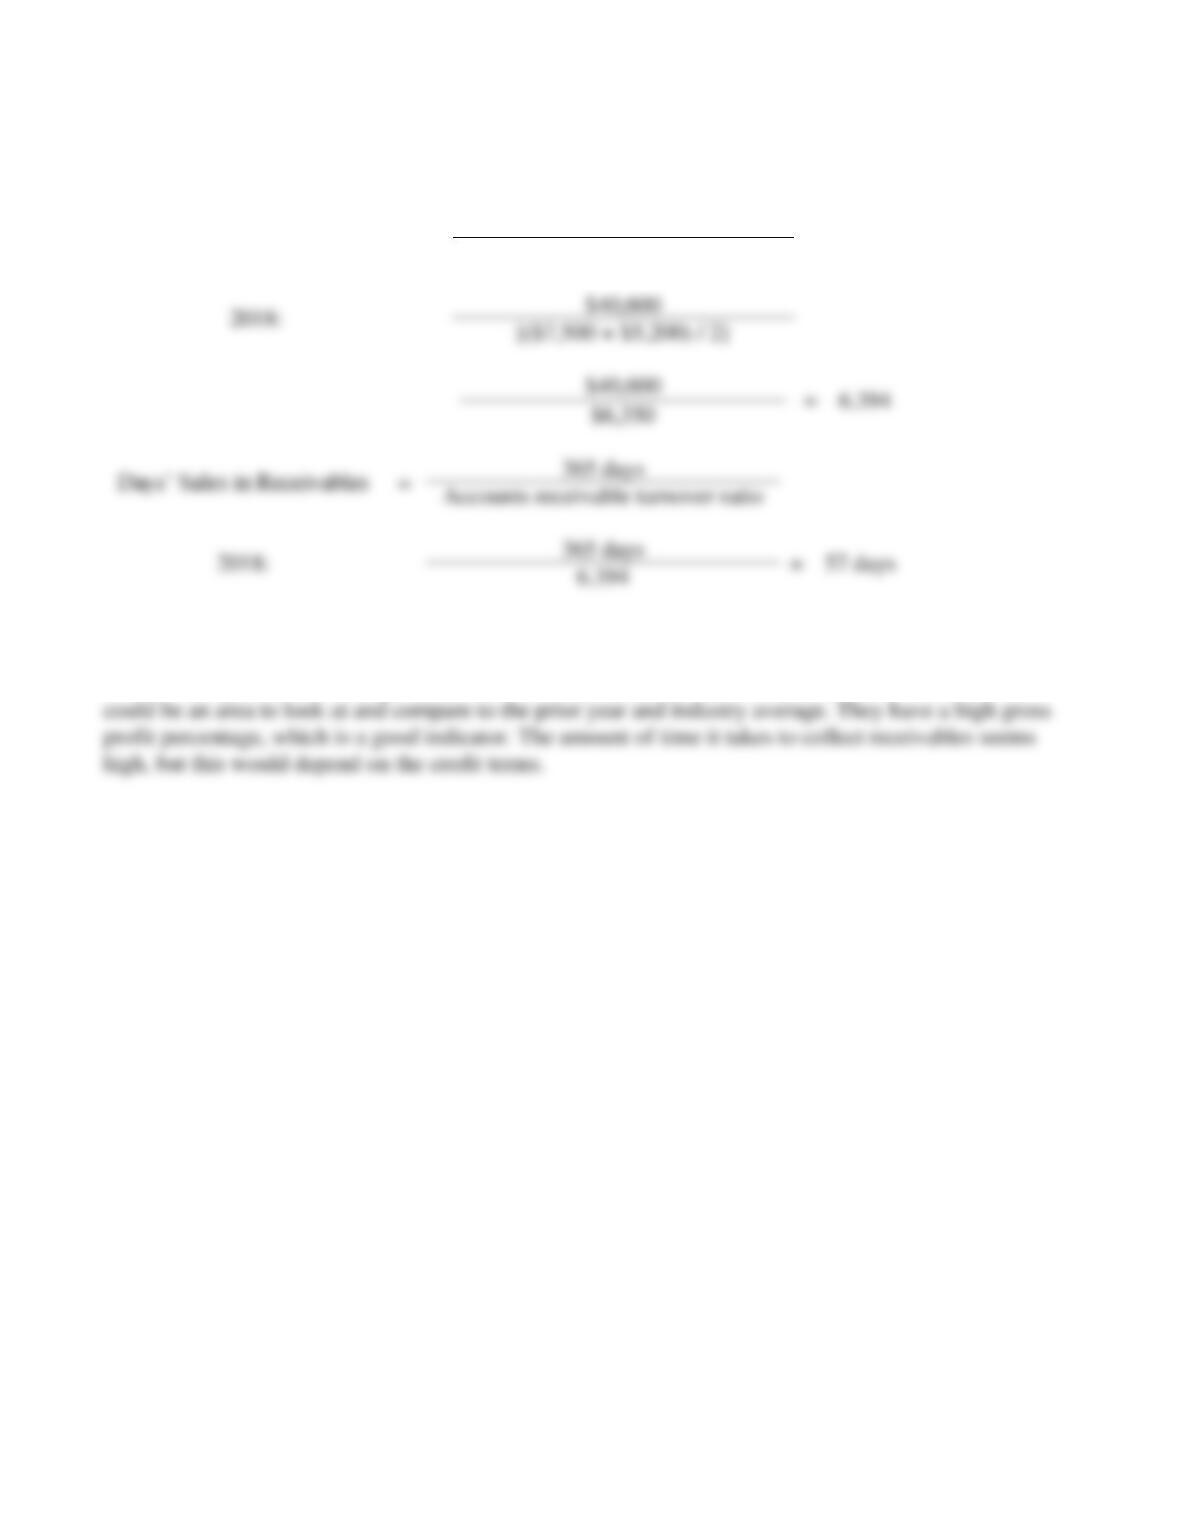
2. Compute days’ sales in receivables during 2018. Round intermediate calculations to three decimal
places. Assume all sales were on account.
3. What do these ratios say about Accel’s Companies’ ability to sell inventory and collect receivables?
SOLUTION
Requirement 1
Inventory turnover
=
Cost of goods sold
Average merchandise inventory
15–11
S15-7, cont.
Requirement 2
Accounts receivable turnover
ratio
=
Net credit sales
Average net accounts receivables
Requirement 3
Accel’s Companies’ have a high amount of inventory on hand and a low inventory turnover ratio. This
Accounts receivable turnover ratio
15–12
S15-8 Measuring ability to pay liabilities
Learning Objective 4
Requirements
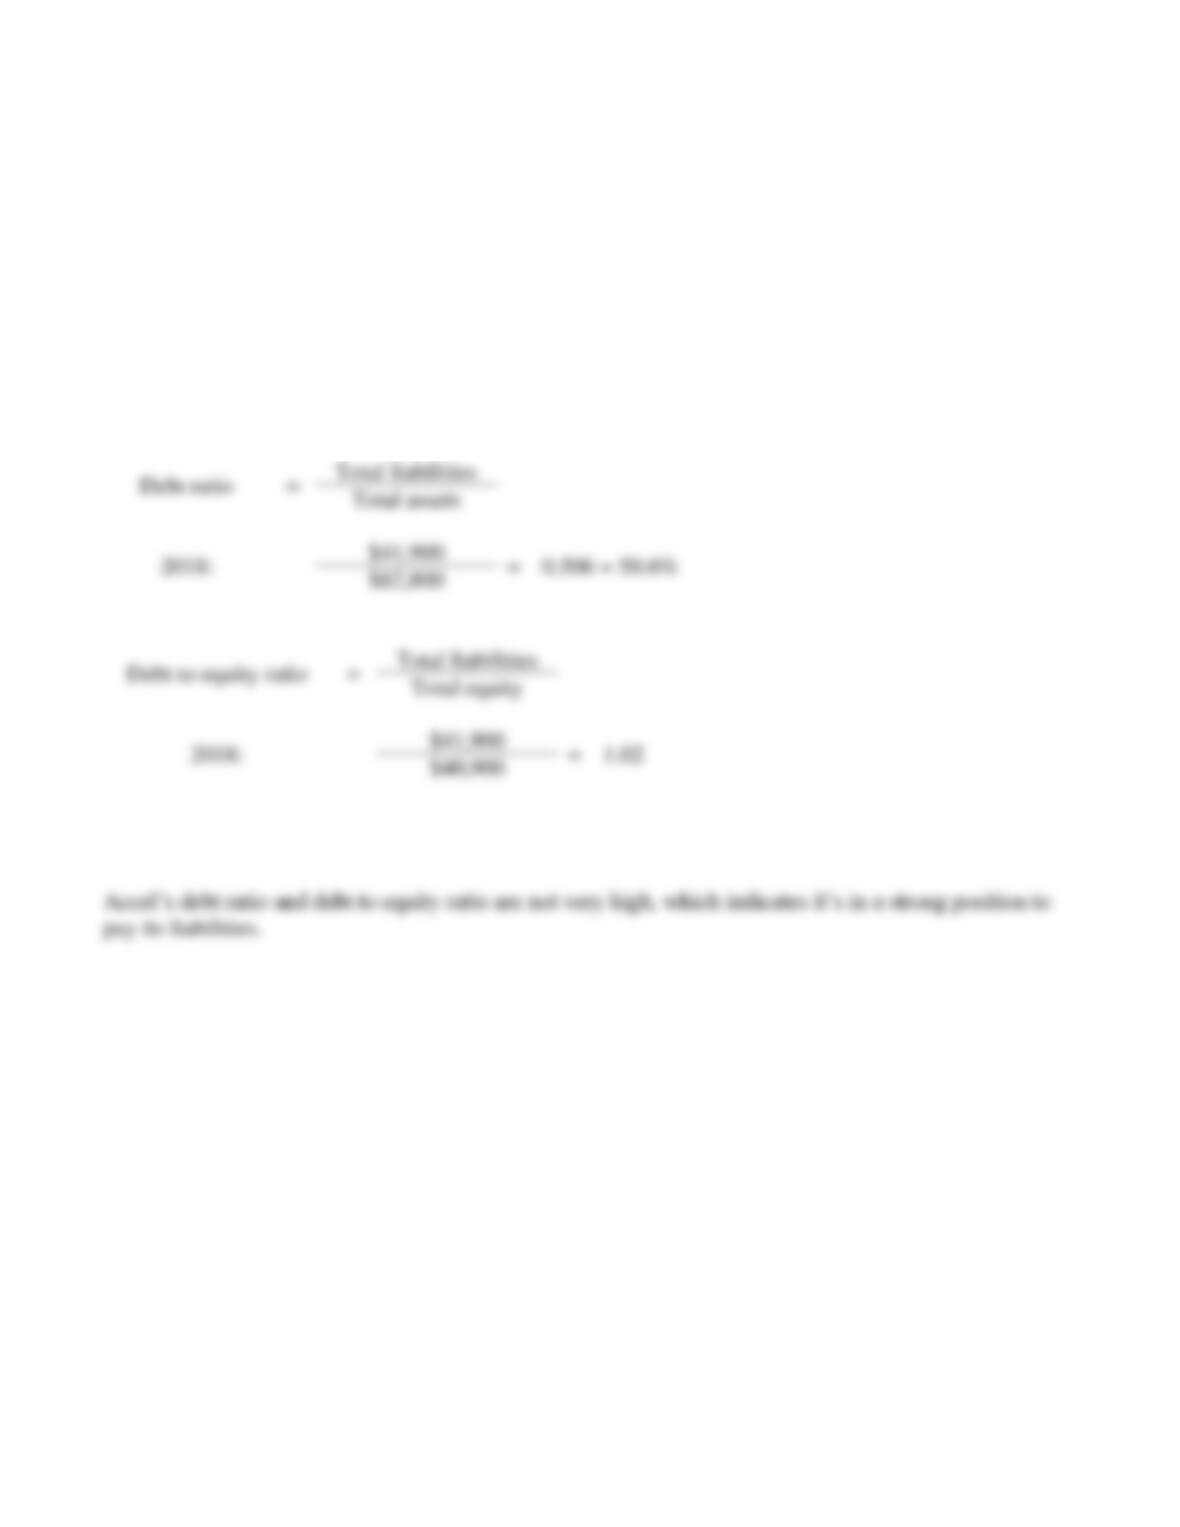
1. Compute the debt ratio and the debt to equity ratio at May 31, 2018, for Accel’s Companies.
2. Is Accel’s ability to pay its liabilities strong or weak? Explain your reasoning.
SOLUTION
Requirement 1
Requirement 2
15–13
S15-9 Measuring profitability
Learning Objective 4
Requirements
1. Compute the profit margin ratio for Accel’s Companies for 2018.
2. Compute the rate of return on total assets for 2018.
3. Compute the asset turnover ratio for 2018.
4. Compute the rate of return on common stockholders’ equity for 2018.
5. Are these rates of return strong or weak? Explain your reasoning.
SOLUTION
Requirement 1
Profit margin ratio
=
Net income
Net sales revenue
2018:
$7,300
=
0.180 = 18.0%
$40,600
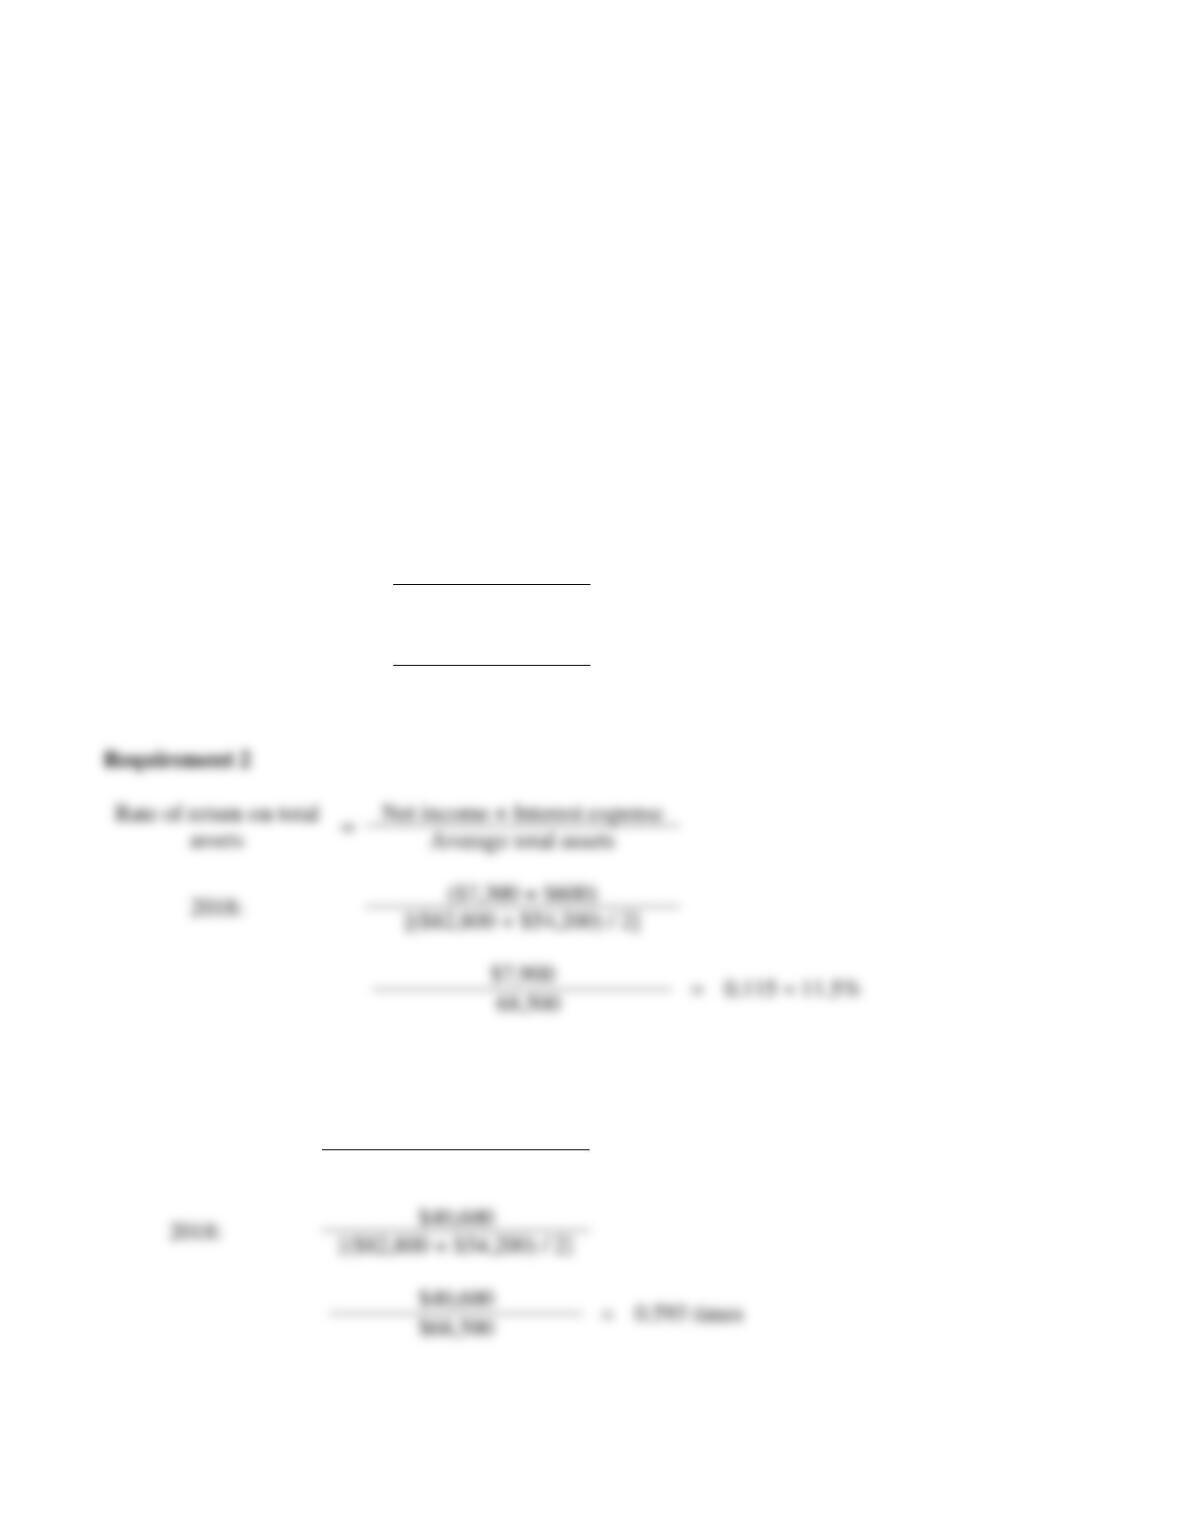
Requirement 3
Asset turnover
ratio
=
Net sales revenue
Average total assets
=
Net income + Interest expense
S15-9, cont.
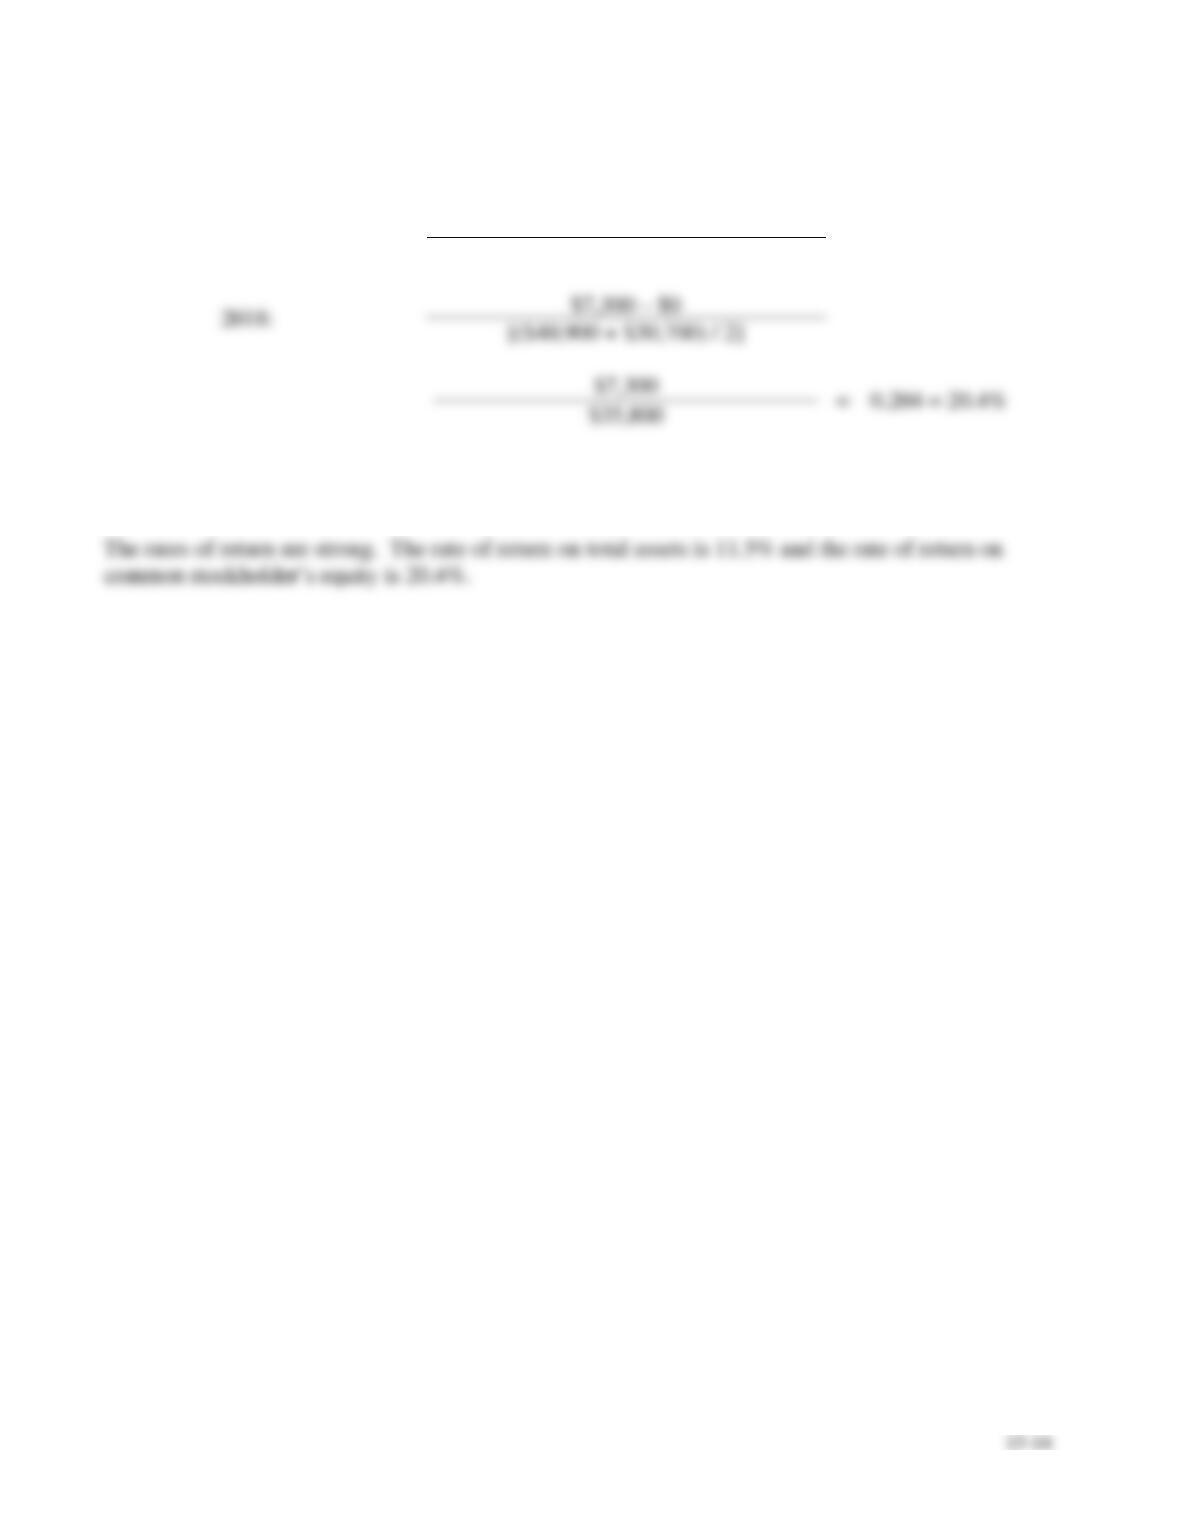
Requirement 4
Rate of return on common
stockholders’ equity
=
Net income – Preferred dividends
Average common stockholders’ equity
Requirement 5
S15-10 Computing EPS and P/E ratio
Learning Objective 4
Requirements
1. Compute earnings per share (EPS) for 2018 for Accel’s. Round to the nearest cent.
2. Compute Accel’s Companies’ price/earnings ratio for 2018. The market price per share of Accel’s
stock is $12.50.
3. What do these results mean when evaluating Accel’s Companies’ profitability?
SOLUTION
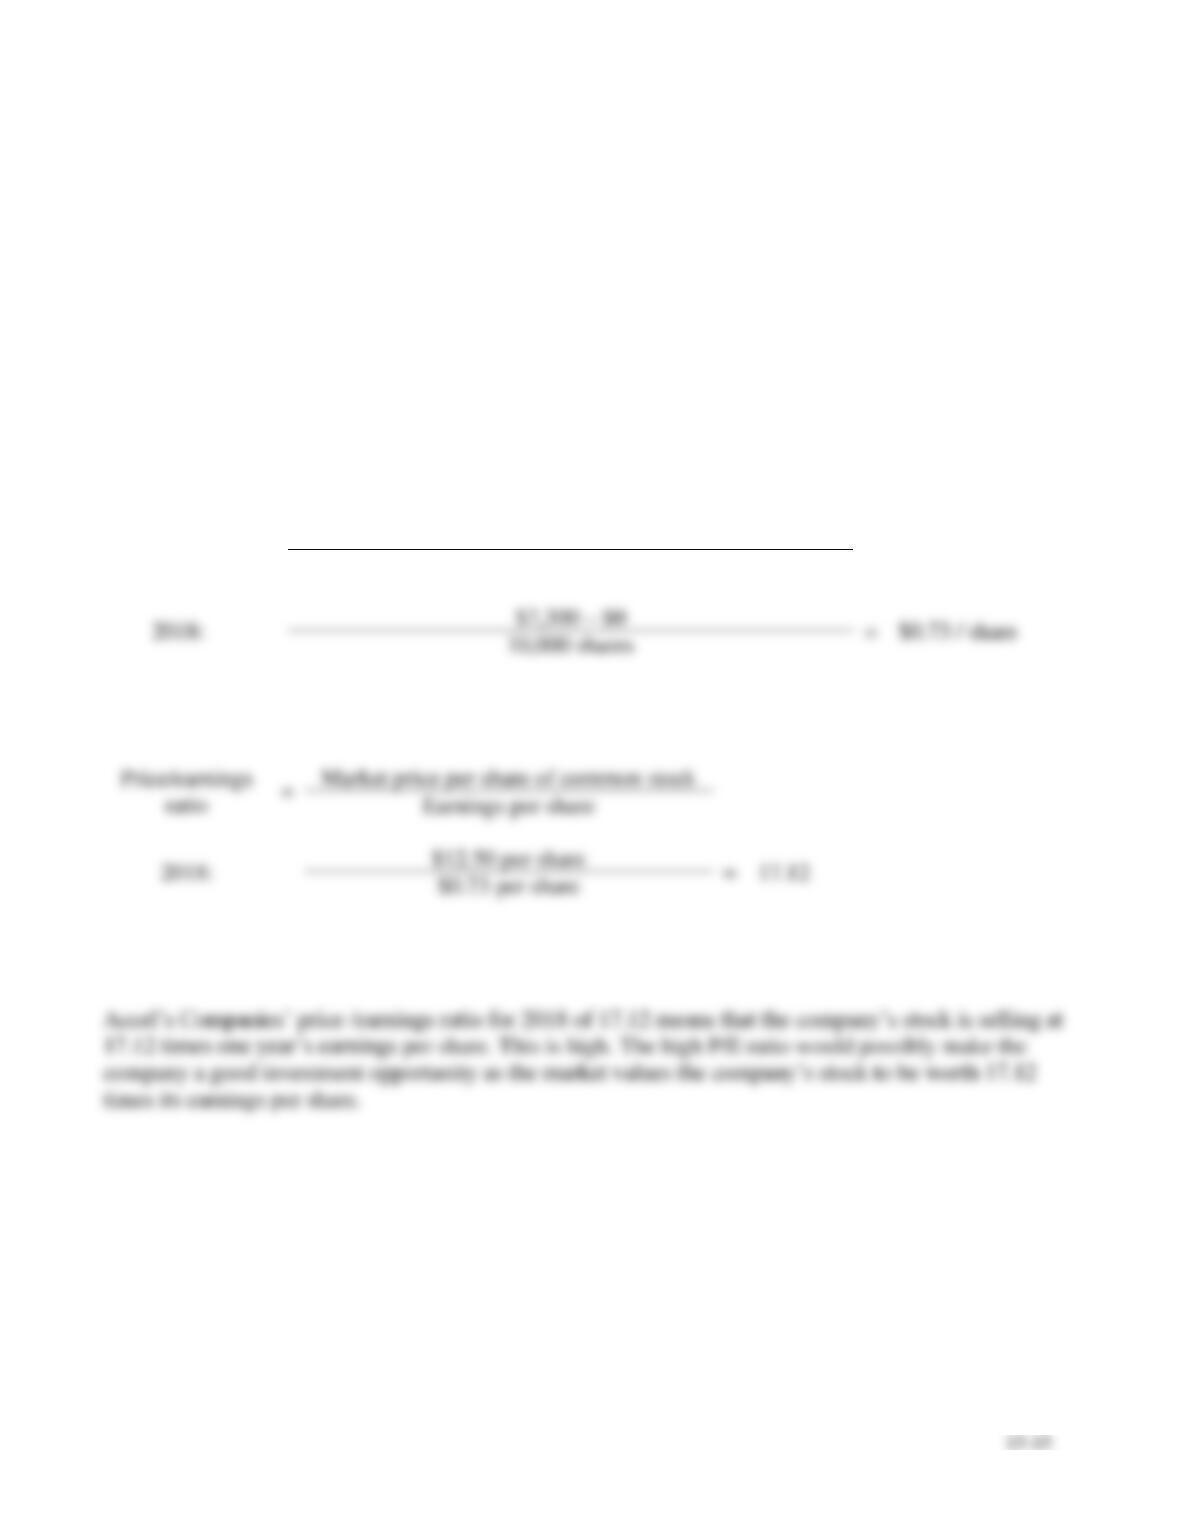
Requirement 1
Earnings per
share
=
Net income – Preferred dividends
Weighted average number of common shares outstanding
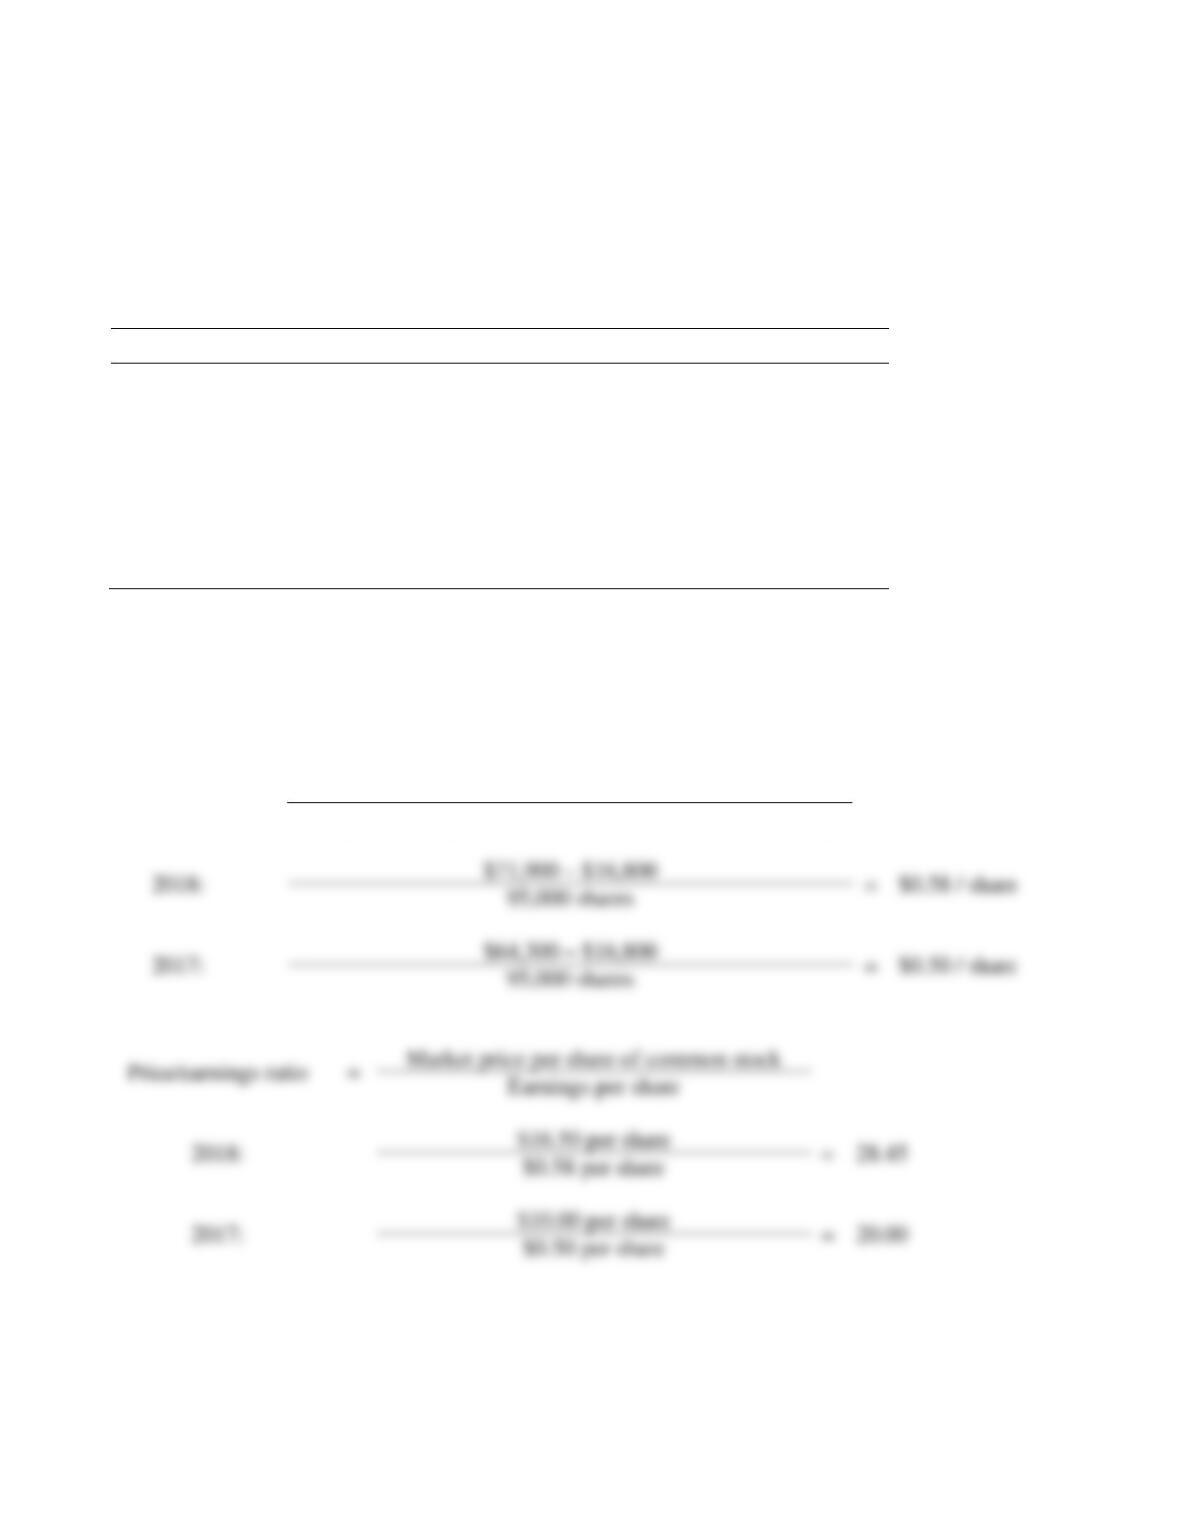
Market price per share of common stock
$12.50 per share
Requirement 2
Requirement 3
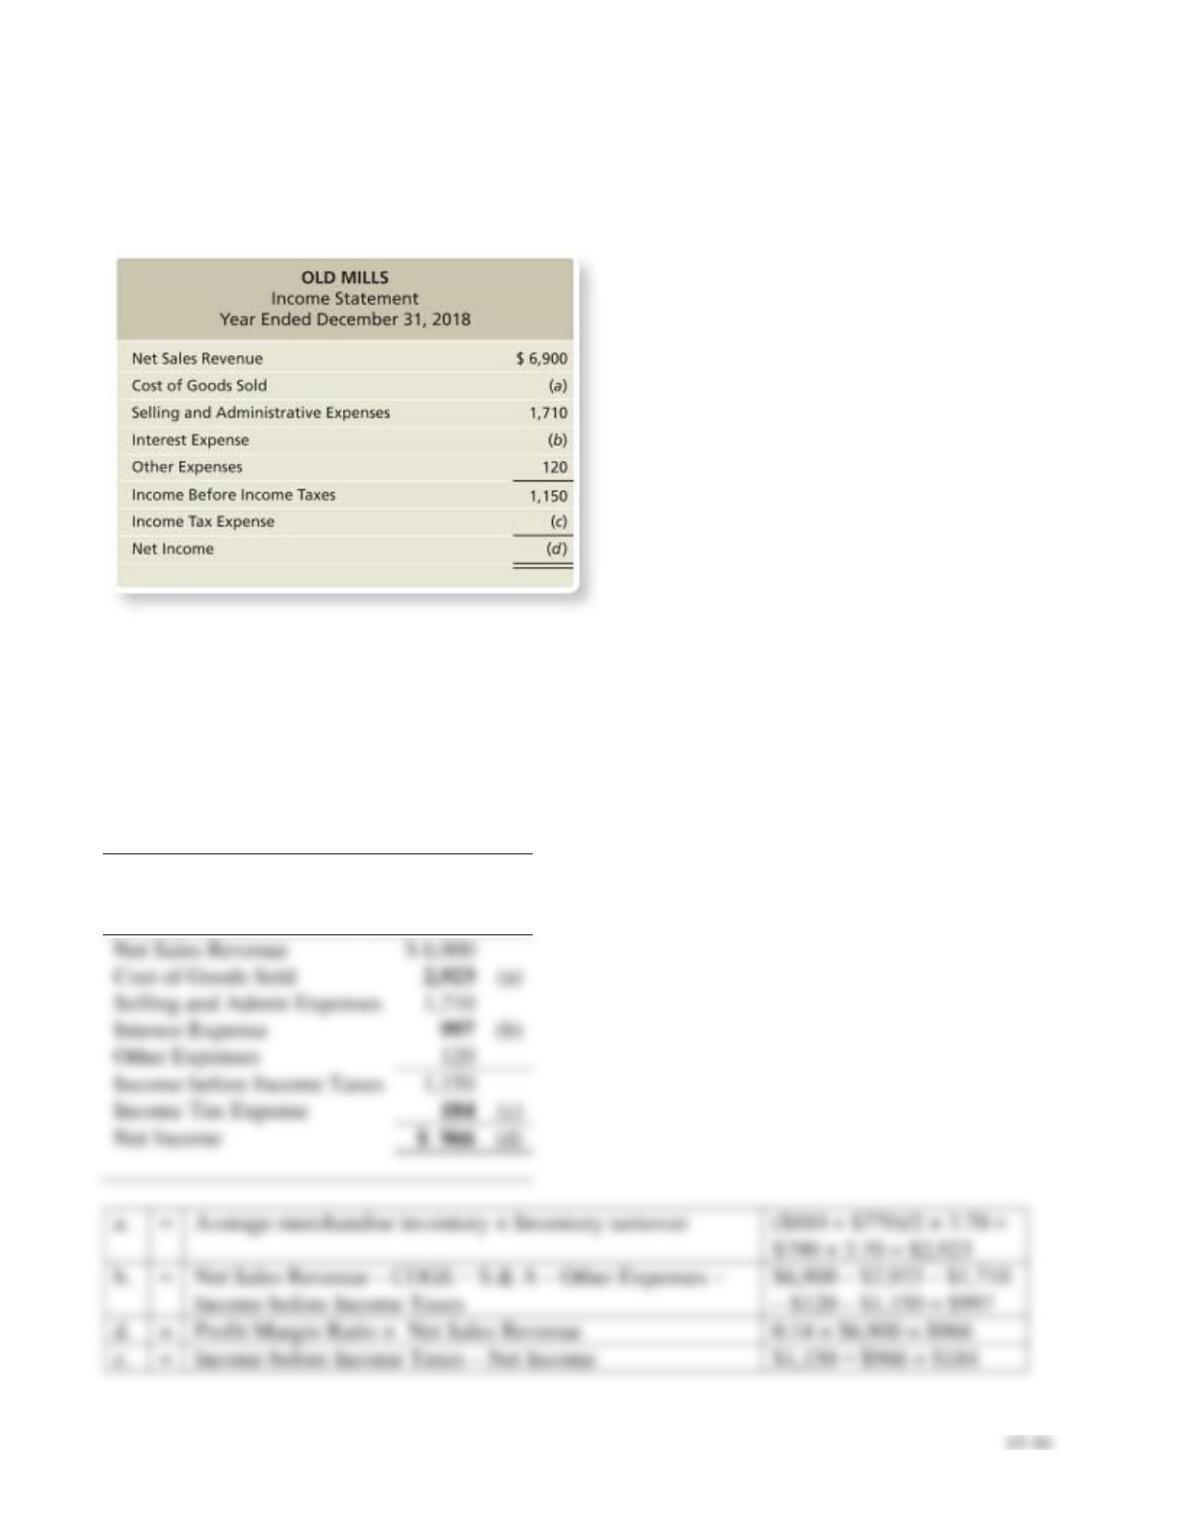
S15-11 Using ratios to reconstruct an income statement
Learning Objective 4
Old Mills’s income statement appears as follows (amounts in thousands):
Use the following ratio data to complete Old Mills’s income statement:
1. Inventory turnover is 3.70 (beginning Merchandise Inventory was $810; ending Merchandise
Inventory was $770).
2. Profit margin ratio is 14%.
SOLUTION
OLD MILLS
Income Statement
Year Ended December 31, 2018
15–17
S15-12 Using ratios to reconstruct a balance sheet
Learning Objective 4
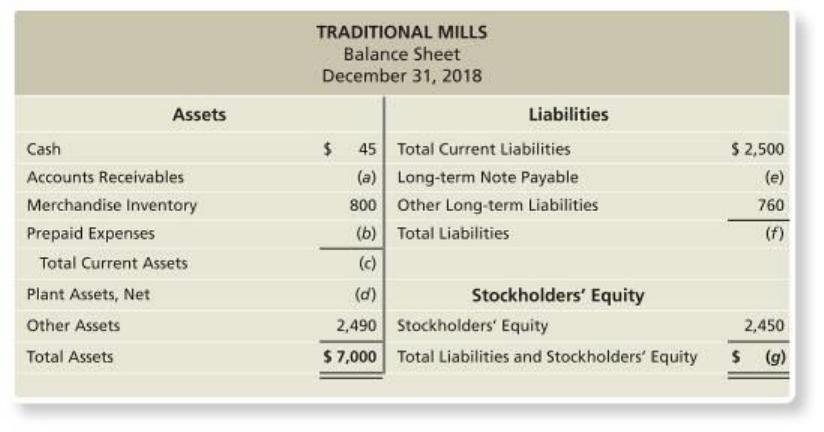
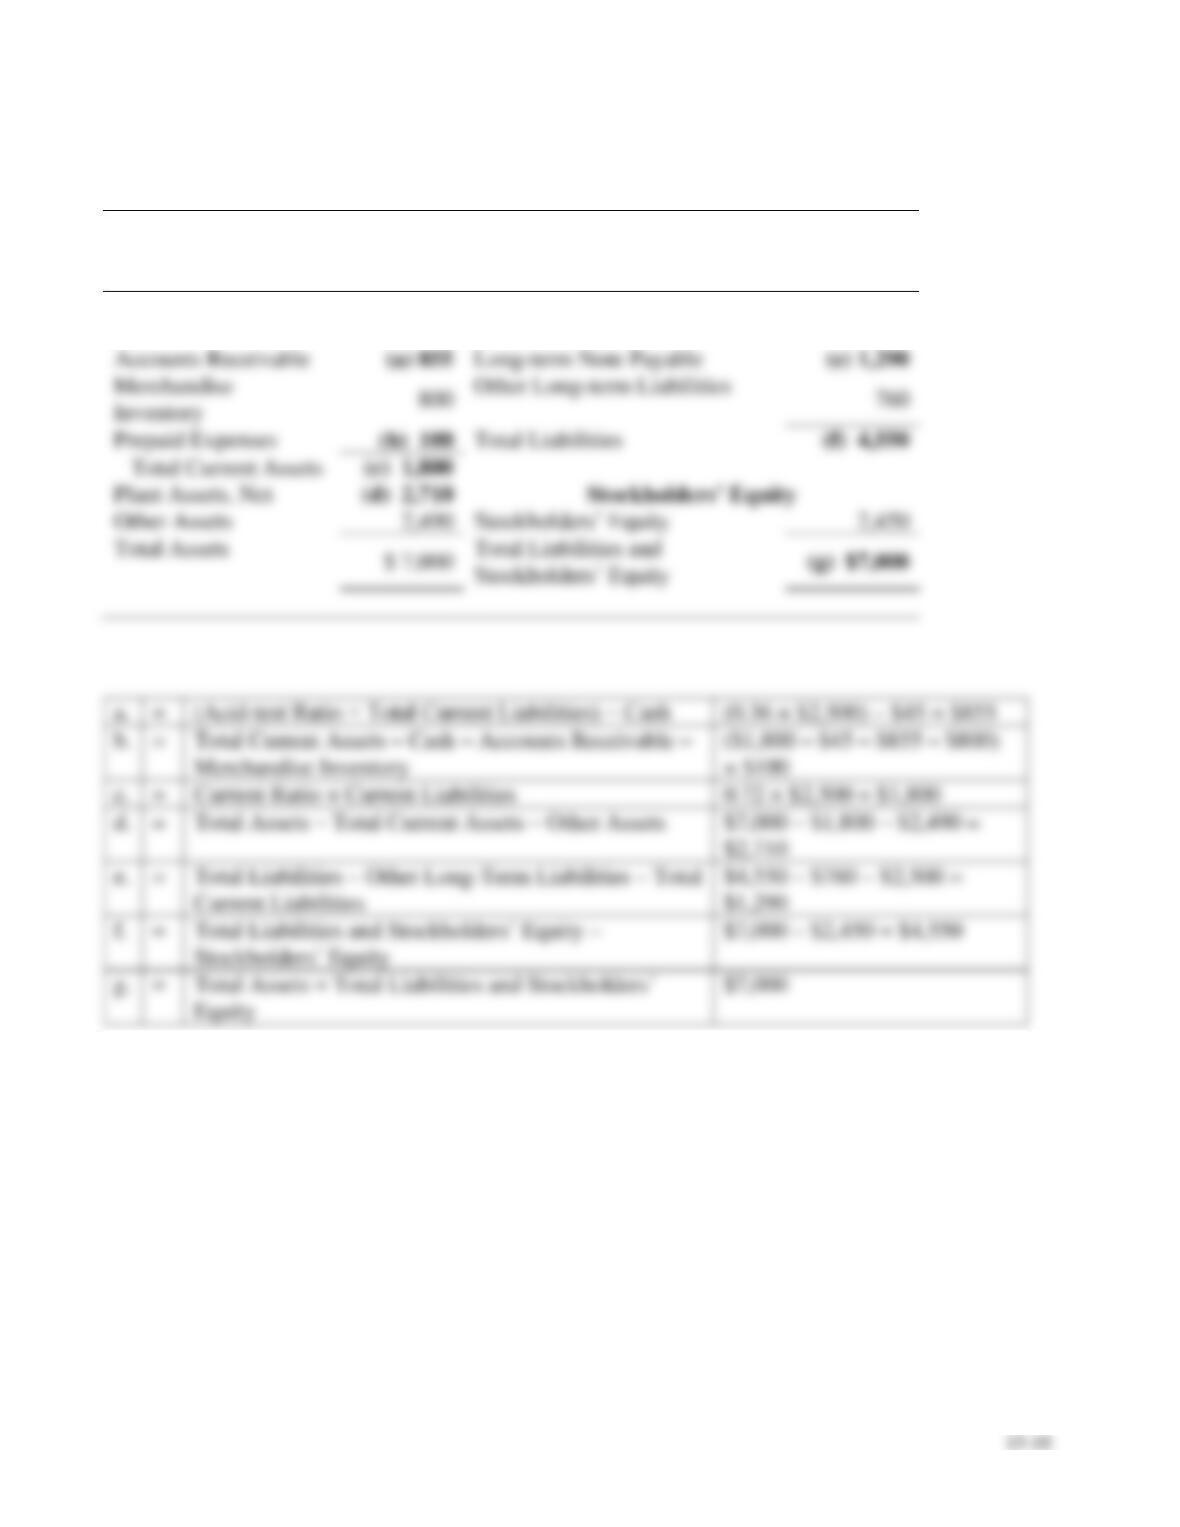
Traditional Mills’s balance sheet appears as follows (amounts in thousands):
Use the following ratio data to complete Traditional Mills’s balance sheet.
1. Current ratio is 0.72.
2. Acid-test ratio is 0.36.
S15-12, cont.
SOLUTION
TRADITIONAL MILLS
Balance Sheet
December 31, 2018
Assets
Liabilities
Cash
$ 45
Total Current Liabilities
$ 2,500
Accounts Receivable
Long-term Note Payable
Inventory
Prepaid Expenses
Total Liabilities
Total Current Assets
Plant Assets, Net
Other Assets
=
(0.36 × $2,500) – $45 = $855
Merchandise Inventory
$2,710
Current Liabilities
$1,290
Equity
15–19
Exercises
E15-13 Performing horizontal analysis—income statement
Learning Objective 2
1. Net Income 34.7%
Data for Mulberry Designs, Inc. follow:
Requirements
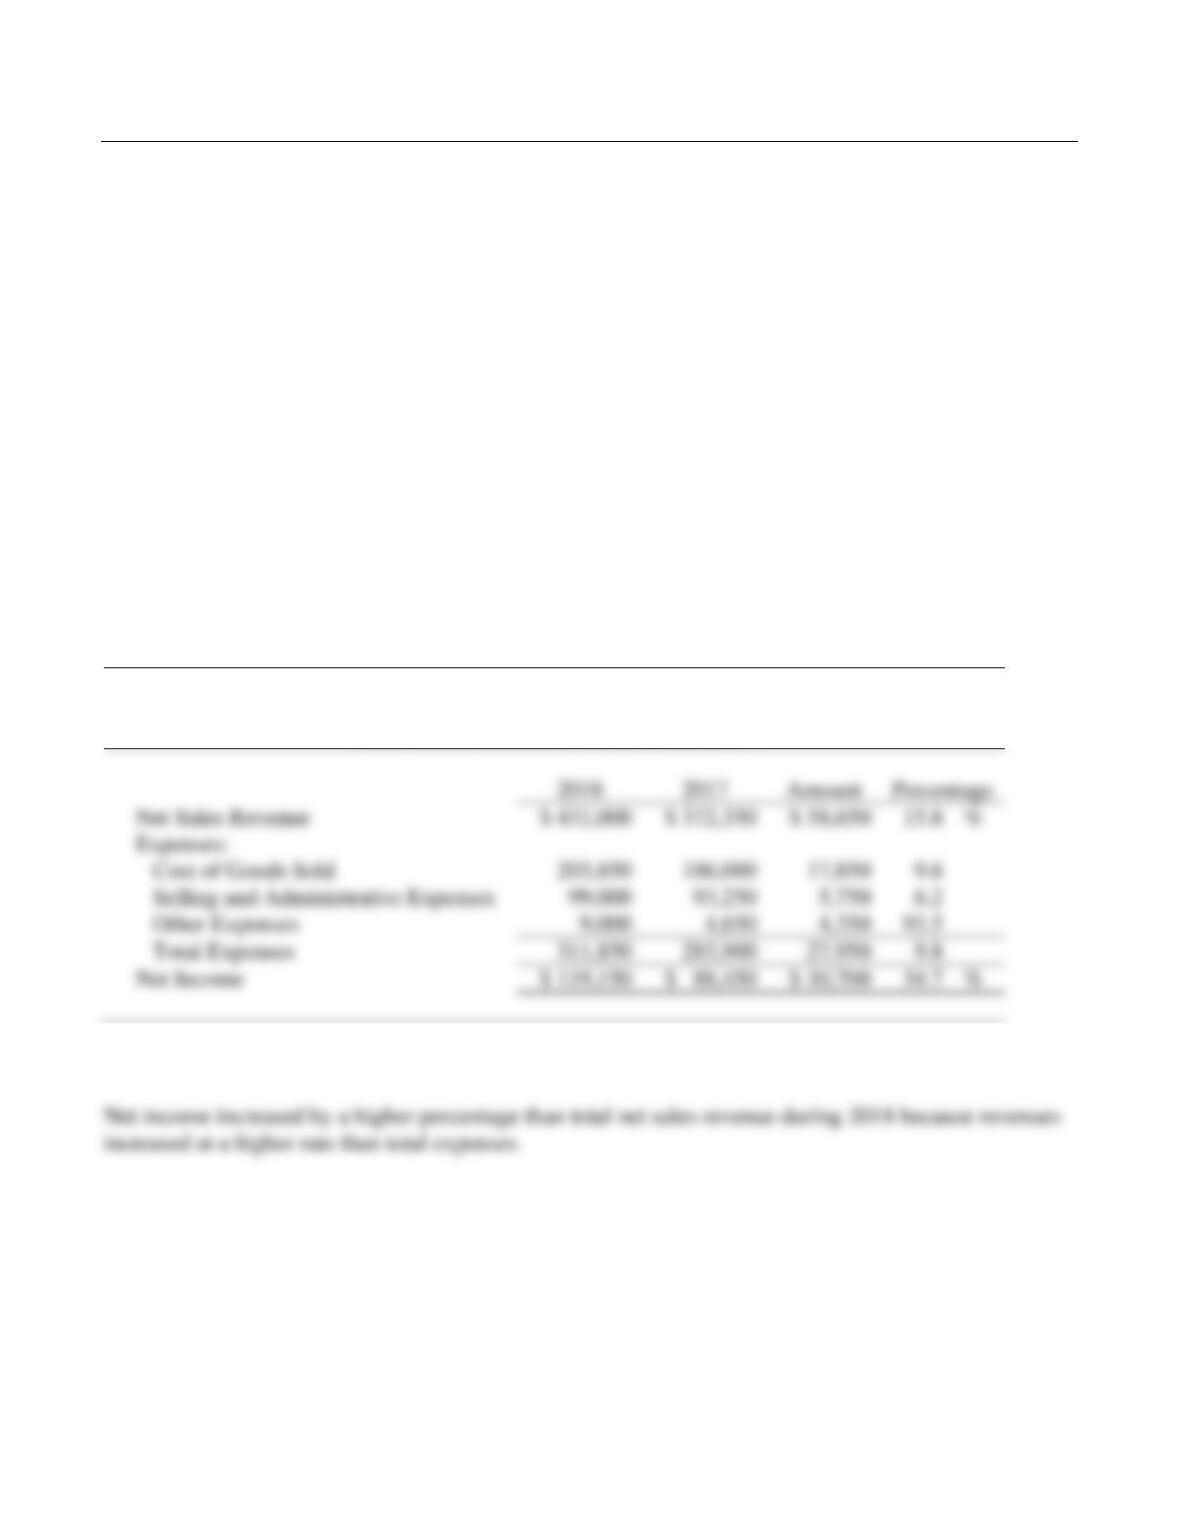
1. Prepare a horizontal analysis of the comparative income statement of Mulberry Designs, Inc. Round
percentage changes to one decimal place.
2. Why did 2018 net income increase by a higher percentage than net sales revenue?
SOLUTION
Requirement 1
MULBERRY DESIGNS, INC.
Comparative Income Statement
Years Ended December 31, 2018 and 2017
Requirement 2
E15-14 Computing trend analysis
Learning Objective 2
1. 2019 Net Income 153%
Grand Oaks Realty’s net revenue and net income for the following five-year period, using 2015 as the
base year, follow:
2019
2018
2017
2016
2015
Net Revenue
$ 1,360,000
$ 1,180,000
$ 1,147,000
$ 1,008,000
$ 1,044,000
Net Income
127,000
120,000
87,000
75,000
83,000
Requirements
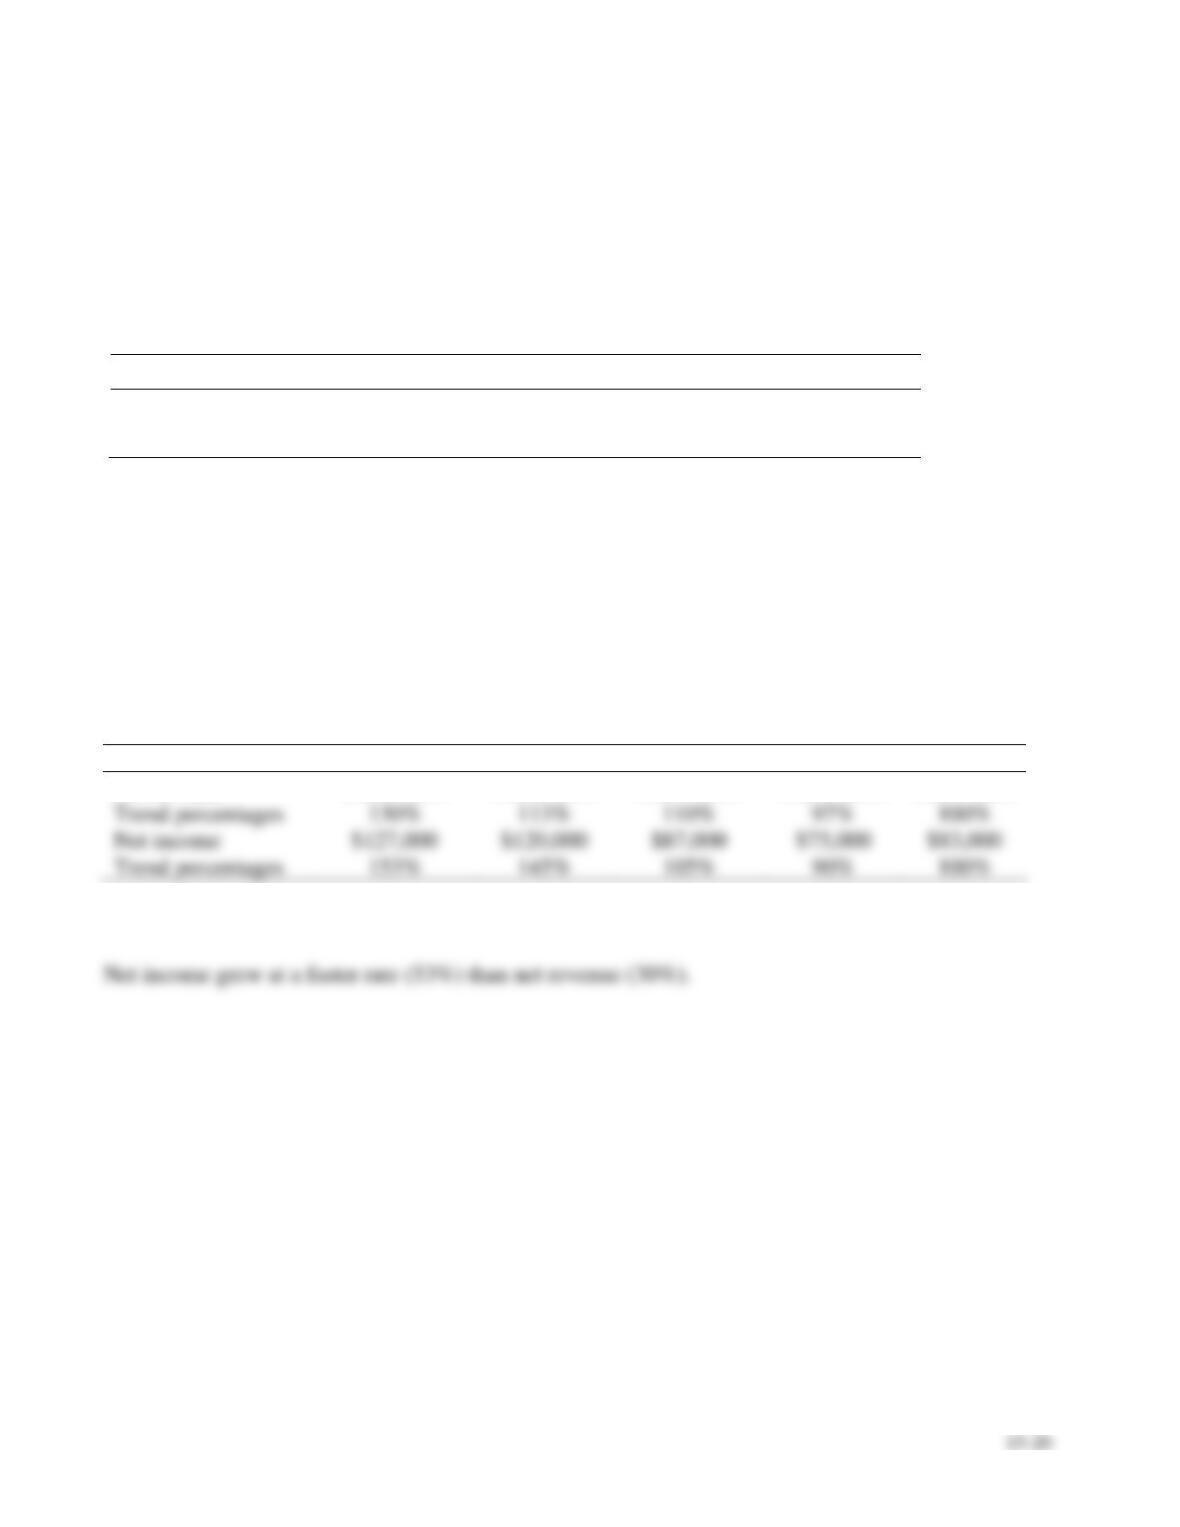
1. Compute a trend analysis for net revenue and net income. Round to the nearest full percent.
2. Which grew faster during the period, net revenue or net income?
SOLUTION
Requirement 1
2019
2018
2017
2016
2015
Net revenue
$1,360,000
$1,180,000
$1,147,000
$1,008,000
$1,044,000
Trend percentages
Net income
$120,000
$83,000
Trend percentages
Requirement 2
15–21
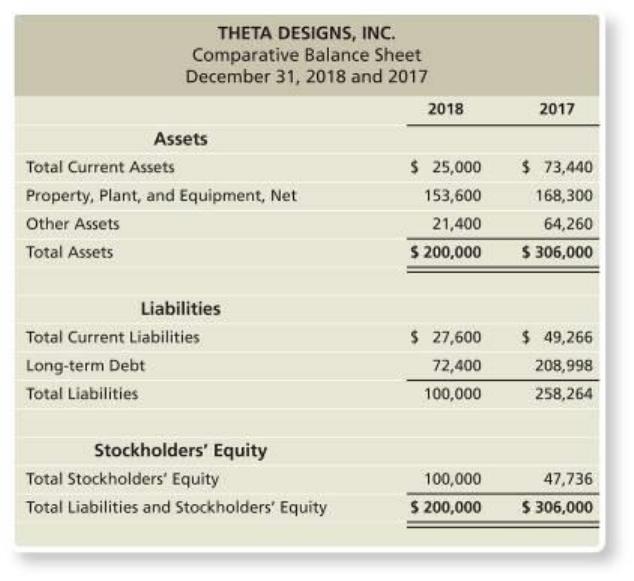
E15-15 Performing vertical analysis of a balance sheet
Learning Objective 3
2018 Current Assets: 12.5%
Theta Designs, Inc. has the following data:
Perform a vertical analysis of Theta Designs’s balance sheet for each year.
E15-15, cont.
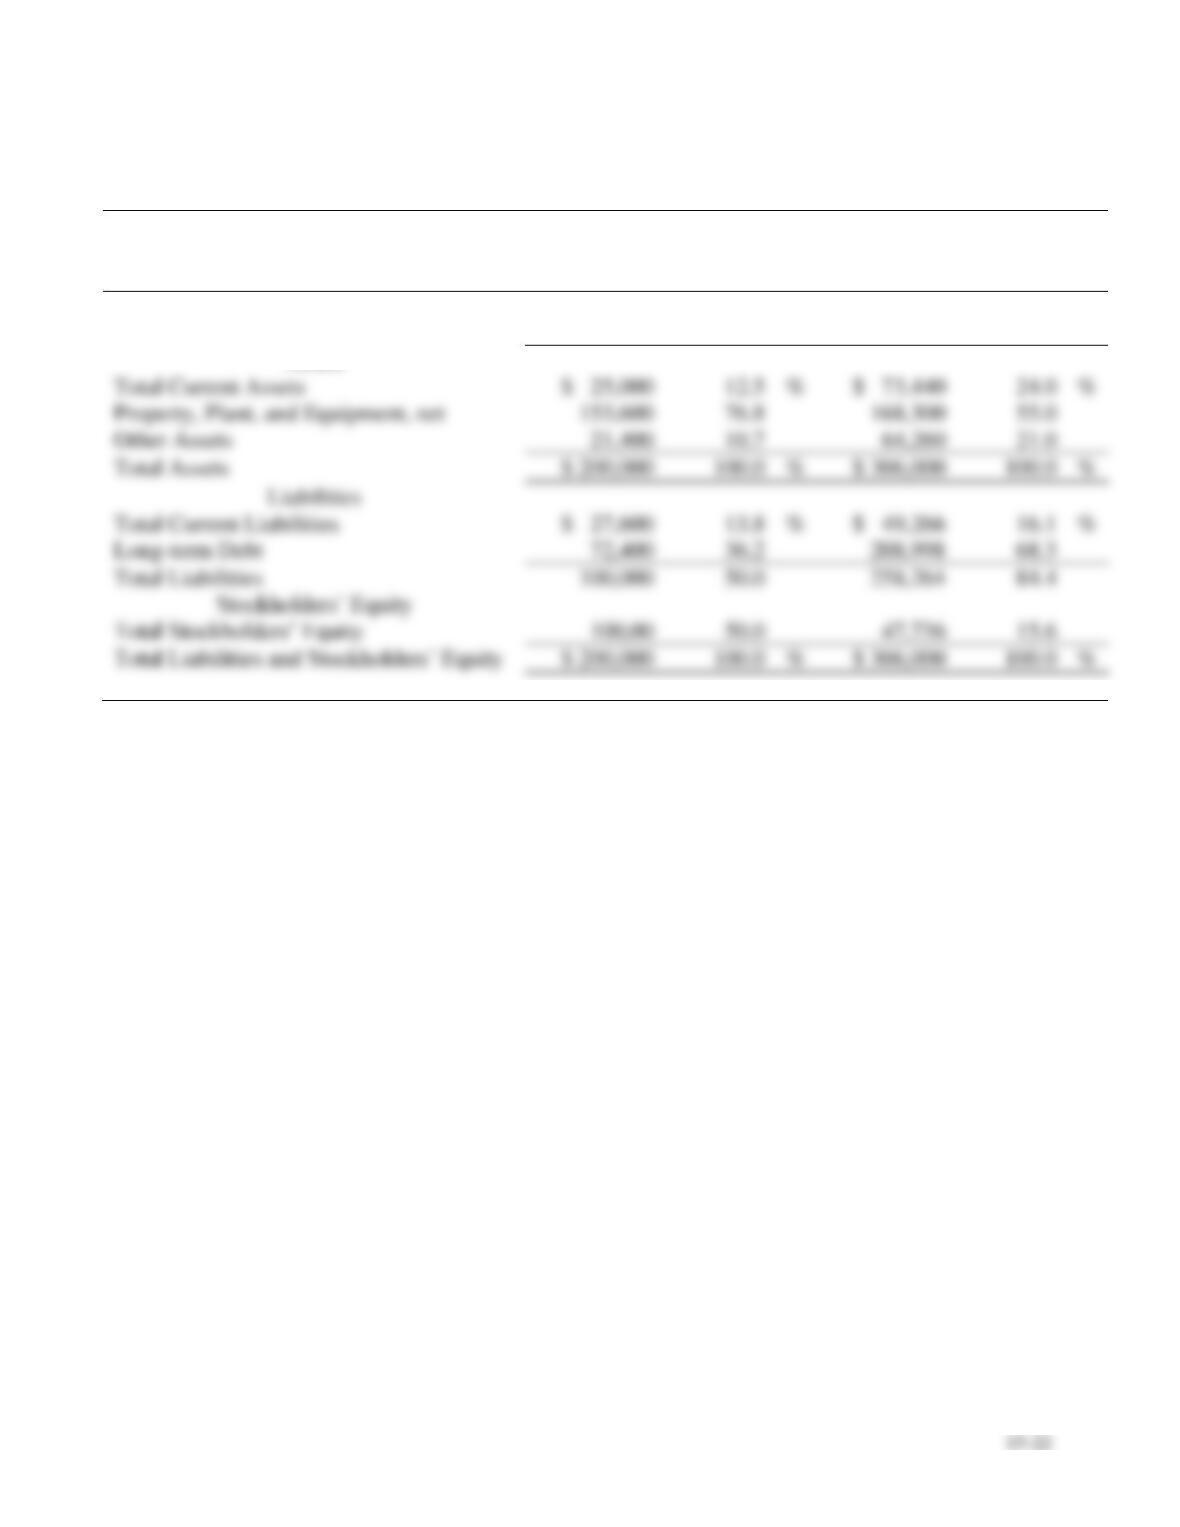
SOLUTION
THETA DESIGNS, INC.
Comparative Balance Sheet
December 31, 2018 and 2017
2018
Percent of
Total
2017
Percent of
Total
Assets
Total Current Assets
%
%
Property, Plant, and Equipment, net
Other Assets
Total Assets
%
%
Total Current Liabilities
%
%
Long-term Debt
Total Liabilities
%
%
15–23
E15-16 Preparing common-size income statements
Learning Objective 3
1. 2018 Net Income 27.6%
Refer to the data presented for Mulberry Designs, Inc. in Exercise E15-13.
Requirements
1. Prepare a comparative common-size income statement for Mulberry Designs, Inc. using the 2018 and
2017 data. Round percentages to one-tenth percent (three decimal places).
2. To an investor, how does 2018 compare with 2017? Explain your reasoning.
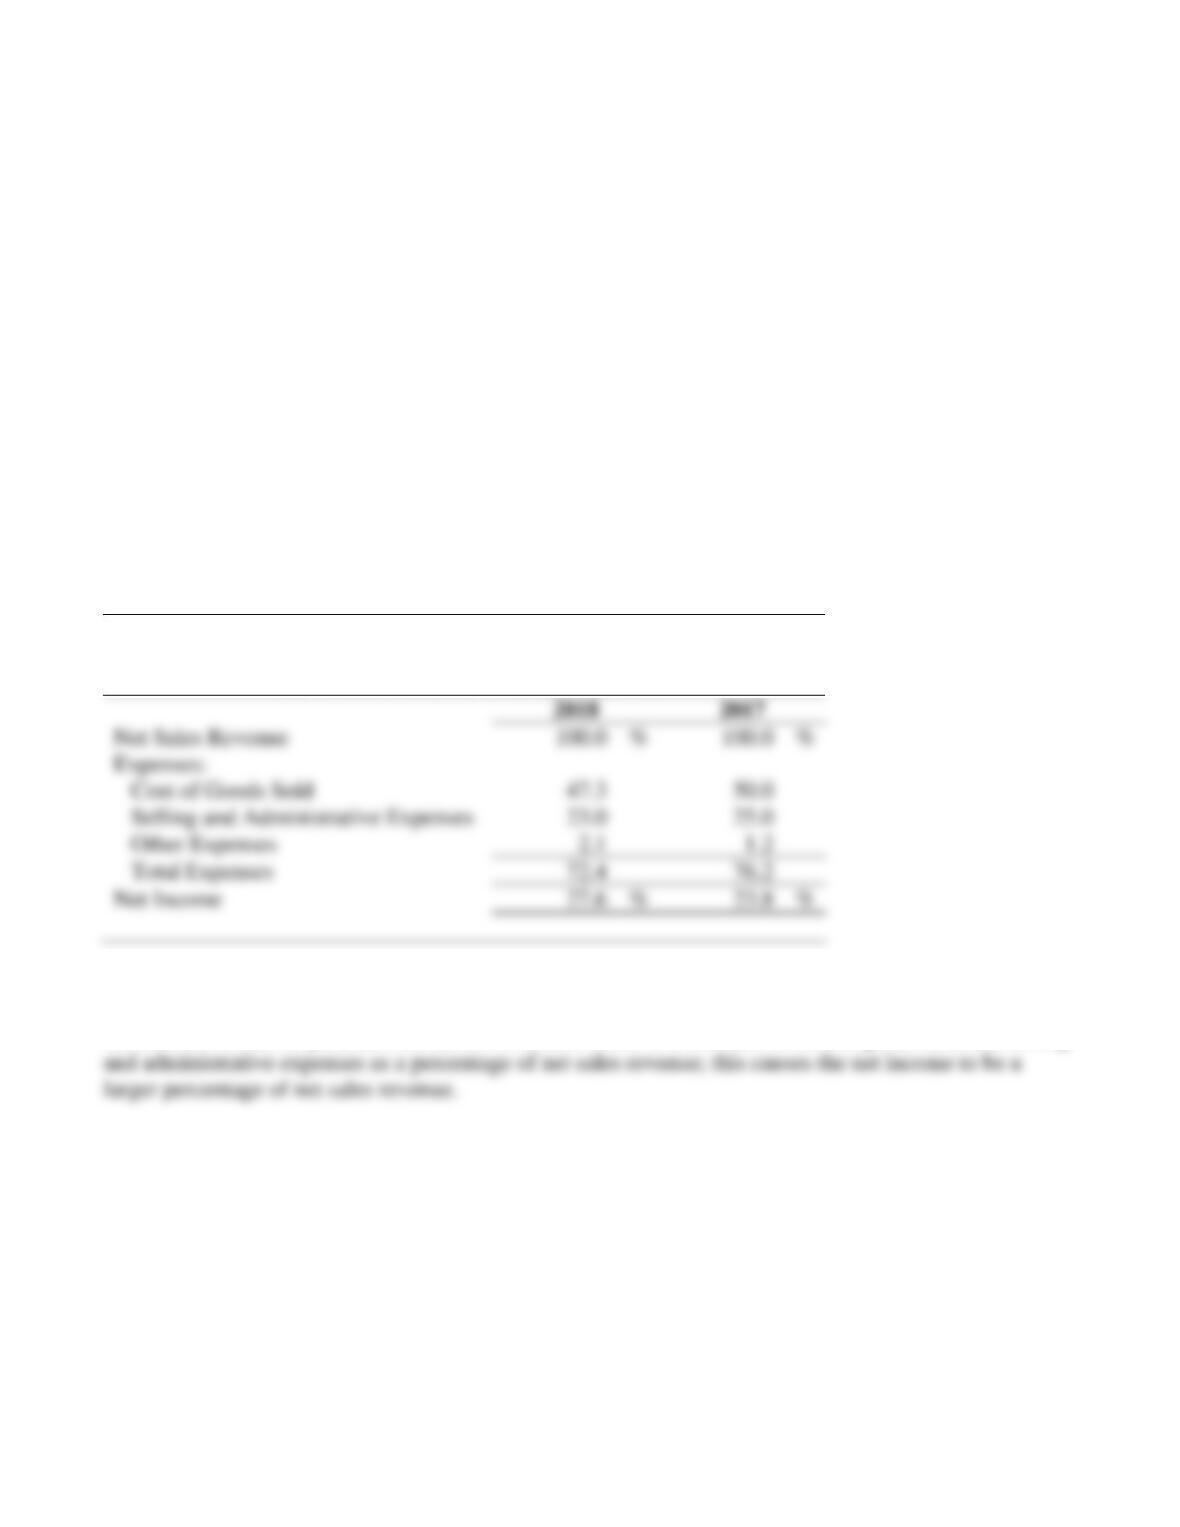
SOLUTION
Requirement 1
MULBERRY DESIGNS, INC.
Comparative Common-Size Income Statement
Years Ended December 31, 2018 and 2017
Requirement 2
An investor would be pleased with the 2018 results. There is a decrease in cost of goods sold and selling
E15-17 Computing working capital changes
Learning Objective 4
2019 Working Capital $255,000
Data for Research Enterprises follows:
2019
2018
2017
Total Current Assets
$ 490,000
$ 320,000
$ 230,000
Total Current Liabilities
235,000
160,000
115,000
Compute the dollar amount of change and the percentage of change in Research Enterprises’s working
capital each year during 2019 and 2018. What do the calculated changes indicate?
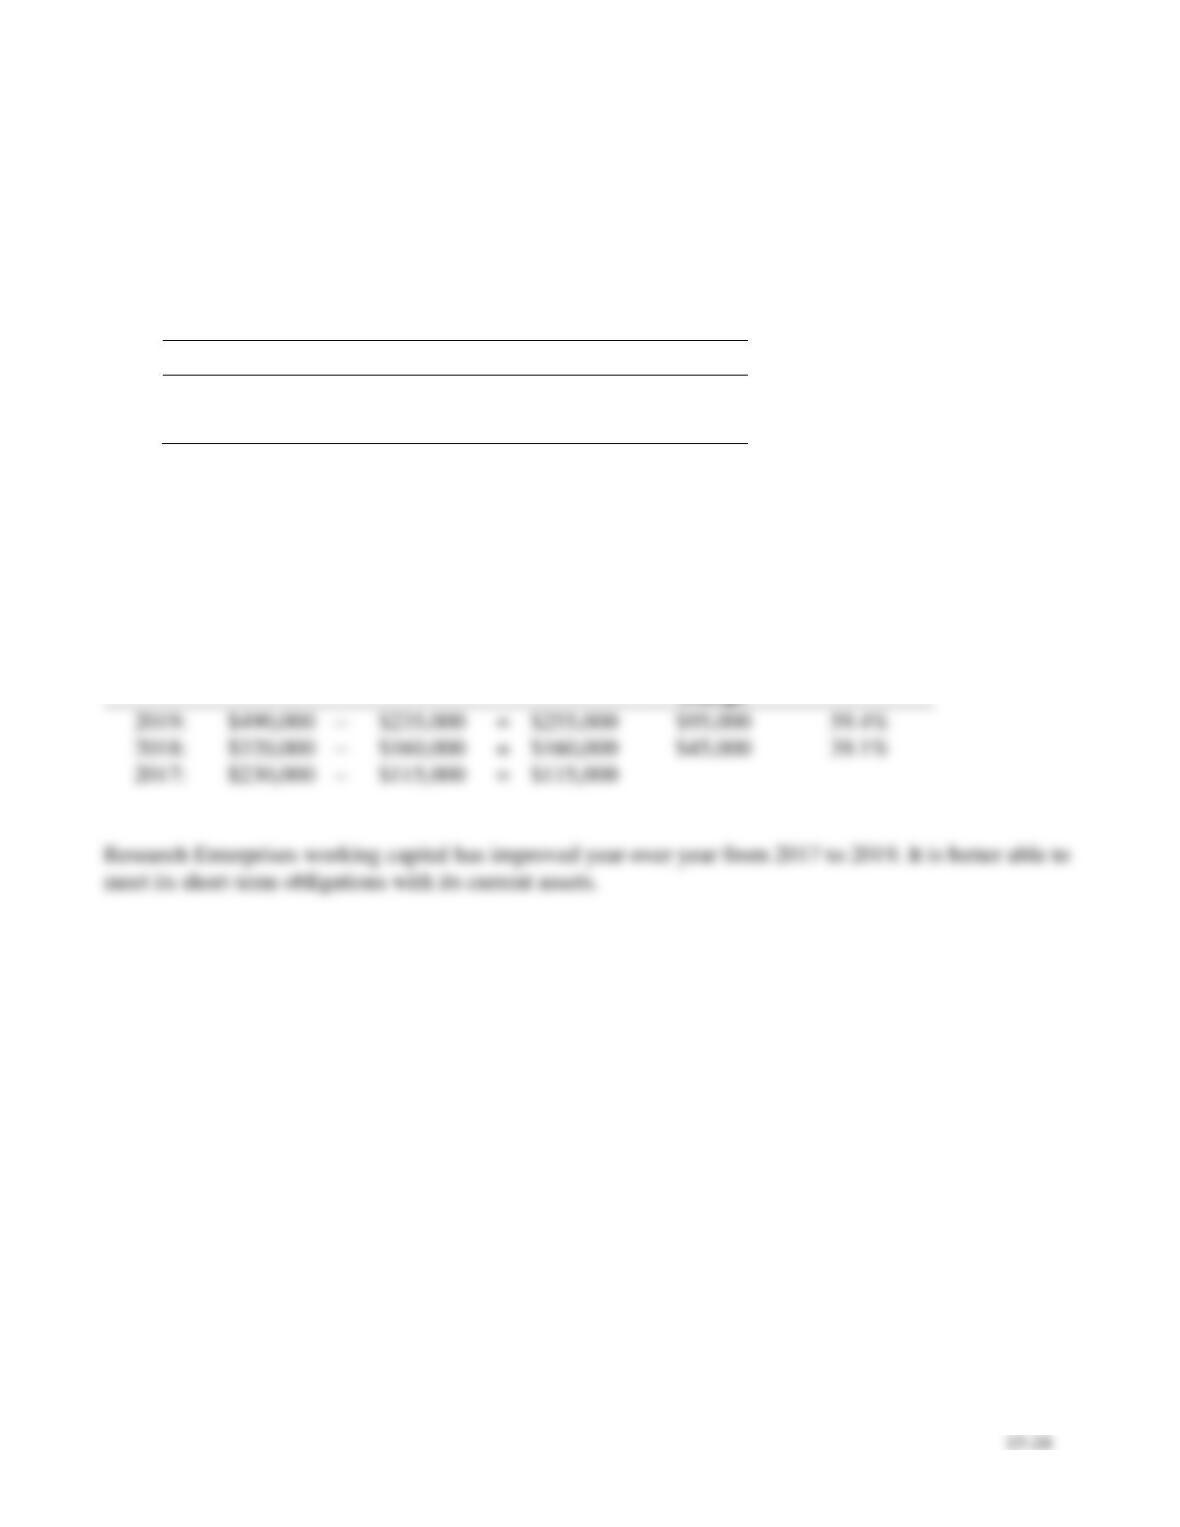
SOLUTION
Current
Assets
–
Current
Liabilities
=
Working
Capital
Dollar
amount of
change
Percentage of
Change

15–25
E15-18 Computing key ratios
Learning Objective 4
e. 89 days
The financial statements of Valerie’s Natural Foods include the following items:
Current Year
Preceding Year
Balance Sheet:
Cash
$ 16,000
$ 26,000
Short-term Investments
19,000
28,000
Net Accounts Receivable
60,000
92,000
Merchandise Inventory
78,000
74,000
Prepaid Expenses
17,000
6,000
Total Current Assets
190,000
226,000
Total Current Liabilities
136,000
82,000
Income Statement:
Net Credit Sales
$ 476,000
Cost of Goods Sold
312,000
Compute the following ratios for the current year:
a. Current ratio
b. Cash ratio
c. Acid-test ratio
d. Inventory turnover
e. Days’ sales in inventory
f. Days’ sales in receivables
g. Gross profit percentage
15–26
E15-18, cont.
SOLUTION
a.
Total current assets
Total current liabilities
$190,000
$136,000
=
1.40
Total current liabilities
$136,000
Total current liabilities
e.
=
$476,000

E15-19 Analyzing the ability to pay liabilities
Learning Objective 4
d. 2018: 61.9%
Big Beautiful Photo Shop has asked you to determine whether the company’s ability to pay current
liabilities and total liabilities improved or deteriorated during 2018. To answer this question, you gather
the following data:
2018
2017
Cash
$ 58,000
$ 47,000
Short-term Investments
34,000
0
Net Accounts Receivable
140,000
124,000
Merchandise Inventory
217,000
272,000
Total Assets
530,000
565,000
Total Current Liabilities
288,000
205,000
Long-term Notes Payable
40,000
50,000
Income from Operations
165,000
158,000
Interest Expense
55,000
41,000
Compute the following ratios for 2018 and 2017, and evaluate the company’s ability to pay its current
liabilities and total liabilities:
a. Current ratio
b. Cash ratio
c. Acid-test ratio
d. Debt ratio
e. Debt to equity ratio
15–28
E15-19, cont.
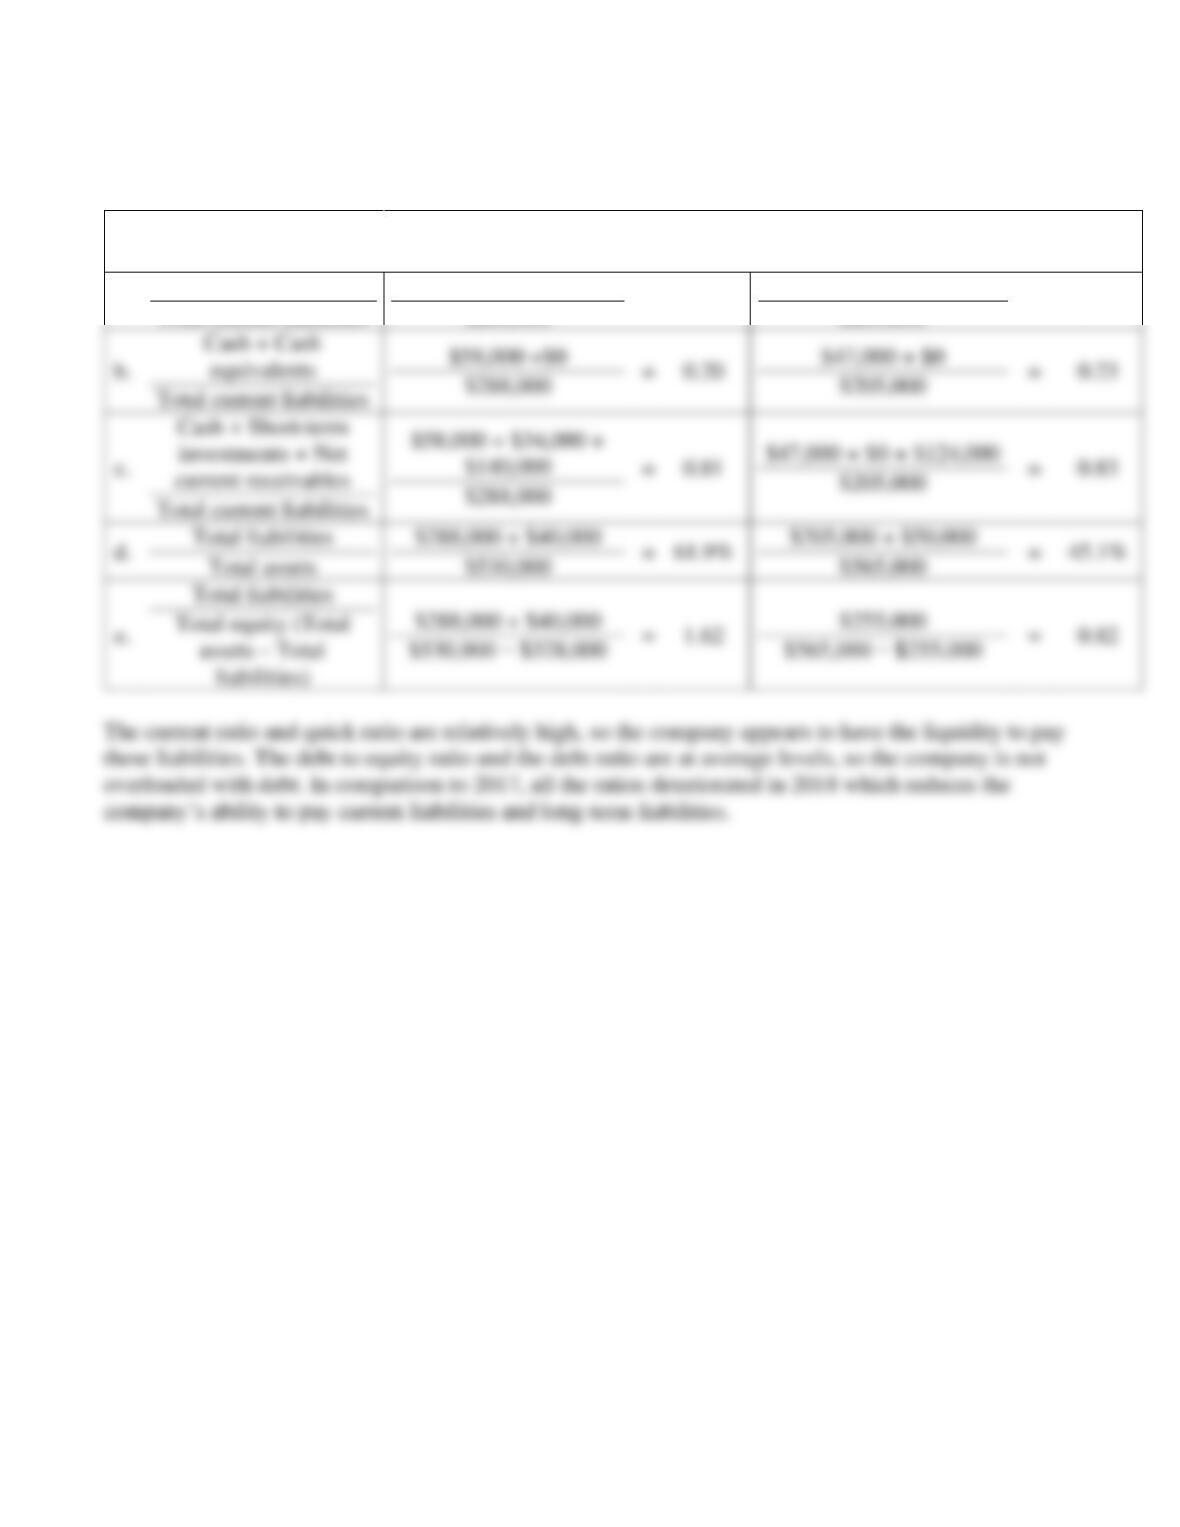
SOLUTION
2018
2017
a.
Total current assets
Total current liabilities
$449,000
$288,000
=
1.56
$443,000
$205,000
=
2.16
Total current liabilities
Total current liabilities
d.
$530,000
=
$565,000
=
15–29
E15-20 Analyzing profitability
Learning Objective 4
1. 2019: 13.0%
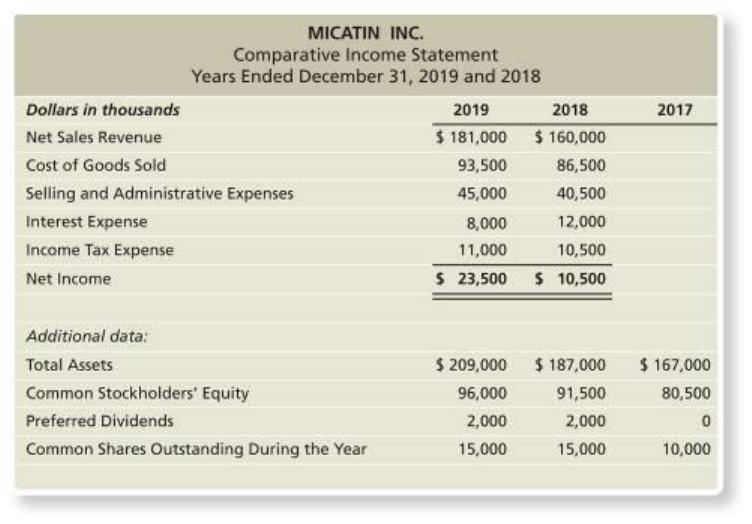
Micatin, Inc.’s comparative income statement follows. The 2017 data are given as needed.
Requirements
1. Calculate the profit margin ratio for 2019 and 2018.
2. Calculate the rate of return on total assets for 2019 and 2018.
3. Calculate the asset turnover ratio for 2019 and 2018.
4. Calculate the rate of return on common stockholders’ equity for 2019 and 2018.
5. Calculate the earnings per share for 2019 and 2018.
6. Calculate the 2019 dividend payout on common stock. Assume dividends per share for common
stock are equal to $1.13 per share.
7. Did the company’s operating performance improve or deteriorate during 2019?
=
0.130 = 13.0%
=
0.066 = 6.6%
E15-20, cont.
SOLUTION
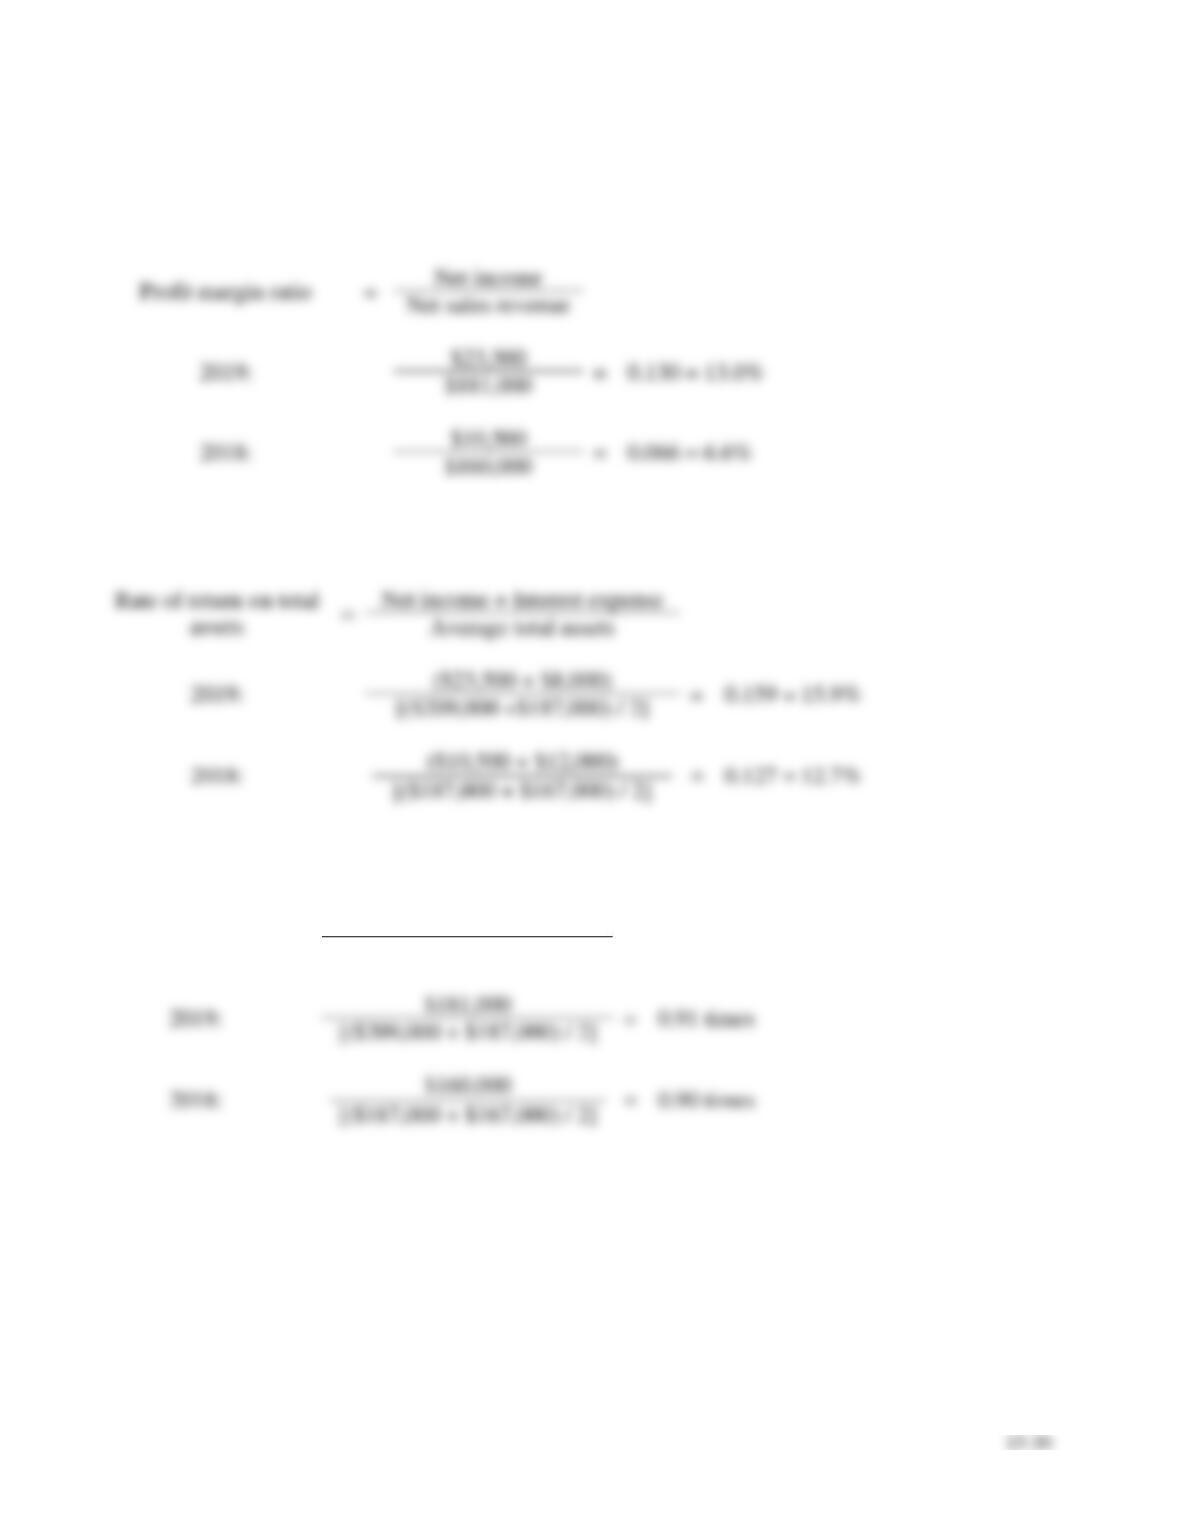
Requirement 1
=
Net income + Interest expense
Average total assets
Requirement 2
Requirement 3
Asset turnover
ratio
=
Net sales revenue
Average total assets
=
0.91 times
E15-20, cont.
Requirement 4
Rate of return on common
stockholders’ equity
=
Net income – Preferred dividends
Average common stockholders’ equity
=
0.229 = 22.9%
Weighted average number of common shares outstanding
=
$0.68 / share
Requirement 5
Requirement 6
Requirement 7
The company’s performance improved during 2019 based on an improvement in all ratios evaluated.
15–32
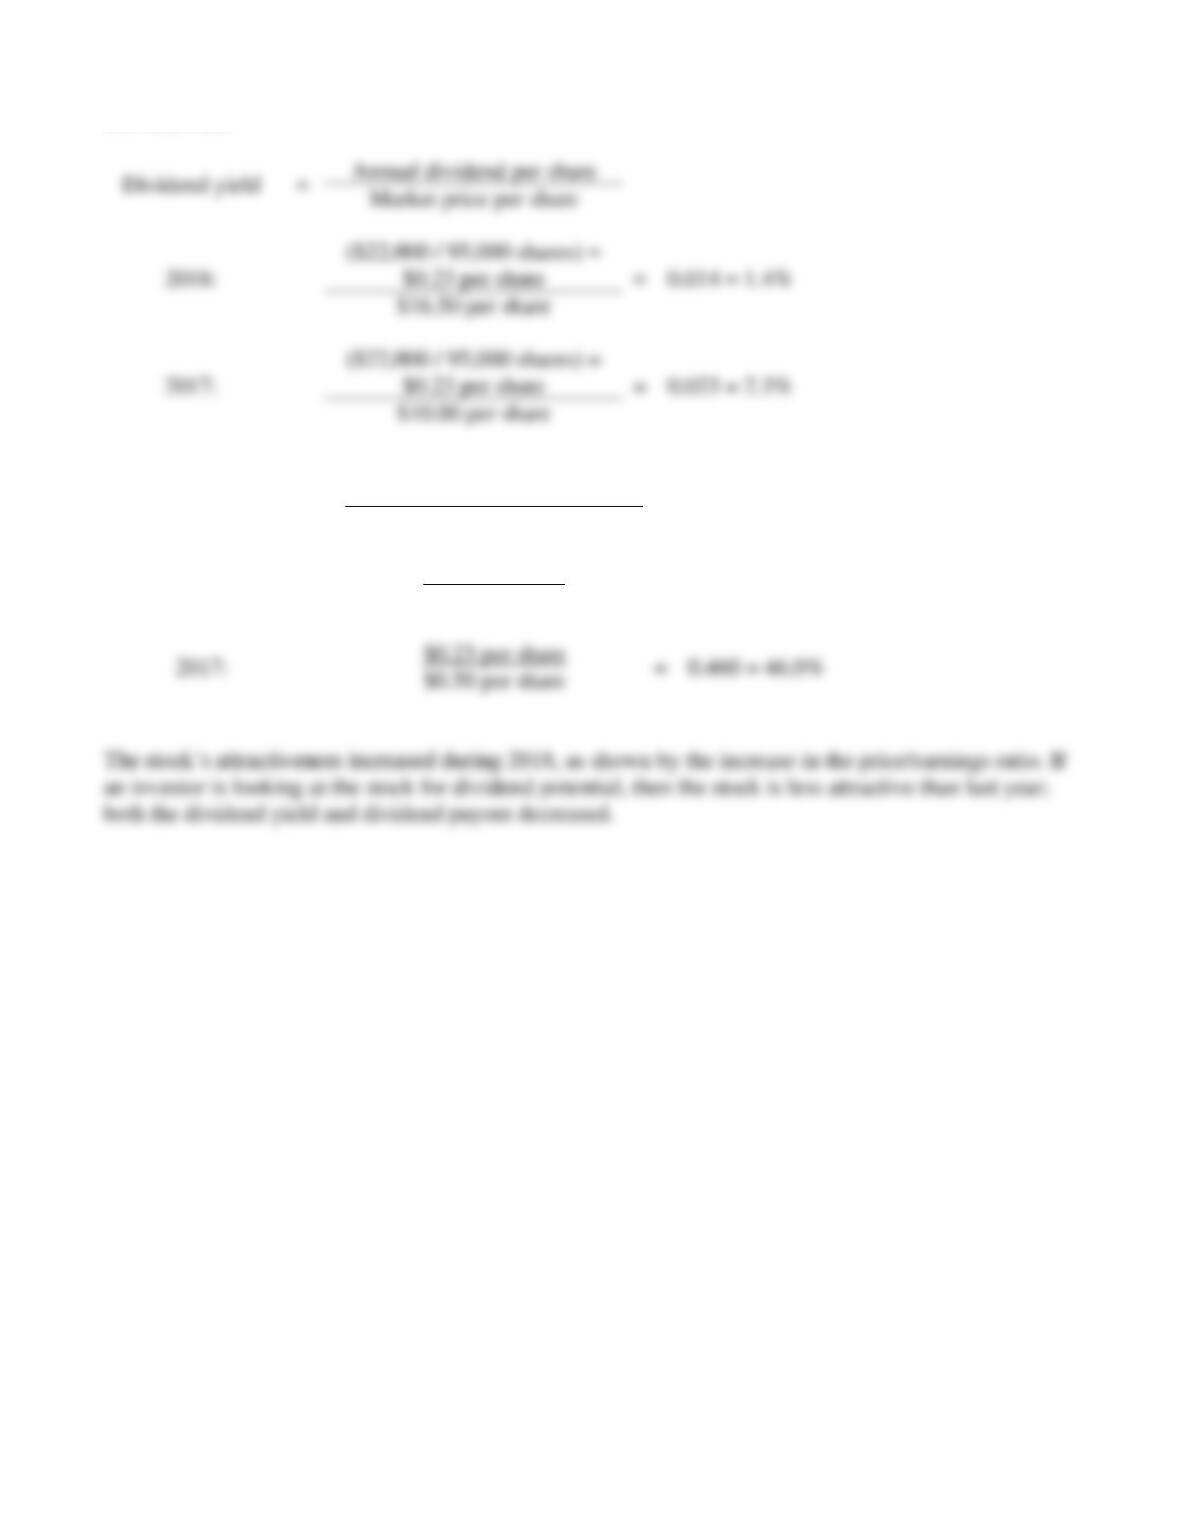
E15-21 Evaluating a stock as an investment
Learning Objective 4
Dividend Yield 2018: 1.4%
Data for Oxford State Bank follow:
2018
2017
Net Income
$ 71,900
$ 64,300
Dividends—Common
22,000
22,000
Dividends—Preferred
16,800
16,800
Total Stockholders’ Equity at Year-End (includes 95,000 shares of
common stock)
770,000
610,000
Preferred Stock
200,000
200,000
Market Price per Share of Common Stock
$ 16.50
$ 10.00
Evaluate the common stock of Oxford State Bank as an investment. Specifically, use the three stock
ratios to determine whether the common stock has increased or decreased in attractiveness during the
past year. Round to two decimal places.
SOLUTION
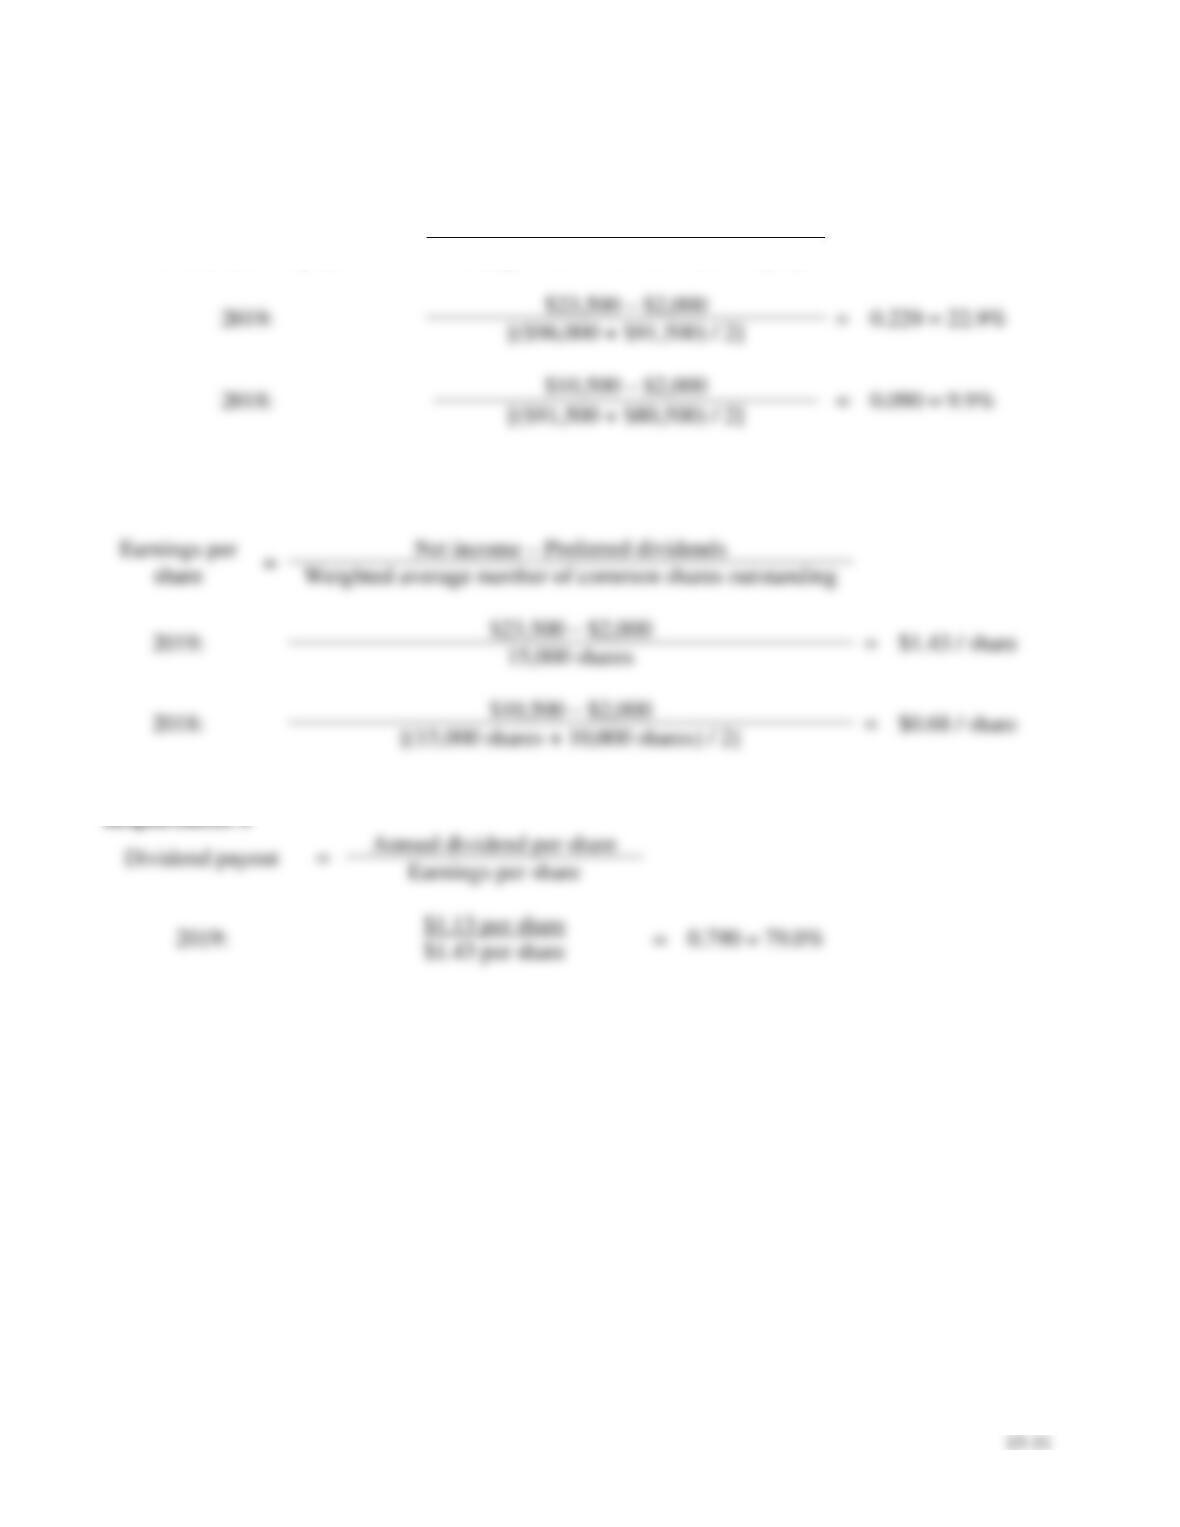
Earnings per
share
=
Net income – Preferred dividends
Weighted average number of common shares outstanding
=
$0.58 / share
=
$0.50 / share
15–33
E15-21, cont.
Dividend payout
=
Annual dividend per share
Earnings per share
2018:
$0.23 per share
=
0.400 = 40.0%
$0.58 per share
2017:
$0.23 per share
=
0.460 = 46.0%
$0.50 per share
Annual dividend per share
$0.23 per share
$0.23 per share
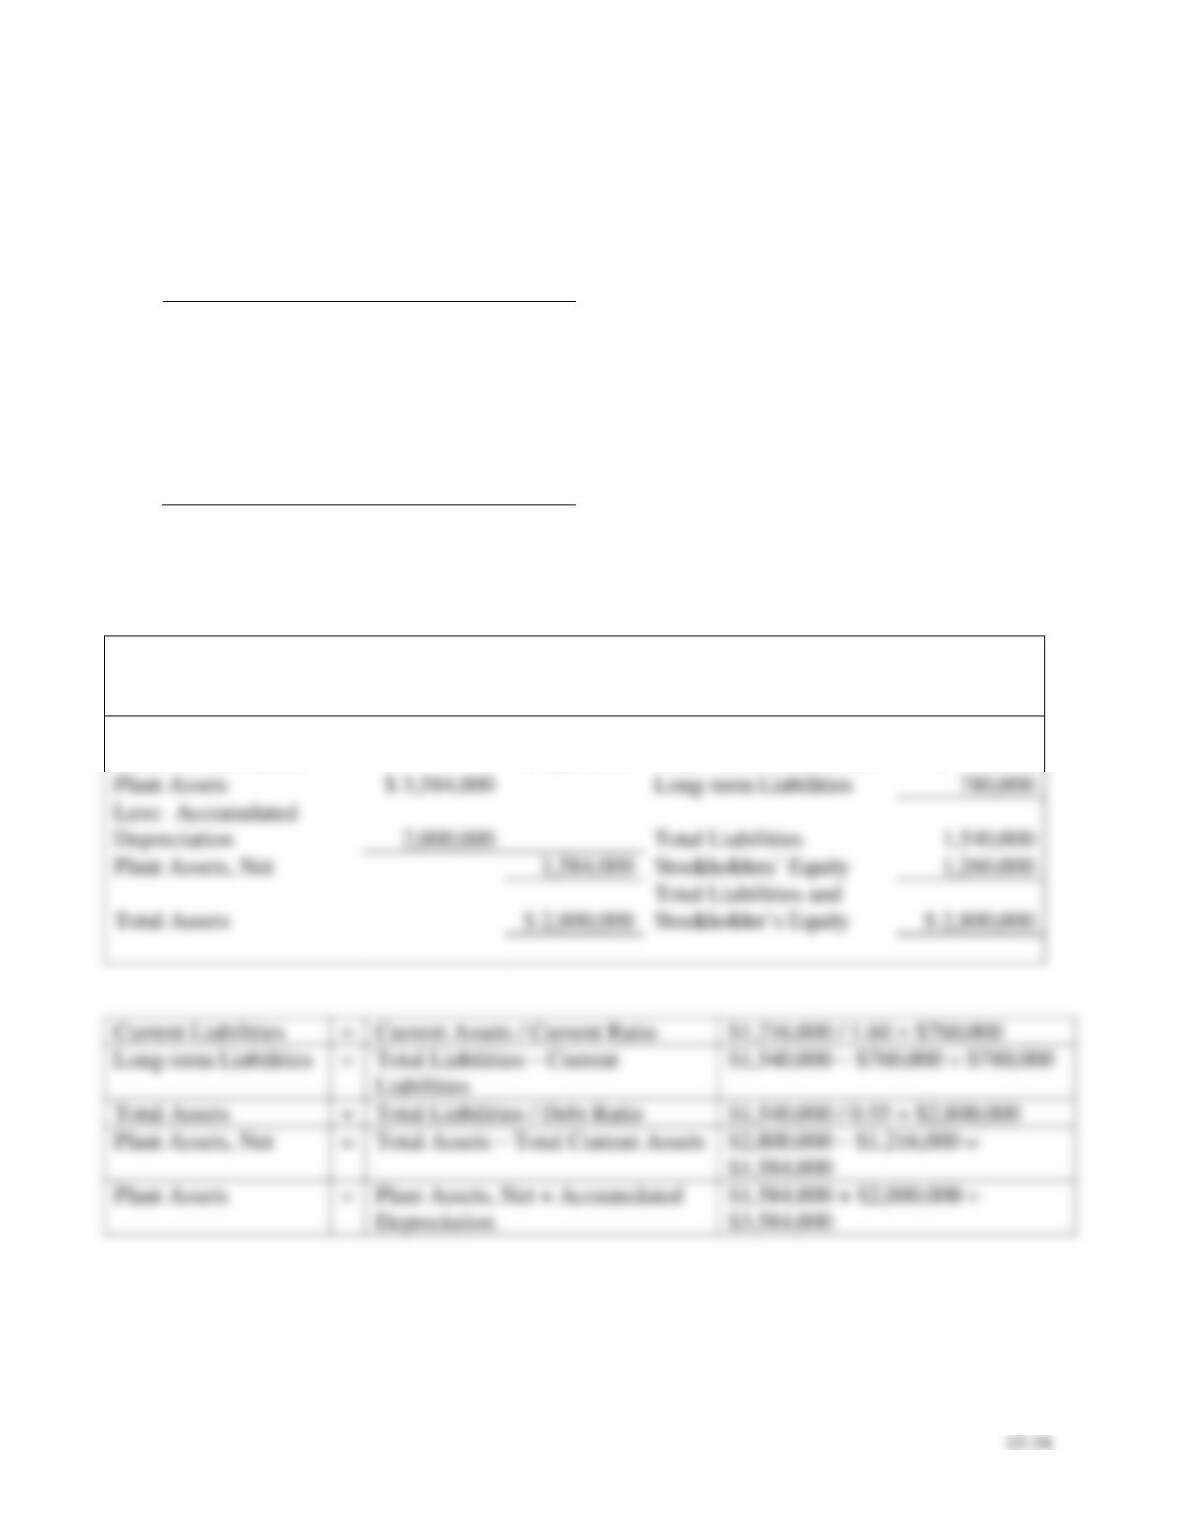
E15-22 Using ratios to reconstruct a balance sheet
Learning Objective 4
Total Assets $2,800,000
The following data are adapted from the financial statements of Bridget’s Shops, Inc.:
Total Current Assets
$ 1,216,000
Accumulated Depreciation
2,000,000
Total Liabilities
1,540,000
Preferred Stock
0
Debt Ratio
55%
Current Ratio
1.60
Prepare Bridget’s condensed balance sheet as of December 31, 2018.
SOLUTION
BRIDGET’S SHOPS INC.
Balance Sheet
December 31, 2018
Assets
Liabilities
Total Current Assets
$ 1,216,000
Total Current Liabilities
$ 760,000
Plant Assets
Long-term Liabilities
Depreciation
2,000,000
Total Liabilities
Plant Assets, Net
Total Assets
$ 2,800,000
Current Liabilities
=
Current Assets / Current Ratio
$1,216,000 / 1.60 = $760,000
Liabilities
Total Assets
=
Total Liabilities / Debt Ratio
$1,540,000 / 0.55 = $2,800,000
$1,584,000
Depreciation
$3,584,000
15–35
Problems (Group A)
P15-23A Computing trend analysis and return on common equity
Learning Objectives 2, 4
2. 2019: 16.7%
Net sales revenue, net income, and common stockholders’ equity for Eyesight Mission Corporation, a
manufacturer of contact lenses, follow for a four-year period.
2019
2018
2017
2016
Net Sales Revenue
$ 766,000
$ 708,00
$ 644,000
$ 664,000
Net Income
60,000
38,000
36,000
44,000
Ending Common Stockholders’ Equity
368,000
352,000
326,000
296,000
Requirements
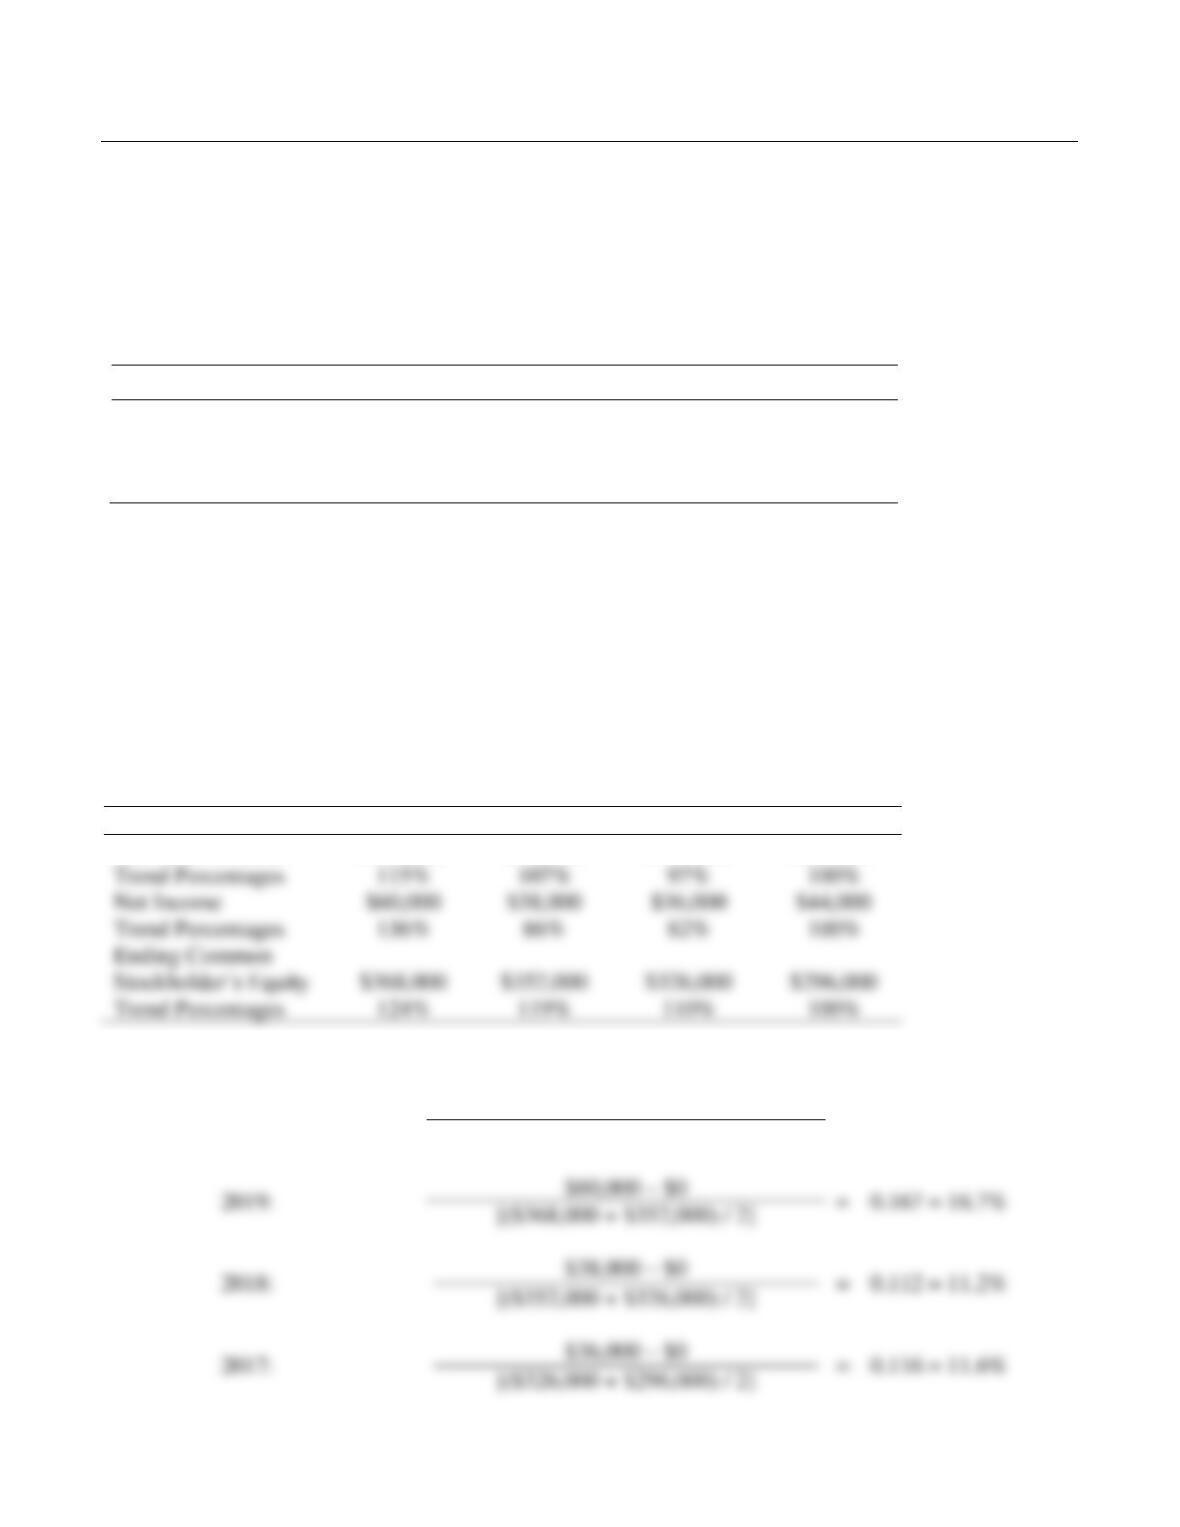
1. Compute trend analyses for each item for 2017–2019. Use 2016 as the base year, and round to the
nearest whole percent.
2. Compute the rate of return on common stockholders’ equity for 2017–2019, rounding to three
decimal places.
SOLUTION
Requirement 1
2019
2018
2017
2016
Net Sales Revenue
$766,000
$708,000
$644,000
$664,000
Requirement 2
Rate of return on common
stockholders’ equity
=
Net income – Preferred dividends
Average common stockholders’ equity
Trend Percentages
115%
Net Income
Trend Percentages
136%
$368,000
$352,000
$326,000
$296,000
Trend Percentages
124%
110%
15–36
Note: Problem P15-24A must be completed before attempting Problem P15-25A.
P15-24A Performing vertical analysis
Learning Objective 3
1. Net Income 11.3%
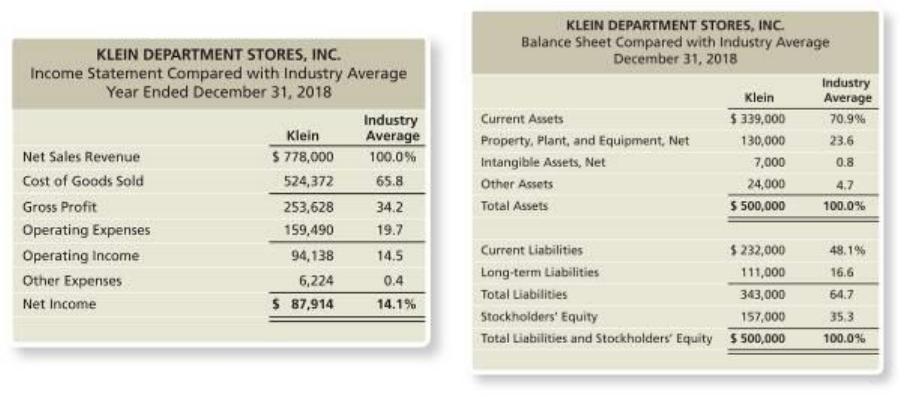
The Klein Department Stores, Inc. chief executive officer (CEO) has asked you to compare the
company’s profit performance and financial position with the averages for the industry. The CEO has
given you the company’s income statement and balance sheet as well as the industry average data for
retailers.
Requirements
1. Prepare a vertical analysis for Klein for both its income statement and balance sheet.
2. Compare the company’s profit performance and financial position with the average for the industry.
P15-24A, cont.
SOLUTION
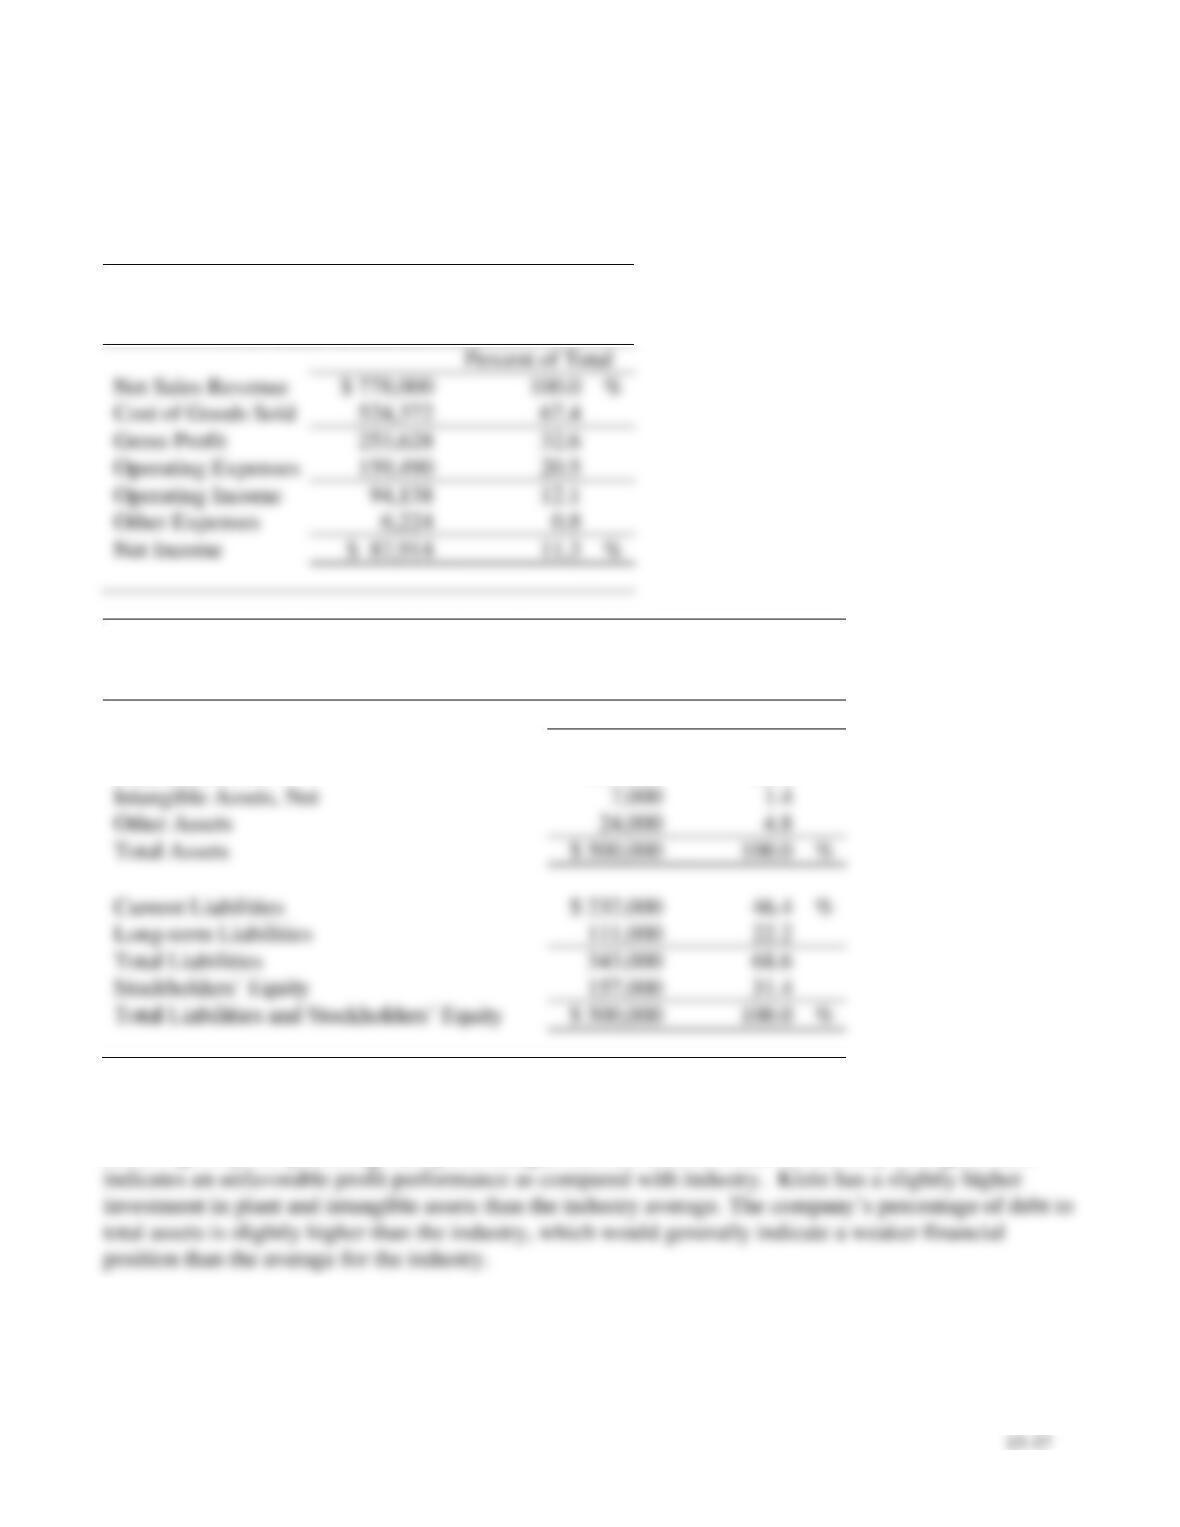
Requirement 1
KLEIN DEPARTMENT STORES, INC.
Income Statement
Year Ended December 31, 2018
Net Sales Revenue
%
Cost of Goods Sold
Gross Profit
Operating Expenses
Operating Income
Other Expenses
Net Income
%
KLEIN DEPARTMENT STORES, INC.
Balance Sheet
December 31, 2018
Percent of Total
Current Assets
$ 339,000
67.8
%
Plant Assets, Net
130,000
26.0
Other Assets
Total Assets
$ 500,000
%
Current Liabilities
$ 232,000
46.4
%
Long-term Liabilities
111,000
22.2
Total Liabilities
343,000
68.6
157,000
31.4
$ 500,000
%
Requirement 2
Klein’s gross profit percentage and profit margin ratio are both less than the industry average, which
15–38
P15-25A Preparing common-size statements, analysis of profitability and financial position,
comparison with the industry, and using ratios to evaluate a company
Learning Objectives 3, 4
2. Gross Profit Percentage 32.6%
Consider the data for Klein Department Stores presented in Problem P15-24A.
Requirements
1. Prepare a common-size income statement and balance sheet for Klein. The first column of each
statement should present Klein’s common-size statement, and the second column, the industry
averages.
2. For the profitability analysis, compute Klein’s (a) gross profit percentage and (b) profit margin ratio.
Compare these figures with the industry averages. Is Klein’s profit performance better or worse than
the industry average?
3. For the analysis of financial position, compute Klein’s (a) current ratio and (b) debt to equity ratio.
Compare these ratios with the industry averages. Assume the current ratio industry average is 1.47,
and the debt to equity industry average is 1.83. Is Klein’s financial position better or worse than the
industry averages?
SOLUTION
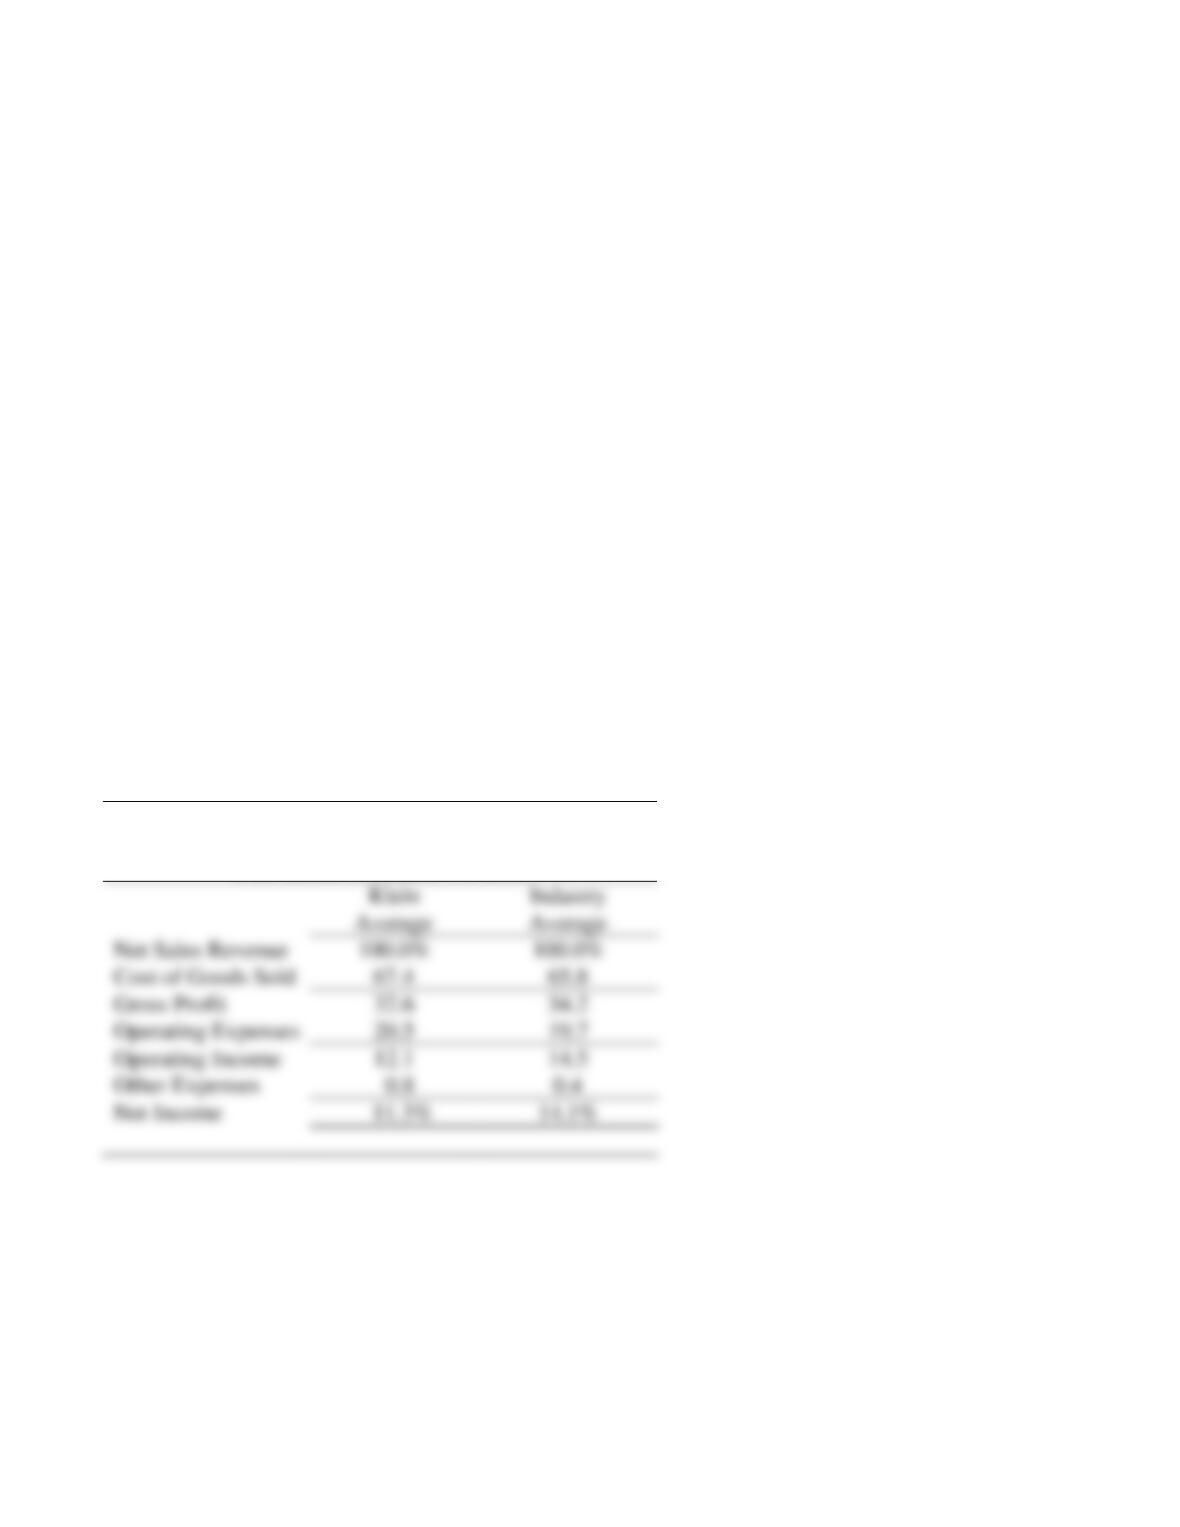
Requirement 1
KLEIN DEPARTMENT STORES, INC.
Common-Size Income Statement
Year Ended December 31, 2018
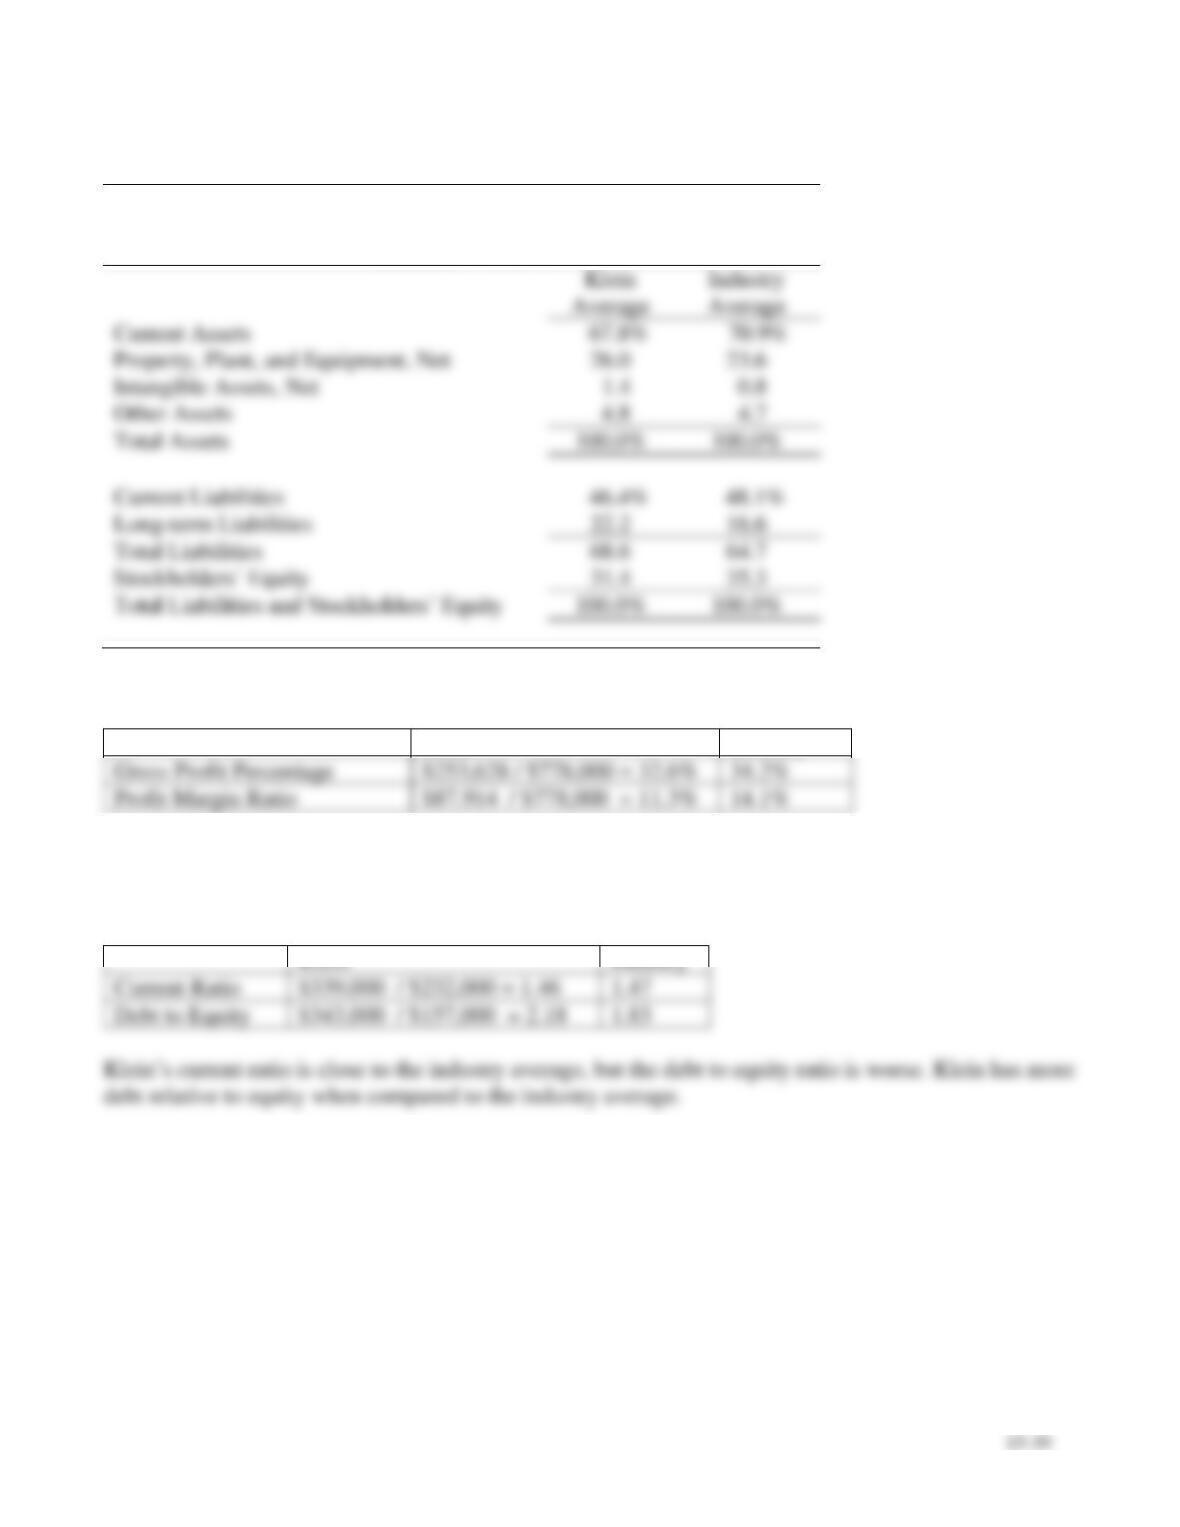
P15-25A, cont.
Requirement 1, cont.
KLEIN DEPARTMENT STORES, INC.
Common-Size Balance Sheet
December 31, 2018
Current Assets
Property, Plant, and Equipment, Net
Intangible Assets, Net
Other Assets
Total Assets
Current Liabilities
Long-term Liabilities
Total Liabilities
Requirement 2
Klein
Industry
Gross Profit Percentage
$253,628 / $778,000 = 32.6%
34.2%
Klein’s gross profit percentage and profit margin ratio are both less than the industry average.
Requirement 3
Klein
Industry
Current Ratio
$339,000 / $232,000 = 1.46
1.47
Debt to Equity
$343,000 / $157,000 = 2.18
1.83

P15-26A Determining the effects of business transactions on selected ratios
Learning Objective 4
1. Current Ratio 1.55
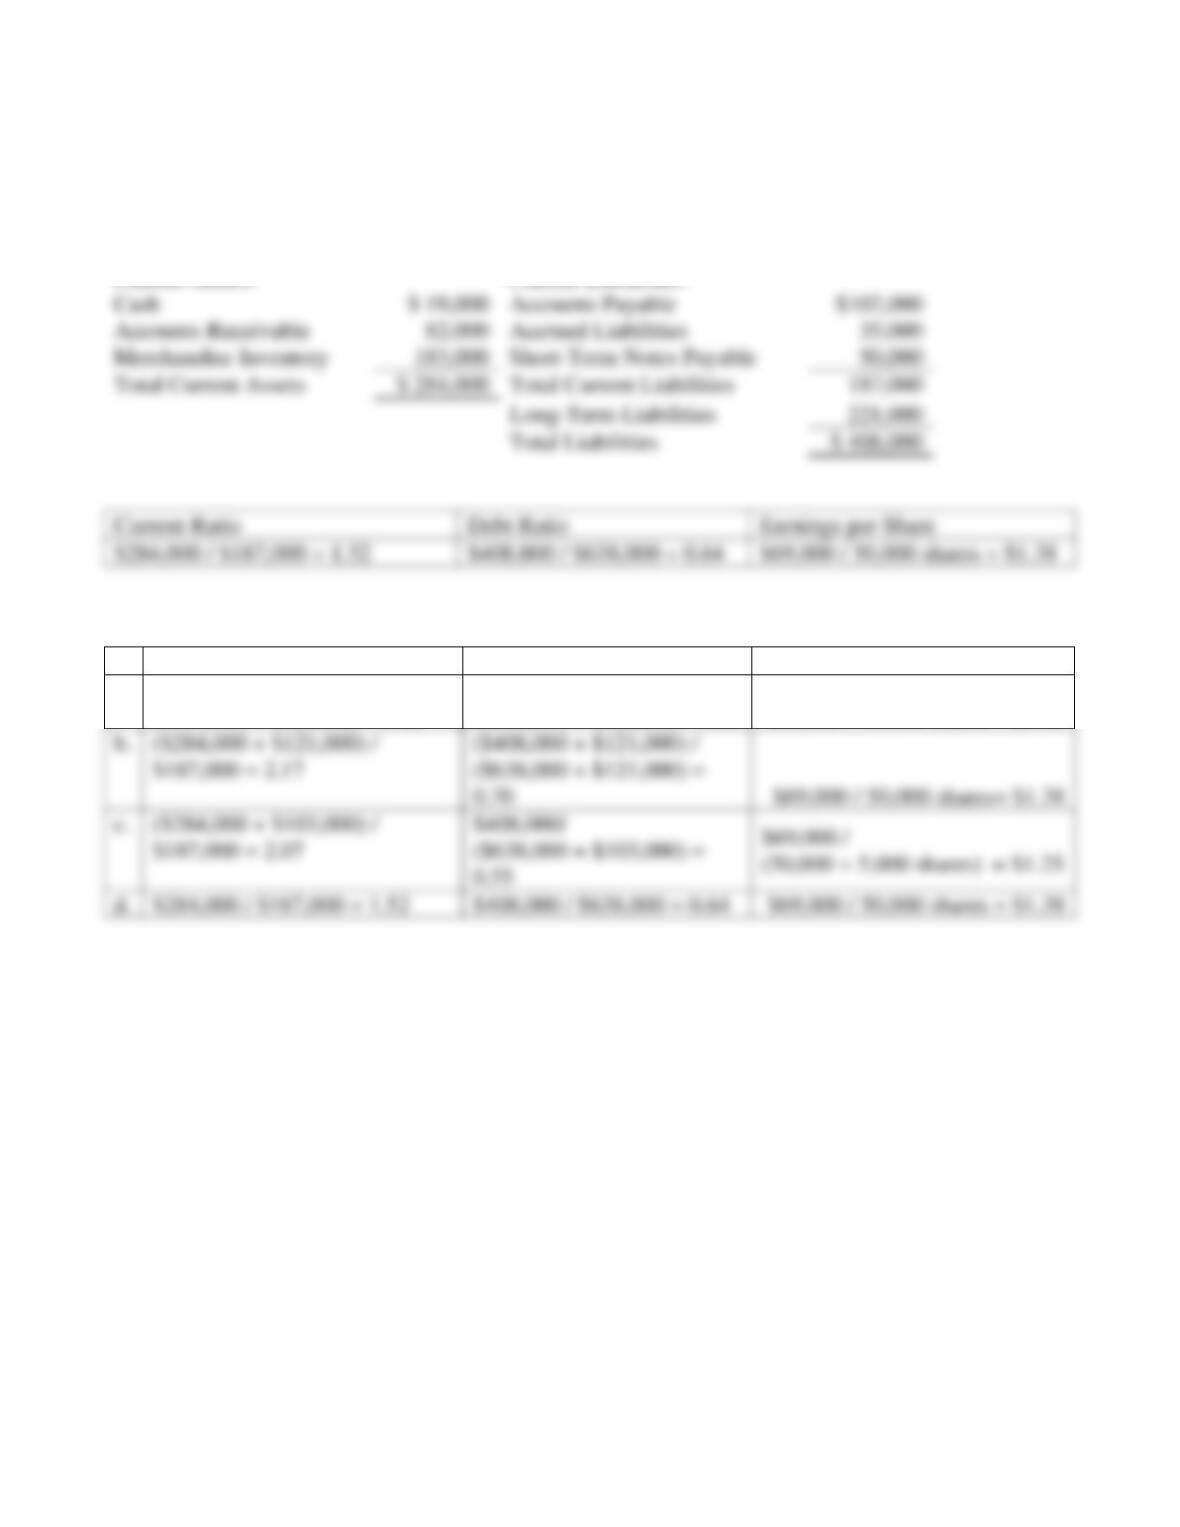
Financial statement data of Style Traveler Magazine include the following items:
Cash
$ 23,000
Accounts Receivable, Net
81,000
Merchandise Inventory
185,000
Total Assets
635,000
Accounts Payable
99,000
Accrued Liabilities
37,000
Short-term Notes Payable
51,000
Long-term Liabilities
224,000
Net Income
68,000
Common Shares Outstanding
20,000 shares
Requirements
1. Compute Style Traveler’s current ratio, debt ratio, and earnings per share. Round all ratios to two
decimal places, and use the following format for your answer:
Current Ratio
Debt Ratio
Earnings per Share
2. Compute the three ratios after evaluating the effect of each transaction that follows. Consider each
transaction separately.
a. Purchased merchandise inventory of $49,000 on account.
b. Borrowed $127,000 on a long-term note payable.
c. Issued 2,000 shares of common stock, receiving cash of $107,000.
d. Received cash on account, $5,000.
15–41
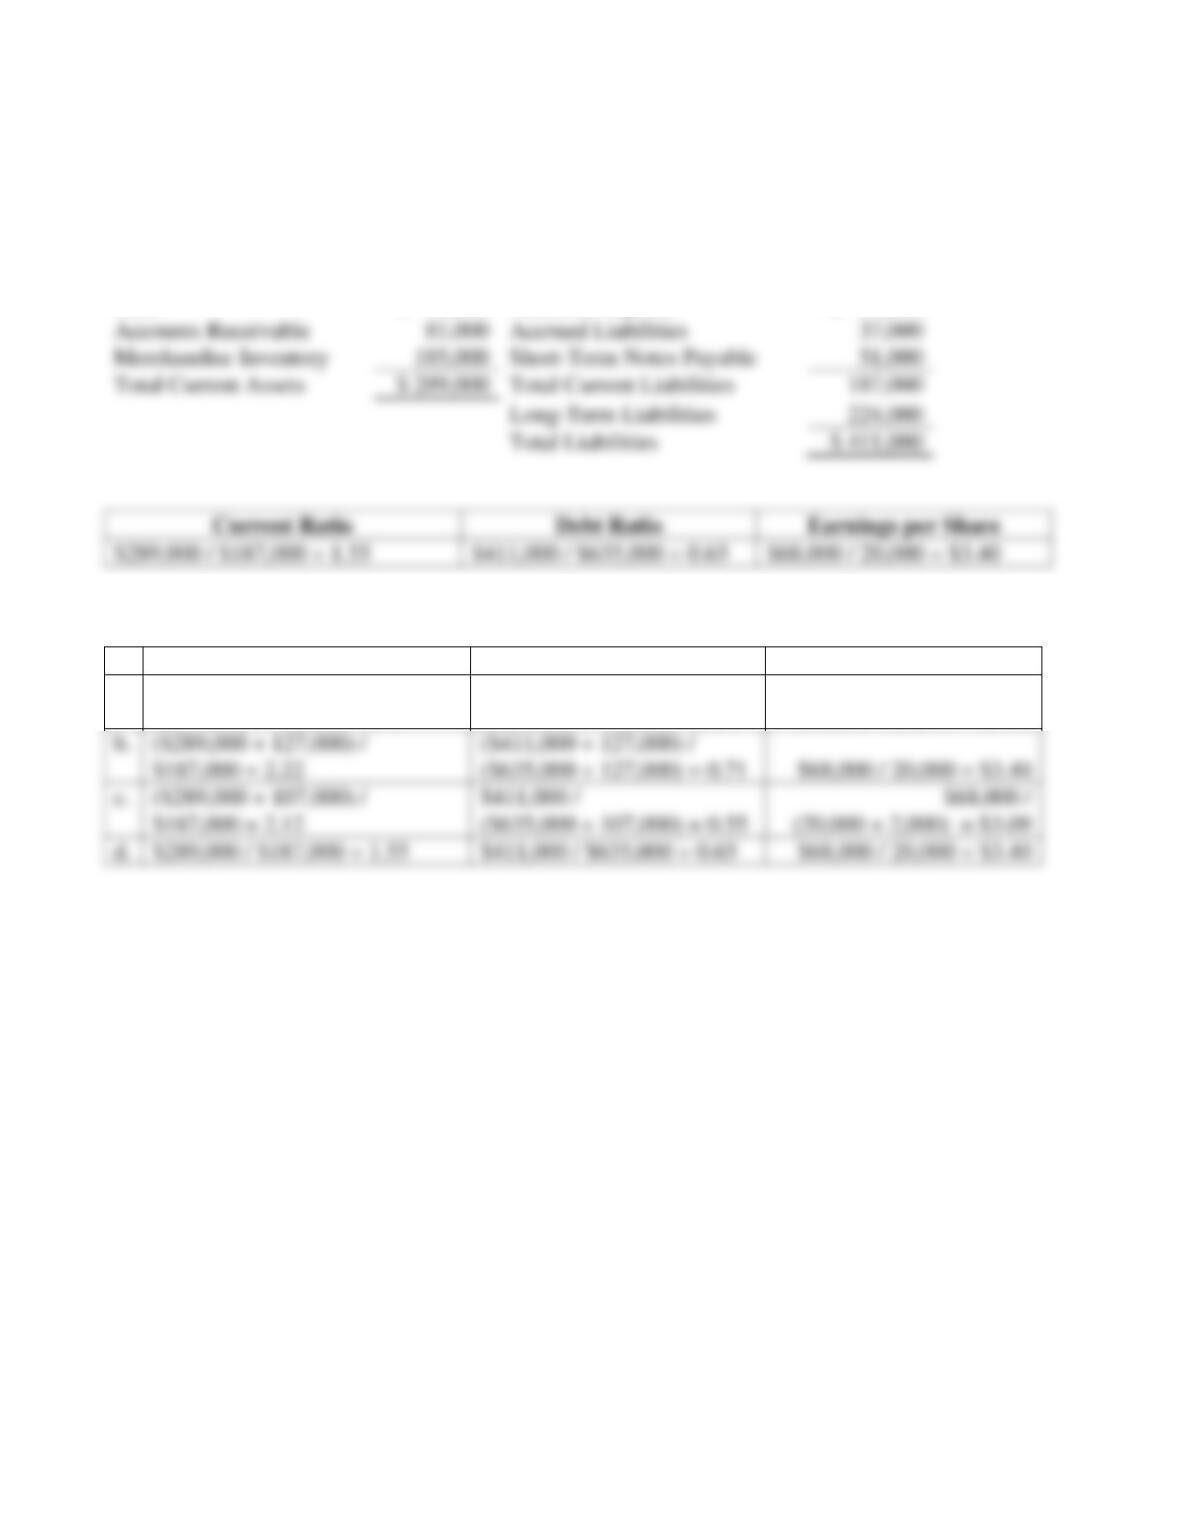
P15-26A cont.
SOLUTION
Requirement 1
Current Assets:
Current Liabilities:
Cash
$ 23,000
Accounts Payable
$ 99,000
Requirement 2
Current Ratio
Debt Ratio
Earnings per Share
a.
($289,000 + 49,000) /
($187,000 + 49,000) = 1.43
($411,000 + 49,000) /
($635,000 + 49,000) = 0.67
$68,000 / 20,000 = $3.40
b.
($289,000 + 127,000) /
$187,000 = 2.22
($411,000 + 127,000) /
($635,000 + 127,000) = 0.71
$68,000 / 20,000 = $3.40
$187,000 = 2.12
($635,000 + 107,000) = 0.55
(20,000 + 2,000) = $3.09
d.
$289,000 / $187,000 = 1.55
$411,000 / $635,000 = 0.65
$68,000 / 20,000 = $3.40
Accounts Receivable
Accrued Liabilities
Merchandise Inventory
Short-Term Notes Payable
Total Current Assets
$ 289,000
Total Current Liabilities
Long-Term Liabilities
Total Liabilities
$ 411,000
Debt Ratio
$289,000 / $187,000 = 1.55
$411,000 / $635,000 = 0.65
$68,000 / 20,000 = $3.40
15–42
P15-27A Using ratios to evaluate a stock investment
Learning Objective 4
1. 2018: e. 48.9%
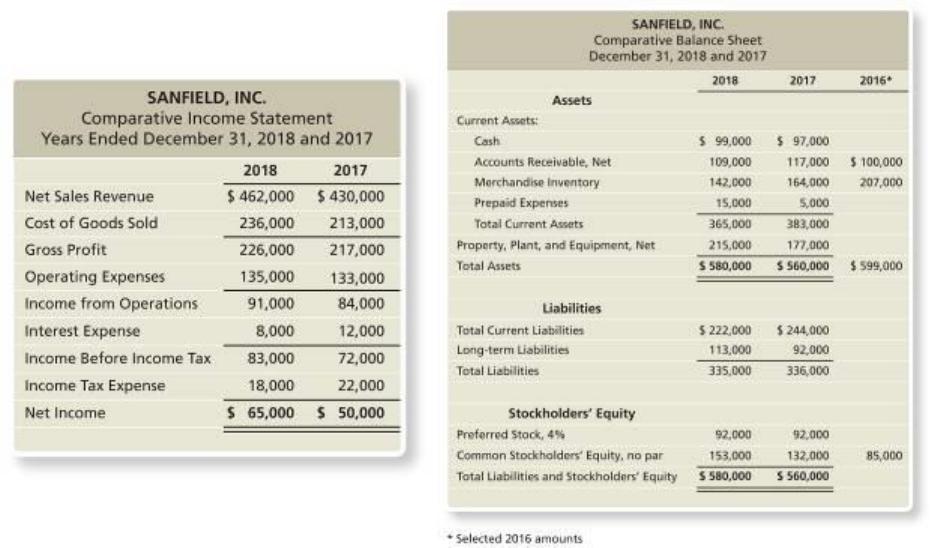
Comparative financial statement data of Sanfield, Inc. follow:
1. Market price of Sanfield’s common stock: $51.48 at December 31, 2018, and $37.08 at December 31,
2017.
2. Common shares outstanding: 16,000 on December 31, 2018 and 15,000 on December 31, 2017 and
2016.
3. All sales are on credit.
Requirements
1. Compute the following ratios for 2018 and 2017:
a. Current ratio
b. Cash ratio
c. Times-interest-earned ratio
d. Inventory turnover
e. Gross profit percentage
f. Debt to equity ratio
g. Rate of return on common stockholders’ equity
h. Earnings per share of common stock
i. Price/earnings ratio
15–43
P15-27A, cont.
2. Decide (a) whether Sanfield’s ability to pay debts and to sell inventory improved or deteriorated
during 2018 and (b) whether the investment attractiveness of its common stock appears to have
increased or decreased.
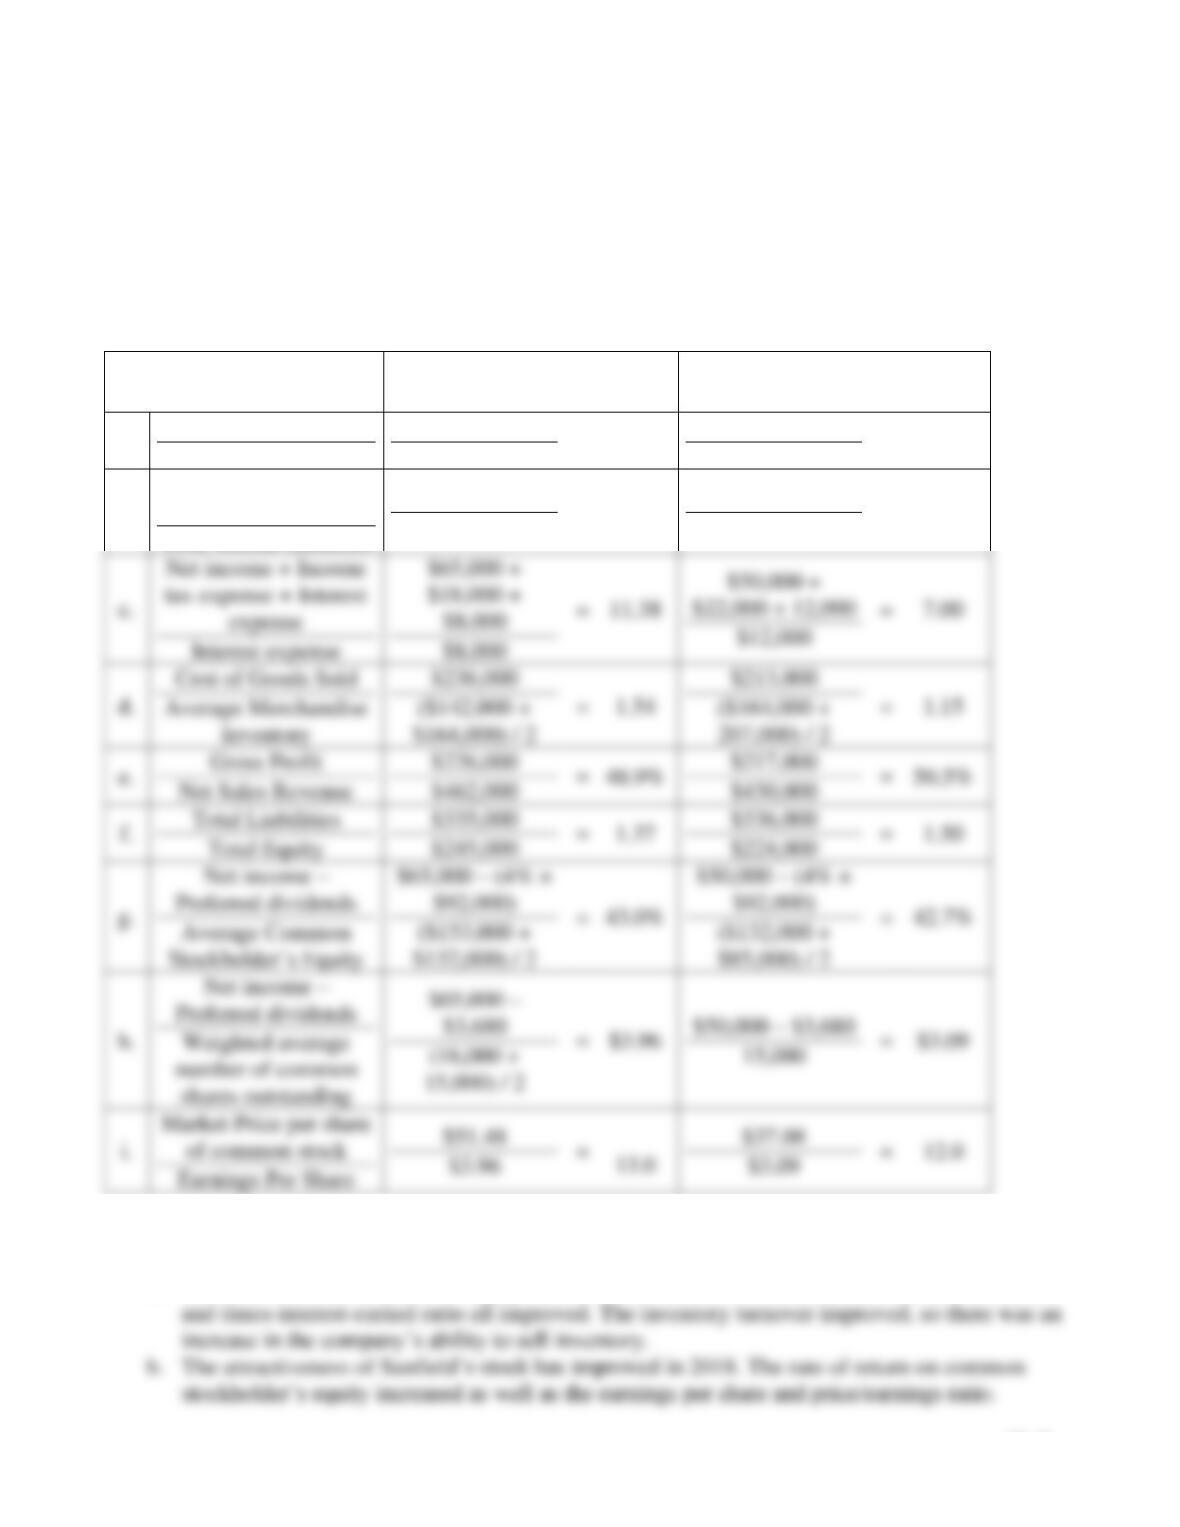
SOLUTION
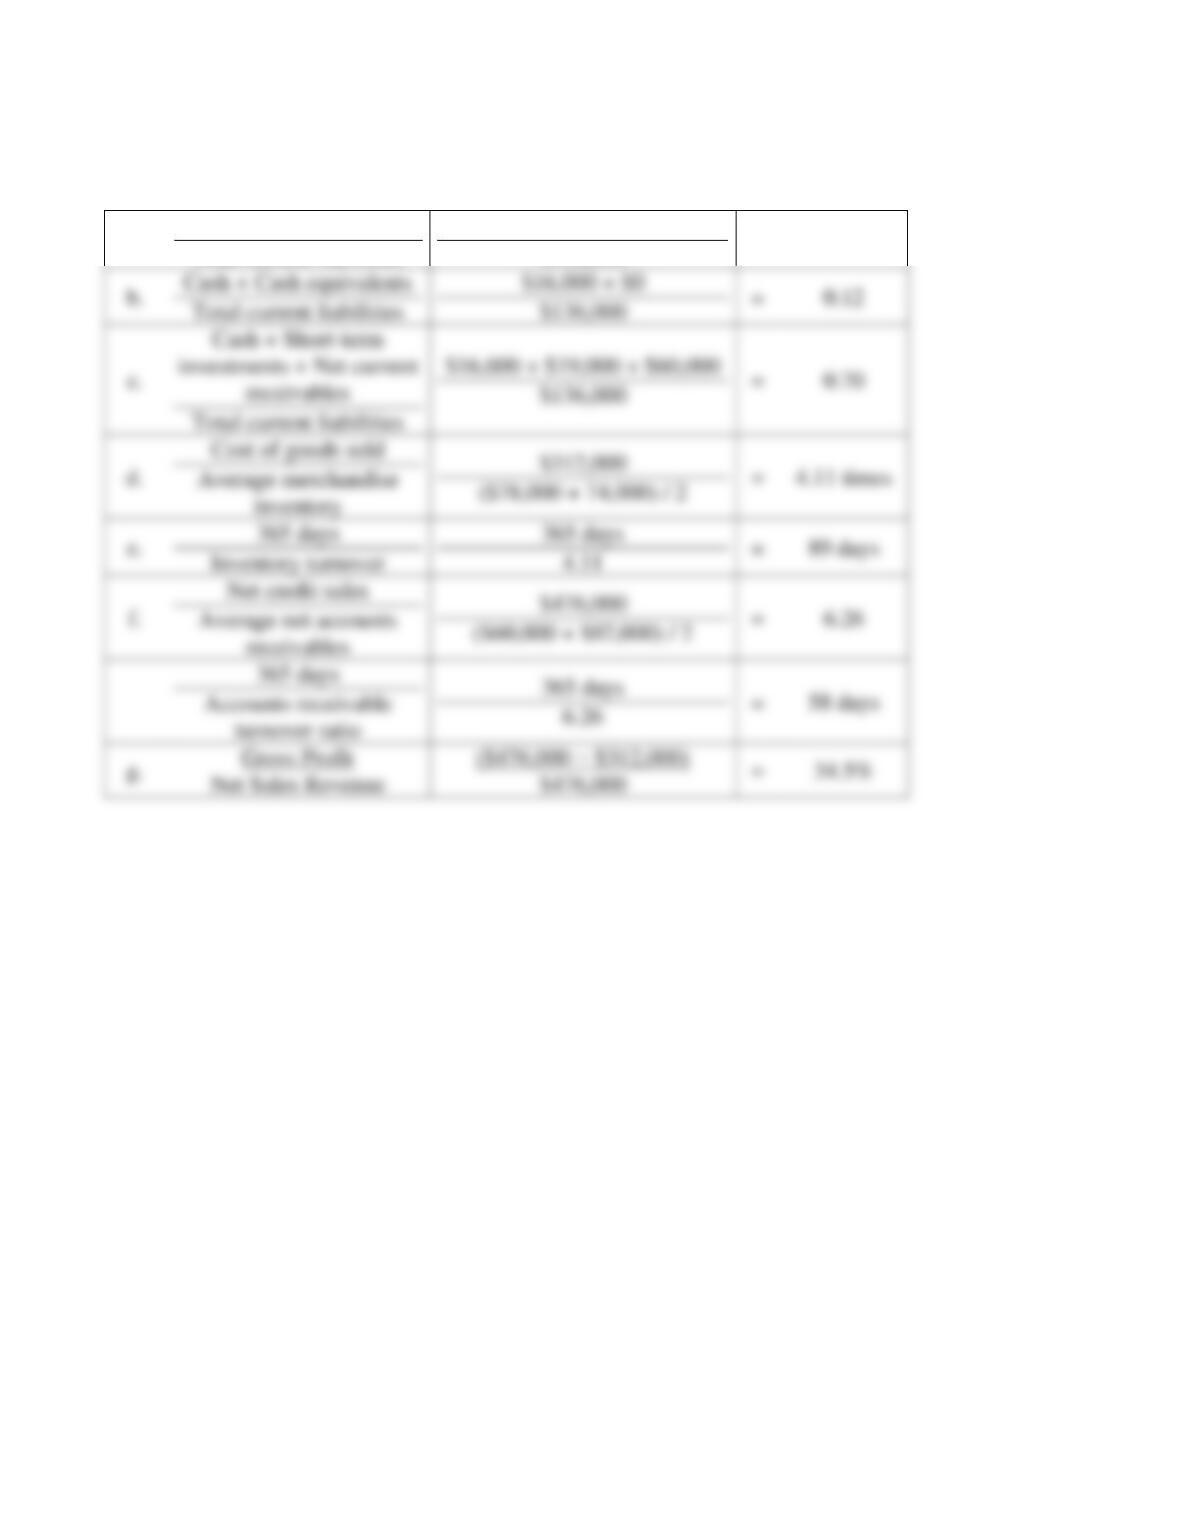
Requirement 1
2018
2017
a.
Total current assets
Total current liabilities
$365,000
$222,000
=
1.64
$383,000
$244,000
=
1.57
b.
Cash + Cash
equivalents
Total current liabilities
$99,000 + $0
$222,000
=
0.45
$97,000 + $0
$244,000
=
0.40
Requirement 2
a. Sanfield is in a better position to pay debt in 2018 than in 2017. The current ratio, cash ratio,
$462,000
$430,000
$245,000
=
1.37
$224,000
=
1.50
13.0

15–44
P15-28A Using ratios to decide between two stock investments
Learning Objective 4
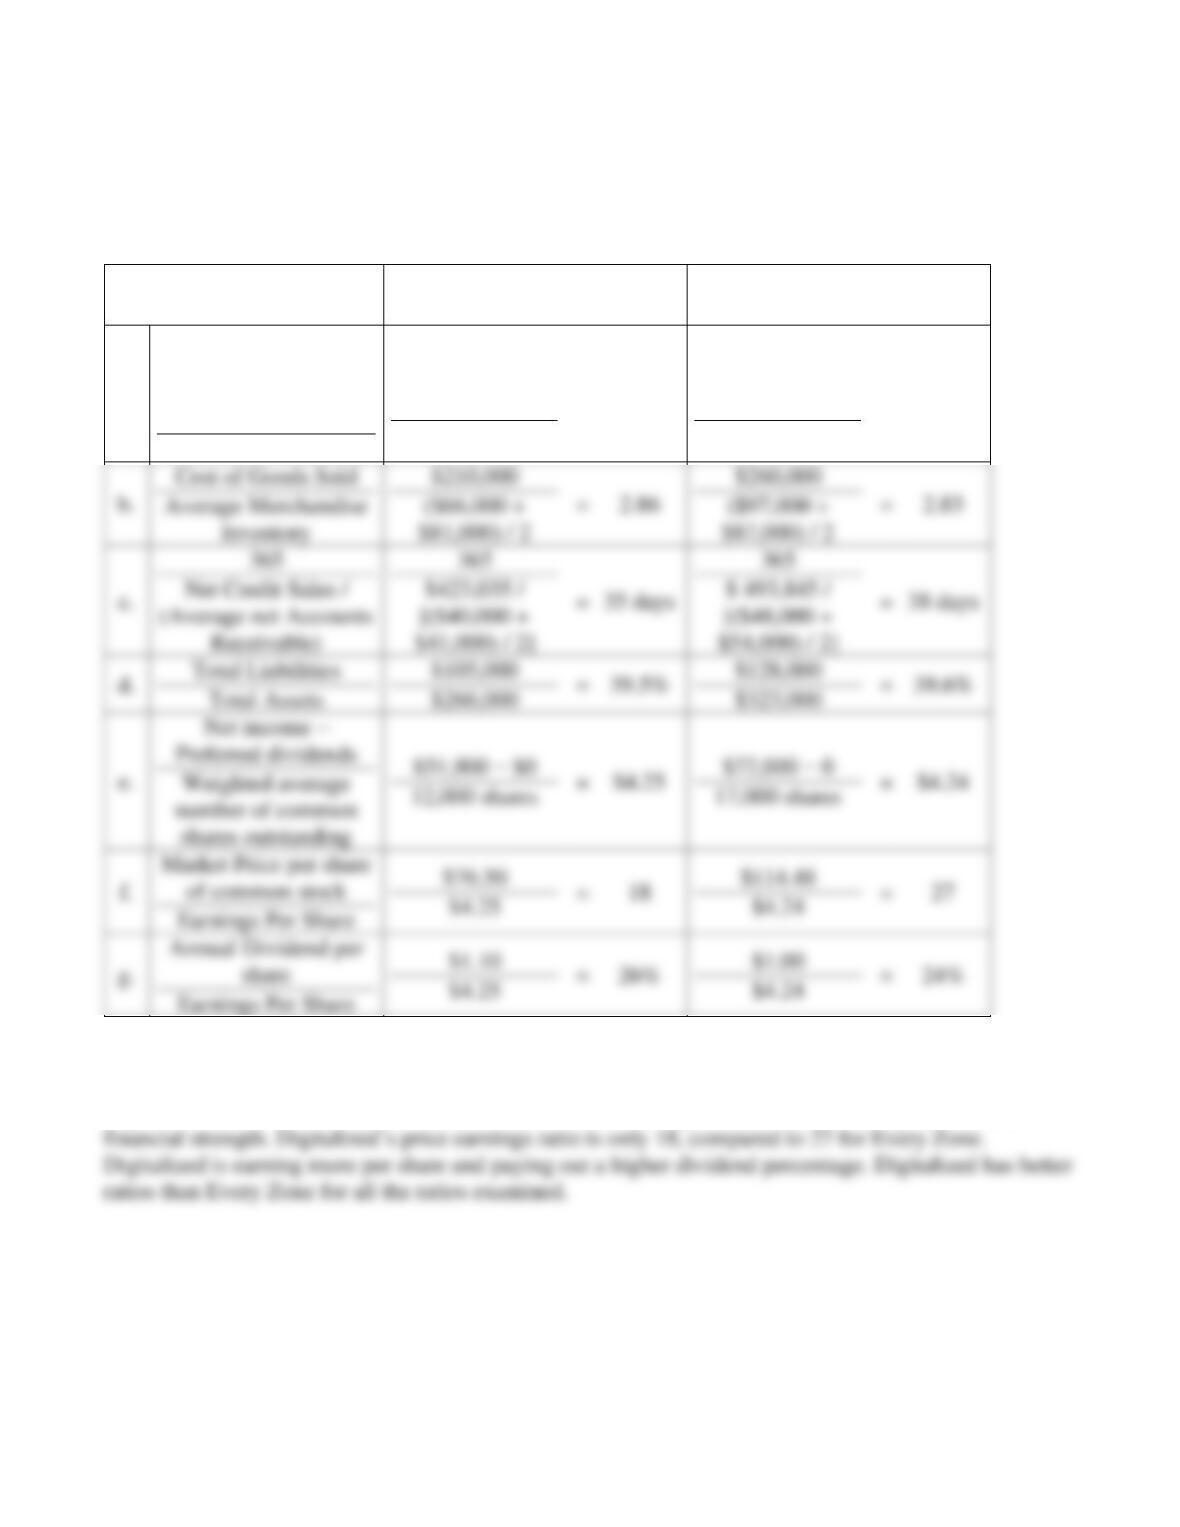
1. Digitalized e. $4.25
Assume that you are purchasing an investment and have decided to invest in a company in the digital
phone business. You have narrowed the choice to Digitalized Corp. and Every Zone, Inc. and have
assembled the following data.
Selected income statement data for the current year:
Digitalized
Every Zone
Net Sales Revenue (all on credit)
$ 423,035
$ 493,845
Cost of Goods Sold
210,000
260,000
Interest Expense
0
19,000
Net Income
51,000
72,000
Selected balance sheet and market price data at the end of the current year:
Digitalized
Every Zone
Current Assets:
Cash
$ 24,000
$ 17,000
Short-term Investments
40,000
14,000
Accounts Receivable, Net
40,000
48,000
Merchandise Inventory
66,000
97,000
Prepaid Expenses
23,000
12,000
Total Current Assets
$ 193,000
$ 188,000
Total Assets
$ 266,000
$ 323,000
Total Current Liabilities
105,000
96,000
Total Liabilities
105,000
128,000
Common Stock:
$1 par (12,000 shares)
12,000
$1 par (17,000 shares)
17,000
Total Stockholders’ Equity
161,000
195,000
Market Price per Share of Common Stock
76.50
114.48
Dividends Paid per Common Share
1.10
1.00
Selected balance sheet data at the beginning of the current year:

15–45
P15-28A, cont.
Digitalized
Every Zone
Balance Sheet:
Accounts Receivable, net
$ 41,000
$ 54,000
Merchandise Inventory
81,000
87,000
Total Assets
261,000
272,000
Common Stock:
$1 par (12,000 shares)
12,000
$1 par (17,000 shares)
17,000
Your strategy is to invest in companies that have low price/earnings ratios but appear to be in good
shape financially. Assume that you have analyzed all other factors and that your decision depends on the
results of ratio analysis.
Requirements
1. Compute the following ratios for both companies for the current year:
a. Acid-test ratio
b. Inventory turnover
c. Days’ sales in receivables
d. Debt ratio
e. Earnings per share of common stock
f. Price/earnings ratio
g. Dividend payout
2. Decide which company’s stock better fits your investment strategy.
15–46
P15-28A, cont.
SOLUTION
Requirement 1
Digitalized, Corp.
Every Zone, Inc.
a.
Cash + Cash
equivalents + Short-
term Investments +
Accounts Receivable
Total current liabilities
($24,000 + $0 +
$40,000 +
$40,000)
$105,000
=
0.99
($17,000 + $0 +
$14,000 +
$48,000)
$96,000
=
0.82
Requirement 2
Digitalized would be the better investment based on the strategy of a low price earnings ratio, with

15–47
P15-29A Completing a comprehensive financial statement analysis
Learning Objectives 2, 4
3. 2018: Inventory turnover 8.04
In its annual report, ABC Athletic Supply, Inc. includes the following five-year financial summary:
ABC ATHLETIC SUPPLY, INC.
Five-Year Financial Summary (Partial; adapted)
(Dollar amounts in thousands
except per share data)
2018
2017
2016
2015
2014
2013
Net Sales Revenue
$ 250,000
$ 216,000
$ 191,000
$ 161,000
$ 134,000
Net Sales Revenue Increase
16%
13%
19%
20%
17%
Domestic Comparative Store Sales
Increase
5%
6%
4%
7%
9%
Other Income—Net
2,110
1,840
1,760
1,690
1,330
Cost of Goods Sold
189,250
164,592
148,216
126,385
106,396
Selling and Administrative Expenses
41,210
36,330
31,620
27,440
22,540
Interest:
Interest Expense
(1,080)
(1,380)
(1,400)
(1,020)
(830)
Interest Income
125
165
155
235
190
Income Tax Expense
4,470
3,900
3,700
3,320
2,700
Net Income
16,225
11,803
7,979
4,760
3,054
Per Share of Common Stock:
Net Income
1.60
1.30
1.20
1.00
0.78
Dividends
0.40
0.38
0.34
0.30
0.26
Financial Position
Current Assets, Excluding
Merchandise Inventory
$ 30,700
$ 27,200
$ 26,700
$ 24,400
$ 21,500
Merchandise Inventory
24,500
22,600
21,700
19,000
17,500
$
16,700
Property, Plant, and Equipment, Net
51,400
45,200
40,000
35,100
25,600
Total Assets
106,600
95,000
88,400
78,500
64,600
Current Liabilities
32,300
28,000
28,300
25,000
16,500
Long-term Debt
23,000
21,500
17,600
19,100
12,000
Stockholders’ Equity
51,300
45,500
42,500
34,400
36,100
Financial Ratios
Acid-Test Ratio
1.0
1.0
0.9
1.0
1.3
Rate of Return on Total Assets
17.2%
14.4%
11.2%
8.1%
7.1%
Rate of Return on Common
Stockholders’ Equity
33.5%
26.8%
20.8%
13.5%
13.0%
15–48
P15-29A, cont.
Requirements
Analyze the company’s financial summary for the fiscal years 2014–2018 to decide whether to invest in
the common stock of ABC. Include the following sections in your analysis.
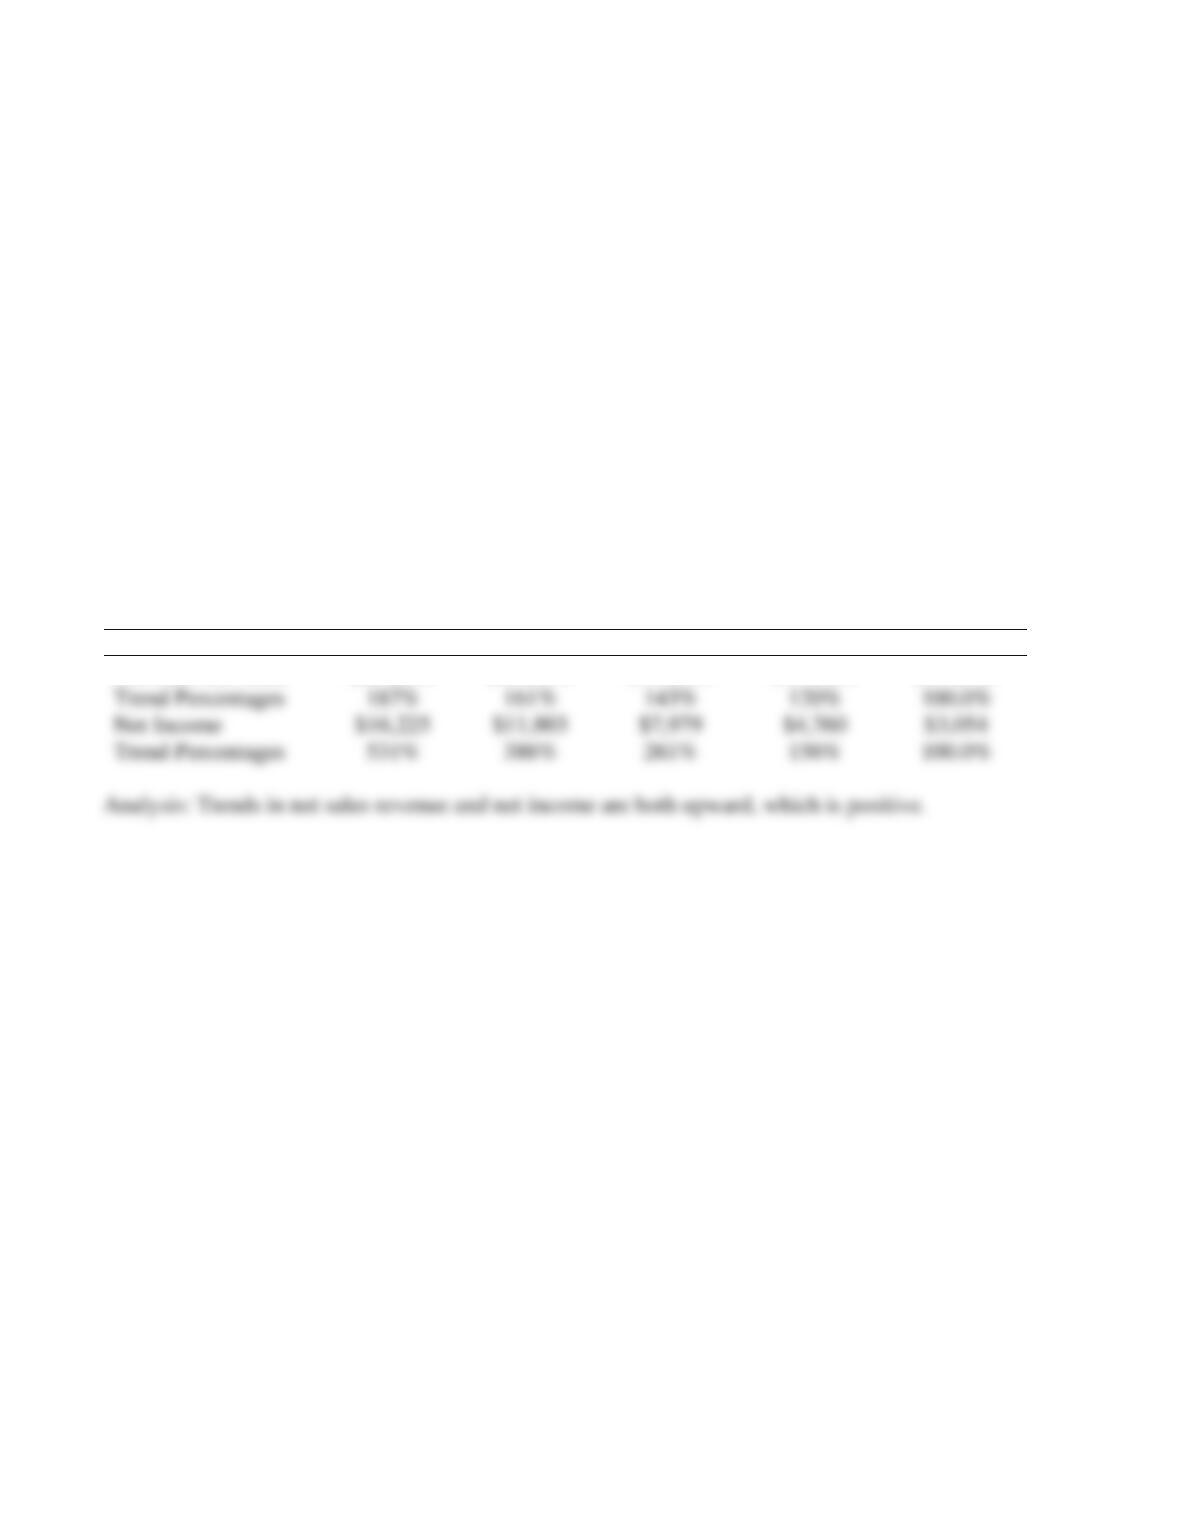
1. Trend analysis for net sales revenue and net income (use 2014 as the base year).
2. Profitability analysis.
3. Evaluation of the ability to sell merchandise inventory.
4. Evaluation of the ability to pay debts.
5. Evaluation of dividends.
6. Should you invest in the common stock of ABC Athletic Supply, Inc.? Fully explain your final
decision
SOLUTION
Requirement 1
2018
2017
2016
2015
2014
Net Sales Revenue
$250,000
$216,000
$191,000
$161,000
$134,000
Trend Percentages
187%
120%
Net Income
$11,803
Trend Percentages
531%
156%
P15-29A, cont.
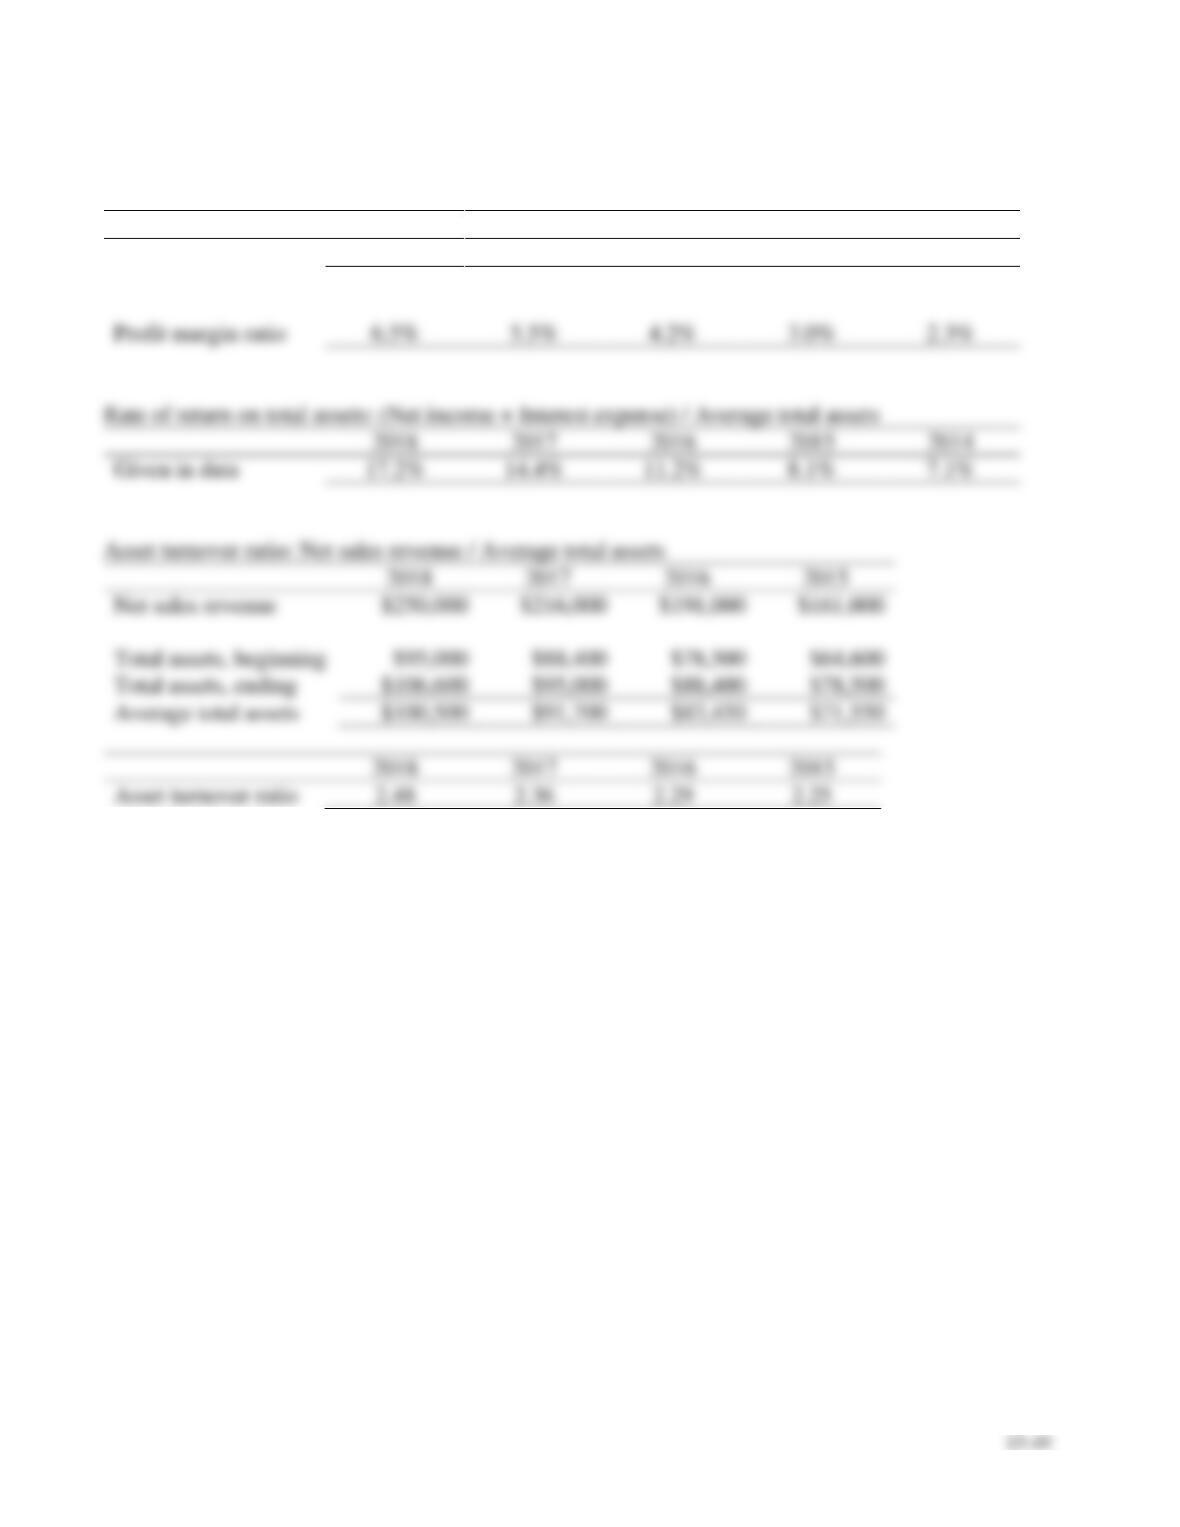
Requirement 2
Profit margin ratio: Net income / Net sales revenue
2018
2017
2016
2015
2014
Net income
$16,225
$11,803
$7,979
$4,760
$3,054
Net sales
$250,000
$216,000
$191,000
$161,000
$134,000
Profit margin ratio
2018
2017
2016
2015
2014
Given in data
2018
2017
2016
2015
Net sales revenue
Total assets, beginning
Total assets, ending
Average total assets
2018
2017
2016
2015
15–50
P15-29A, cont.
Requirement 2, cont.
Rate of return on common stockholders’ equity: (Net income ‒ Preferred dividends) / Average common
stockholders’ equity
2018
2017
2016
2015
2014
Given in data
33.5%
26.8%
20.8%
13.5%
13.0%
Inventory Turnover: Cost of goods sold / Average merchandise inventory
Days’ sales in inventory: 365 days / Inventory turnover
2018
2017
2016
2015
2014
Beginning inventory
$ 22,600
$ 21,700
$ 19,000
$ 17,500
$ 16,700
Ending inventory
24,500
22,600
21,700
19,000
17,500
Average inventory
$ 23,550
$ 22,150
$ 20,350
$ 18,250
$ 17,100
Inventory turnover
2018
2017
2016
2015
2014
Given in data
2015
2014
Net sales revenue
Cost of goods sold
164,592
Gross profit
Gross profit %
23.8%
P15-29A, cont.
Requirement 4
Acid-test ratio: (Cash + Cash equivalents + Short-term investments + Net current receivables) / Current
liabilities
2018
2017
2016
2015
2014
Given in data
2018
2017
2016
2015
2014
$30,700 +
$24,500
$27,200 +
$22,600
$26,700 +
$21,700
$24,400 +
$19,000
$21,500 +
$17,500
Current liabilities
$32,300
$28,000
$28,300
$25,000
$16,500
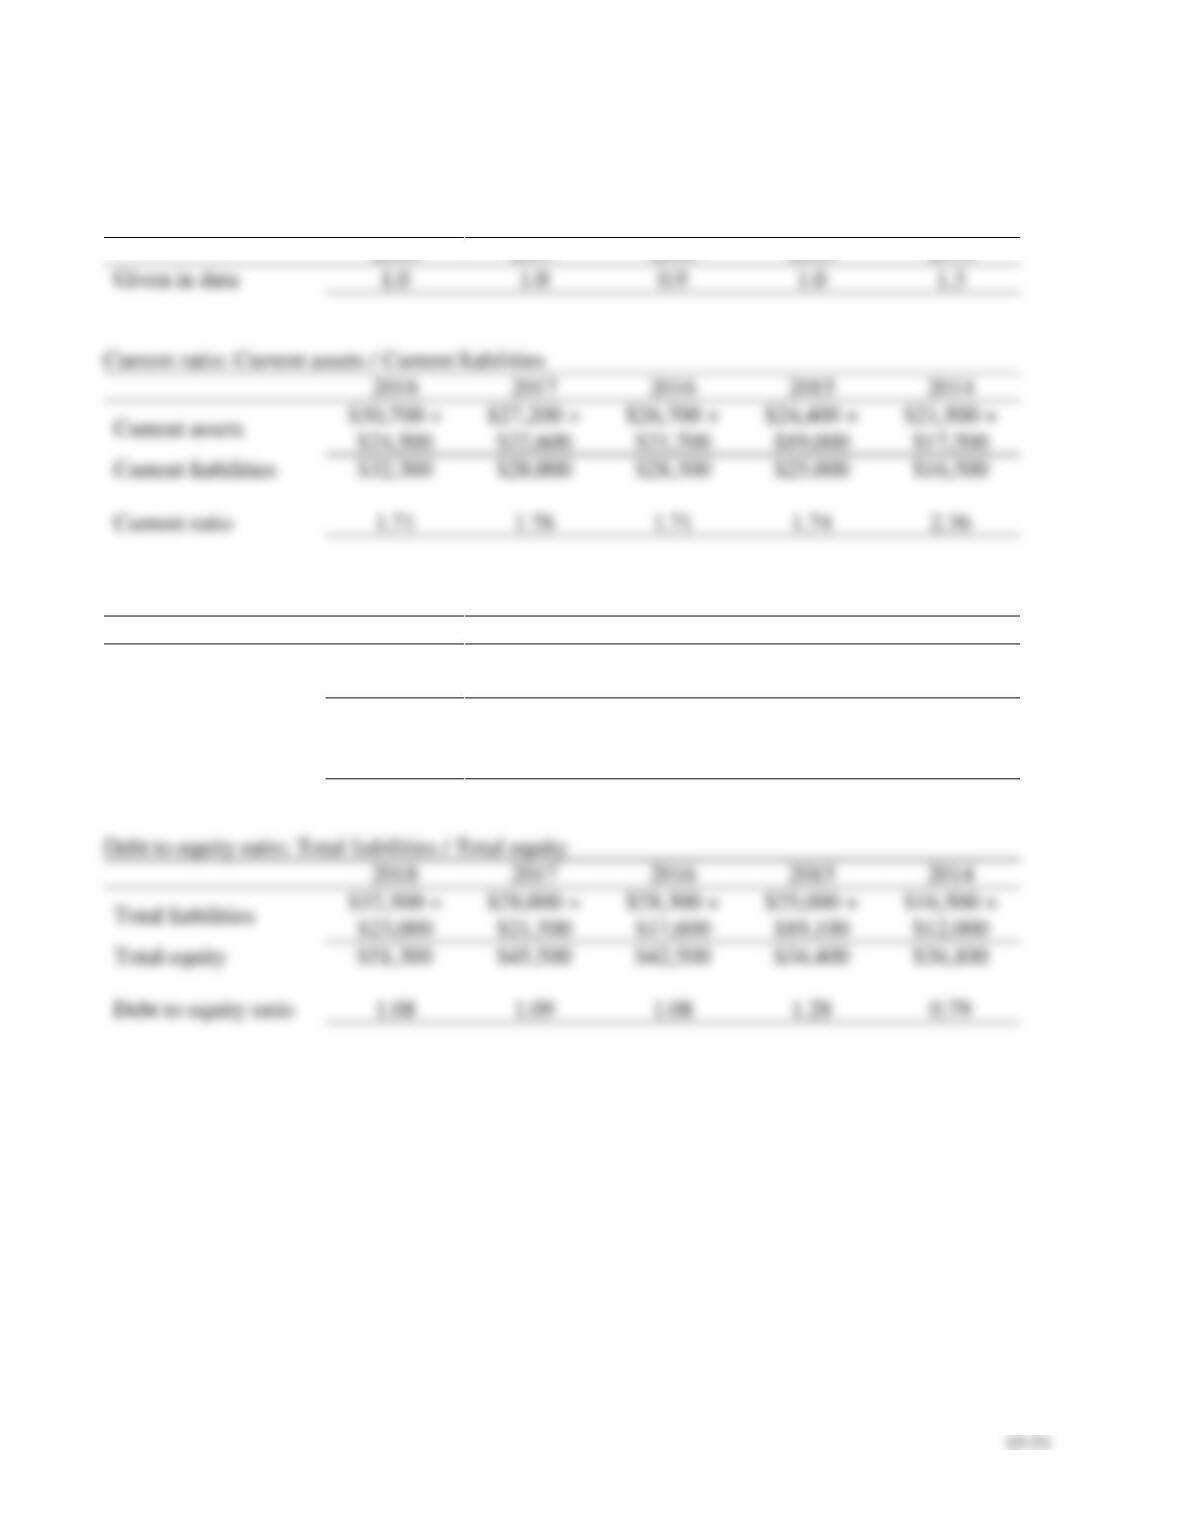
Current ratio
Debt ratio: Total liabilities / Total assets
2018
2017
2016
2015
2014
Total liabilities
$32,300 +
$23,000
$28,000 +
$21,500
$28,300 +
$17,600
$25,000 +
$19,100
$16,500 +
$12,000
Total assets
$106,600
$95,000
$88,400
$78,500
$64,600
Debt ratio
51.9%
52.1%
51.9%
56.2%
44.1%
2018
2017
2016
2015
2014
$32,300 +
$23,000
$28,000 +
$21,500
$28,300 +
$17,600
$25,000 +
$19,100
$16,500 +
$12,000
Total equity
$51,300
$45,500
$42,500
$34,400
$36,100
Debt to equity ratio
15–52
P15-29A, cont.
Requirement 4, cont.
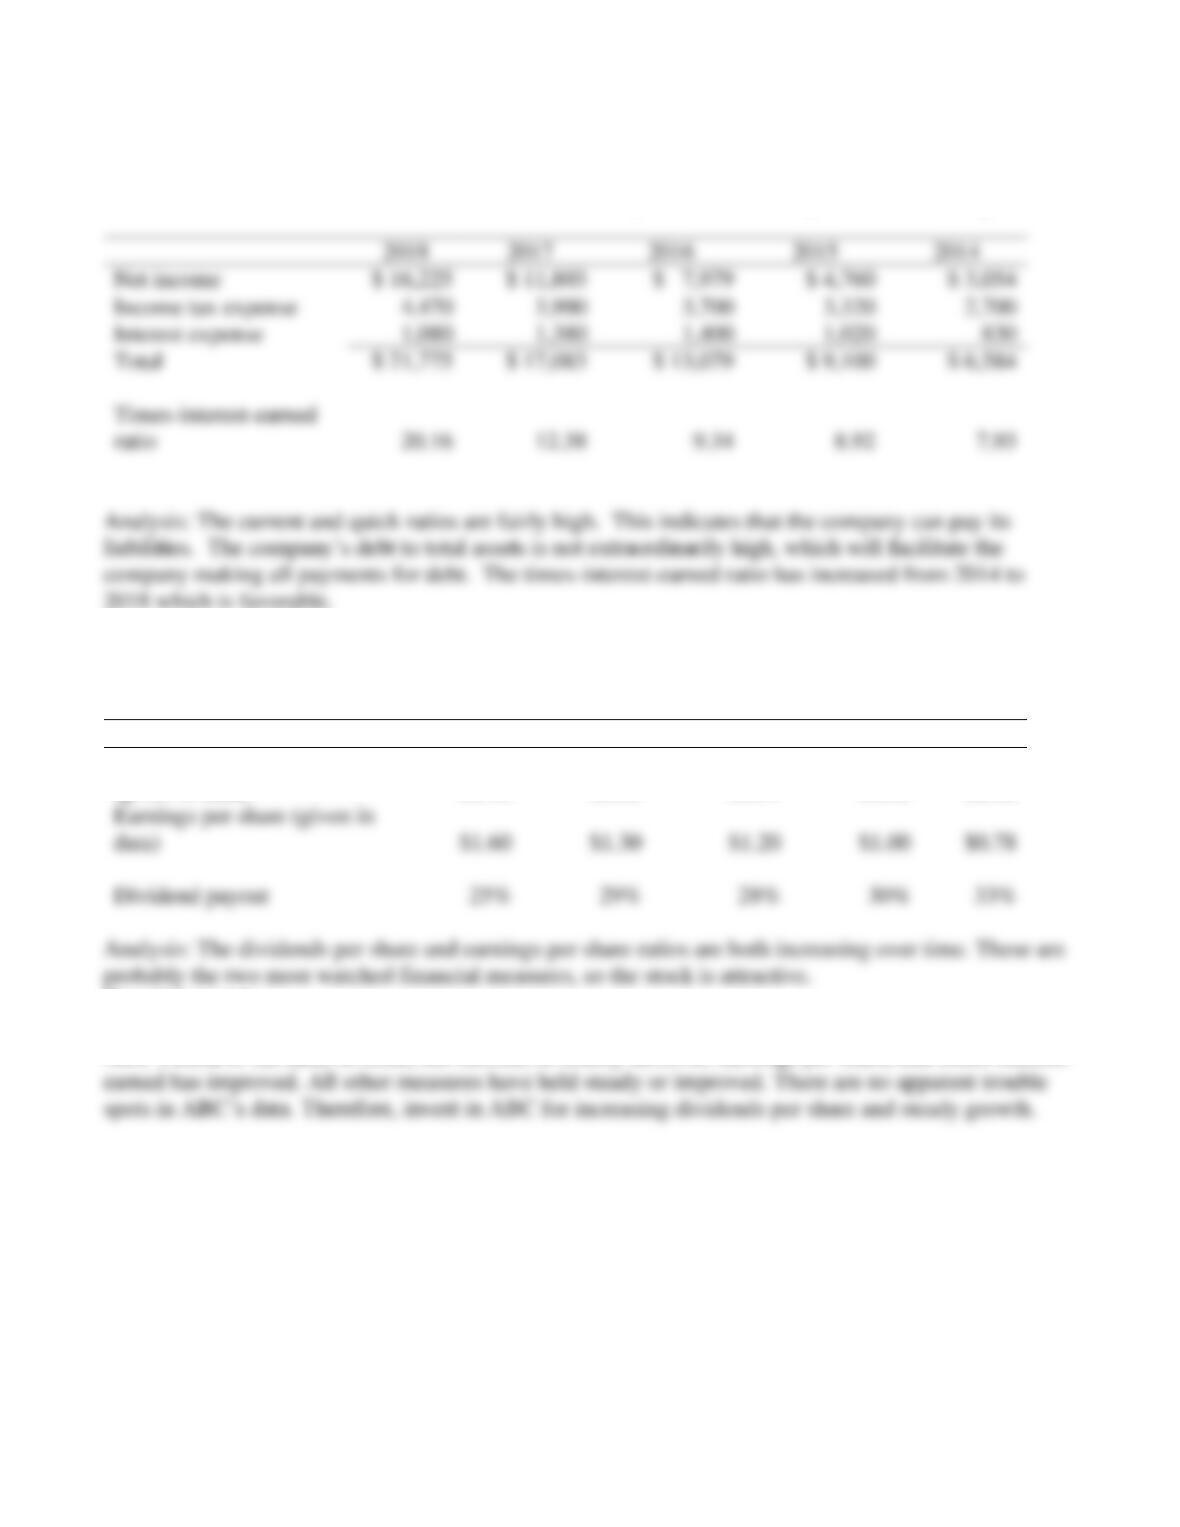
Times interest earned ratio: (Net income + income tax expense + Interest expense) / Interest expense
Requirement 5
Dividend payout: Annual dividend per share / Earnings per share
2018
2017
2016
2015
2014
Annual dividend per share
(given in data)
$0.40
$0.38
$0.34
$0.30
$0.26
Earnings per share (given in
data)
$1.60
$1.30
$1.20
$1.00
$0.78
Dividend payout
29%
30%
Requirement 6
Final analysis:
ABC’s trend of net sales revenue, net income, inventory turnover, earnings per share, and times-interest-
2017
Net income
$ 11,803
Income tax expense
Interest expense
Total
$ 17,083
Times-interest-earned
ratio
Problems (Group B)
P15-30B Computing trend analysis and return on common equity
Learning Objectives 2, 4
2. 2018: 11.9%
Net sales revenue, net income, and common stockholders’ equity for Azbel Mission Corporation, a
manufacturer of contact lenses, follow for a four-year period.
2019
2018
2017
2016
Net Sales Revenue
$
758,000
$
701,000
$
639,000
$
659,000
Net Income
59,000
40,000
39,000
42,000
Ending Common Stockholders’
Equity
360,000
346,000
324,000
302,000
Requirements
1. Compute trend analyses for each item for 2017–2019. Use 2016 as the base year, and round to the
nearest whole percent.
2. Compute the rate of return on common stockholders’ equity for 2017–2019, rounding to three
decimal places.
SOLUTION
Requirement 1
15–54
P15-30B, cont.
Requirement 2
Rate of return on common
stockholders’ equity
=
Net income – Preferred dividends
Average common stockholders’ equity
=
0.167 = 16.7%
15–55
P15-31B Performing vertical analysis
Learning Objective 3
1. Net Income 10.9%
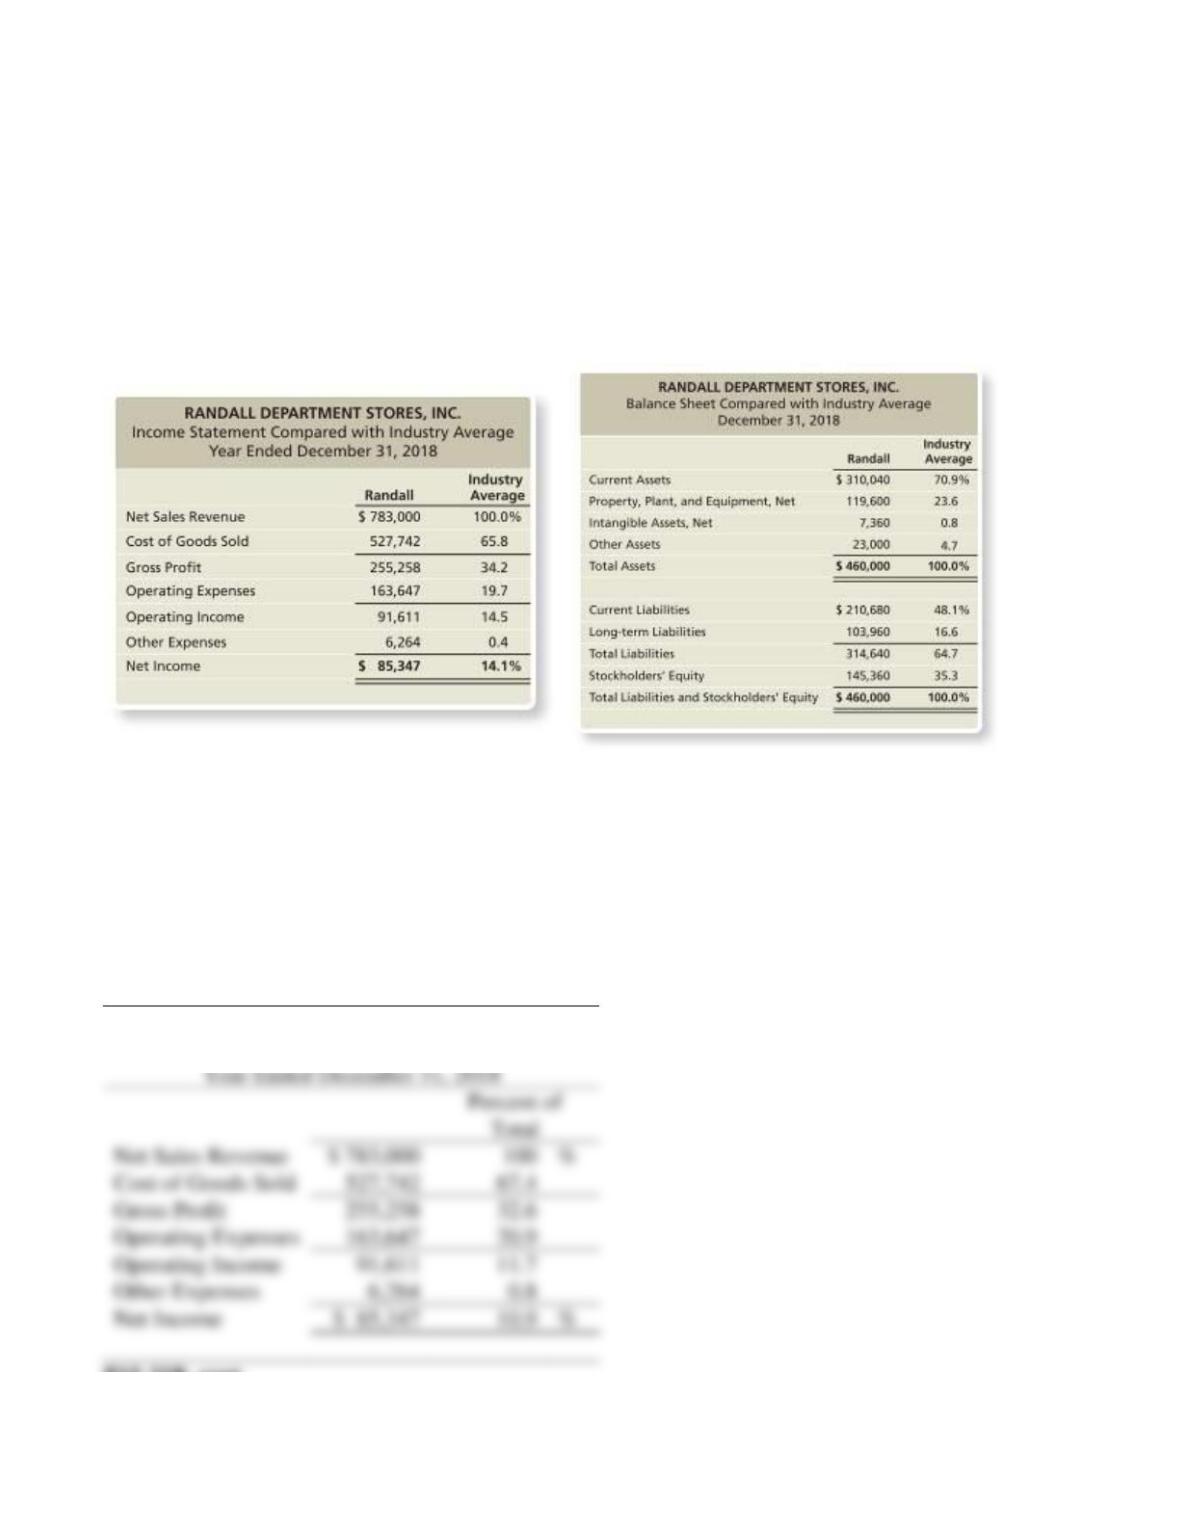
The Randall Department Stores, Inc. chief executive officer (CEO) has asked you to compare the
company’s profit performance and financial position with the averages for the industry. The CEO has
given you the company’s income statement and balance sheet as well as the industry average data for
retailers.
Requirements
1. Prepare a vertical analysis for Randall for both its income statement and balance sheet.
2. Compare the company’s profit performance and financial position with the average for the industry.
SOLUTION
Requirement 1
RANDALL DEPARTMENT STORES, INC.
Income Statement
P15-31B, cont.
Requirement 1, cont.
15–56
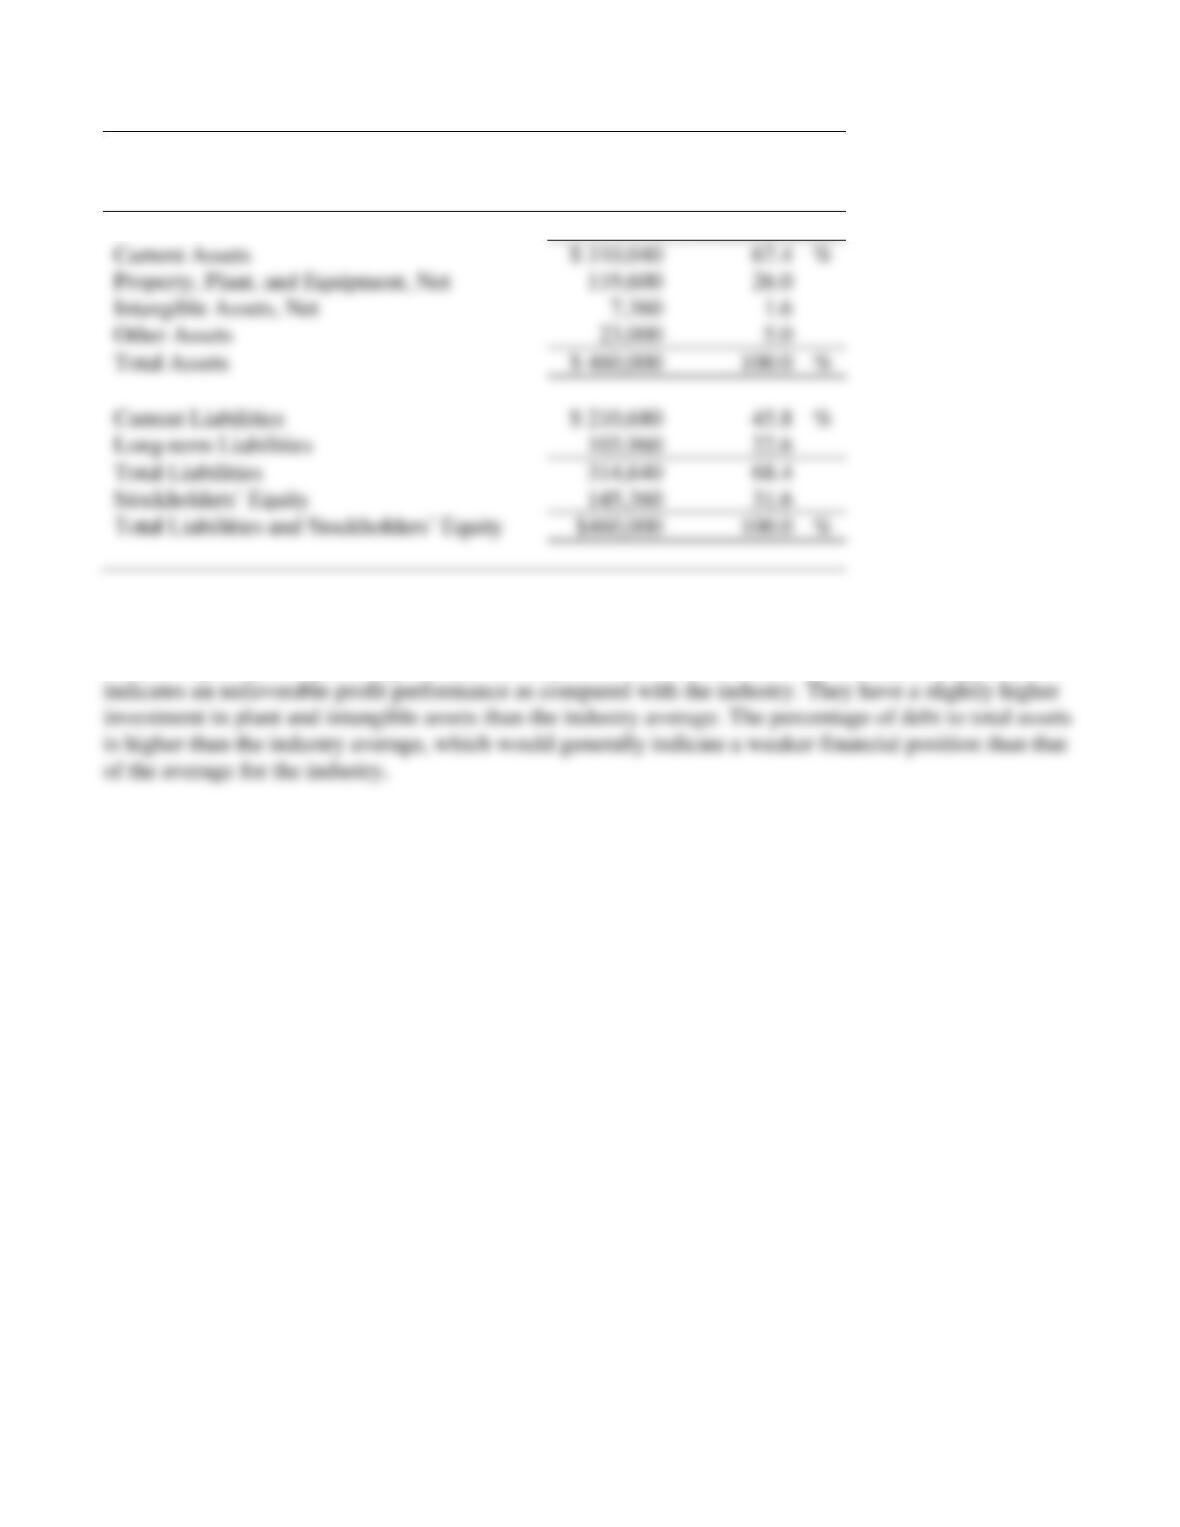
RANDALL DEPARTMENT STORES, INC.
Balance Sheet
December 31, 2018
Percent of Total
Requirement 2
Randall’s gross profit percentage and profit margin ratio are both less than the industry average, which
Note: Problem P15-31B must be completed before attempting Problem P15-32B.
P15-32B Preparing common-size statements, analysis of profitability and financial position,
comparison with the industry, and using ratios to evaluate a company
Learning Objectives 3, 4
1. Current Assets 67.4%
Consider the data for Randall Department Stores presented in Problem P15-31B.
Requirements
1. Prepare a common-size income statement and balance sheet for Randall. The first column of each
statement should present Randall’s common-size statement, and the second column, the industry
averages.
2. For the profitability analysis, compute Randall’s (a) gross profit percentage and (b) profit margin
ratio. Compare these figures with the industry averages. Is Randall’s profit performance better or
worse than the industry average?
3. For the analysis of financial position, compute Randall’s (a) current ratio and (b) debt to equity ratio.
Compare these ratios with the industry averages. Assume the current ratio industry average is 1.47,
and the debt to equity industry average is 1.83. Is Randall’s financial position better or worse than the
industry averages?
SOLUTION
Requirement 1
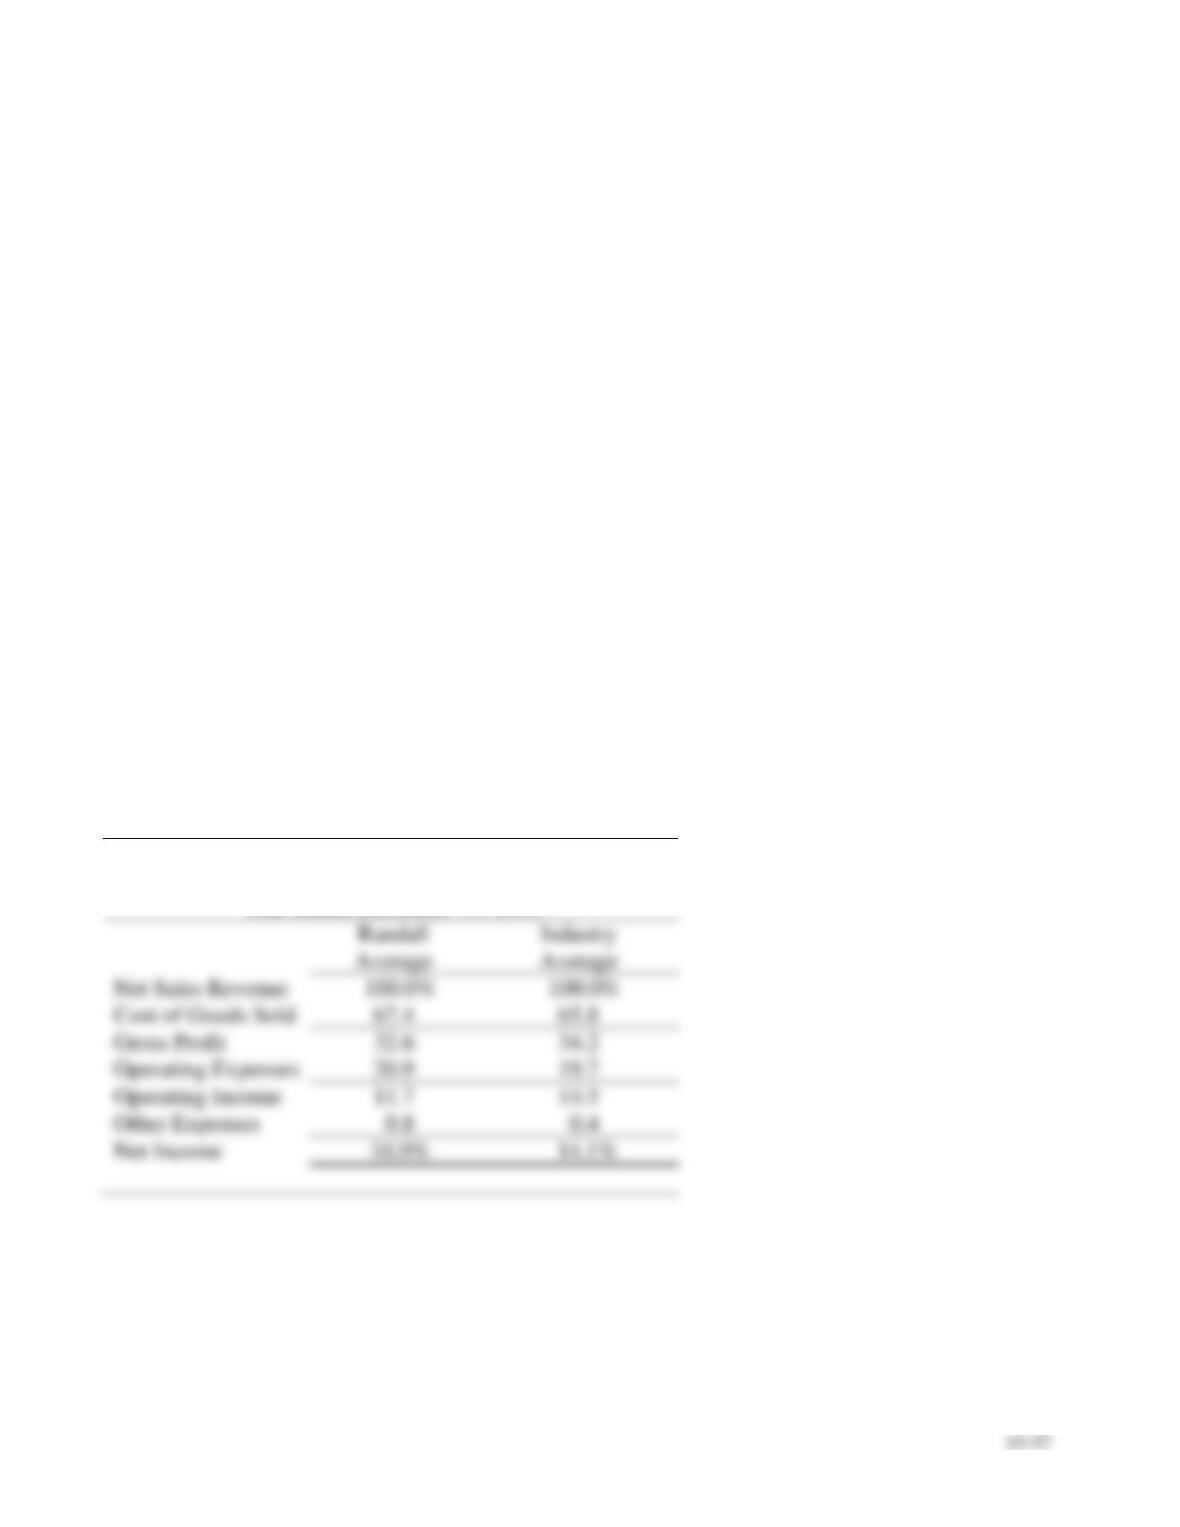
RANDALL DEPARTMENT STORES, INC.
Common-Size Income Statement
Year Ended December 31, 2018
15–58
P15-32B, cont.
Requirement 1, cont.
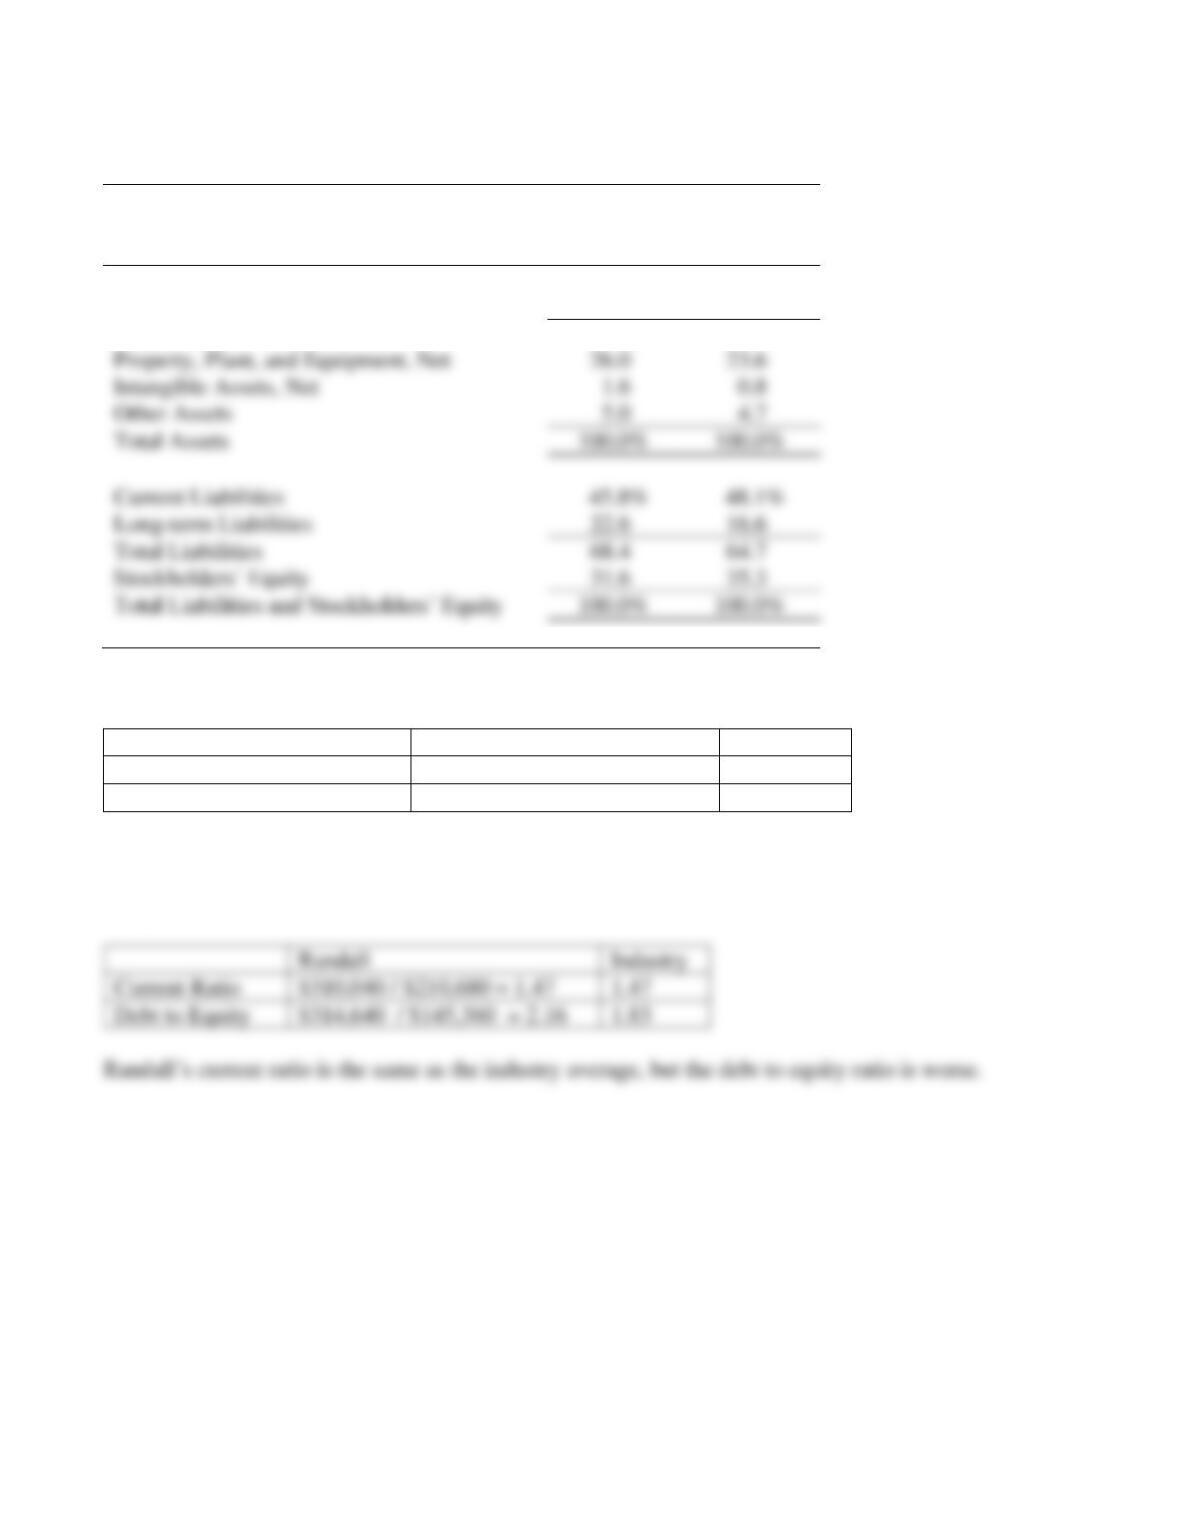
RANDALL DEPARTMENT STORES, INC.
Common-Size Balance Sheet
December 31, 2018
Randall
Average
Industry
Average
Current Assets
67.4%
70.9%
Requirement 2
Randall
Industry
Gross Profit Percentage
$255,258 / $783,000 = 32.6%
34.2%
Profit Margin Ratio
$85,347 / $783,000 = 10.9%
14.1%
Randall
Industry
Current Ratio
$310,040 / $210,680 = 1.47
1.47
Debt to Equity
$314,640 / $145,360 = 2.16
1.83
Randall’s gross profit percentage and profit margin ratio are both less than the industry average.
Requirement 3
Property, Plant, and Equipment, Net
Intangible Assets, Net
Other Assets
Total Assets
100.0%
100.0%
Current Liabilities
45.8%
48.1%
Long-term Liabilities
Total Liabilities
100.0%
100.0%

15–59
P15-33B Determining the effects of business transactions on selected ratios
Learning Objective 4
1. Earnings per Share $1.38
Financial statement data of Modern Traveler’s Magazine include the following items:
Cash
$
19,000
Accounts Receivable,
Net
82,000
Merchandise Inventory
183,000
Total Assets
638,000
Accounts Payable
102,000
Accrued Liabilities
35,000
Short-term Notes Payable
50,000
Long-term Liabilities
221,000
Net Income
69,000
Common Shares
Outstanding
50,000
shares
Requirements
1. Compute Modern Traveler’s current ratio, debt ratio, and earnings per share. Round all ratios to two
decimal places, and use the following format for your answer:
Current Ratio
Debt Ratio
Earnings per Share
2. Compute the three ratios after evaluating the effect of each transaction that follows. Consider each
transaction separately.
a. Purchased merchandise inventory of $42,000 on account.
b. Borrowed $121,000 on a long-term note payable.
c. Issued 5,000 shares of common stock, receiving cash of $103,000.
d. Received cash on account, $5,000.
15–60
P15-33B, cont.
SOLUTION
Requirement 1
Current Assets:
Current Liabilities:
Requirement 2
Current Ratio
Debt Ratio
Earnings per Share
a.
($284,000 + $42,000) /
($187,000 + $42,000) = 1.42
($408,000 + $42,000) /
($638,000 + $42,000) = 0.66
$69,000 / 50,000 shares = $1.38
$187,000 = 2.07
($638,000 + $103,000) =
0.55
d.
$284,000 / $187,000 = 1.52
$408,000 / $638,000 = 0.64
$69,000 / 50,000 shares = $1.38
Cash
Accounts Payable
Accounts Receivable
Accrued Liabilities
Merchandise Inventory
Short-Term Notes Payable
Total Current Assets
Total Current Liabilities
Long-Term Liabilities
Total Liabilities
Current Ratio
Debt Ratio
Earnings per Share
$284,000 / $187,000 = 1.52
$408,000 / $638,000 = 0.64
$69,000 / 50,000 shares = $1.38
P15-34B Using ratios to evaluate a stock investment
Learning Objective 4
1. 2017: e. 50.2%
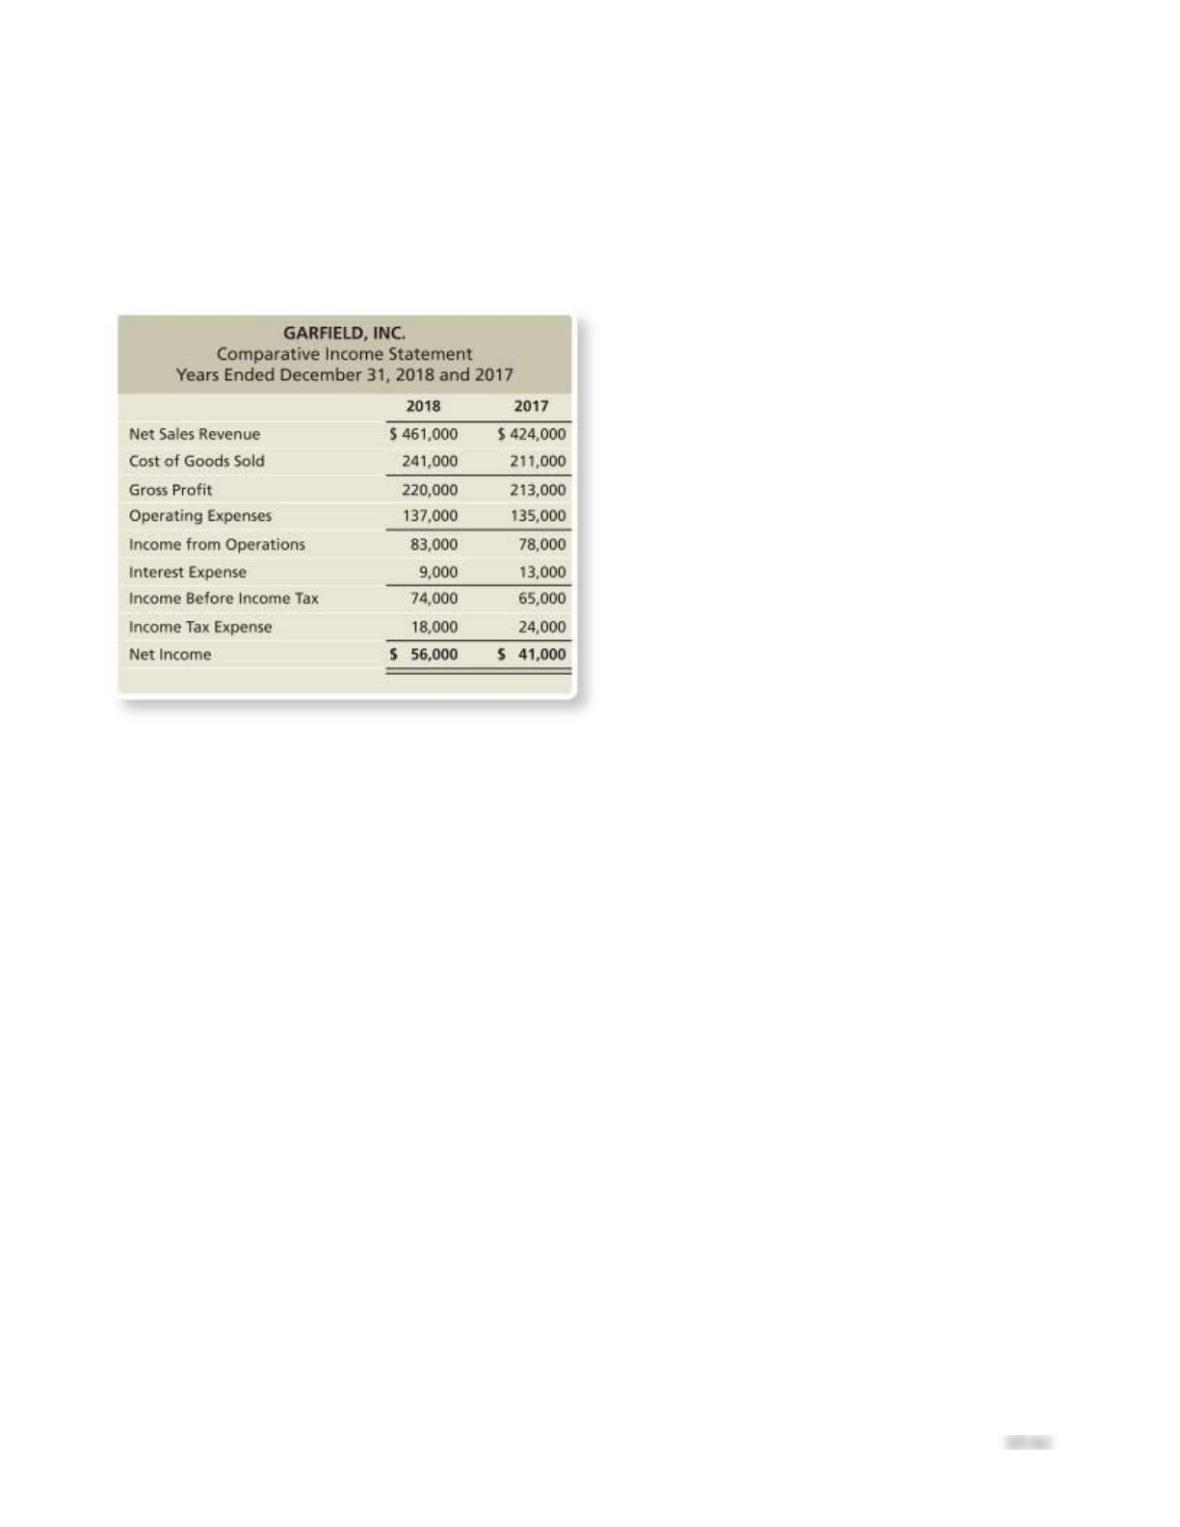
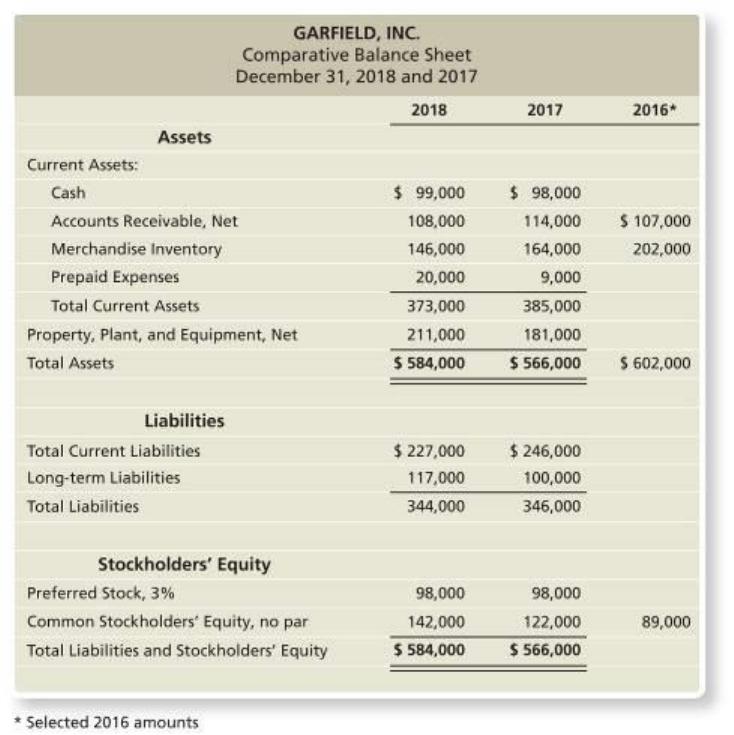
Comparative financial statement data of Garfield, Inc. follow:
15–62
P15-34B, cont.
1. Market price of Garfield’s common stock: $69.36 at December 31, 2018, and $38.04 at December 31,
2017.
2. Common shares outstanding: 14,000 on December 31, 2018 and 12,000 on December 31, 2017 and
2016.
3. All sales are on credit.
Requirements
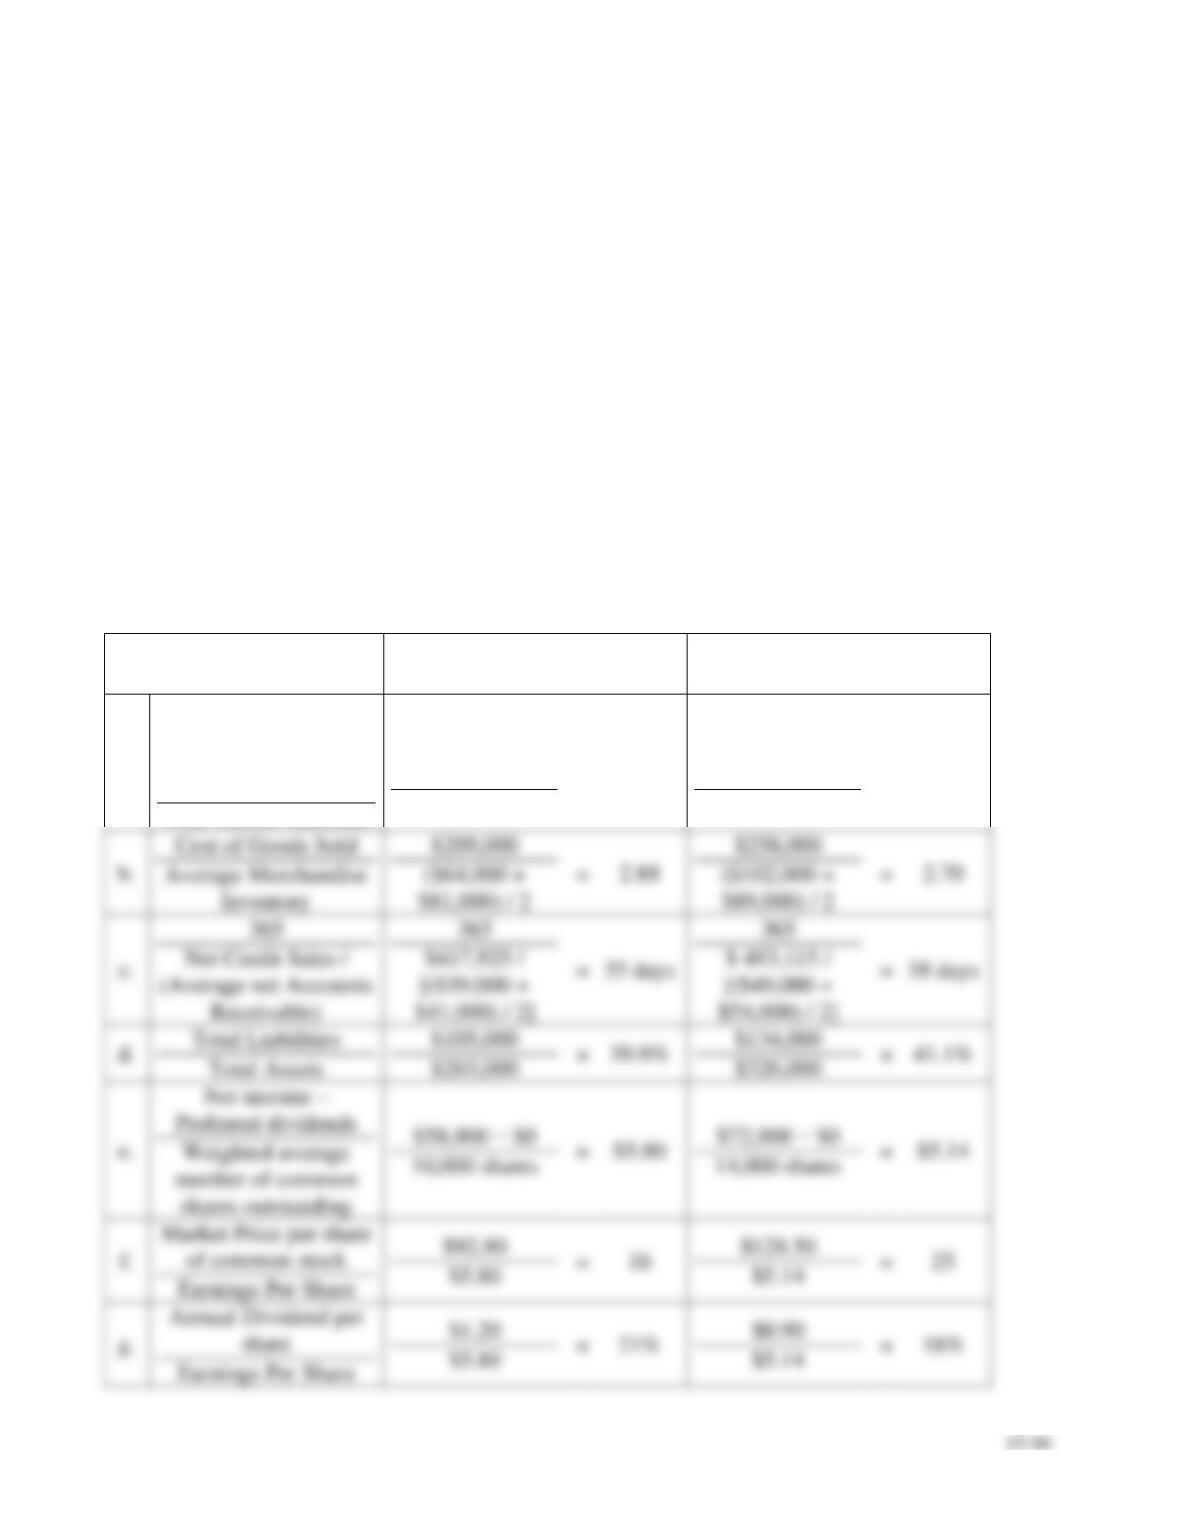
1. Compute the following ratios for 2018 and 2017:
a. Current ratio
b. Cash ratio
c. Times-interest-earned ratio
d. Inventory turnover
e. Gross profit percentage
P15-34B . cont.
f. Debt to equity ratio
g. Rate of return on common stockholders’ equity
h. Earnings per share of common stock
i. Price/earnings ratio
2. Decide (a) whether Garfield’s ability to pay debts and to sell inventory improved or deteriorated
during 2018 and (b) whether the investment attractiveness of its common stock appears to have
increased or decreased.
SOLUTION
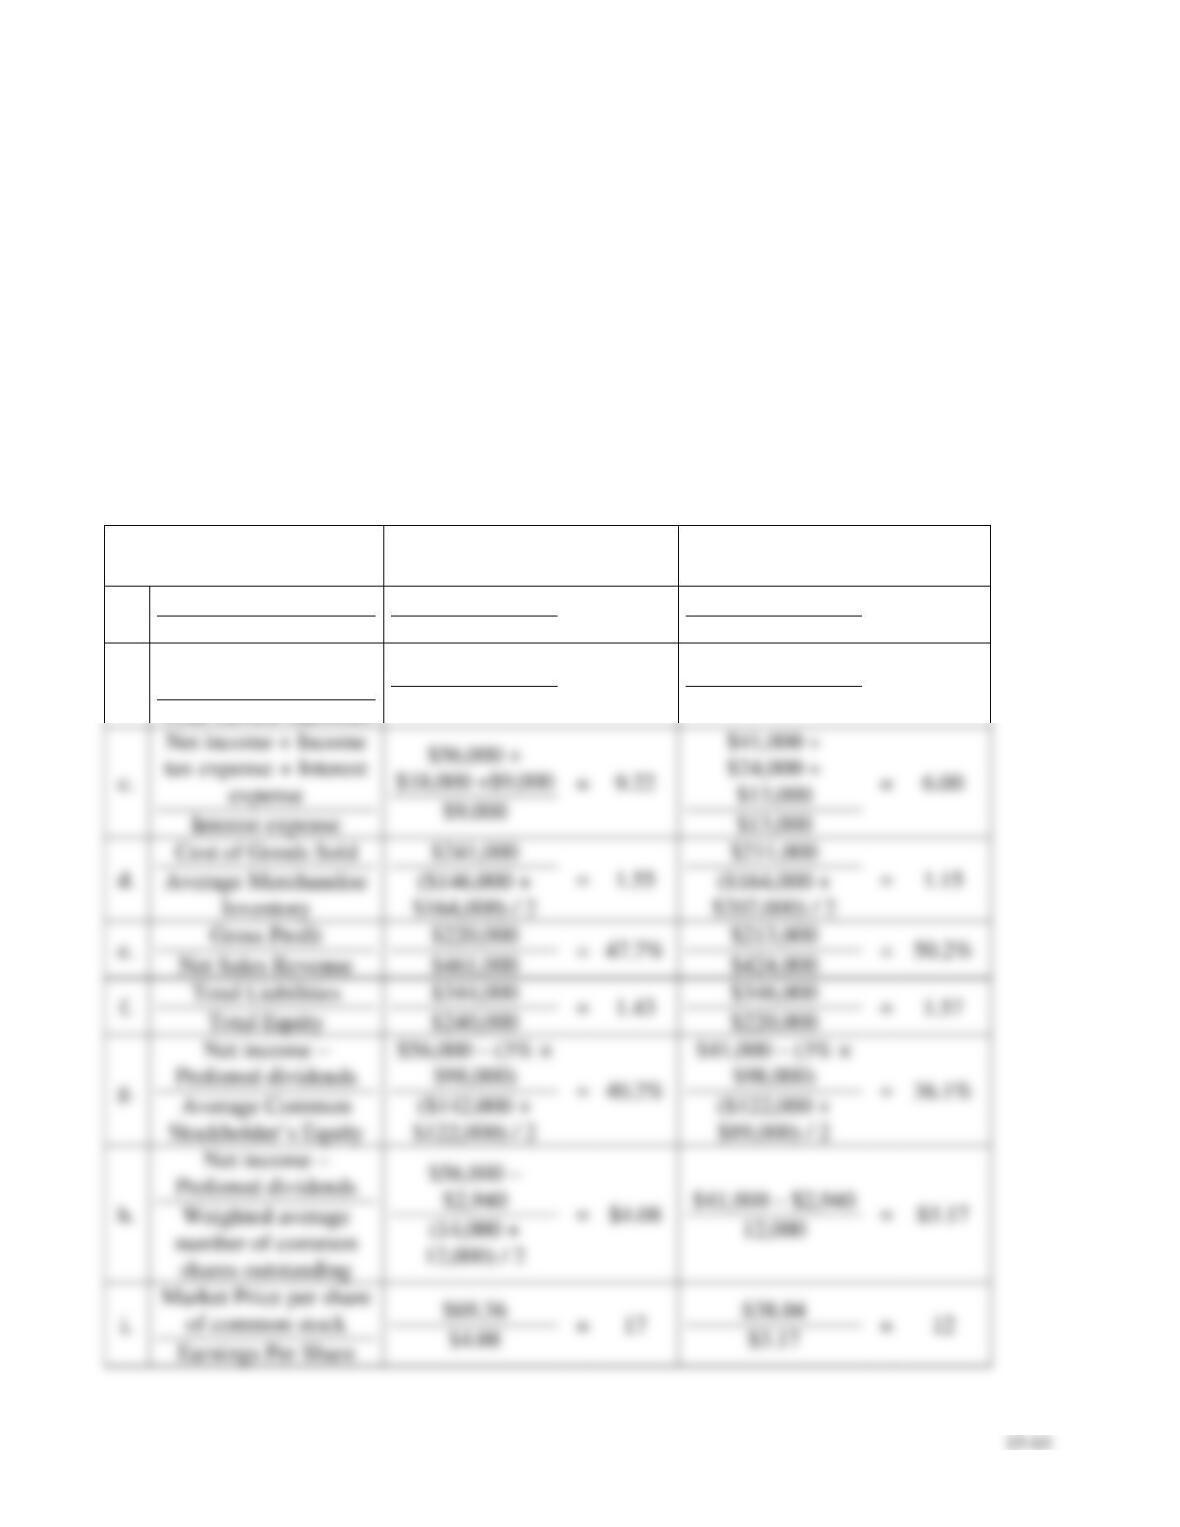
Requirement 1
2018
2017
a.
Total current assets
Total current liabilities
$373,000
$227,000
=
1.64
$385,000
$246,000
=
1.57
b.
Cash + Cash
equivalents
Total current liabilities
$99,000 + $0
$227,000
=
0.44
$98,000 + $0
$246,000
=
0.40
d.
=
1.55
=
1.15
$461,000
$424,000
$344,000
$240,000
=
1.43
$346,000
$220,000
=
1.57
15–64
P15-34B . cont.
Requirement 2
a. Garfield is in a better position to pay debt in 2018 than in 2017. The current ratio, cash ratio, and
P15-35B Using ratios to decide between two stock investments
Learning Objective 4
1c. Green Zone 38 days
Assume that you are purchasing an investment and have decided to invest in a company in the digital
phone business. You have narrowed the choice to All Digital Corp. and Green Zone, Inc. and have
assembled the following data.
Selected income statement data for the current year:
All Digital
Green Zone
Net Sales Revenue (all on credit)
$ 417,925
$ 493,115
Cost of Goods Sold
209,000
258,000
Interest Expense
0
14,000
Net Income
58,000
72,000

P15-35B, cont.
Selected balance sheet and market price data at the end of the current year:
All Digital
Green Zone
Current Assets:
Cash
$ 23,000
$ 18,000
Short-term Investments
37,000
17,000
Accounts Receivable, Net
39,000
49,000
Merchandise Inventory
64,000
102,000
Prepaid Expenses
21,000
17,000
Total Current Assets
$ 184,000
$ 203,000
Total Assets
$ 263,000
$ 326,000
Total Current Liabilities
105,000
99,000
Total Liabilities
105,000
134,000
Common Stock:
$1 par (10,000 shares)
10,000
$2 par (14,000 shares)
28,000
Total Stockholders’ Equity
158,000
192,000
Market Price per Share of Common Stock
92.80
128.50
Dividends Paid per Common Share
1.20
0.90
Selected balance sheet data at the beginning of the current year:
All Digital
Green Zone
Balance Sheet:
Accounts Receivable, Net
$ 41,000
$ 54 000
Merchandise Inventory
81,000
89,000
Total Assets
258,000
277,000
Common Stock:
$1 par (10,000 shares)
10,000
$2 par (14,000 shares)
28,000
Your strategy is to invest in companies that have low price/earnings ratios but appear to be in good
shape financially. Assume that you have analyzed all other factors and that your decision depends on the
results of ratio analysis.
P15-35B, cont.
Requirements
1. Compute the following ratios for both companies for the current year:
a. Acid-test ratio
b. Inventory turnover
c. Days’ sales in receivables
d. Debt ratio
e. Earnings per share of common stock
f. Price/earnings ratio
g. Dividend payout
2. Decide which company’s stock better fits your investment strategy.
SOLUTION
Requirement 1
All Digital
Green Zone
a.
Cash + Cash
equivalents + Short-
term Investments +
Accounts Receivable
Total current liabilities
($23,000 + $0 +
$37,000 +
$39,000)
$105,000
=
0.94
($18,000 + $0 +
$17,000 +
$49,000)
$99,000
=
0.85

15–67
P15-35B, cont.
Requirement 2
All Digital would be the better investment based on the strategy of a low price earnings ratio, with

15–68
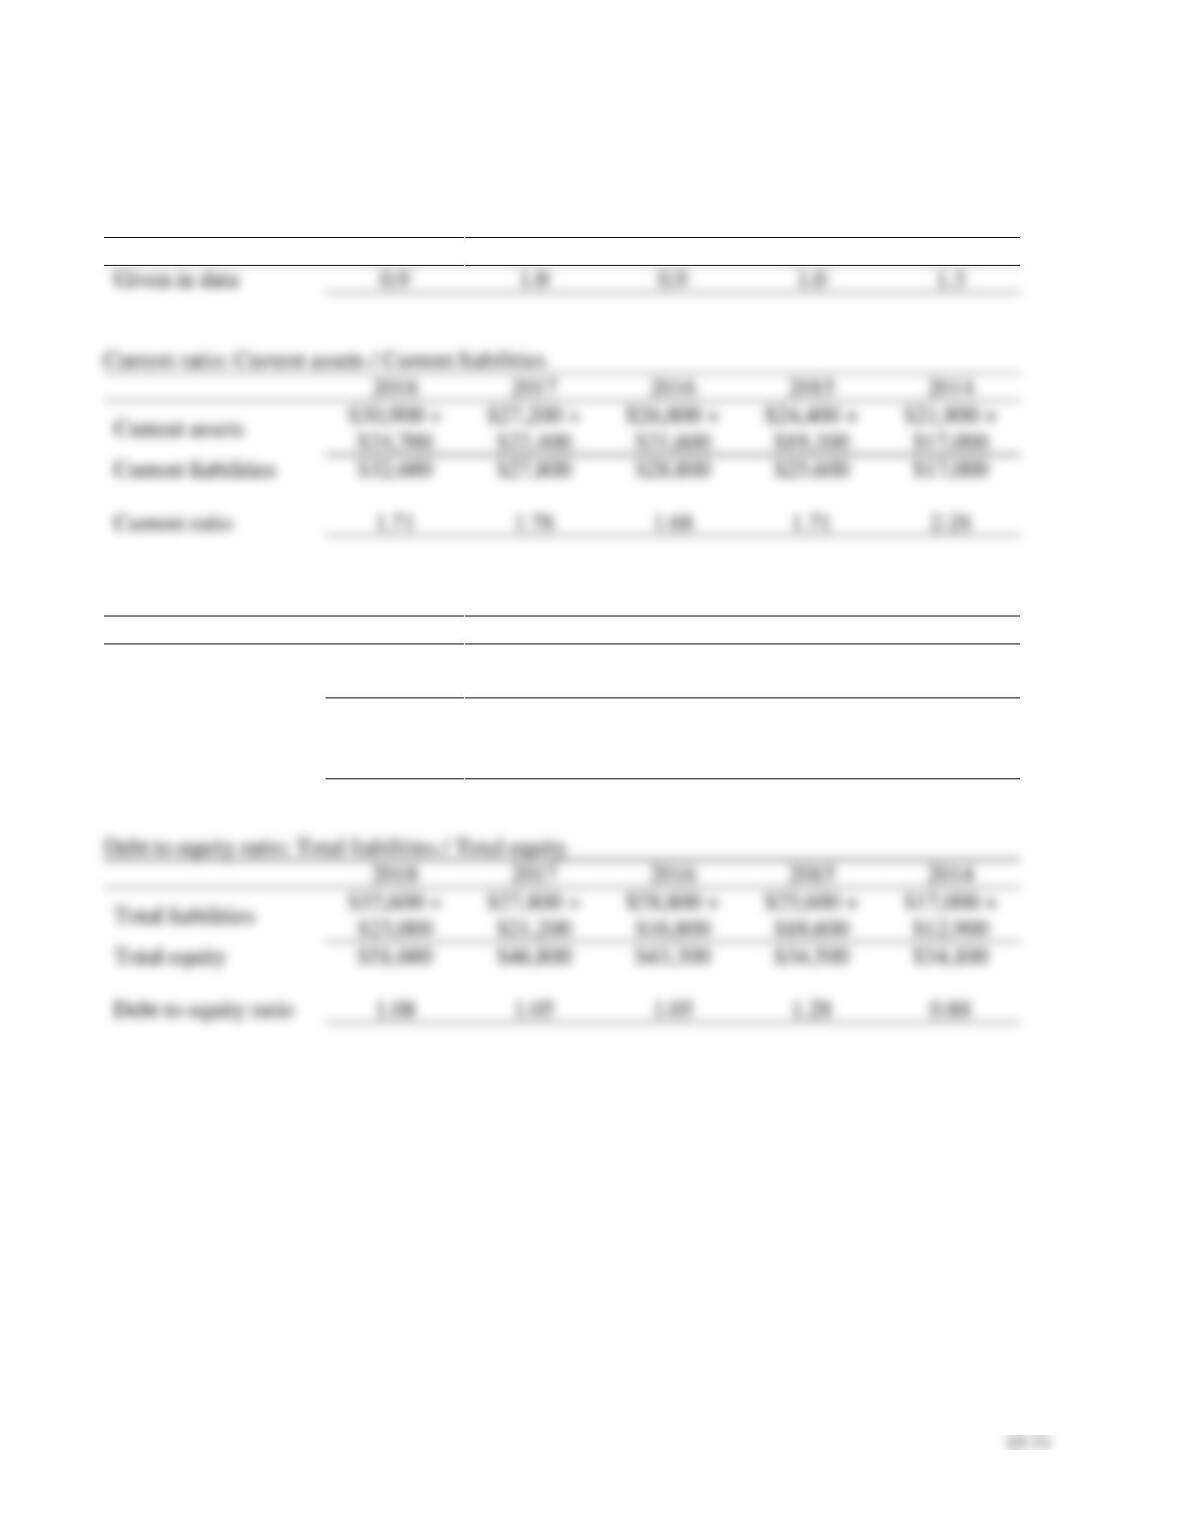
P15-36B Completing a comprehensive financial statement analysis
Learning Objectives 2, 4
3. 2018: Inventory turnover 8.86
In its annual report, XYZ Athletic Supply, Inc. includes the following five-year financial summary:
XYZ ATHLETIC SUPPLY, INC.
Five-Year Financial Summary (Partial; adapted)
(Dollar amounts in thousands
except per share data)
2018
2017
2016
2015
2014
2013
Net Sales Revenue
$ 275,000
$ 222,000
$ 199,000
$ 171,000
$ 131,000
Net Sales Revenue Increase
24%
12%
16%
31%
17%
Domestic Comparative Store
Sales Increase
6%
6%
5%
8%
10%
Other Income—Net
2,090
1,780
1,770
1,700
1,310
Cost of Goods Sold
208,725
169,386
154,822
134,235
103,883
Selling and Administrative
Expenses
41,280
36,340
31,670
27,450
22,540
Interest:
Interest Expense
(1,070)
(1,370)
(1,330)
(1,100)
(800)
Interest Income
140
155
150
230
140
Income Tax Expense
4,420
3,900
3,610
3,390
2,730
Net Income
21,735
12,939
9,488
6,755
2,497
Per Share of Common Stock:
Net Income
1.10
0.80
0.70
0.50
0.28
Dividends
0.45
0.43
0.39
0.35
0.31
Financial Position
Current Assets, Excluding
Merchandise Inventory
$ 30,900
$ 27,200
$ 26,800
$ 24,400
$ 21,800
Merchandise Inventory
24,700
22,400
21,600
19,300
17,000
$ 16,800
Property, Plant, and Equipment,
Net
51,600
46,200
40,500
35,000
25,200
Total Assets
107,200
95,800
88,900
78,700
64,000
Current Liabilities
32,600
27,800
28,800
25,600
17,000
Long-term Debt
23,000
21,200
16,800
18,600
12,900
Stockholders’ Equity
51,600
46,800
43,300
35,500
34,100
Financial Ratios
Acid-Test Ratio
0.9
1.0
0.9
1.0
1.3
Rate of Return on Total Assets
22.5%
15.5%
12.8%
10.9%
9.9%
Rate of Return on Common
44.2%
28.7%
24.1%
19.4%
18.9%
Stockholders’ Equity
Requirements
Analyze the company’s financial summary for the fiscal years 2014–2018 to decide whether to invest in
the common stock of XYZ. Include the following sections in your analysis.
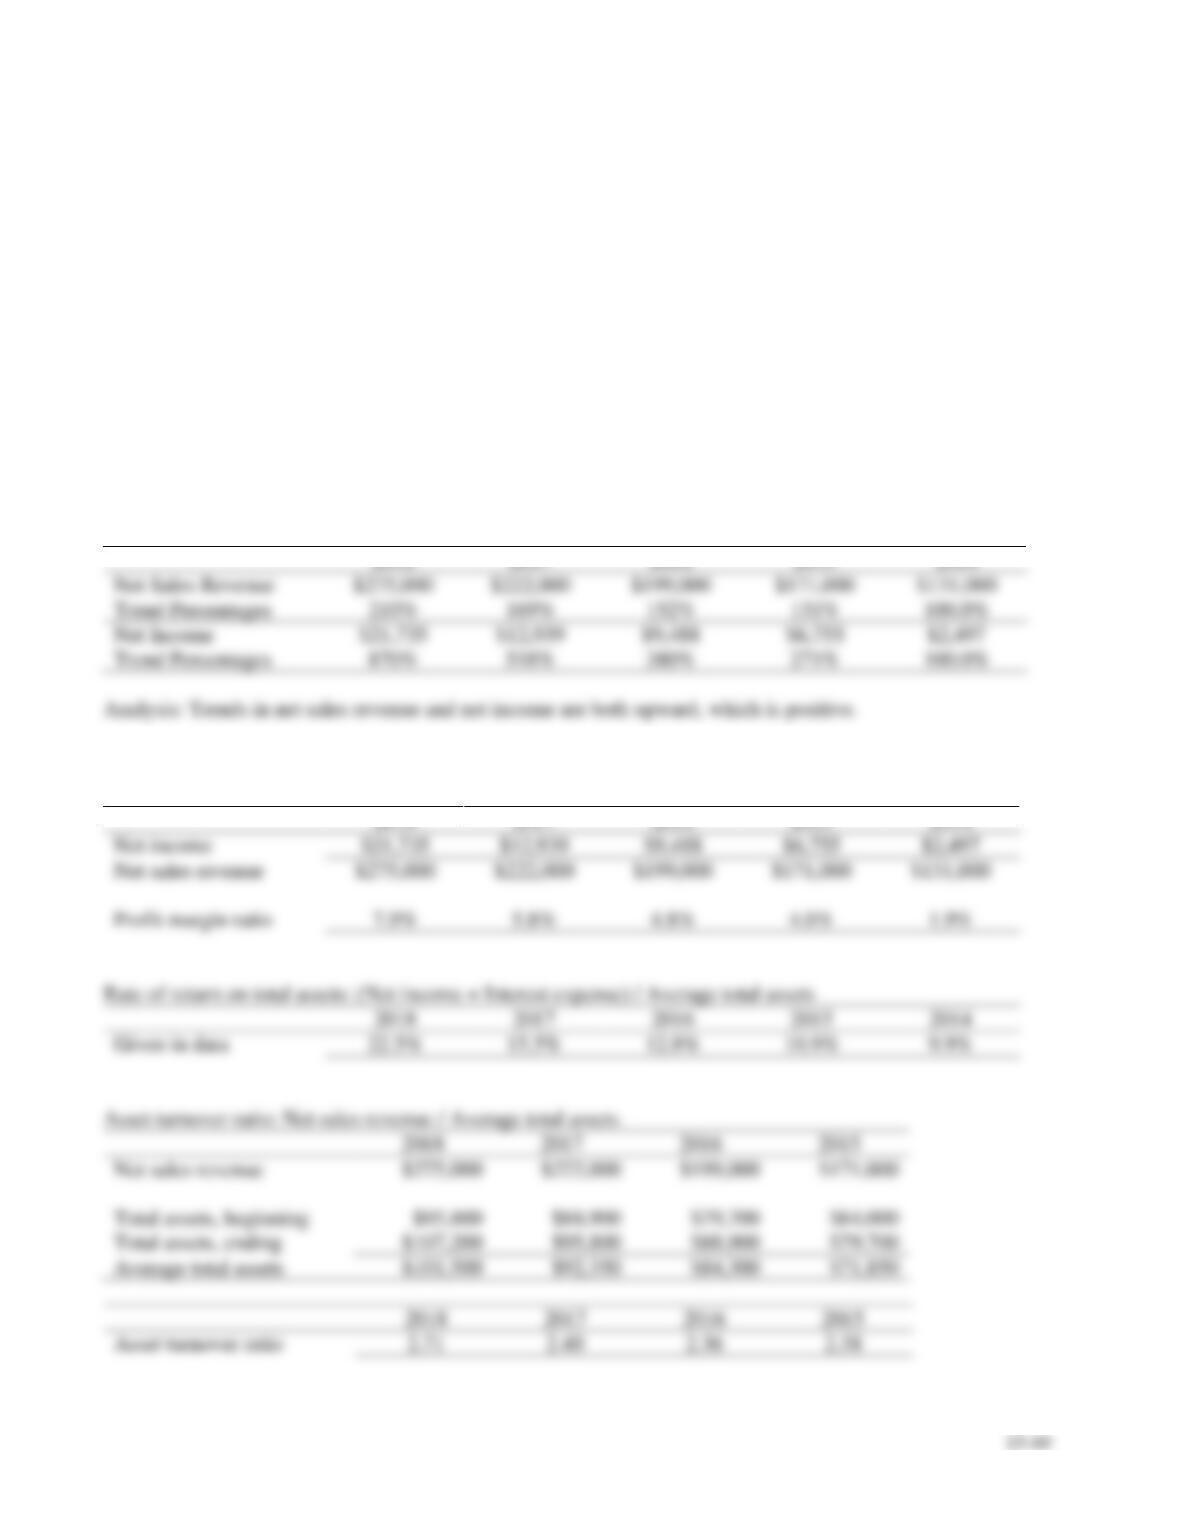
1. Trend analysis for net sales revenue and net income (use 2014 as the base year).
2. Profitability analysis.
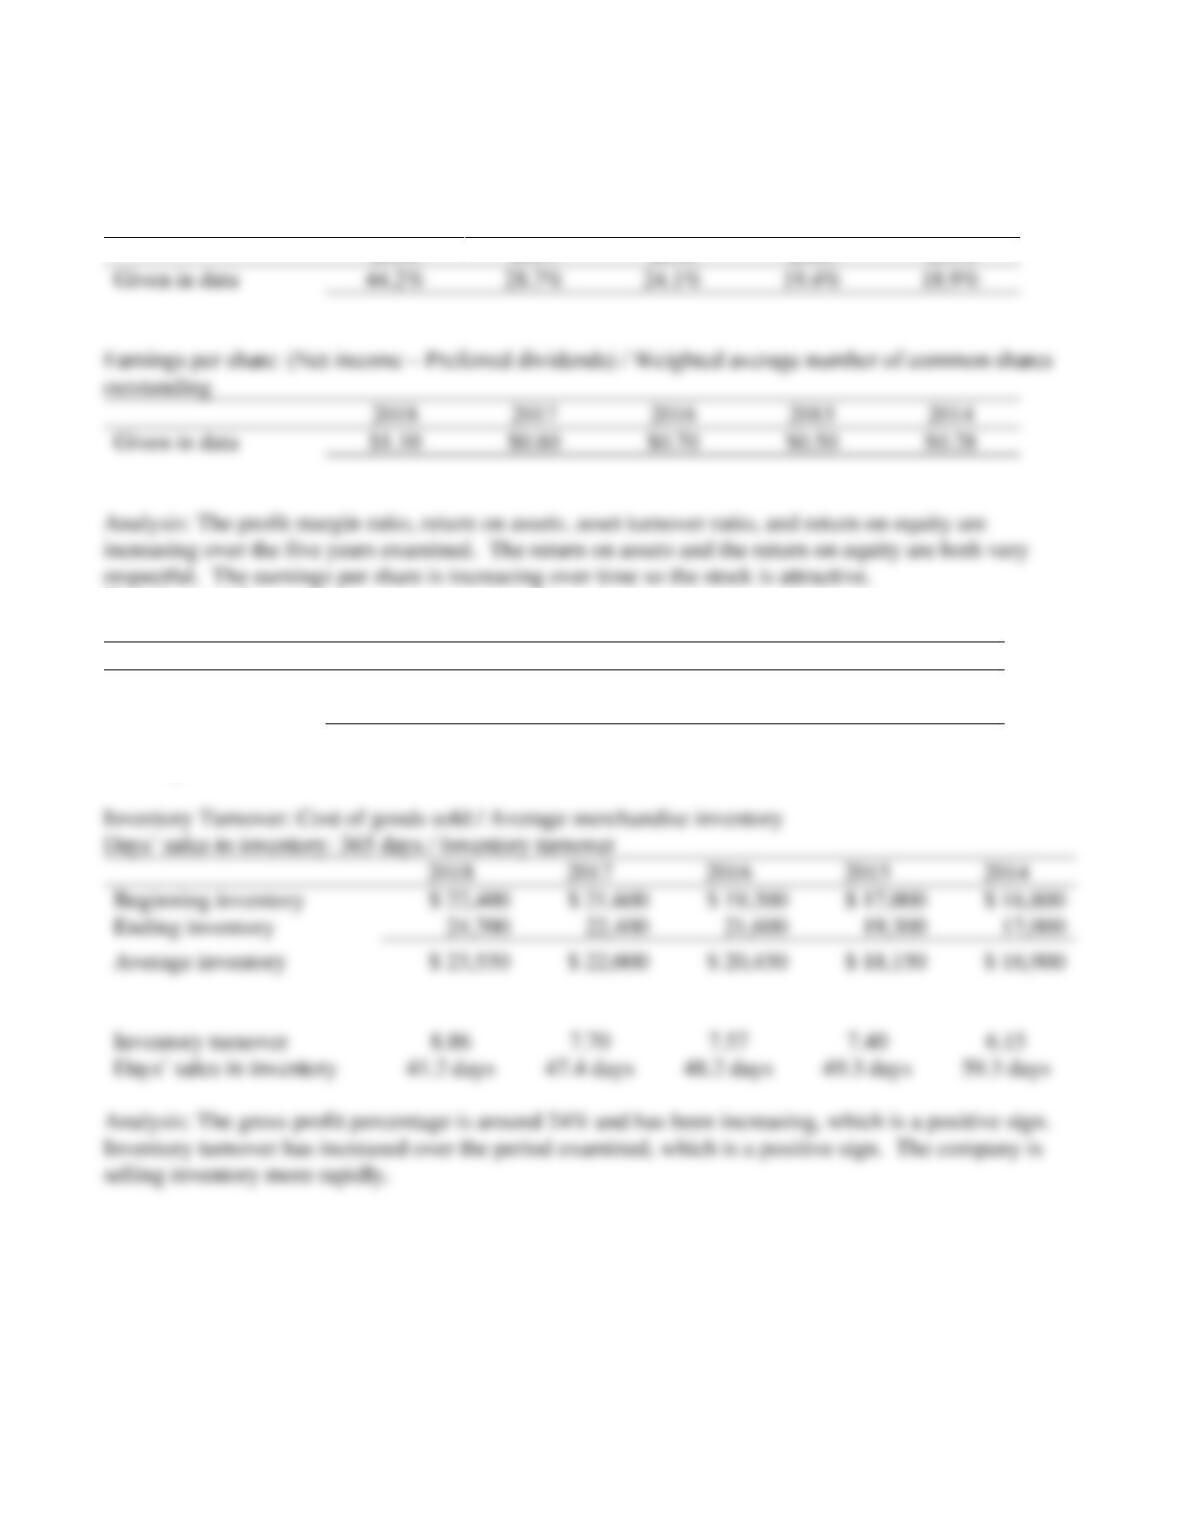
3. Evaluation of the ability to sell merchandise inventory.
4. Evaluation of the ability to pay debts.
5. Evaluation of dividends.
6. Should you invest in the common stock of XYZ Athletic Supply, Inc.? Fully explain your final
decision
SOLUTION
Requirement 1
Requirement 2
Profit margin ratio: Net income / Net sales revenue
15–70
P15-36B, cont.
Requirement 2, cont.
Rate of return on common stockholders’ equity: (Net income ‒ Preferred dividends) / Average common
stockholders’ equity
2018
2017
2016
2015
2014
Requirement 3
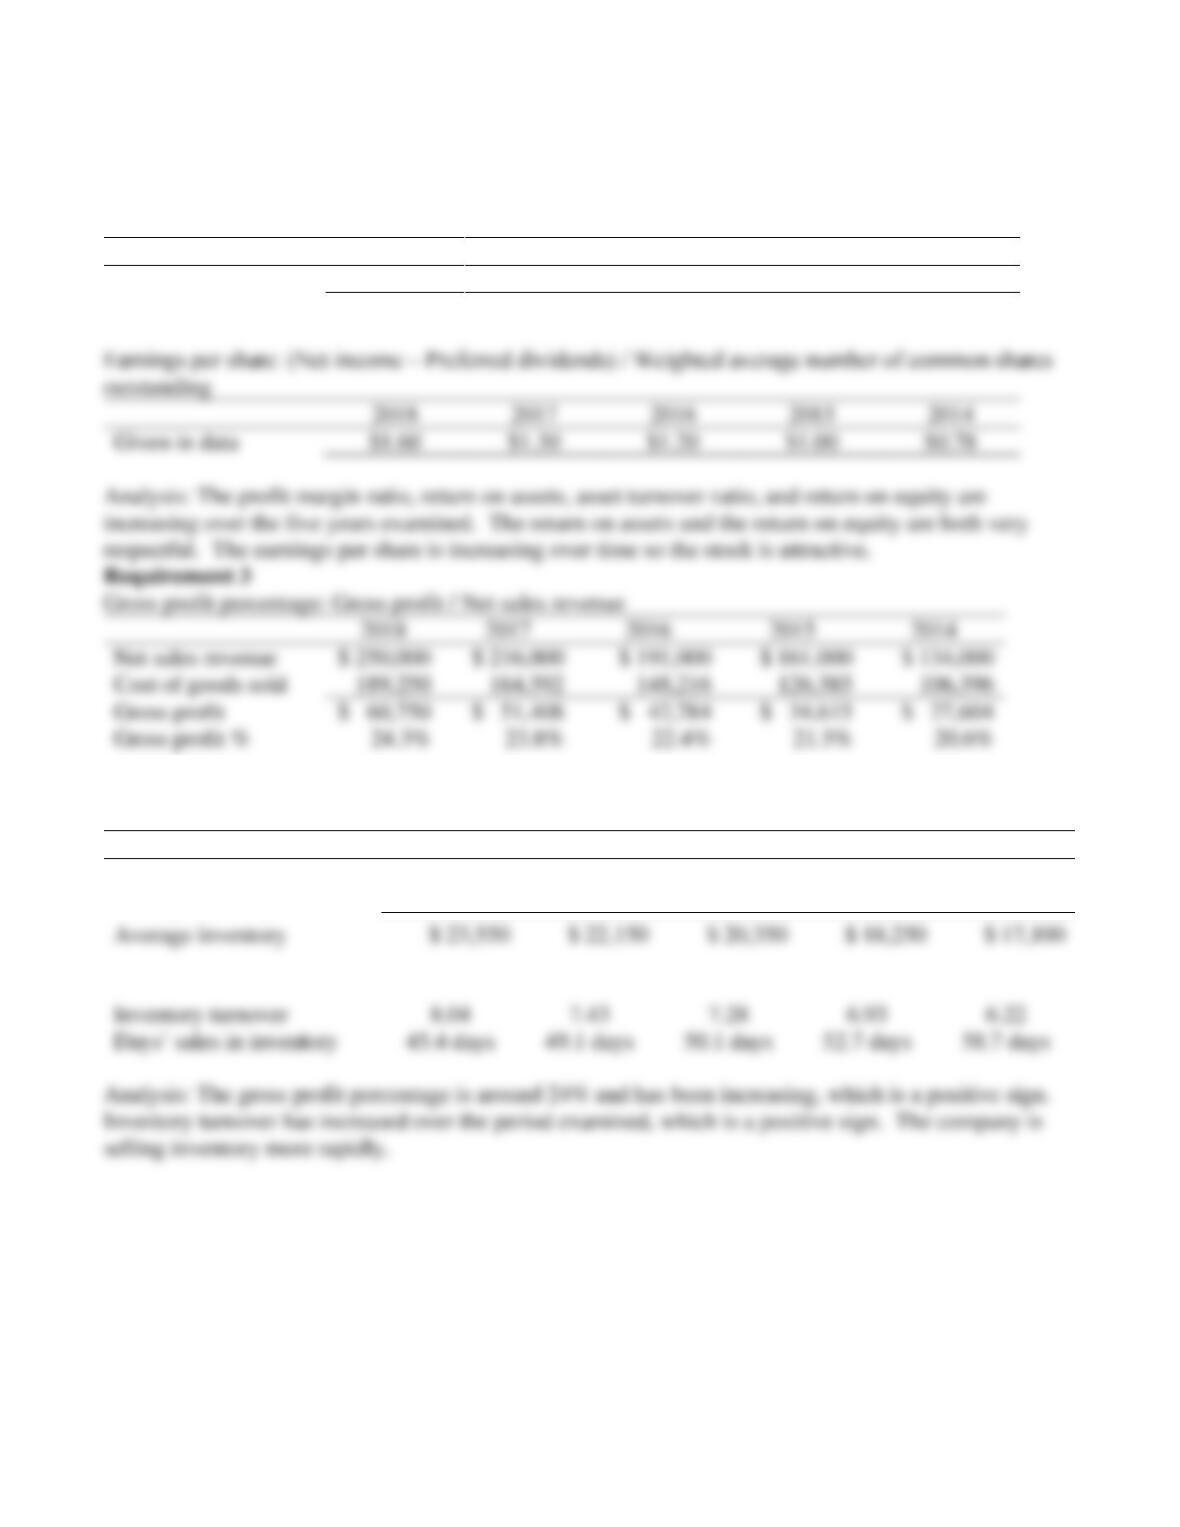
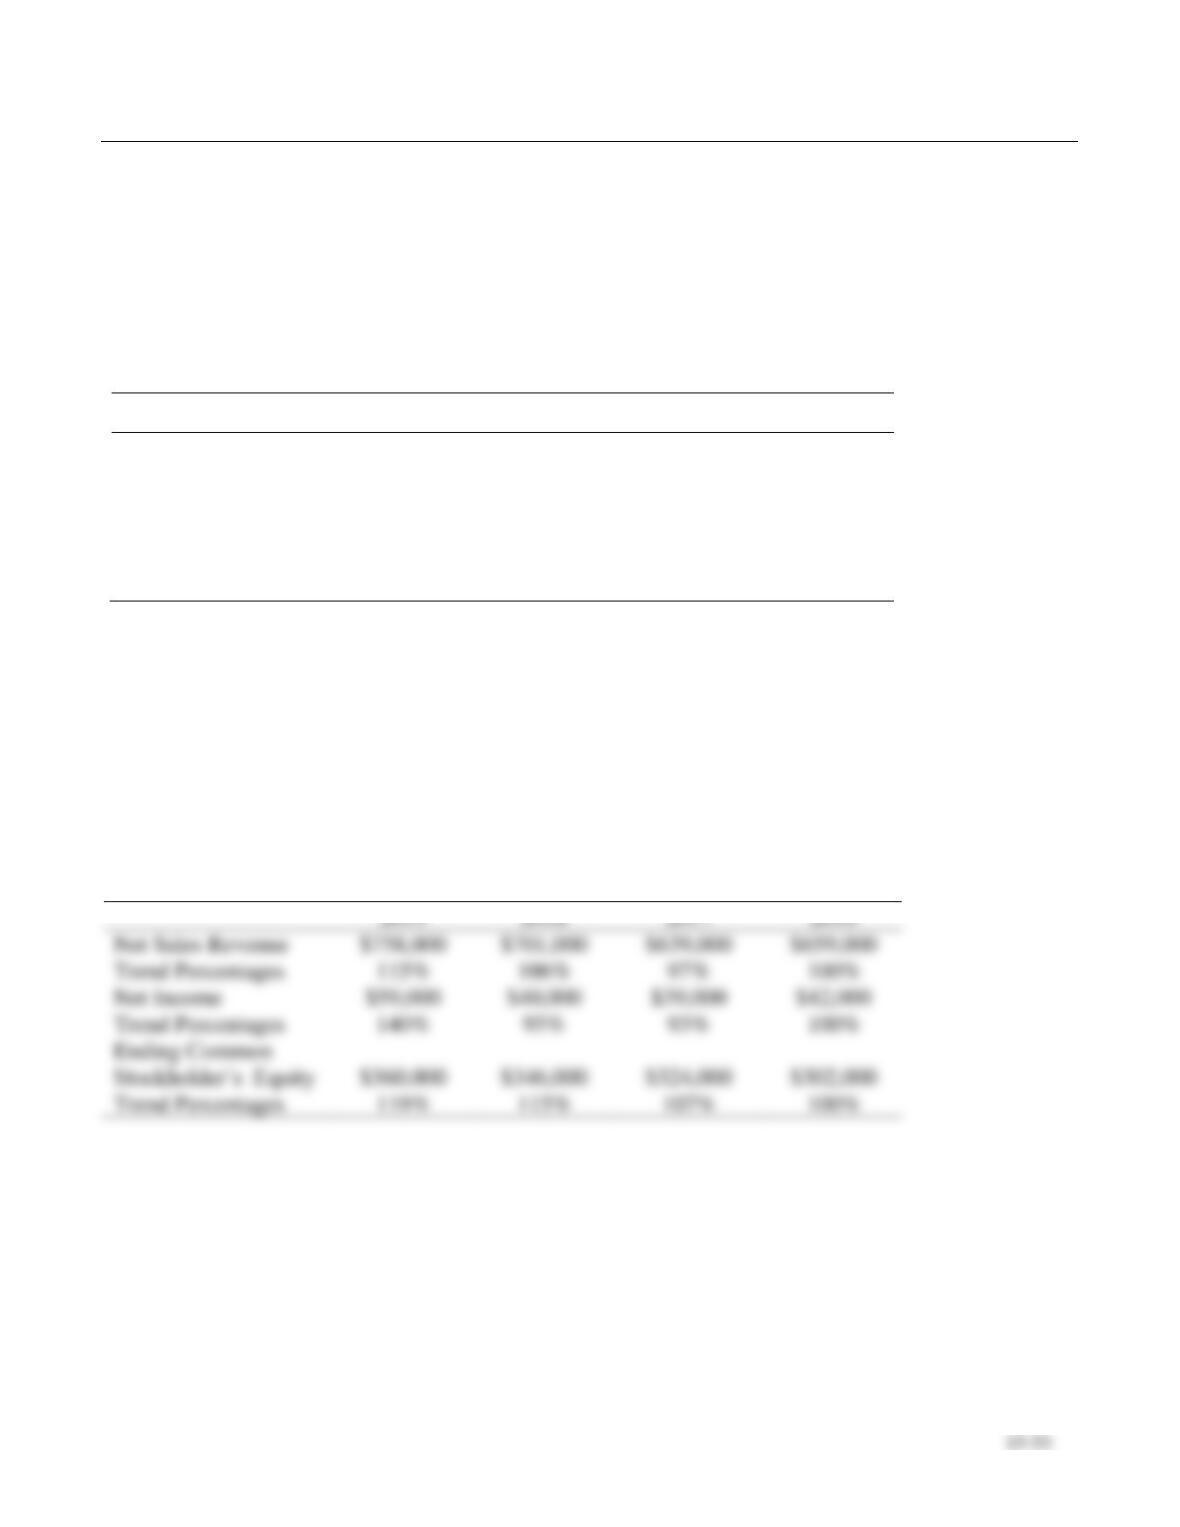
Gross profit percentage: Gross profit / Net sales revenue
2018
2017
2016
2015
2014
Net sales revenue
$ 275,000
$ 222,000
$ 199,000
$ 171,000
$ 131,000
Cost of goods sold
208,725
169,386
154,822
134,235
103,883
Gross profit
$ 66,275
$ 52,614
$ 44,178
$ 36,765
$ 27,117
Gross profit %
24.1%
23.7%
22.2%
21.5%
20.7%
2018
2017
2016
2015
2014
Beginning inventory
$ 22,400
$ 21,600
$ 19,300
$ 17,000
$ 16,800
Ending inventory
24,700
22,400
21,600
19,300
17,000
Average inventory
$ 23,550
$ 22,000
$ 20,450
$ 18,150
$ 16,900
Inventory turnover
Given in data
2018
2017
2016
2015
2014
Given in data
$1.10
$0.80
$0.70
$0.50
$0.28
P15-36B, cont.
Requirement 4
Acid-test ratio: (Cash + Cash equivalents + Short-term investments + Net current receivables) / Current
liabilities
2018
2017
2016
2015
2014
Given in data
2018
2017
2016
2015
2014
$30,900 +
$24,700
$27,200 +
$22,400
$26,800 +
$21,600
$24,400 +
$19,300
$21,800 +
$17,000
Current liabilities
$32,600
$27,800
$28,800
$25,600
$17,000
Current ratio
Debt ratio: Total liabilities / Total assets
2018
2017
2016
2015
2014
Total liabilities
$32,600 +
$23,000
$27,800 +
$21,200
$28,800 +
$16,800
$25,600 +
$18,600
$17,000 +
$12,900
Total assets
$107,200
$95,800
$88,900
$79,700
$64,000
Debt ratio
51.9%
51.1%
51.3%
55.5%
46.7%
2018
2017
2016
2015
2014
$32,600 +
$23,000
$27,800 +
$21,200
$28,800 +
$16,800
$25,600 +
$18,600
$17,000 +
$12,900
Total equity
$51,600
$46,800
$43,300
$34,500
$34,100
Debt to equity ratio
15–72
P15-36B, cont.
Requirement 4, cont.
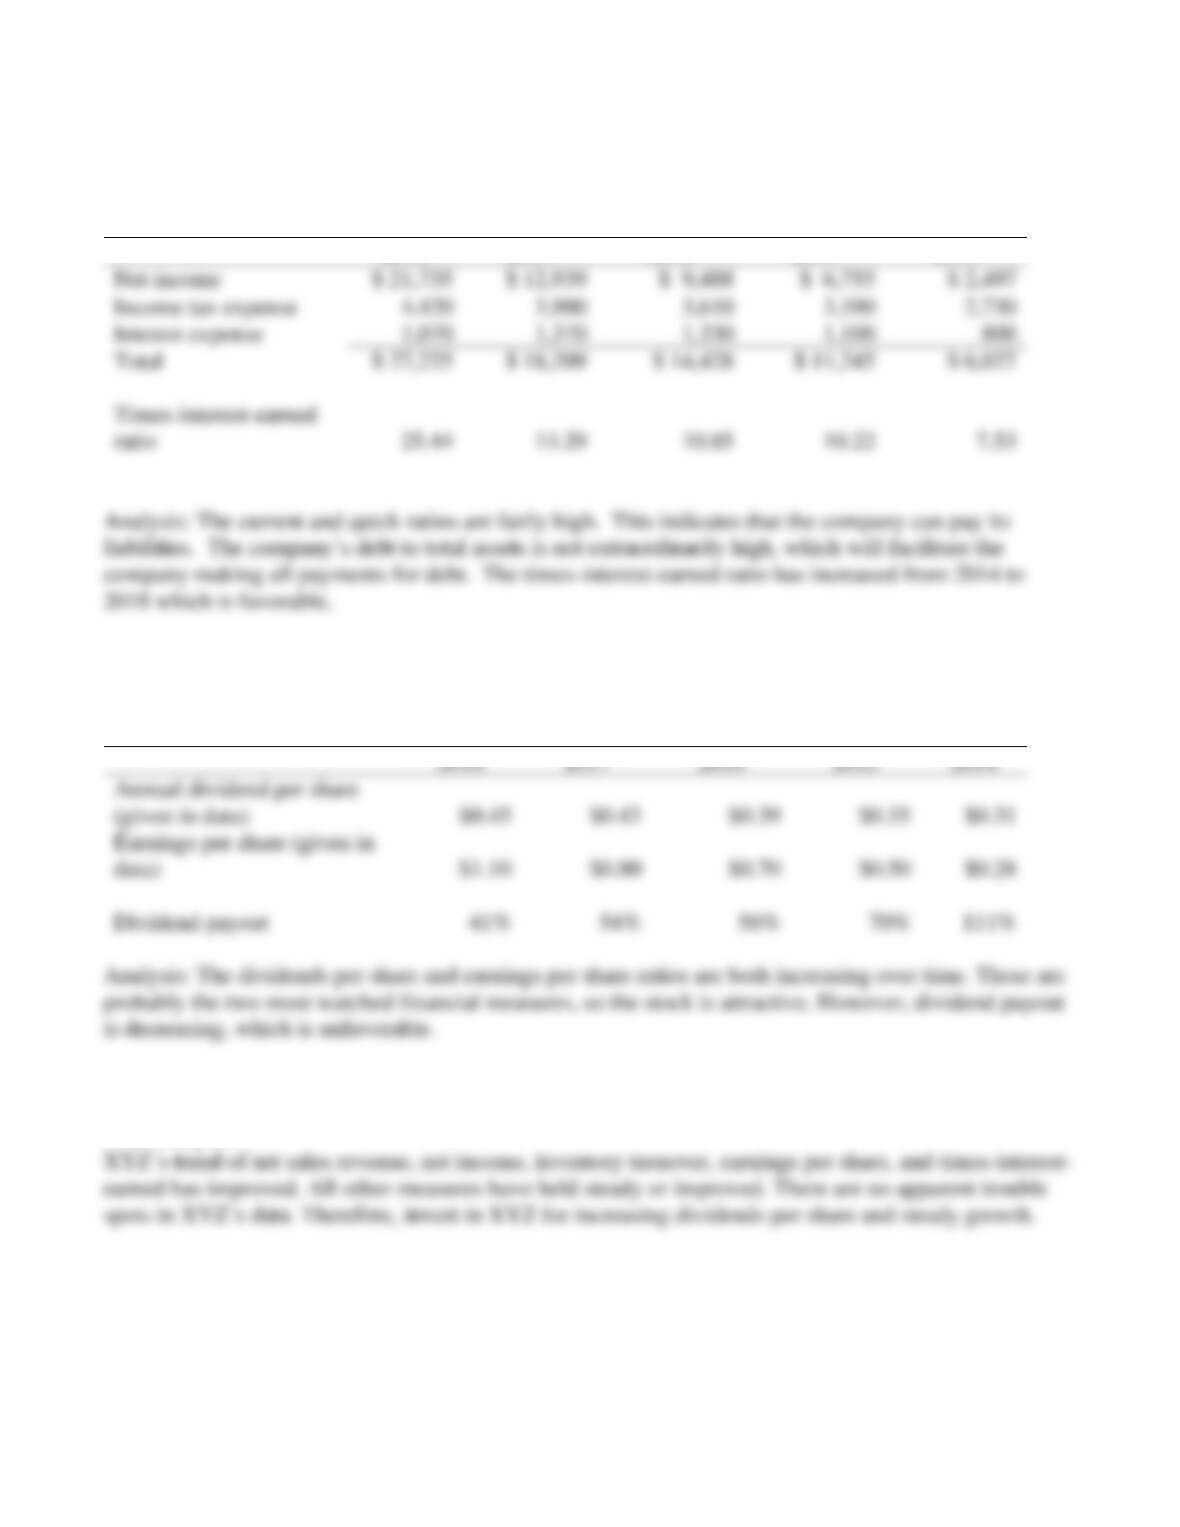
Times interest earned ratio: (Net income + income tax expense + Interest expense) / Interest expense
2018
2017
2016
2015
2014
Requirement 5
Dividend payout: Annual dividend per share / Earnings per share
(given in data)
$0.31
data)
$0.28
Dividend payout
Requirement 6
Final analysis:
Net income
Income tax expense
Interest expense
Total
$ 11,245
ratio
15–73
Excel Skill Problem
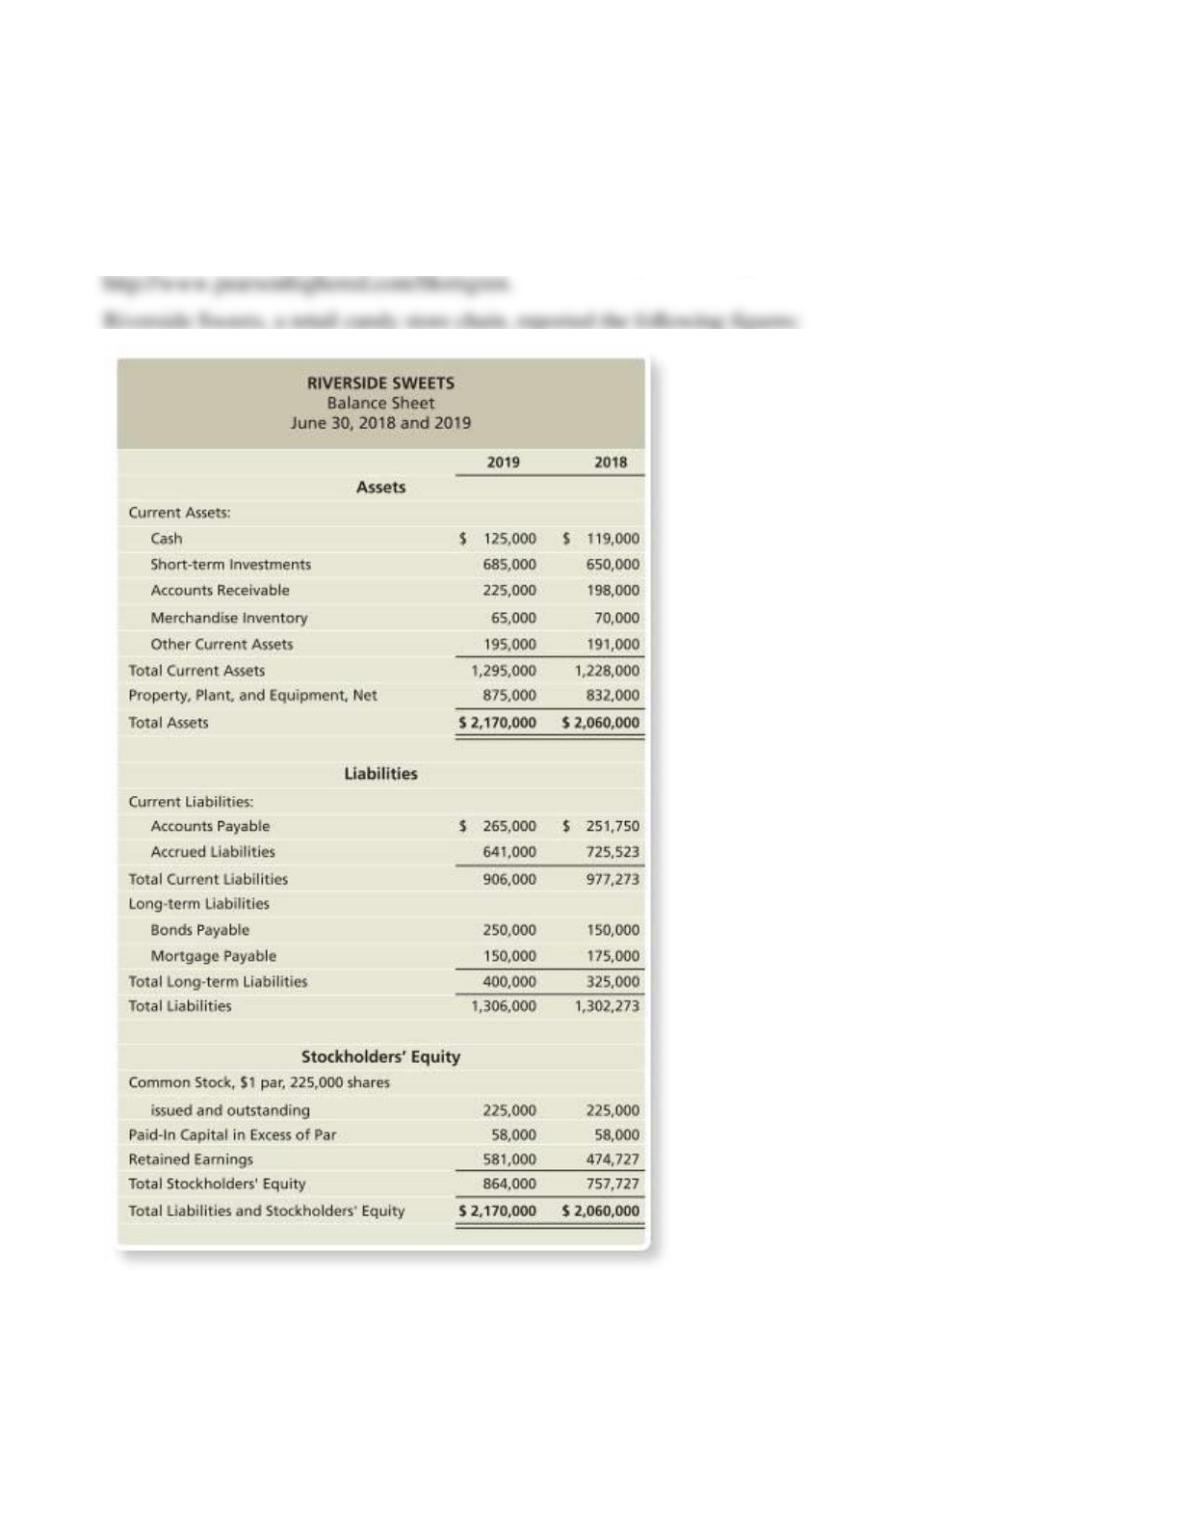
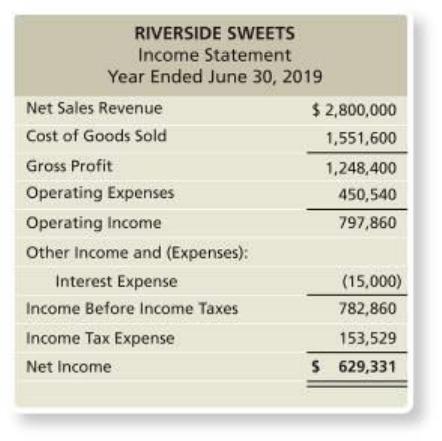
P15-37 Using Excel for financial statement analysis
Download an Excel template for this problem online in MyAccountingLab or at
15–74
Additional financial information:
a. 75% of net sales revenue are on account.
b. Market price of stock is $36 per share on June 30, 2019.
c. Annual dividend for 2019 was $1.50 per share.
d. All short-term investments are cash equivalents.
Requirements
1. Perform a horizontal analysis on the balance sheet for 2018 and 2019.
2. Perform a vertical analysis on the income statement.
3. Compute the following ratios:
a. Working Capital
b. Current Ratio
c. Acid-Test (Quick) Ratio
d. Cash Ratio
e. Accounts Receivable Turnover
f. Days’ Sales in Receivables
g. Inventory Turnover
h. Days’ Sales in Inventory
i. Gross Profit Percentage
j. Debt Ratio
k. Debt to Equity Ratio
l. Times-Interest-Earned Ratio
m. Profit Margin Ratio
n. Rate of Return on Total Assets
15–75
o. Asset Turnover Ratio
p. Rate of Return on Common Stockholders’ Equity
q. Earnings per Share (EPS)
r. Price/Earnings Ratio
s. Dividend Yield
t. Dividend Payout
SOLUTION
The student templates for Using Excel are available online in MyAccountingLab in the Multimedia
15–76
Continuing Problem
P15-38 Using ratios to evaluate a stock investment
This problem continues the Canyon Canoe Company situation from Chapter 14. The company wants to
invest some of its excess cash in trading securities and is considering two investments, The Paddle
Company (PC) and Recreational Life Vests (RLV). The income statement, balance sheet, and other data
for both companies follow for 2019 and 2018, as well as selected data for 2017:
THE PADDLE COMPANY
RECREATIONAL LIFE VESTS
Comparative Financial Statements
Comparative Financial
Statements
Years Ended December 31
Years Ended December 31
Income Statement
2019
2018
2017
2019
2018
2017
Net Sales Revenue
$ 430,489
$ 425,410
$ 410,570
$ 383,870
Cost of Goods Sold
258,756
256,797
299,110
280,190
Gross Profit
171,733
168,613
111,460
103,680
Operating Expenses
153,880
151,922
78,290
70,830
Operating Income
17,853
16,691
33,170
32,850
Interest Expense
865
788
2,780
2,980
Income before Income Tax
16,988
15,903
30,390
29,870
Income Tax Expense
5,137
4,809
8,780
8,630
Net Income
$ 11,851
$ 11,094
$ 21,610
$ 21,240
Balance Sheet
Assets
Cash & Cash Equivalents
$ 69,159
$ 70,793
$ 65,730
$ 55,270
Accounts Receivable
44,798
44,452
$ 44,104
39,810
38,650
$ 36,460
Merchandise Inventory
79,919
66,341
76,363
68,500
65,230
59,930
Other Current Assets
15,494
16,264
24,450
37,630
Total Current Assets
209,370
197,850
198,490
196,780
Long-term Assets
89,834
90,776
116,760
116,270
Total Assets
$ 299,204
$ 288,626
$ 276,482
$ 315,250
$ 313,050
$ 310,640
Liabilities
Current Liabilities
$ 69,554
$ 60,232
$ 90,810
$ 90,010
Long-term Liabilities
31,682
29,936
96,310
105,890
Total Liabilities
101,236
90,168
187,120
195,900
Stockholders’ Equity
Common Stock
72,795
80,885
111,530
102,480
Retained Earnings
125,173
117,573
16,600
14,670
197,968
198,458
128,130
117,150
103,840

15–77
Total Liabilities and
Stockholder’s Equity
$ 299,204
$ 288,626
$ 315,250
$ 313,050
Other Data
Market price per share
$ 21.38
$ 33.82
$ 46.37
$ 51.64
Annual dividend per share
0.32
0.30
0.53
0.45
Weighted average number of
shares outstanding
9,000
8,000
9,000
8,000
Requirements
1. Using the financial statements given, compute the following ratios for both companies for 2019 and
2018. Assume all sales are credit sales. Round all ratios to two decimal places.
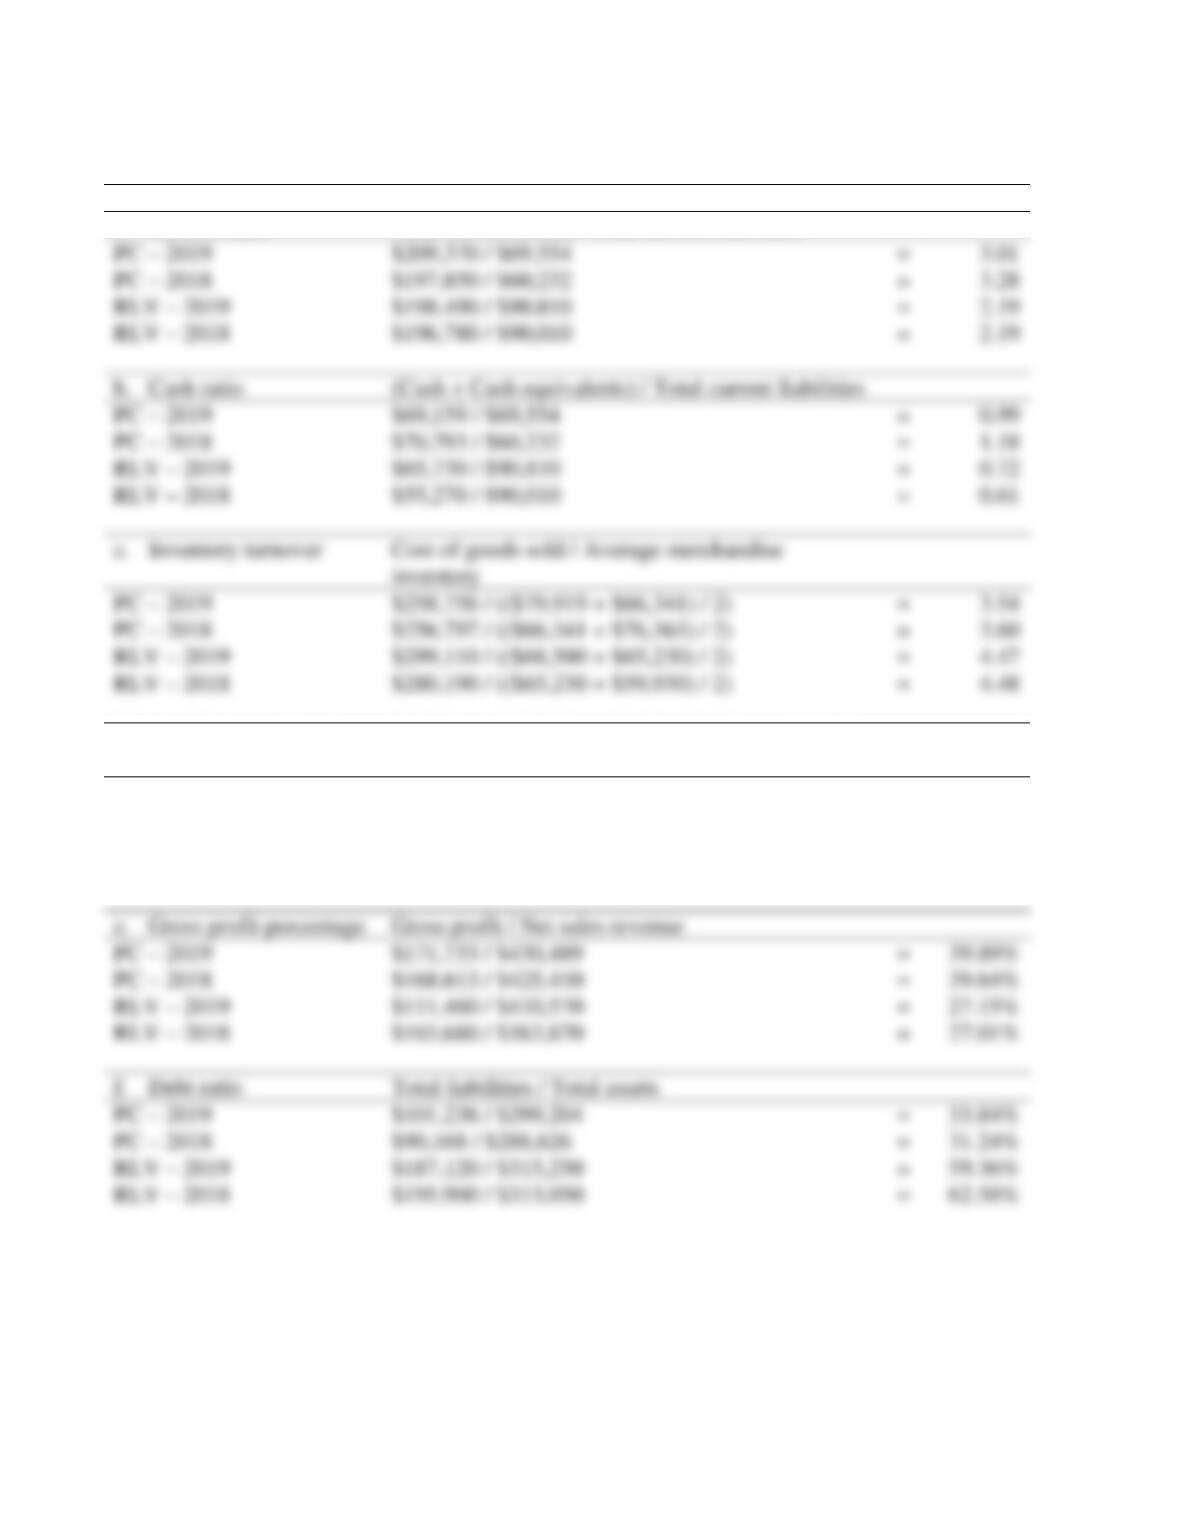
a. Current ratio
b. Cash ratio
c. Inventory turnover
d. Accounts receivable turnover
e. Gross profit percentage
f. Debt ratio
g. Debt to equity ratio
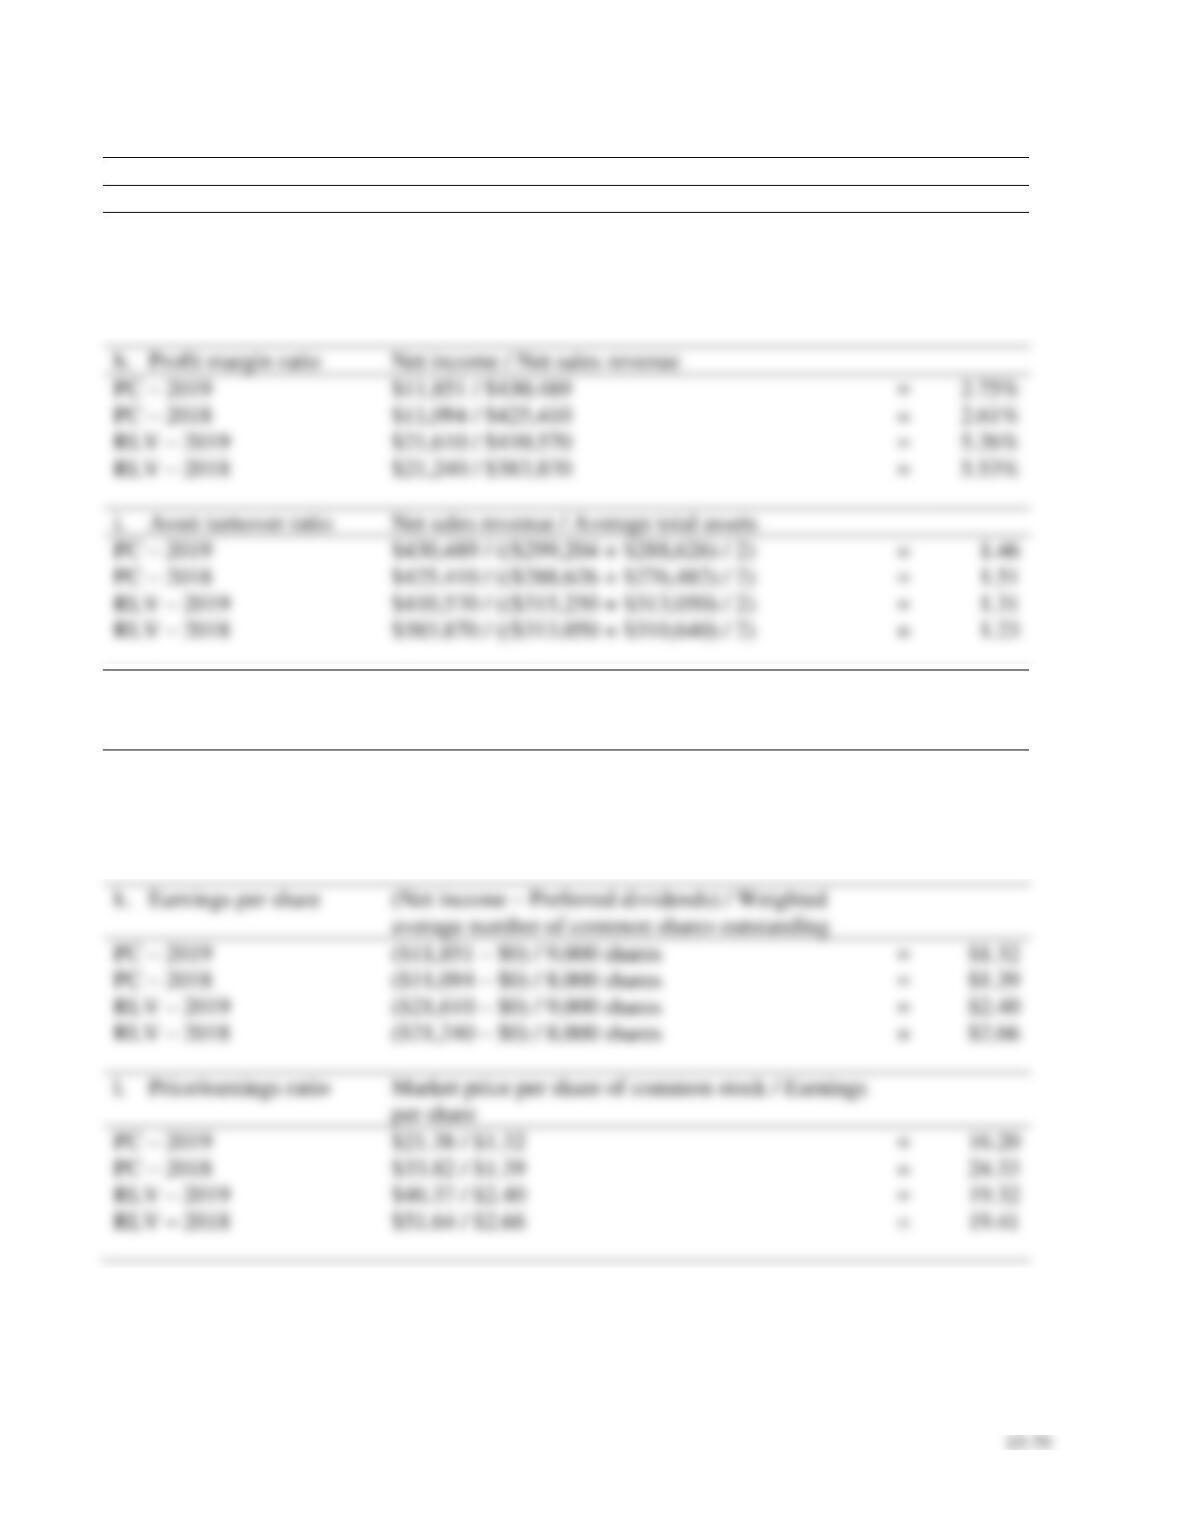
h. Profit margin ratio
i. Asset turnover ratio
j. Rate of return on common stockholders’ equity
k. Earnings per share
l. Price/earnings ratio
m. Dividend yield
n. Dividend payout
2. Compare the companies’ performance for 2019 and 2018. Make a recommendation to Canyon Canoe
Company about investing in these companies. Which company would be a better investment, The
Paddle Company or Recreational Life Vests? Base your answer on ability to pay current liabilities,
ability to sell merchandise and collect receivables, ability to pay long-term debt, profitability, and
attractiveness as an investment.
15–78
SOLUTION
Requirement 1
Ratio
Formula
Result
a. Current ratio
Total current assets / Total current liabilities
d. Accounts receivable
turnover
Net credit sales / Average net accounts receivable
PC – 2019
$430,489 / (($44,798 + $44,452) / 2)
=
9.65
PC – 2018
$425,410 / (($44,452 + $44,104) / 2)
=
9.61
RLV – 2019
$410,570 / (($39,810 + $38,650) / 2)
=
10.47
RLV – 2018
$383,870 / (($38,650 + $36,460) / 2)
=
10.22
e. Gross profit percentage
Gross profit / Net sales revenue
PC – 2019
$171,733 / $430,489
=
39.89%
PC – 2018
$168,613 / $425,410
=
39.64%
RLV – 2019
$111,460 / $410,570
=
27.15%
RLV – 2018
$103,680 / $383,870
=
27.01%
Total liabilities / Total assets
PC – 2019
$101,236 / $299,204
=
33.84%
PC – 2018
$90,168 / $288,626
=
31.24%
RLV – 2019
$187,120 / $315,250
=
59.36%
RLV – 2018
$195,900 / $313,050
=
62.58%
PC – 2019
$209,370 / $69,554
=
3.01
PC – 2018
$197,850 / $60,232
=
3.28
RLV – 2019
$198,490 / $90,810
=
2.19
RLV – 2018
$196,780 / $90,010
=
2.19
(Cash + Cash equivalents) / Total current liabilities
PC – 2019
$69,159 / $69,554
=
0.99
PC – 2018
$70,793 / $60,232
=
1.18
RLV – 2019
$65,730 / $90,810
=
0.72
RLV – 2018
$55,270 / $90,010
=
0.61
Cost of goods sold / Average merchandise
inventory
PC – 2019
$258,756 / (($79,919 + $66,341) / 2)
=
3.54
PC – 2018
$256,797 / (($66,341 + $76,363) / 2)
=
3.60
RLV – 2019
$299,110 / (($68,500 + $65,230) / 2)
=
4.47
RLV – 2018
$280,190 / (($65,230 + $59,930) / 2)
=
4.48
P15-38, cont.
Requirement 1, cont.
Ratio
Formula
Result
g. Debt to equity ratio
Total liabilities / Total equity
PC – 2019
$101,236 / $197,968
=
0.51
PC – 2018
$90,168 / $198,458
=
0.45
RLV – 2019
$187,120 / $128,130
=
1.46
RLV – 2018
$195,900 / $117,150
=
1.67
h. Profit margin ratio
Net income / Net sales revenue
PC – 2019
$11,851 / $430,489
=
2.75%
PC – 2018
$11,094 / $425,410
=
2.61%
RLV – 2019
$21,610 / $410,570
=
5.26%
RLV – 2018
$21,240 / $383,870
=
5.53%
Net sales revenue / Average total assets
PC – 2019
$430,489 / (($299,204 + $288,626) / 2)
=
1.46
PC – 2018
$425,410 / (($288,626 + $276,482) / 2)
=
1.51
RLV – 2019
$410,570 / (($315,250 + $313,050) / 2)
=
1.31
RLV – 2018
$383,870 / (($313,050 + $310,640) / 2)
=
1.23
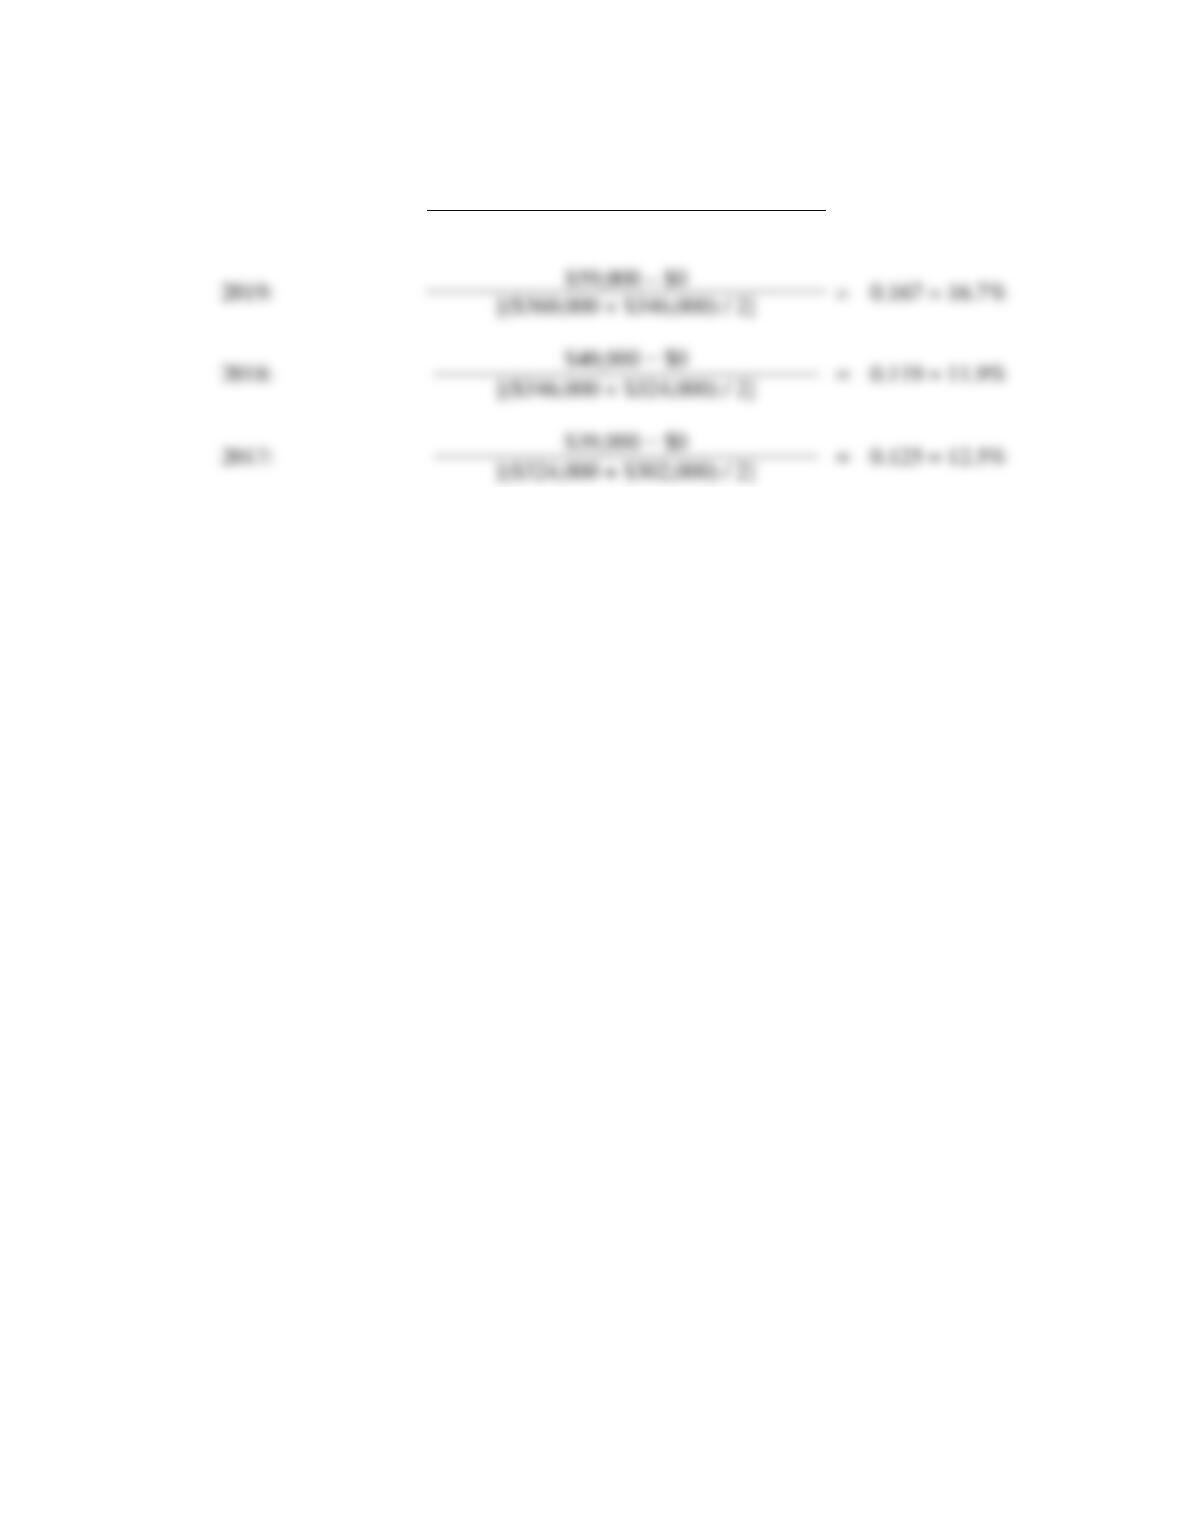
j. Rate of return on
common stockholders’
equity
(Net income – Preferred dividends) / Average
common stockholders’ equity
PC – 2019
($11,851 – $0) / (($197,968 + $198,458) / 2)
=
5.98%
PC – 2018
($11,094 – $0) / (($198,458 + $197,668) / 2)
=
5.60%
RLV – 2019
($21,610 – $0) / (($128,130 + $117,150) / 2)
=
17.62%
RLV – 2018
($21,240 – $0) / (($117,150 + $103,840) / 2)
=
19.22%
average number of common shares outstanding
PC – 2019
($11,851 – $0) / 9,000 shares
=
PC – 2018
($11,094 – $0) / 8,000 shares
=
RLV – 2019
($21,610 – $0) / 9,000 shares
=
RLV – 2018
($21,240 – $0) / 8,000 shares
=
per share
PC – 2019
$21.38 / $1.32
=
PC – 2018
$33.82 / $1.39
=
RLV – 2019
$46.37 / $2.40
=
RLV – 2018
$51.64 / $2.66
=
15–80
P15-38, cont.
Requirement 1, cont.
Ratio
Formula
Result
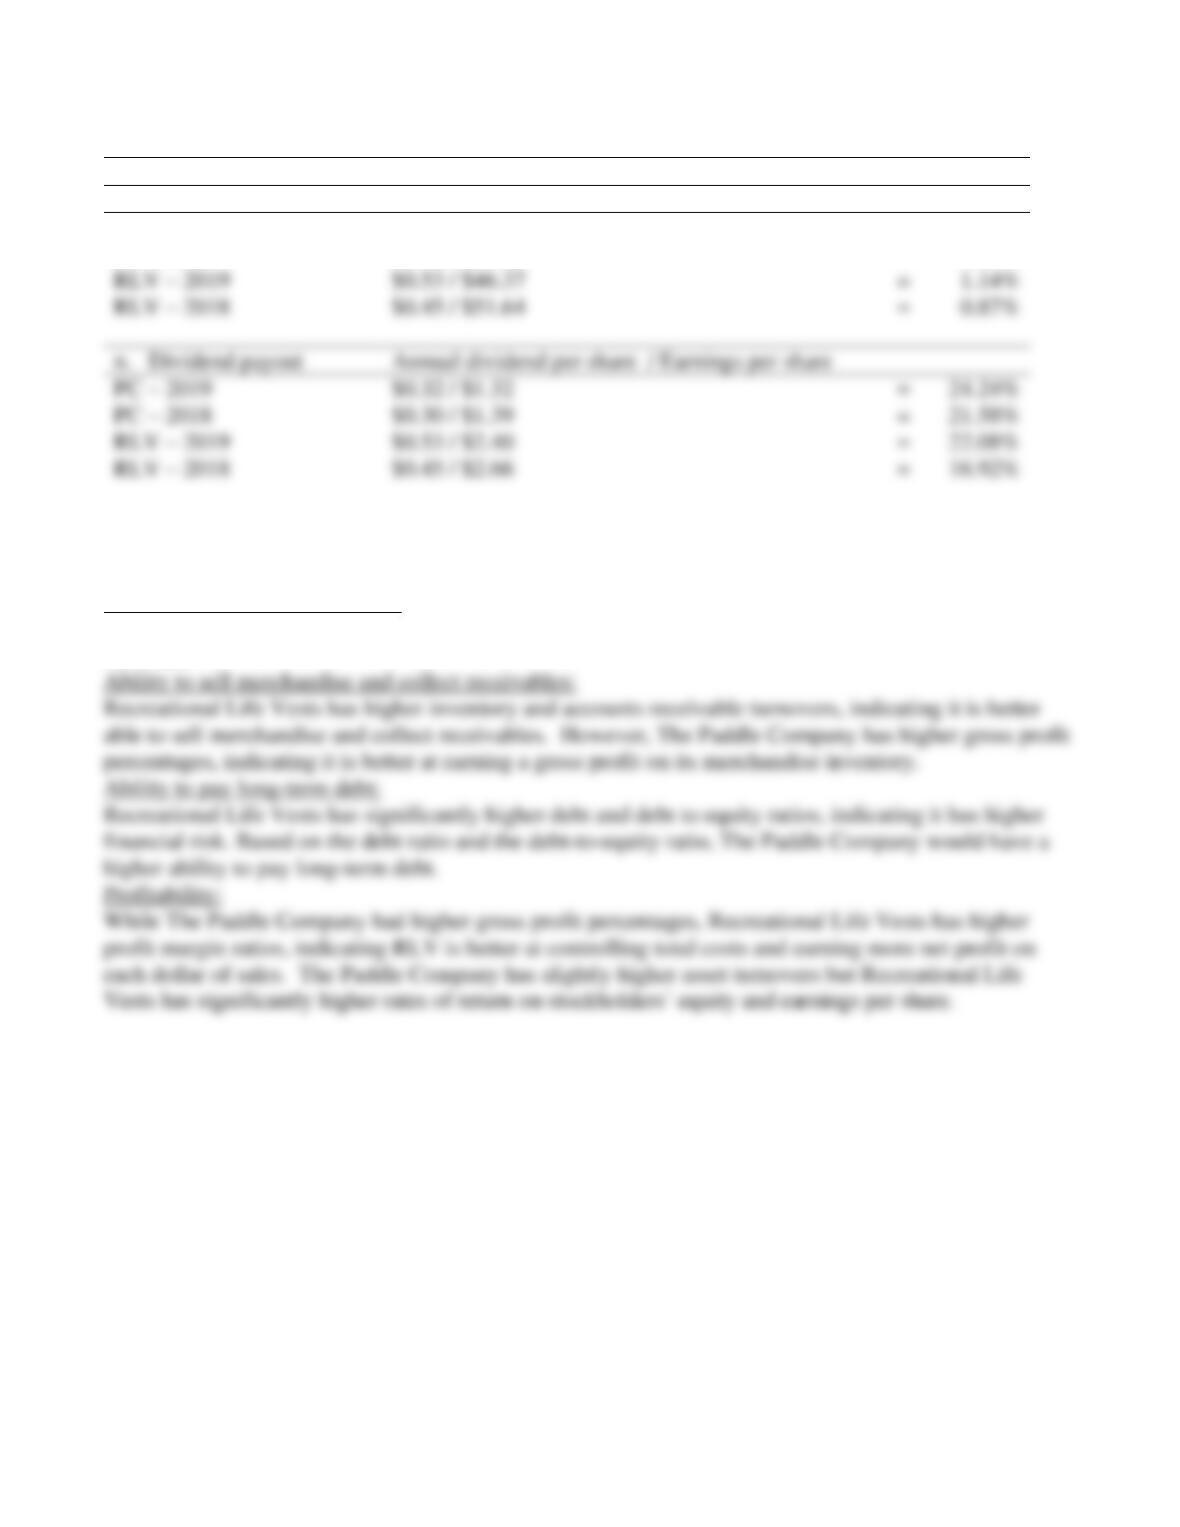
m. Dividend yield
Annual dividend per share / Market price per share
PC – 2019
$0.32 / $21.38
=
1.50%
PC – 2018
$0.30 / $33.82
=
0.89%
Requirement 2
Analysis:
Ability to pay current liabilities:
The Paddle Company has higher current ratios and cash ratios, indicating it is better able to pay current
liabilities.
RLV – 2019
$0.53 / $46.37
=
1.14%
RLV – 2018
$0.45 / $51.64
=
0.87%
Annual dividend per share / Earnings per share
PC – 2019
$0.32 / $1.32
=
24.24%
PC – 2018
$0.30 / $1.39
=
21.58%
RLV – 2019
$0.53 / $2.40
=
22.08%
RLV – 2018
$0.45 / $2.66
=
16.92%
15–81
P15-38, cont.
Requirement 2, cont.
Attractiveness as an investment:
15–82
Critical Thinking
Decision Case 15-1
Lance Berkman is the controller of Saturn, a dance club whose year-end is December 31. Berkman
prepares checks for suppliers in December, makes the proper journal entries, and posts them to the
appropriate accounts in that month. However, he holds on to the checks and mails them to the suppliers
in January.
Requirements
1. What financial ratio(s) is(are) most affected by the action to hold onto the checks until January?
2. What is Berkman’s purpose in undertaking this activity?
SOLUTION
Requirement 1
Recording payments in December, but mailing the checks in January, understates Accounts Payable and
Requirement 2
Berkman may want to improve the current ratio because it is the most widely used ratio. Creditors and
15–83
Ethical Issue 15-1
Ross’s Lipstick Company’s long-term debt agreements make certain demands on the business. For
example, Ross may not purchase treasury stock in excess of the balance of retained earnings. Also, long-
term debt may not exceed stockholders’ equity, and the current ratio may not fall below 1.50. If Ross
fails to meet any of these requirements, the company’s lenders have the authority to take over
management of the company.
Changes in consumer demand have made it hard for Ross to attract customers. Current liabilities
have mounted faster than current assets, causing the current ratio to fall to 1.47. Before releasing
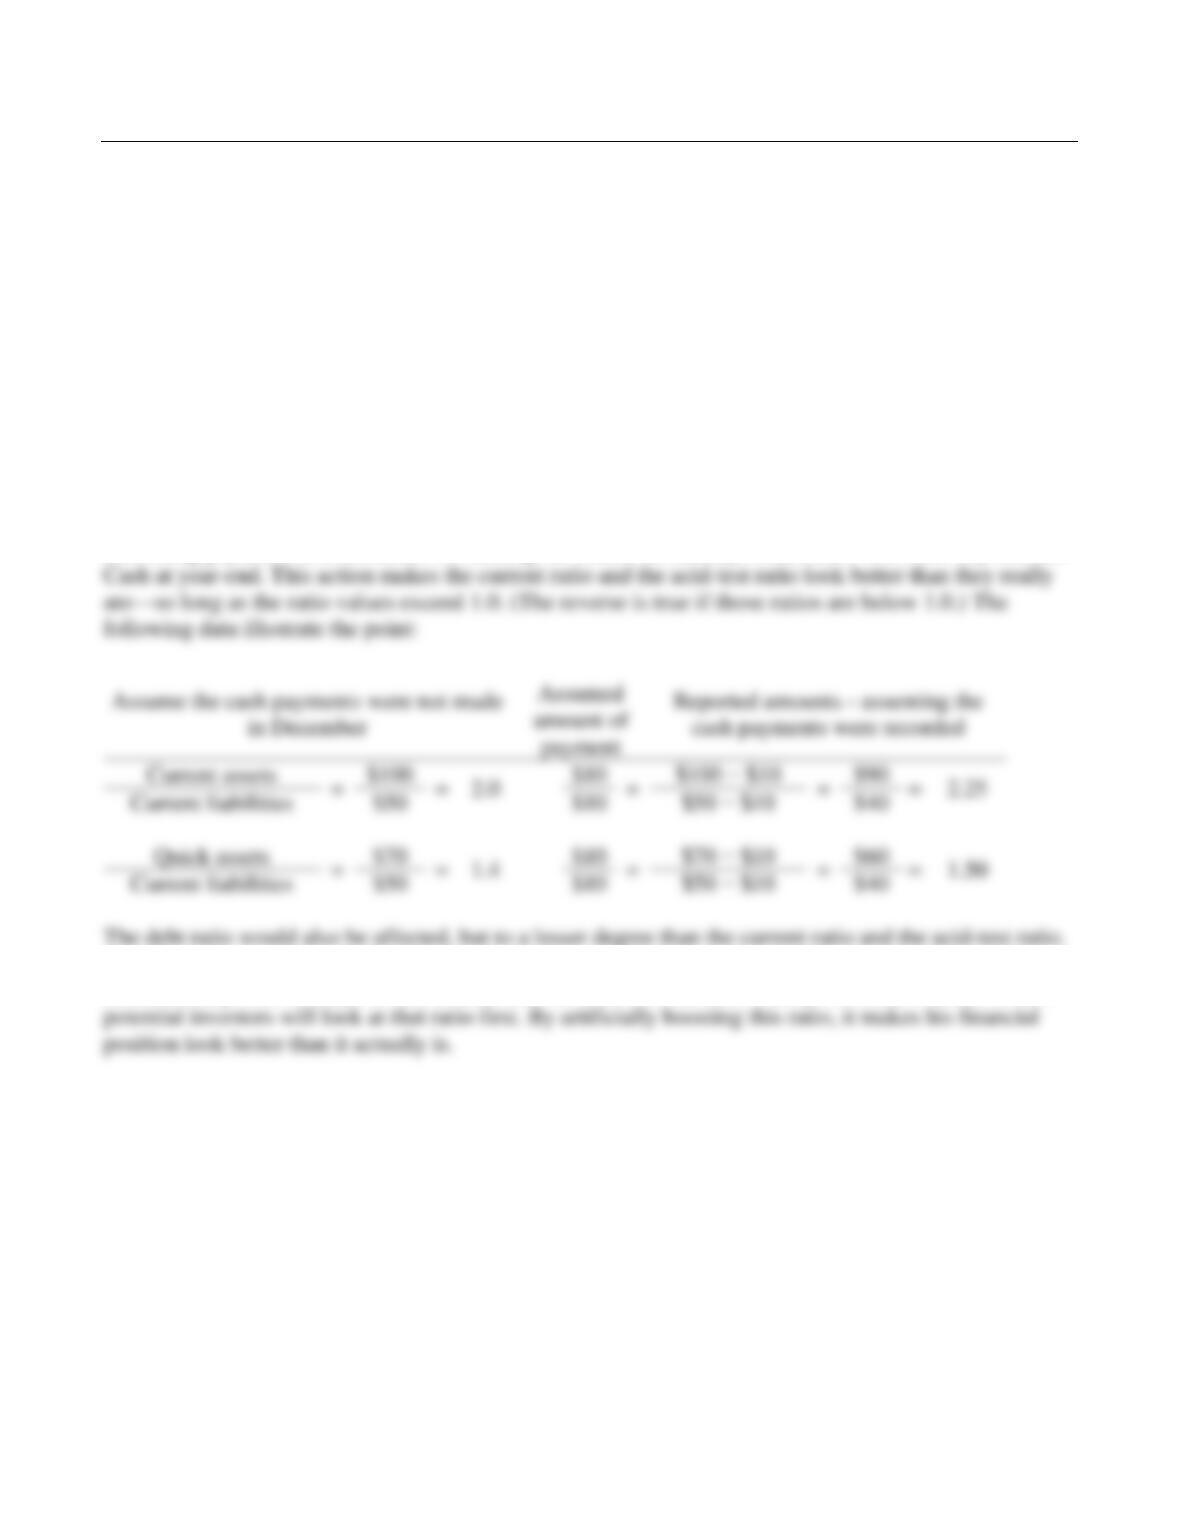
financial statements, Ross’s management is scrambling to improve the current ratio. The controller
points out that an investment can be classified as either long-term or short-term, depending on
management’s intention. By deciding to convert an investment to cash within one year, Ross can
classify the investment as short-term—a current asset. On the controller’s recommendation, Ross’s
board of directors votes to reclassify long-term investments as short-term.
Requirements
1. What effect will reclassifying the investments have on the current ratio? Is Ross’s true financial
position stronger as a result of reclassifying the investments?
2. Shortly after the financial statements are released, sales improve; so, too, does the current ratio. As a
result, Ross’s management decides not to sell the investments it had reclassified as short-term.
Accordingly, the company reclassifies the investments as long-term. Has management behaved
unethically? Give the reasoning underlying your answer.
SOLUTION
Requirement 1
Reclassifying the long-term investments as short-term will increase current assets and, therefore,
Requirement 2
Reclassifying a long-term investment as current to meet a debt agreement does not necessarily brand
Ross managers as unethical. The managers may have honestly intended to sell the investments in order
15–84
Financial Statement Case 15-1
Requirements
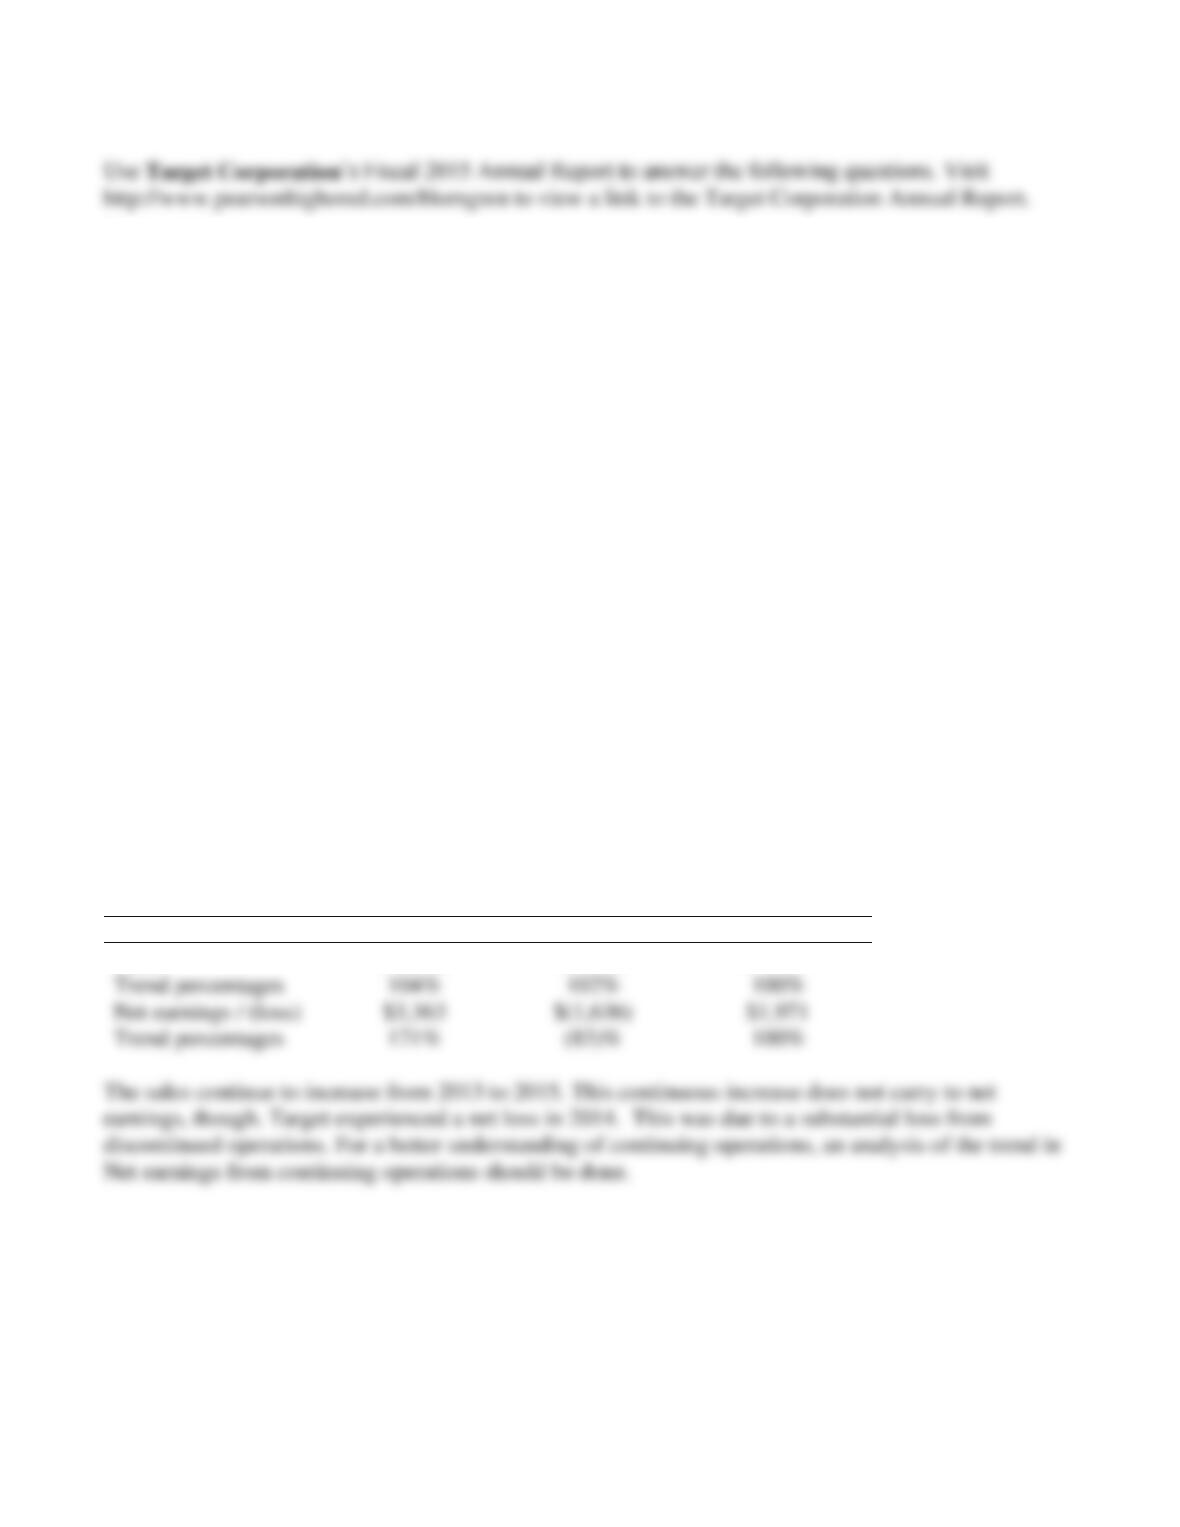
1. Compute trend analyses for Sales and Net earnings / (loss). Use 2013 as the base year. What is the
most notable aspect of these data?
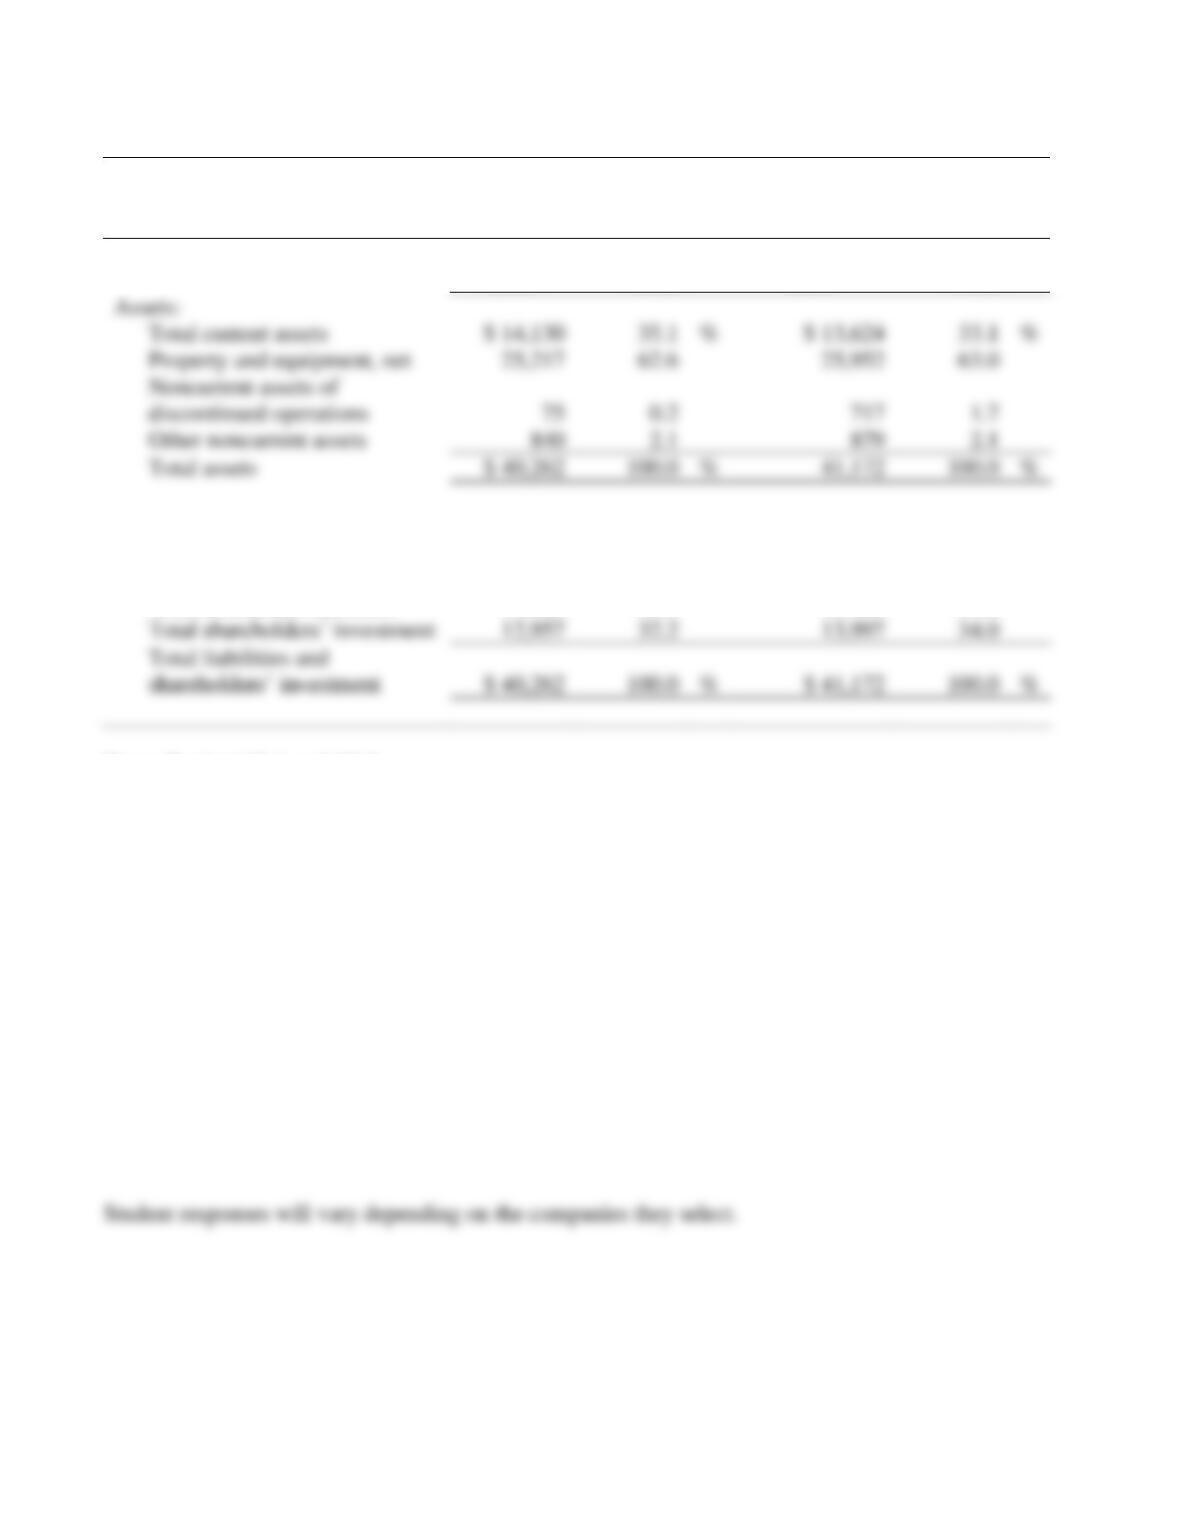
2. Perform a vertical analysis for Target Corporation’s balance sheet as of January 31, 2016 (fiscal year
2015), and January 31, 2015 (fiscal year 2014). Include only these main categories:
Assets:
Total current assets
Property and equipment, net
Noncurrent assets of discontinued operations
Other noncurrent assets
Total assets
Liabilities and shareholders’ investment:
Total current liabilities
Total noncurrent liabilities
Total shareholders’ investment
Total liabilities and shareholders’ investment
SOLUTION
Requirement 1
(In millions)
2015
2014
2013
Sales
$73,785
$72,618
$71,279
Trend percentages
100%
Net earnings / (loss)
$3,363
$(1,636)
Trend percentages
100%
15–85
Financial Statement Case 15-1, cont.
Requirement 2
TARGET CORPORATION
Consolidated Balance Sheet
(In millions)
Jan. 30,
Percent of
Total
Jan. 31,
Percent of
Total
2016
2015
Liabilities and shareholders’
investment:
Total current liabilities
$ 12,622
31.3
%
$ 11,736
28.5
%
Total noncurrent liabilities
14,683
36.5
15,439
37.5
12,957
32.2
13,997
34.0
$ 40,262
100.0
%
$ 41,172
100.0
%
Team Project 15-1 and 15-2
Team Project 15-1
Select an industry you are interested in, and pick any company in that industry to use as the benchmark.
Then select two other companies in the same industry. For each category of ratios, compute all the ratios
for the three companies. Write a two-page report that compares the two companies with the benchmark
company.
Team Project 15-2
Select a company and obtain its financial statements. Convert the income statement and the balance
sheet to common size, and compare the company you selected to the industry average. The Risk
Management Association’s Annual Statement Studies and Dun & Bradstreet’s Industry Norms & Key
Business Ratios publish common-size statements for most industries.
SOLUTION
Assets:
Total current assets
$ 14,130
35.1
%
$ 13,624
33.1
%
Property and equipment, net
25,217
62.6
25,952
63.0
discontinued operations
75
0.2
Other noncurrent assets
2.1
Total assets
$ 40,262
100.0
%
41,172
100.0
%