Unlock document.
This document is partially blurred.
Unlock all pages and 1 million more documents.
Get Access
CHAPTER 15 Financial Statement Analysis
Prob. 15–1B
1.
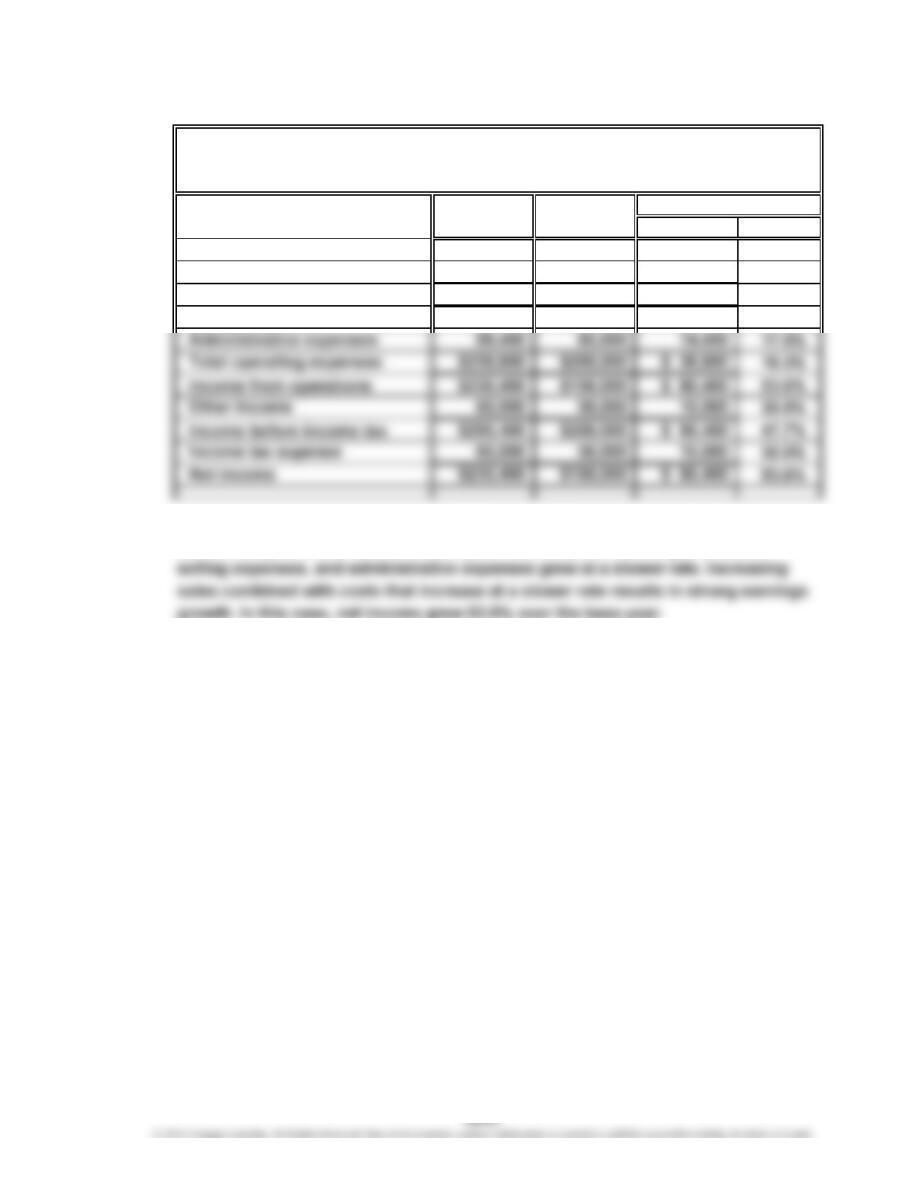
2016 2015 Amount Percent
Sales $910,000 $700,000 $210,000 30.0%
Cost of goods sold 441,000 350,000 91,000 26.0%
Gross profit $469,000 $350,000 $119,000 34.0%
Selling expenses 139,150 115,000 24,150 21.0%
2. The profitability has significantly improved from 2015 to 2016. Sales have
increased by 30% over the 2015 base year. However, the cost of goods sold,
Increase (Decrease)
MACKLIN INC.
Comparative Income Statement
For the Years Ended December 31, 2016 and 2015
CHAPTER 15 Financial Statement Analysis
Prob. 15–2B
1.
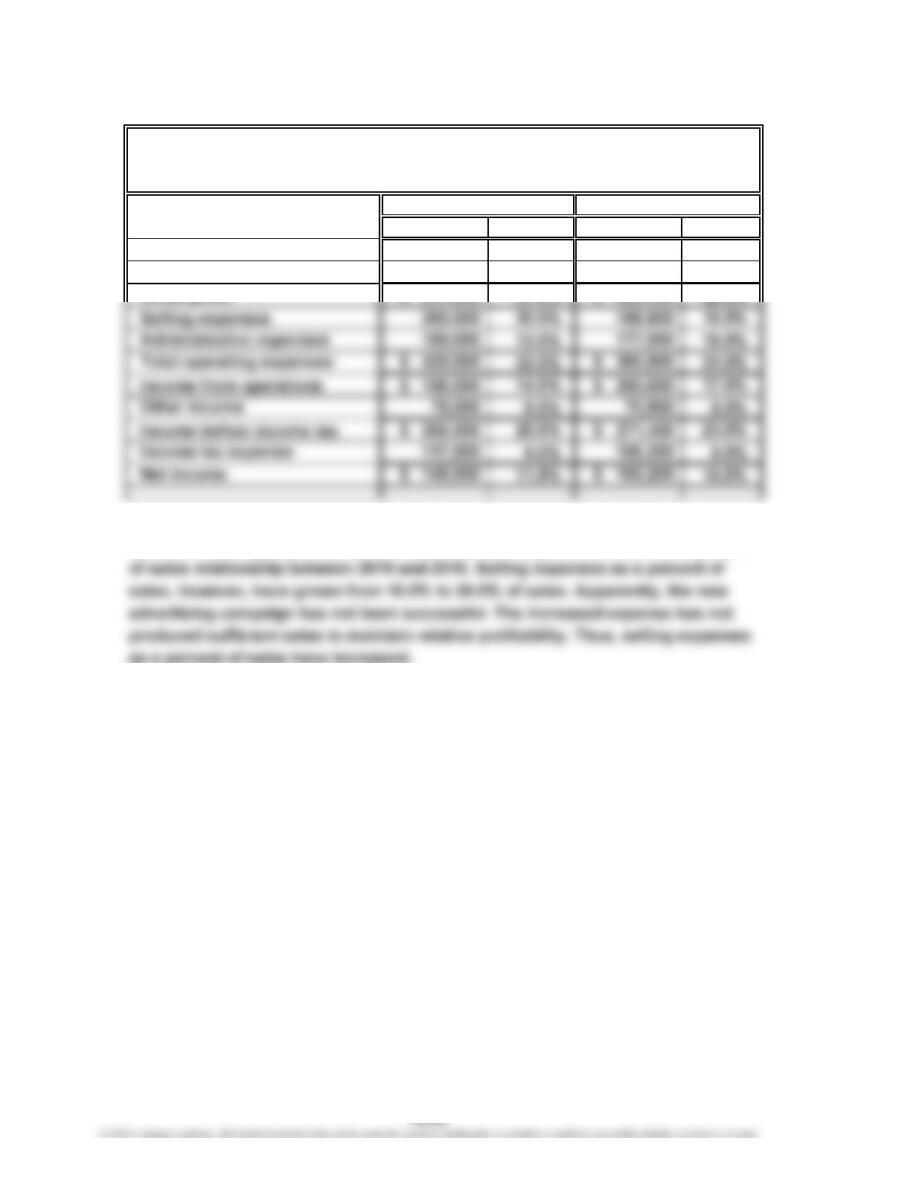
Amount Percent Amount Percent
Sales $1,300,000 100.0% $1,180,000 100.0%
Cost of goods sold 682,500 52.5% 613,600 52.0%
Gross profit $ 617,500 47.5% $ 566,400 48.0%
2. The net income as a percent of sales has declined. All the costs and expenses,
other than selling expenses, have maintained their approximate cost as a percent
2016 2015
FIELDER INDUSTRIES INC.
Comparative Income Statement
For the Years Ended December 31, 2016 and 2015
CHAPTER 15 Financial Statement Analysis
Prob. 15–3B
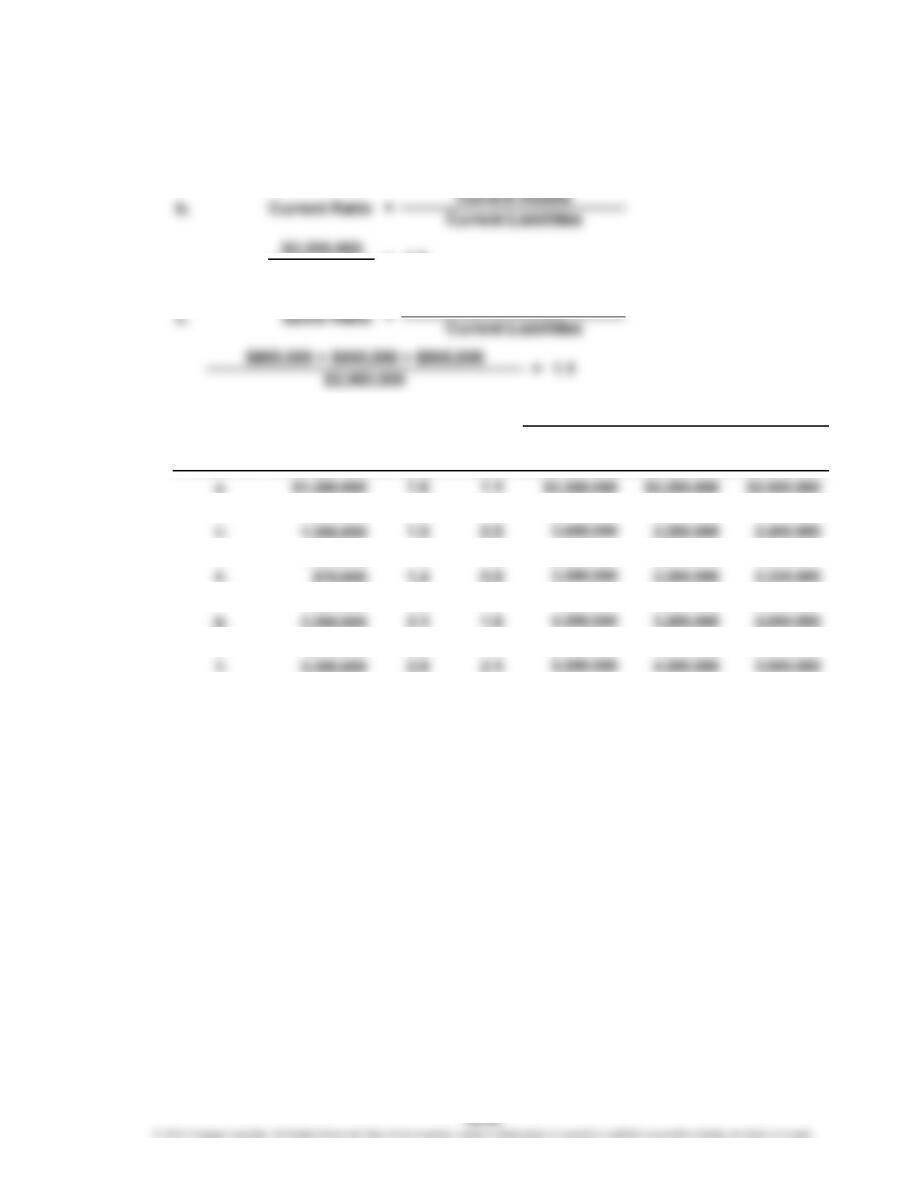
1. a. Working Capital = Current Assets – Current Liabilities
$3,200,000 – $2,000,000 = $1,200,000
$2,000,000
2.
Working Quick Current
Capital Assets Liabilities
1,200,000 1,912,500 1,712,500
1,200,000 2,075,000 1,875,000
1,200,000 2,200,000 2,000,000
1,200,000 2,200,000 2,000,000
1,200,000 2,000,000 2,000,000
= 1.6
AssetsTransaction
Current
Ratio
Quick
Ratio
Current
b. 1.7 1.1 2,912,500
d. 1.6 1.1 3,075,000
f. 1.6 1.1 3,200,000
h. 1.6 1.1 3,200,000
Supporting Data
j. 1.6 1.0 3,200,000
CHAPTER 15 Financial Statement Analysis
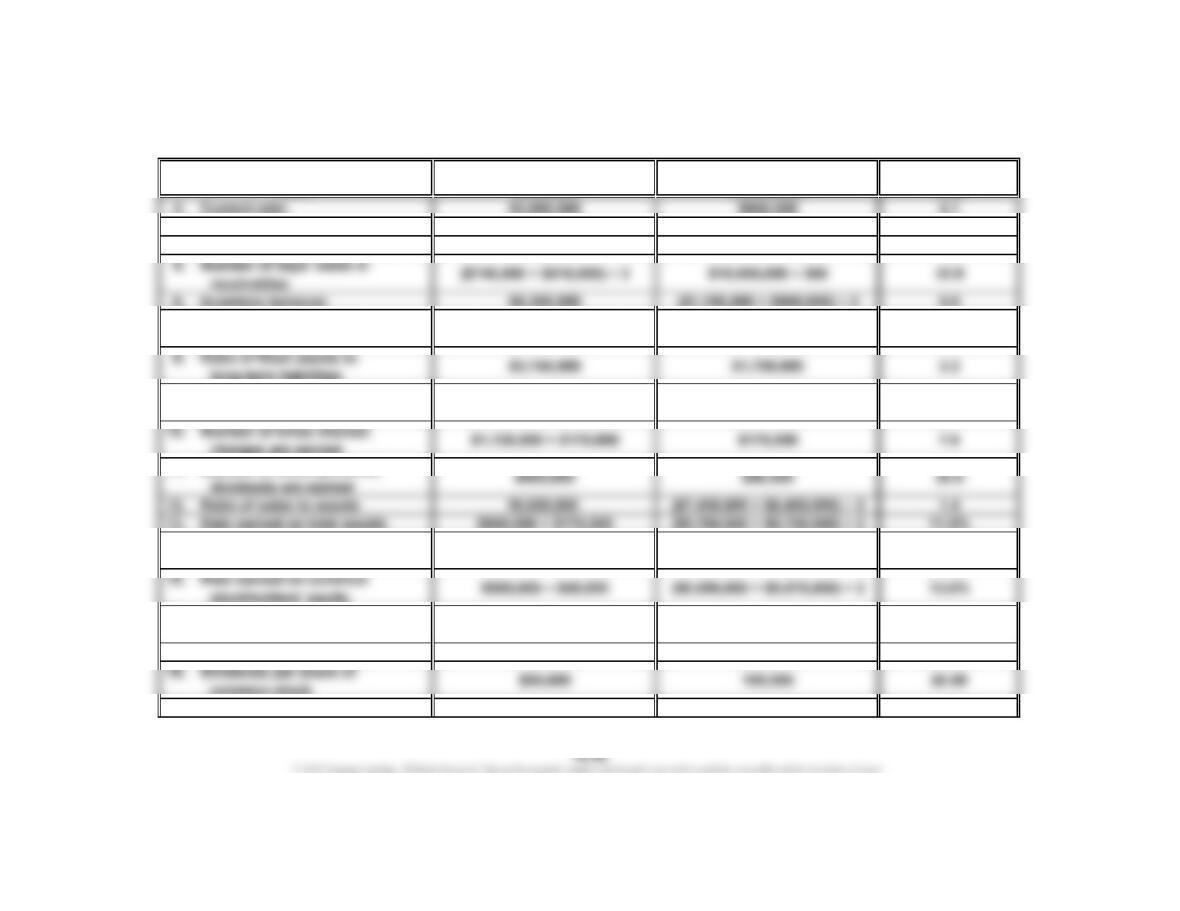
Prob. 15–4B
1. Working Capital: $3,690,000 – $900,000 = $2,790,000
Calculated
Numerator Denominator Value
3. Quick ratio $2,250,000 $900,000 2.5
4. Accounts receivable turnover $10,000,000 ($740,000 + $510,000) ÷ 2 16.0
7. Number of days' sales in
inventory
9. Ratio of liabilities to
stockholders’ equity
11. Number of times preferred
14. Rate earned on
stockholders’ equity
16. Earnings per share on
common stock
17. Price-earnings ratio 119.70 8.55 14.0
19. Dividend yield $0.50 $119.70 0.4%
Ratio
($1,190,000 + $950,000) ÷ 2 $5,350,000 ÷ 365
73.0
$7,180,000
$900,000
0.4
$2,600,000
$8.55$900,000 – $45,000 100,000
13.3%
($7,180,000 + $6,375,000) ÷ 2
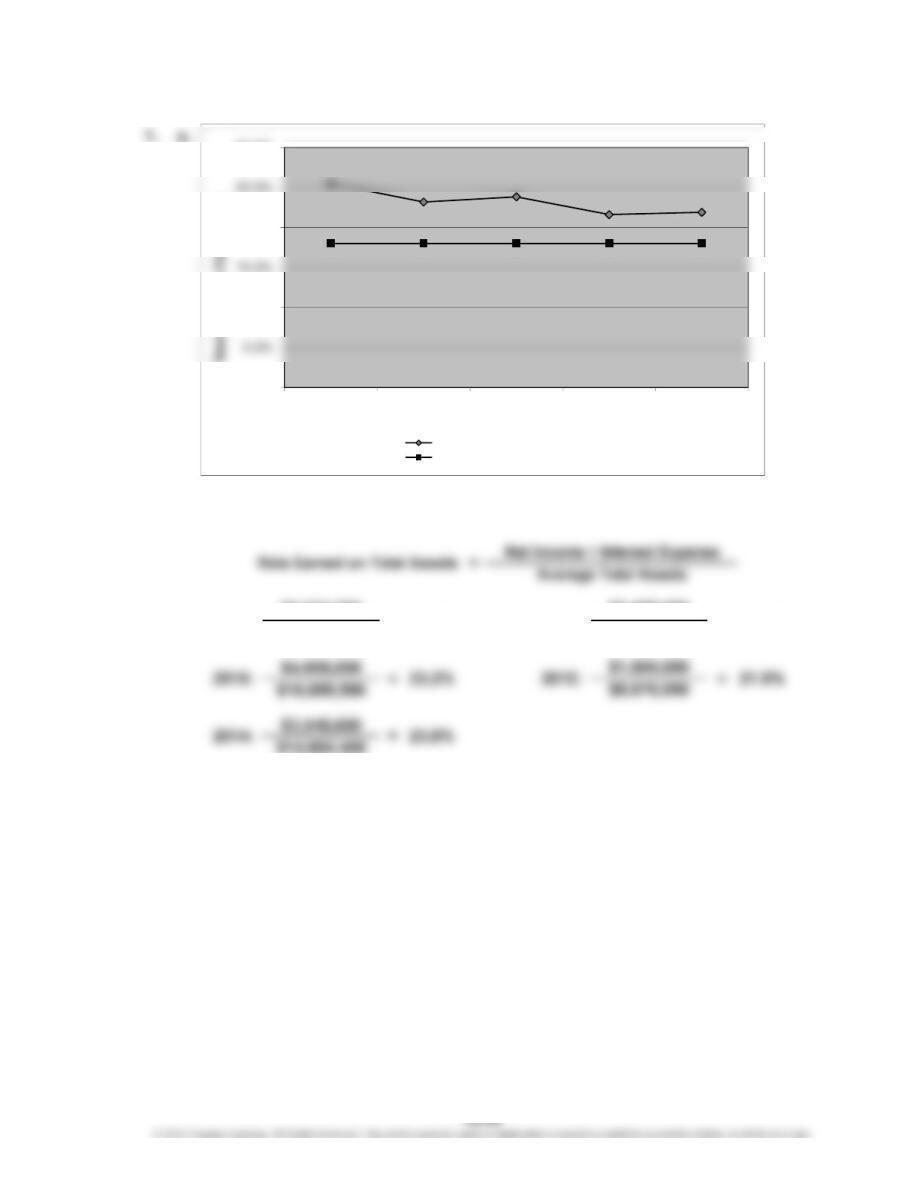
CHAPTER 15 Financial Statement Analysis
Prob. 15–5B
$6,623,780
$25,988,665
2013: $2,458,000
21.6%
25.5%2016: =
=
$11,370,240
0.0%
10.0%
20.0%
30.0%
2016 2015 2014 2013 2012
Year
Company’s rate earned on total assets
Industry rate earned on total assets
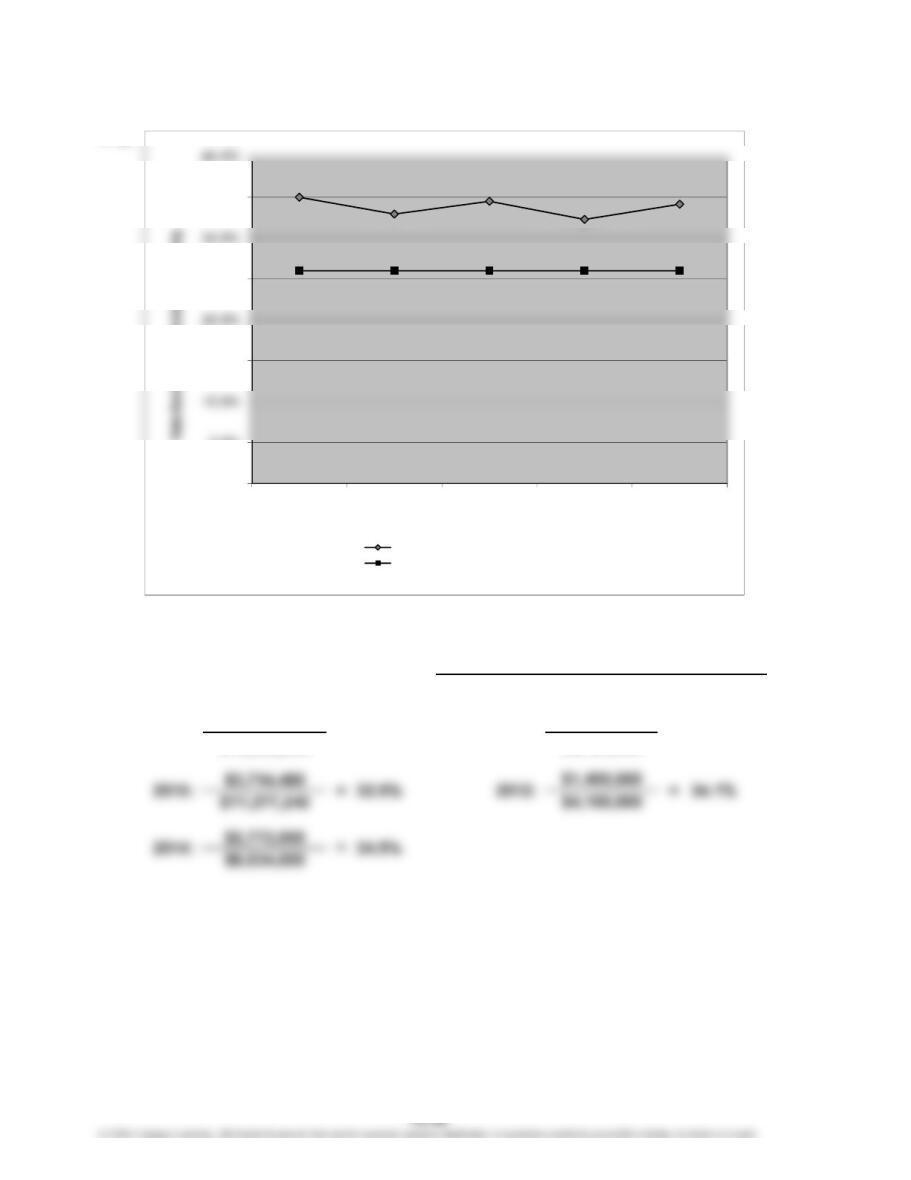
CHAPTER 15 Financial Statement Analysis
Prob. 15–5B (Continued)
1. b.
$5,571,720
$15,920,340
Rate Earned on
Stockholders’ Equity
35.0%
=Average Total Stockholders’ Equity
Net Income
2013: $1,848,000
$5,724,000
2016:
=
32.3%=
0.0%
5.0%
15.0%
25.0%
35.0%
2016 2015 2014 2013 2012
Year
Company’s rate earned on stockholders’ equity
Industry rate earned on stockholders’ equity
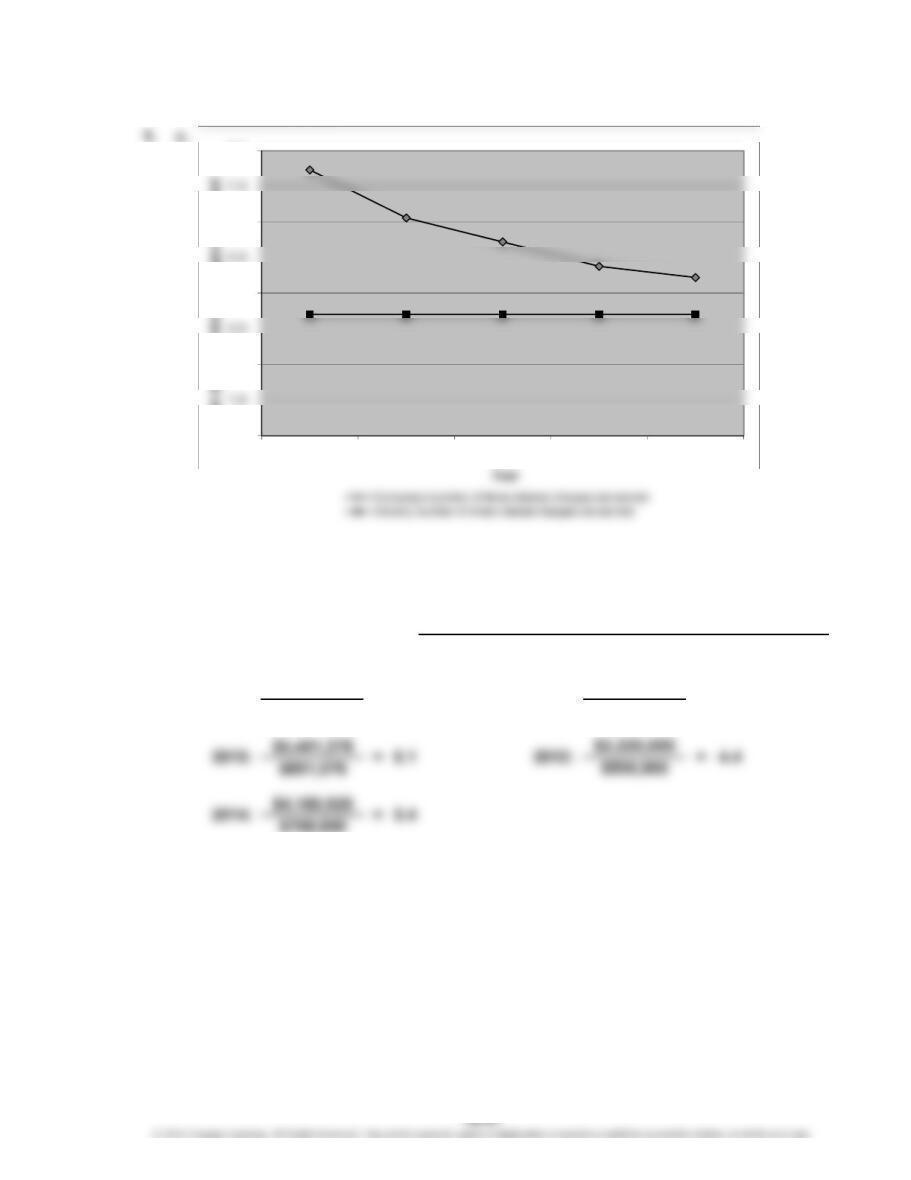
CHAPTER 15 Financial Statement Analysis
Prob. 15–5B (Continued)
$7,849,352
$1,052,060
7.5
=
Number of Times
Interest Charges Are Earned
Net Income + Income Tax Expense + Interest Expense
Interest Expense
=2013:2016:
=
4.8
$2,899,600
$610,000
0.0
2.0
4.0
6.0
8.0
2016 2015 2014 2013 2012
Number of Times Interest Charges Are Earned
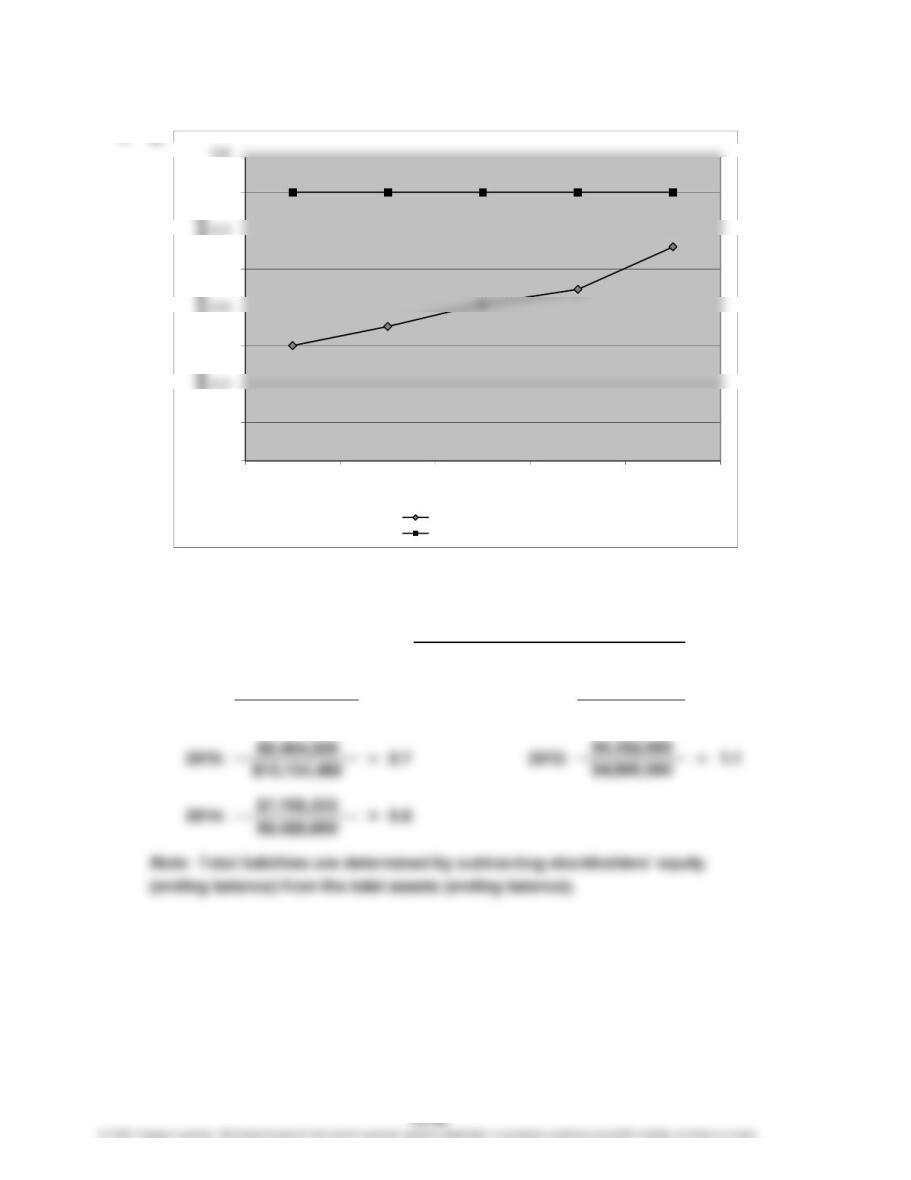
CHAPTER 15 Financial Statement Analysis
Prob. 15–5B (Continued)
1. d.
$10,672,291
$18,706,200
0.62016:
Ratio of Liabilities to
Stockholders’ Equity =
=
0.9
Total Liabilities
Total Stockholders’ Equity
$5,940,480
$6,648,000
=
2013:
0.0
0.2
0.6
1.0
1.4
2016 2015 2014 2013 2012
Ratio of Liabilities to Stockholders’ Equity
Year
Company’s liabilities to equity
Industry liabilities to equity
CHAPTER 15 Financial Statement Analysis
Prob. 15–5B (Concluded)
2. Both the rate earned on total assets and the rate earned on stockholders’ equity
are above the industry average for all five years. The rate earned on total assets is
actually improving gradually. The rate earned on stockholders’ equity exceeds the
CHAPTER 15 Financial Statement Analysis
Fiscal Fiscal
2012 2011
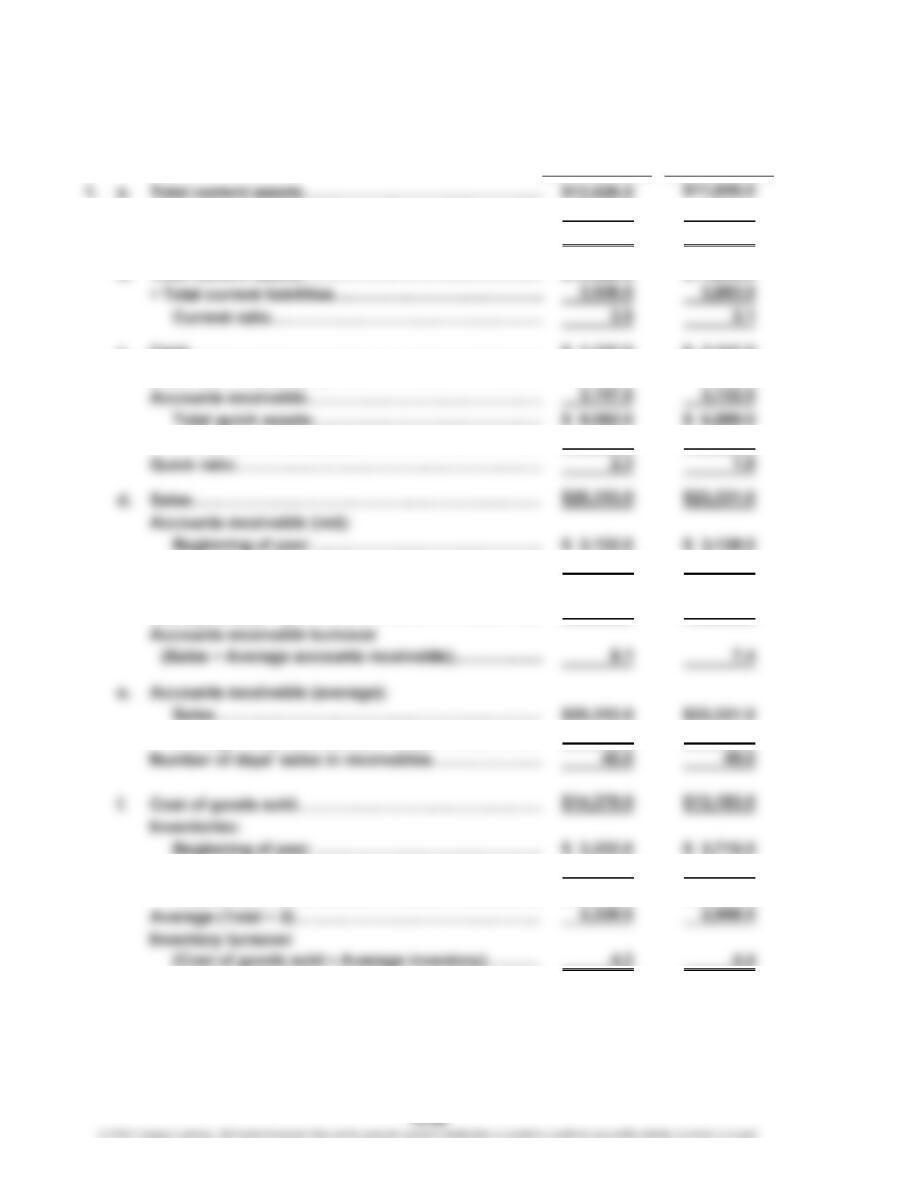
Total current liabilities…………………………………
…
3,926.0 3,882.0
Working capital………………………………………
…
$ 9,700.0 $ 7,963.0
b. Total current assets……………………………………
…
$13,626.0 $11,845.0
c. Cash………………………………………………………… $ 3,337.0 $ 2,317.0
Short-term investments…………………………………
…
2,628.0 1,440.0
÷ Total current liabilities……………………………
…
3,926.0 3,882.0
…
End of year……………………………………………
…
3,117.0 3,132.0
Total………………………………………………………… $ 6,249.0 $ 6,270.0
Average (Total ÷ 2)………………………………………
…
3,124.5 3,135.0
…
Average daily sales (Sales ÷ 365)…………………
…
69.4 63.9
…
End of year……………………………………………
…
3,434.0 3,222.0
Total……………………………………………………
…
$ 6,656.0 $ 5,937.0
…
NIKE, INC., PROBLEM
CHAPTER 15 Financial Statement Analysis
Fiscal Fiscal
2012 2011
g. Inventory (average)………………………………………
…
$ 3,328.0 $ 2,968.5
Cost of goods sold………………………………………
…
14,279.0 13,183.0
Average daily cost of goods sold………………………
…
39.1 36.1
Number of days’ sales in inventory (Average
inventory ÷ Average daily cost of goods sold)……
…
85.1 82.2
Plus interest expense*……………………………………
…
23.0 31.0
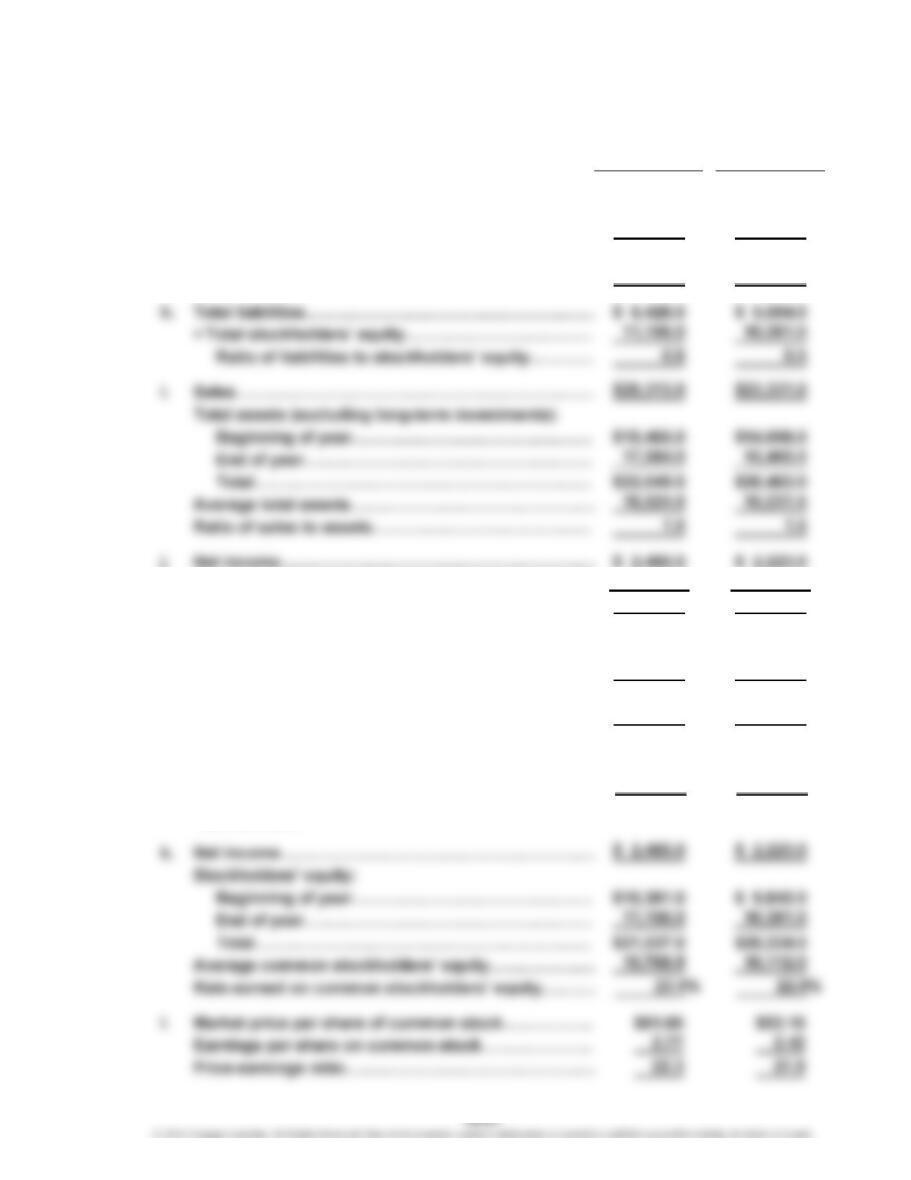
Total……………………………………………………… $ 2,508.0 $ 2,254.0
Total assets:
Beginning of year……………………………………… $15,465.0 $14,998.0
End of year……………………………………………… 17,584.0 15,465.0
Total……………………………………………………… $33,049.0 $30,463.0
Average total assets………………………………………
…
16,524.5 15,231.5
Rate earned on total assets
[(Net income + Interest expense) ÷
Average total assets]…………………………………
…
15.2% 14.8%
*See Nike Note 6.
NIKE, INC., PROBLEM (Continued)
CHAPTER 15 Financial Statement Analysis
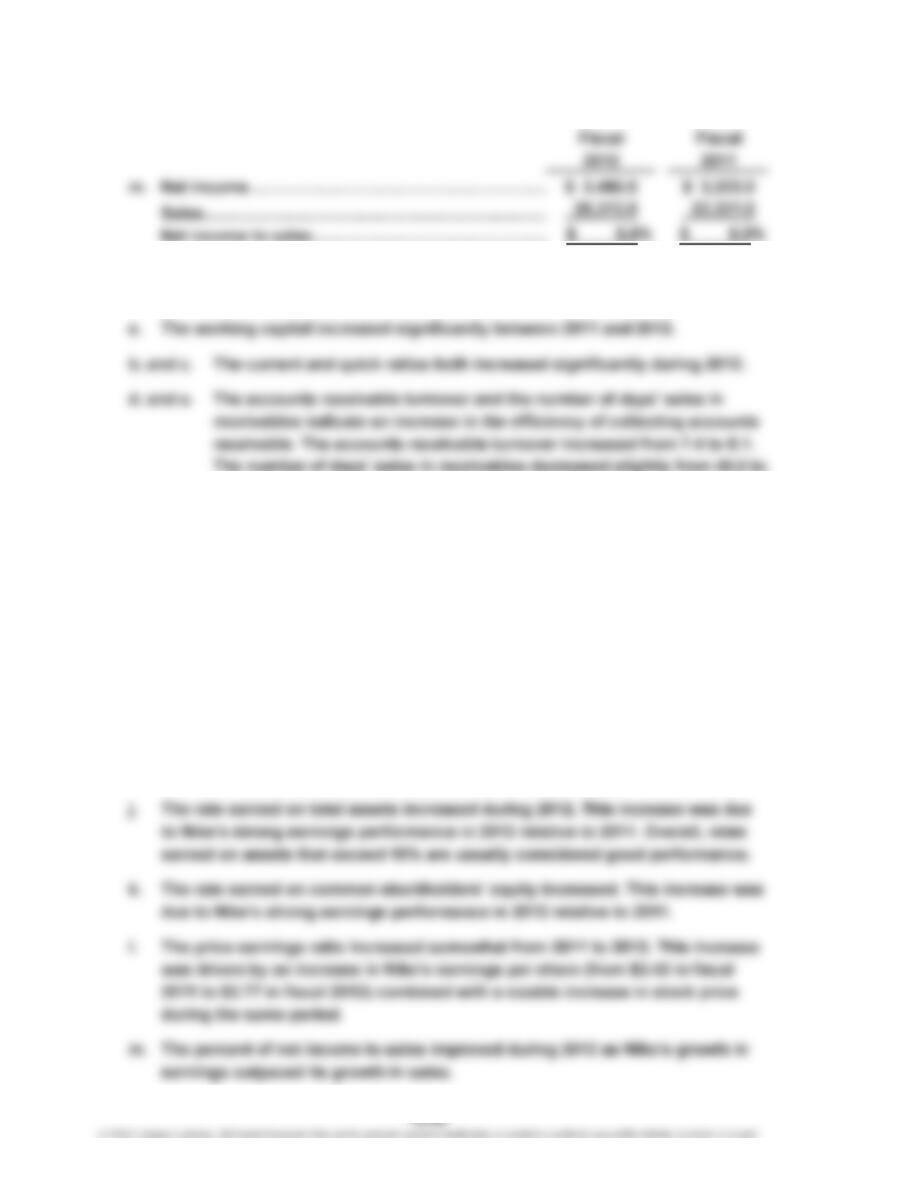
…
2. Before reaching definitive conclusions, each measure should be compared with
past years, industry averages, and similar firms in the industry.
45.0. Thus, it takes the company less than two months to collect its
accounts receivable from credit sales. These numbers should be
compared to their competitors, industry averages, and Nike’s credit
policy to draw definitive conclusions.
f. and g. The results of these two analyses show a very slight decrease in
inventory turnover and an increase in the number of days’ sales in
inventory. Both trends are small. Inventory management is critical to
Nike, so this indicates a favorable trend.
h. The margin of protection to creditors remained decreased slightly. Overall, Nik
e
provides sound protection to its creditors.
i. These analyses indicate that the effectiveness in the use of assets to generate
revenues was very similar in both years.
NIKE, INC., PROBLEM (Concluded)
CHAPTER 15 Financial Statement Analysis
CP 15–1
This position does not allow the shareholders to take advantage of leverage. As a
result, the return on shareholders’ equity cannot be improved by using debt. In
CP 15–2
Josh is concerned about the inventory and accounts receivable levels because he must
determine their value. Inventory that cannot be sold (or sold at a large discount) or
accounts receivable that cannot be collected must be written down to reflect their
CASES & PROJECTS
CHAPTER 15 Financial Statement Analysis
CP 15–3
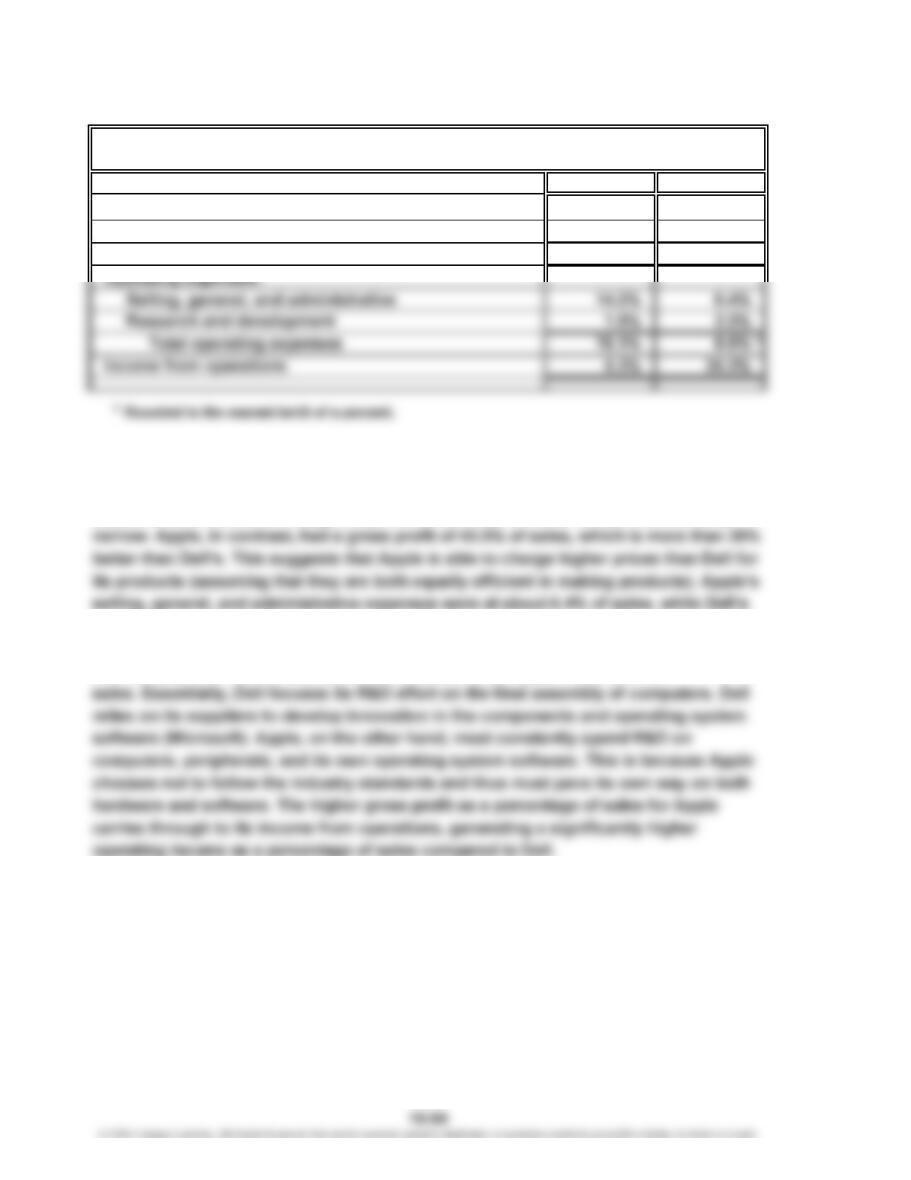
Dell Inc. Apple Inc.
Sales 100.0% 100.0%
Cost of sales 78.6% 56.1%
Gross profit 21.4% 43.9%
The common-sized analysis indicates that Dell and Apple are very different computer
companies. Dell’s income from operations was 5.3% of sales, while Apple’s was 35.3% o
f
sales. There is a 30 percentage point difference between the two companies. What
explains this difference? The gross profit for Dell was 21.4% of sales, which is fairly
are 14.2% of sales. Apple has larger research expenses as a percent of sales. It attempts
to sell a unique array of products to a wide audience. This requires significant research
and development. Dell’s R&D was 1.9% of sales, while Apple’s was 2.2% of
DELL INC. AND APPLE INC.
Common-Sized Statements
CHAPTER 15 Financial Statement Analysis
CP 15–4
$3,064.7
$6,821
$2,799.9
44.9%
Year 3: =
Year 3: $3,064.7 + $782.8
$52,237
a.
= 7.4%
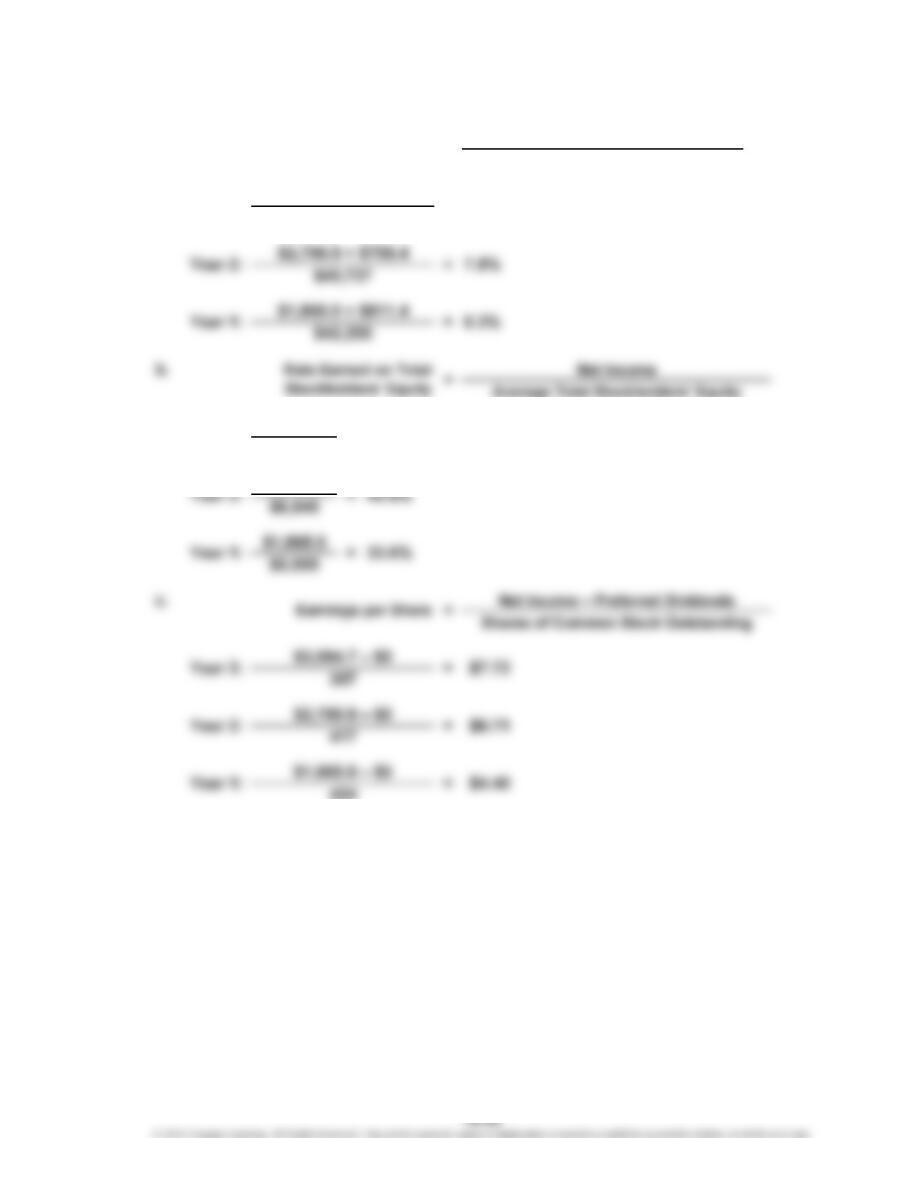
Rate Earned on Total Assets = Net Income + Interest Expense
Average Total Assets
CHAPTER 15 Financial Statement Analysis
CP 15–4 (Continued)
$1.79
$79.27
$80.48
$61.18
$79.27
$80.48
$61.18
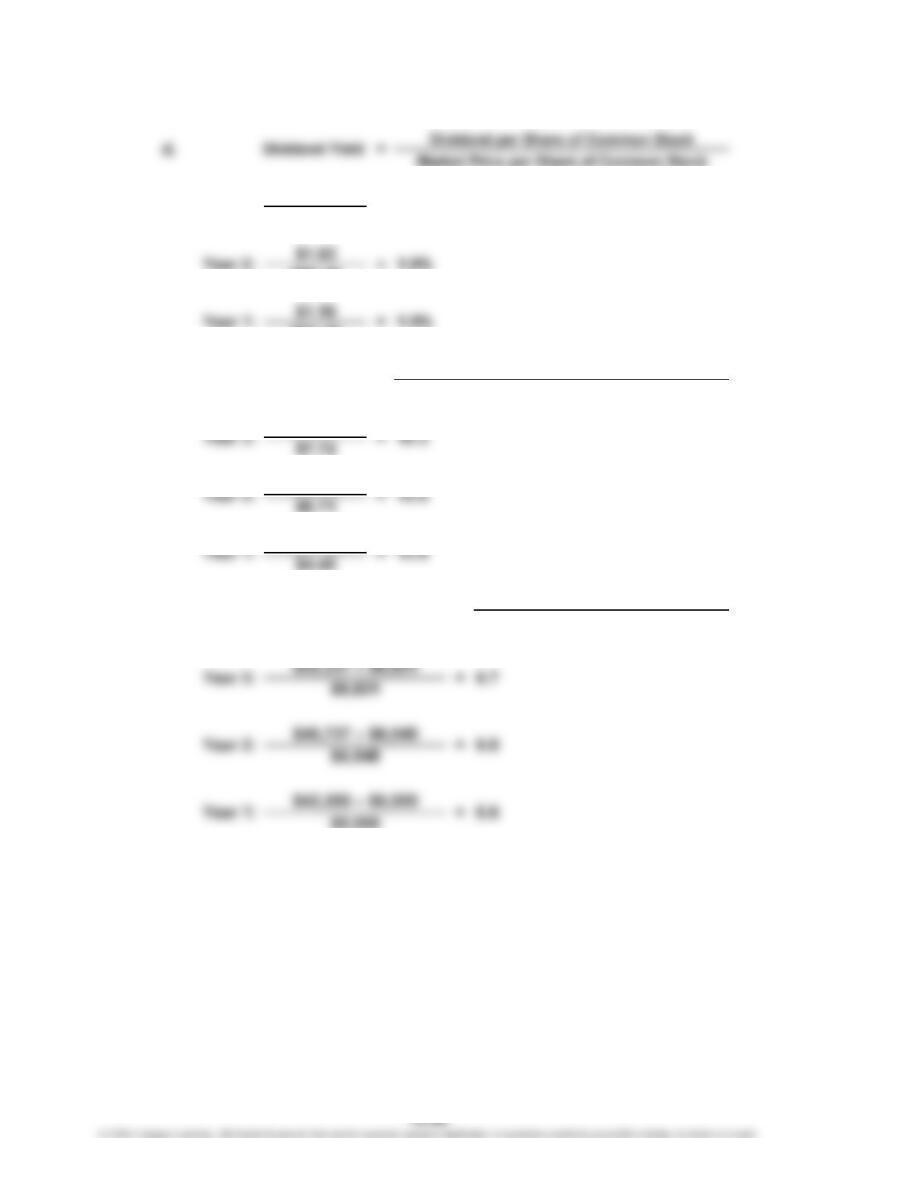
2.
Market Price per Share of Common Stock
2.3%
Year 3: =
e.
=Price-Earnings Ratio
=
Average Liabilities
Average Stockholders’ Equity
Ratio of Average Liabilities to Average
Stockholders’ Equity
Earnings per Share
CHAPTER 15 Financial Statement Analysis
CP 15–4 (Concluded)
3. Deere & Co.’s profitability, as measured by earnings per share, has improved
significantly during the three-year period presented. The rates earned on total
assets and total stockholders’ equity have also improved significantly during this
CHAPTER 15 Financial Statement Analysis
CP 15–5
b.
c.
d.
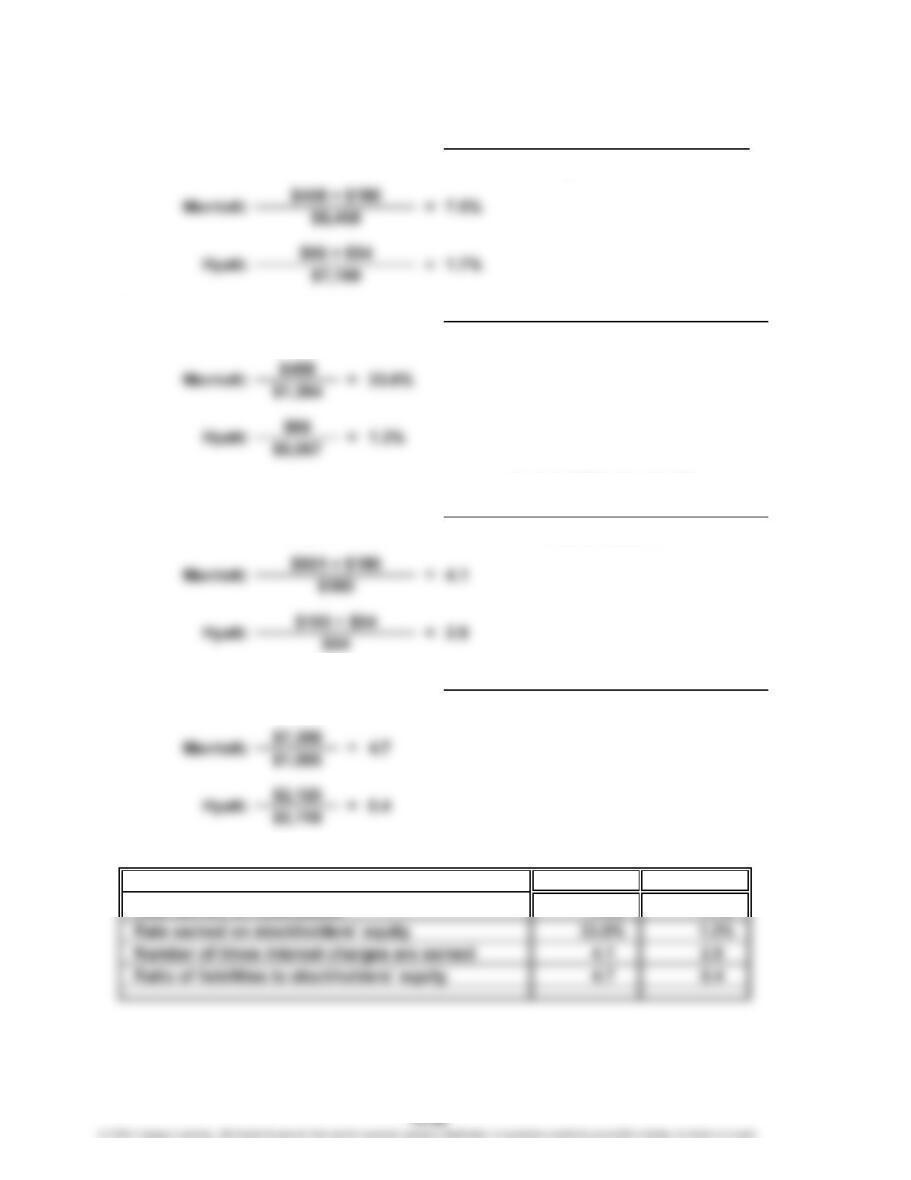
Summary Table:
Marriott Hyatt
Rate earned on total assets 7.5% 1.7%
=Total Liabilities
Total Stockholders’ Equity
=
Income Before Income Tax
+ Interest Expense
1.
Ratio of Liabilities to
Stockholders’ Equity
a.
Number of Times Interest
Charges Are Earned
Interest Expense
Rate Earned on Total Assets
Rate Earned on
Stockholders’ Equity
=Net Income + Interest Expense
Average Total Assets
=Net Income
Average Total Stockholders’ Equity
CHAPTER 15 Financial Statement Analysis
CP 15–5 (Concluded)
2. Marriott has a higher rate earned on total assets (7.5% vs. 1.7%), and a higher
rate on stockholders’ equity (33.6% vs. 1.3%), compared to Hyatt. Hyatt’s weaker
performance relative to Marriott appears to be due to its weak earnings relative


