Exercise 15.16
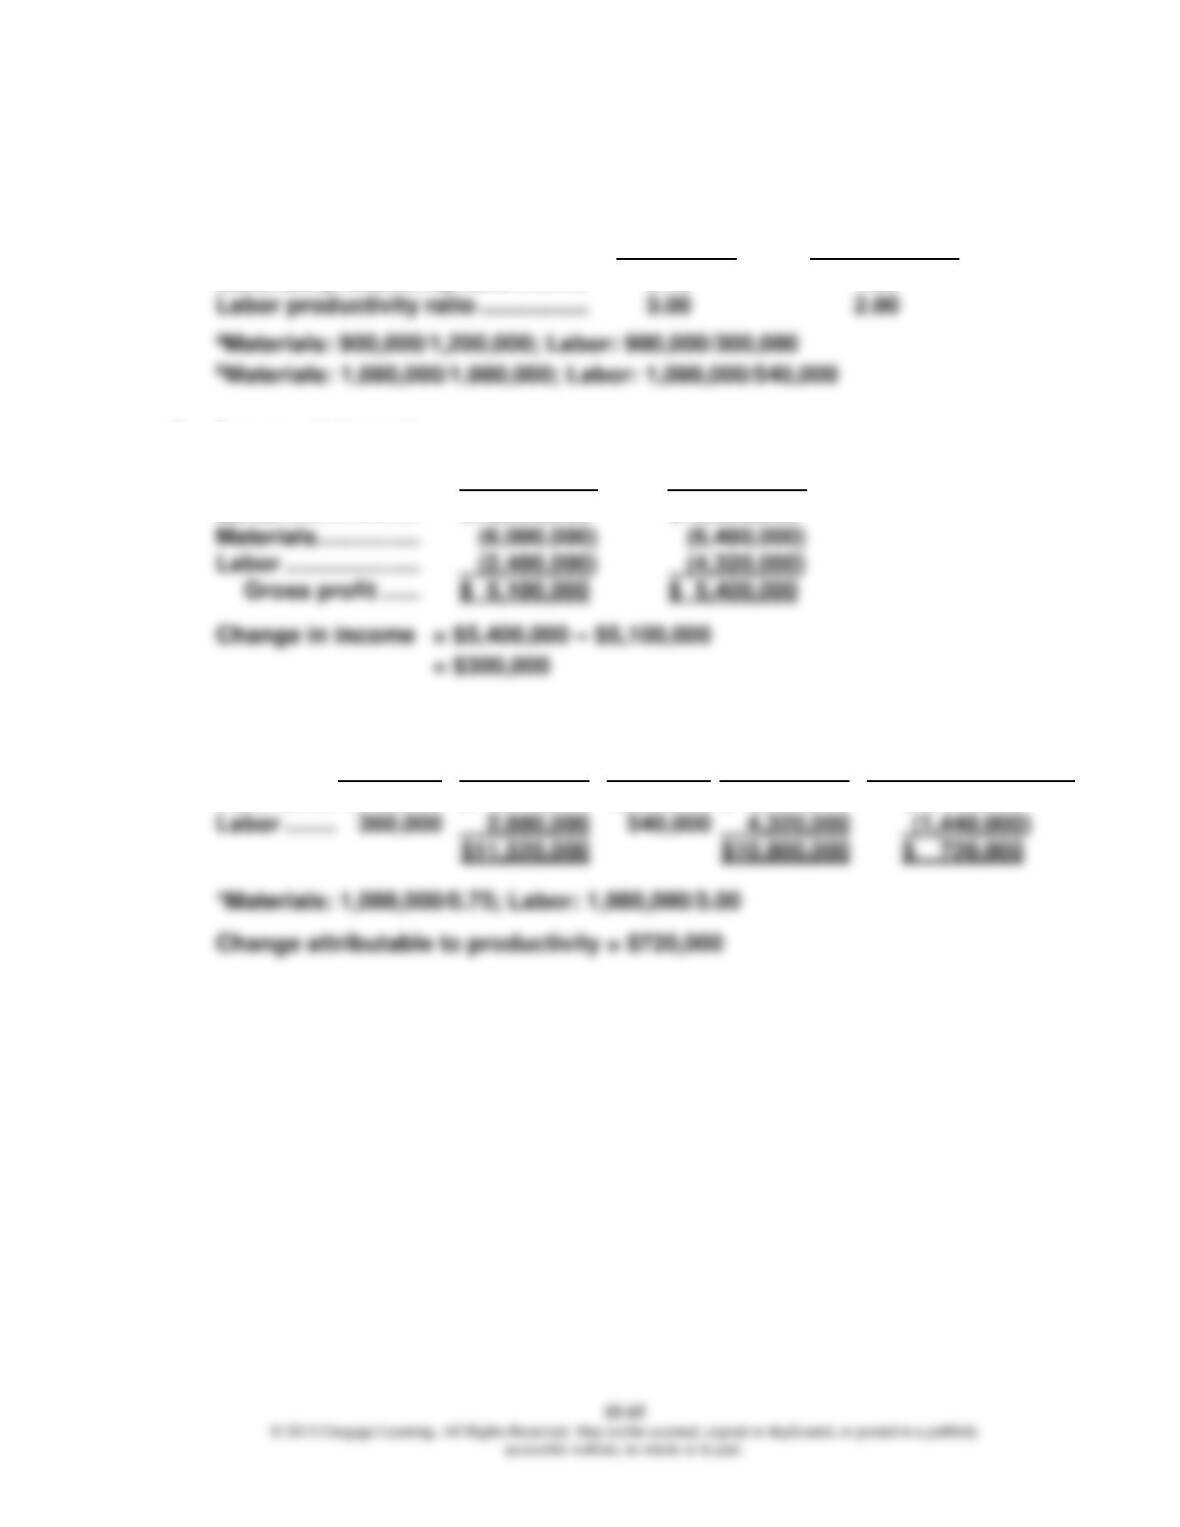
1. Productivity profiles:
Base Yeara Current Yearb
Materials productivity ratio ……….. 0.75 1.00
2. Income statements:
Base Year Current Year
Sales …………………. $13,500,000 $16,200,000
3. Profit-linked measurement (where P = $6 and $8, respectively):
PQ* PQ × P AQ AQ × P (PQ × P) – (AQ × P)
Materials … 1,440,000 $ 8,640,000 1,080,000 $ 6,480,000 $ 2,160,000
Exercise 15.16 (Concluded)
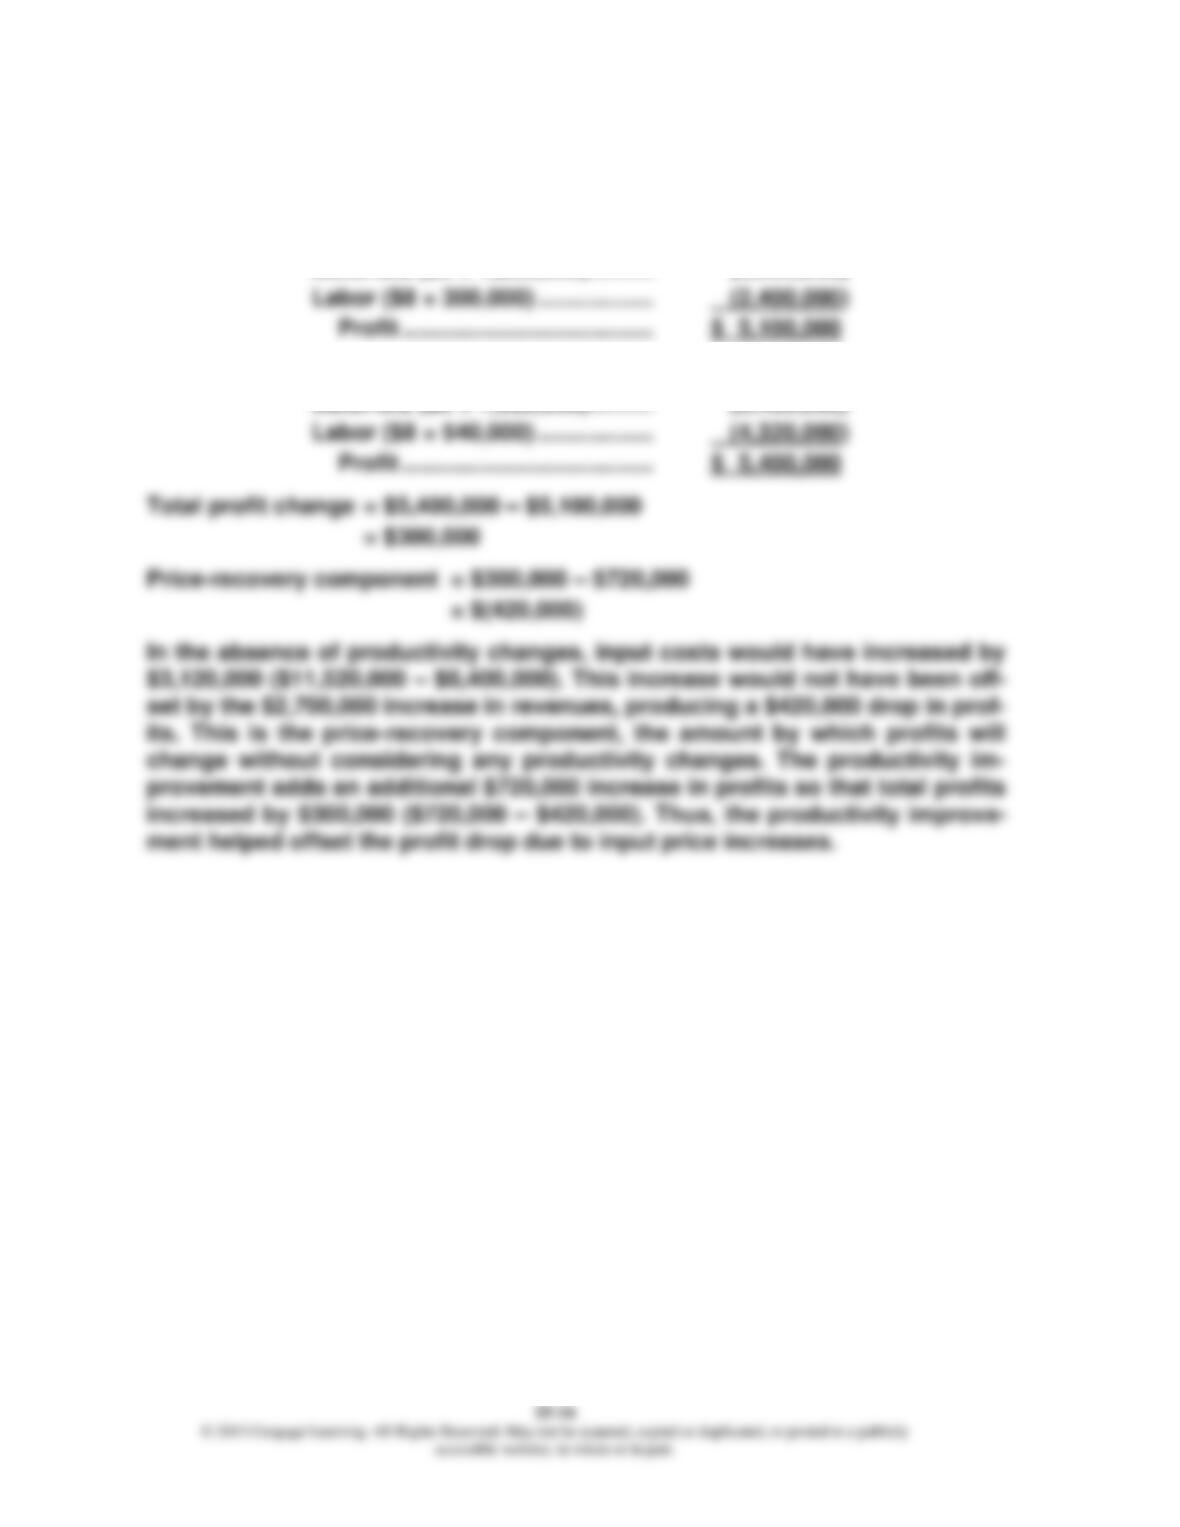
4. Total profit change:
Base Year: Revenues ($15 × 900,000) ……… $ 13,500,000
Materials ($5 × 1,200,000)………. (6,000,000)
Current Year: Revenues ($15 × 1,080,000) …… $ 16,200,000
Materials ($6 × 1,080,000)………. (6,480,000)
CPA-TYPE EXERCISES
Exercise 15.17
Exercise 15.18
Exercise 15.19
Exercise 15.20
Exercise 15.21
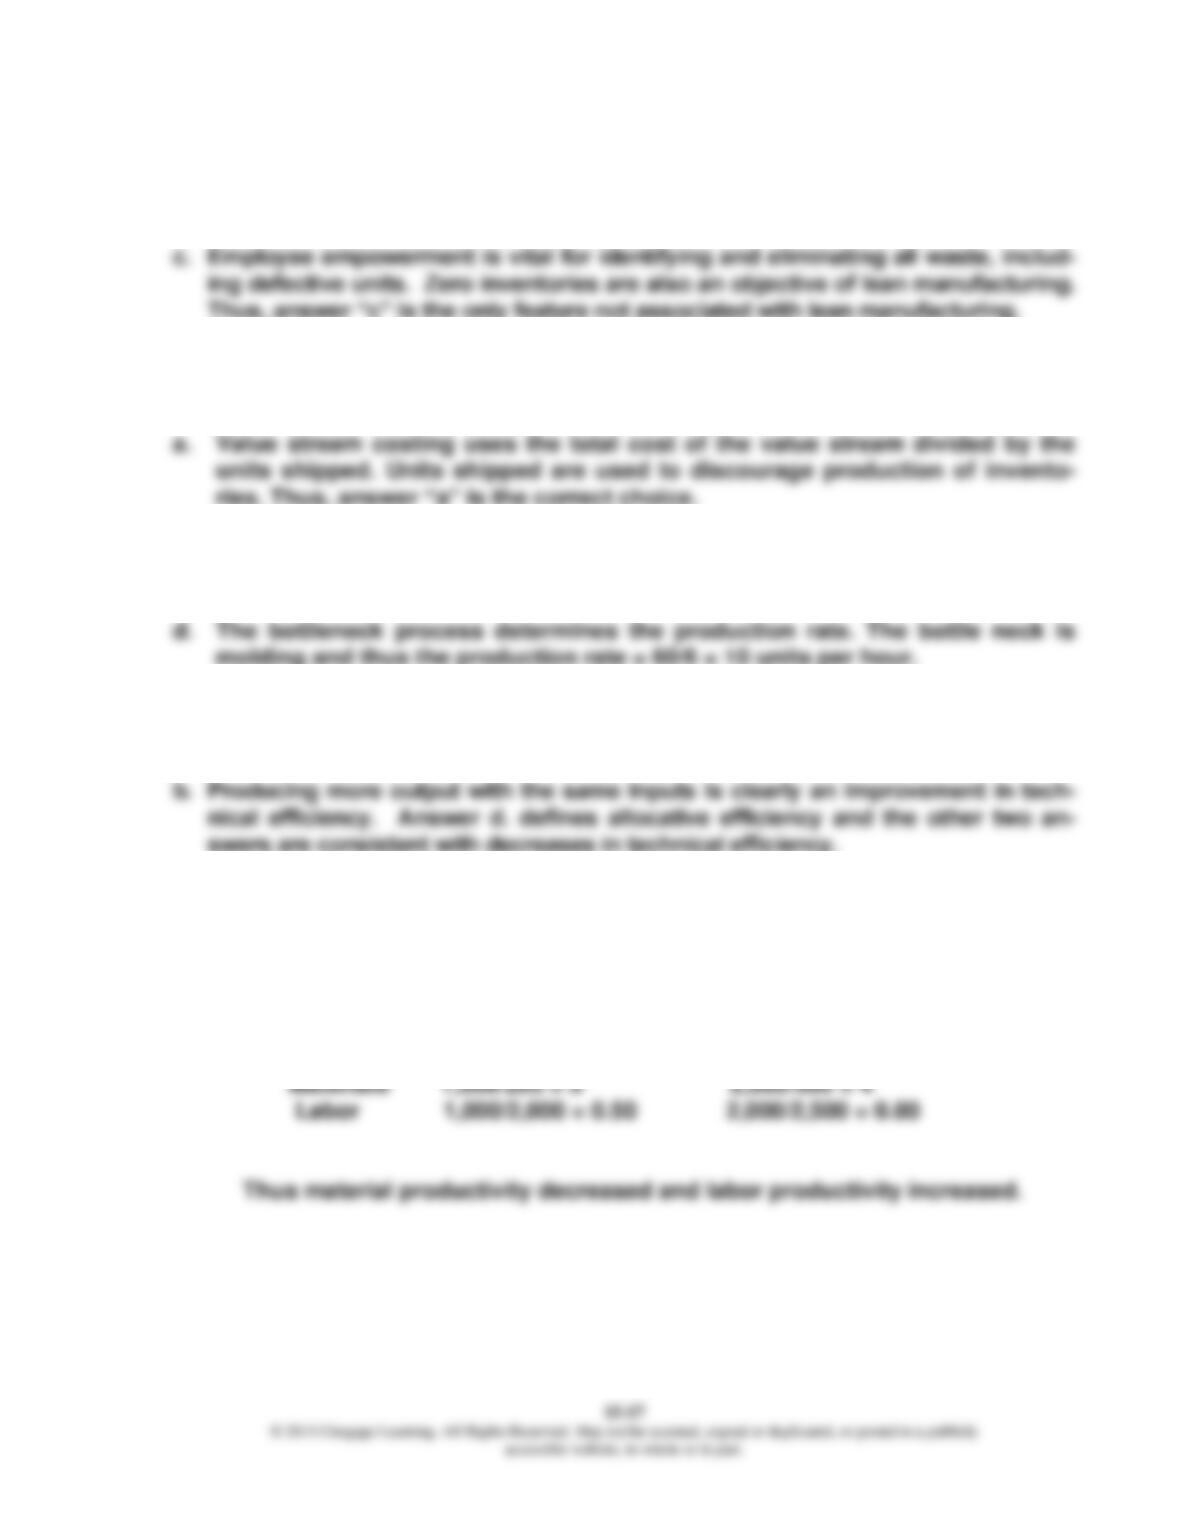
c. Productivity ratios for each year are as follows:
Year 1 Year 2
PROBLEMS
Problem 15.22
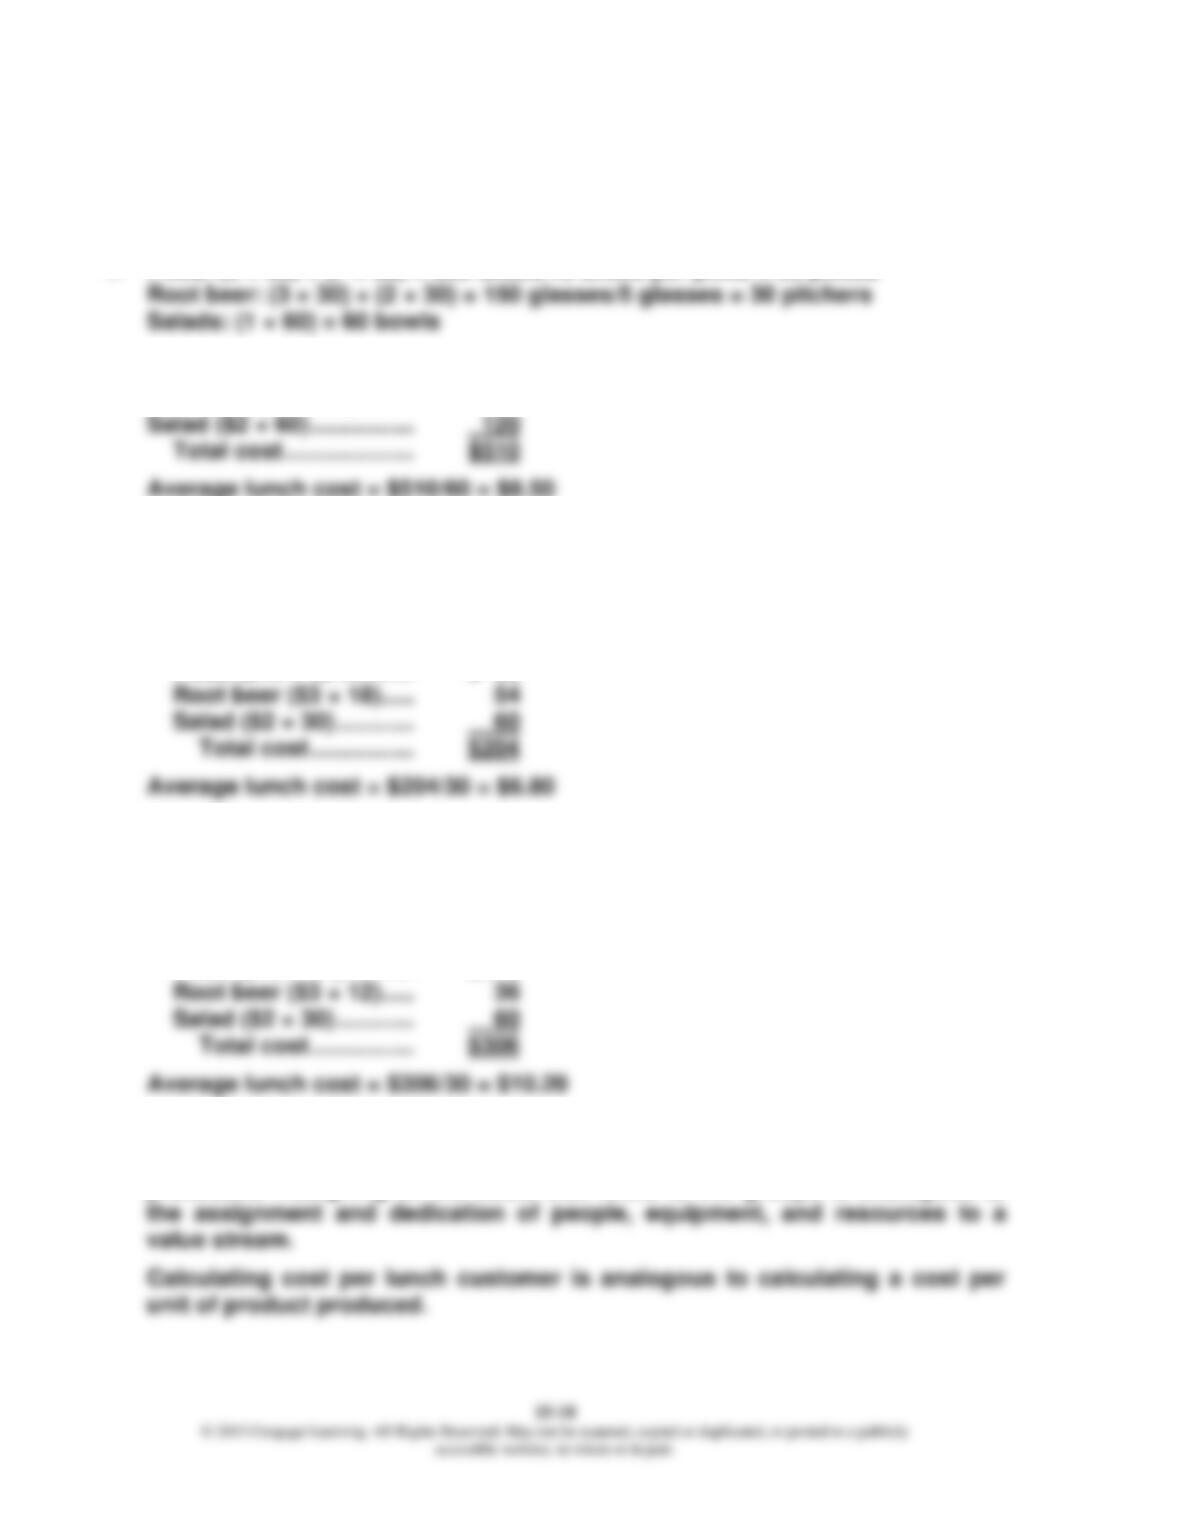
1. Pizza: (3 × 30) + (7 × 30) = 300 slices/10 slices per pizza = 30 pizzas
2. Pizza ($10 × 30) ………….. $300
Root beer ($3 × 30) ……… 90
3. Group (value stream) A:
Pizza: (3 × 30) = 90 slices/10 slices per pizza = 9 pizzas
Root beer: (3 × 30) = 90 glasses/5 glasses = 18 pitchers
Salads: (1 × 30) = 30 bowls
Pizza ($10 × 9) ………… $ 90
Group (value stream) B:
Pizza: (7 × 30) = 210 slices/10 slices per pizza = 21 pizzas
Root beer: (2 × 30) = 60 glasses/5 glasses = 12 pitchers
Salads: (1 × 30) = 30 bowls
Pizza ($10 × 21) ………. $210
Placing customers into groups based on similar consumption patterns is
analogous to placing products in value streams based on usage of similar
processes. Assigning all the costs that relate to the groups is analogous to
Problem 15.22 (Concluded)
ABC cost is based on causal relationships:
Cost per slice of pizza = $10/10 = $1 per slice
Cost per glass of root beer = $3/5 = $0.60
Problem 15.23
1. Group (Light Eaters) A:
Pizza: (2 × 15) + (3 × 15) = 75 slices/10 slices per pizza = 8 pizzas
Root beer: (2 × 15) + (3 × 15) = 75 glasses/5 glasses = 15 pitchers
Salads: (1 × 30) = 30 bowls
Problem 15.23 (Concluded)
Group (Heavy Eaters) B:
Pizza: (6 × 15) + (7 × 15) = 195 slices/10 slices per pizza = 20 pizzas
Root beer: (3 × 15) + (2 × 15) = 75 glasses/5 glasses = 15 pitchers
Salads: (1 × 30) = 30 bowls
ABC cost is based on causal relationships:
Cost per slice of pizza = $10/10 = $1 per slice
Cost per glass of root beer = $3/5 = $0.60
2. The extra capacity created by this reduction is 30 (1 × 30) slices of pizza and
30 (1 × 30) glasses of root beer. Thus, if this excess capacity is eliminated,
3 fewer pizzas (30/10) and 6 fewer pitchers of root beer (30/5) would be need-
ed. This would reduce costs by ($10 × 3) + ( $3 × 6) = $48. Thus, the new aver-
Problem 15.24
1. The operational performance measures that improved for the first six months
all have to do with improving time-based performance. On-time delivery and
dock-to-dock days showed dramatic improvements, reflecting the increased
ability of the firm to produce on demand. From the capacity measures, we see
2. The constant sales per person, coupled with constant total sales, suggest
that the head count has not been reduced. More resources are available for
use by the value stream as reflected by the increase in available capacity. The
3. Accepting the order only promises a contribution of $10,000, or an ROS of 10
percent, using the traditional standard cost. However, the value stream has 50
Problem 15.25
1. a. Standard-costing-based. Materials price variances may encourage buying
in quantity to take advantage of discounts and thus work against the ob-
advanced manufacturing environment).
b. Lean-based. Cycle time encourages reduction of the time it takes to pro-
duce products. This is compatible with the pull-through philosophy of JIT
c. Lean-based. This comparison encourages managers to reduce actual
costs to the targeted level. This is compatible with the objective of contin-
d. Standard-costing-based. Materials usage variances may encourage poor
quality or excessive inventory. These outcomes conflict with the objec-
e. Lean-based. Trend reports emphasize the objective of continuous im-
provement. The objective is to encourage managers to produce favorable
trends.
f. Standard-costing-based. Traditional performance reports can encourage
excessive inventory, lack of preventive maintenance, and poor quality, all
g. Lean-based. Benchmarking helps foster change. By identifying the best
practices of competitors, opportunities, as well as the need for increased
efficiency, are noted. This supports the principle of continuous improve-
ment.
h. Lean-based. Improving delivery performance is compatible with the objec-
tives of continuous improvement, service quality, and pull-through pro-
Problem 15.25 (Continued)
i. Lean-based. Quality measures are virtually ignored by a standard-costing
system. Yet, knowing quality performance is fundamental to measuring
and improving quality.
j. Lean-based. Highlighting value- and non-value-added costs is compatible
with the objectives of absolute efficiency and continuous improvement.
k. Standard-costing-based. Labor efficiency variances can encourage poor
quality and inventories, both of which conflict with the objectives of total
l. Lean-based. If the objective is to reduce days of inventory, then this
measure is compatible with the objective of zero inventories. In this case,
the trend in the measure is important and should be declining.
m. Lean-based. Reducing downtime is compatible with total preventive
maintenance, zero inventories, and the pull-through philosophy of JIT. As
downtime is reduced, one of the major reasons for carrying inventory is
eliminated.
n. Lean-based. Manufacturing cycle efficiency is compatible with continuous
improvement and elimination of non-value-added activities. As non-value-
Problem 15.25 (Concluded)
2. Operational: b, h, i, l, m, n, and sometimes q
3. Strategic-based accounting derives its measures from the mission and
strategy of the organization. Thus, the set of measures is strategically linked.
The set of measures expands to cover customer and learning and growth
Problem 15.26
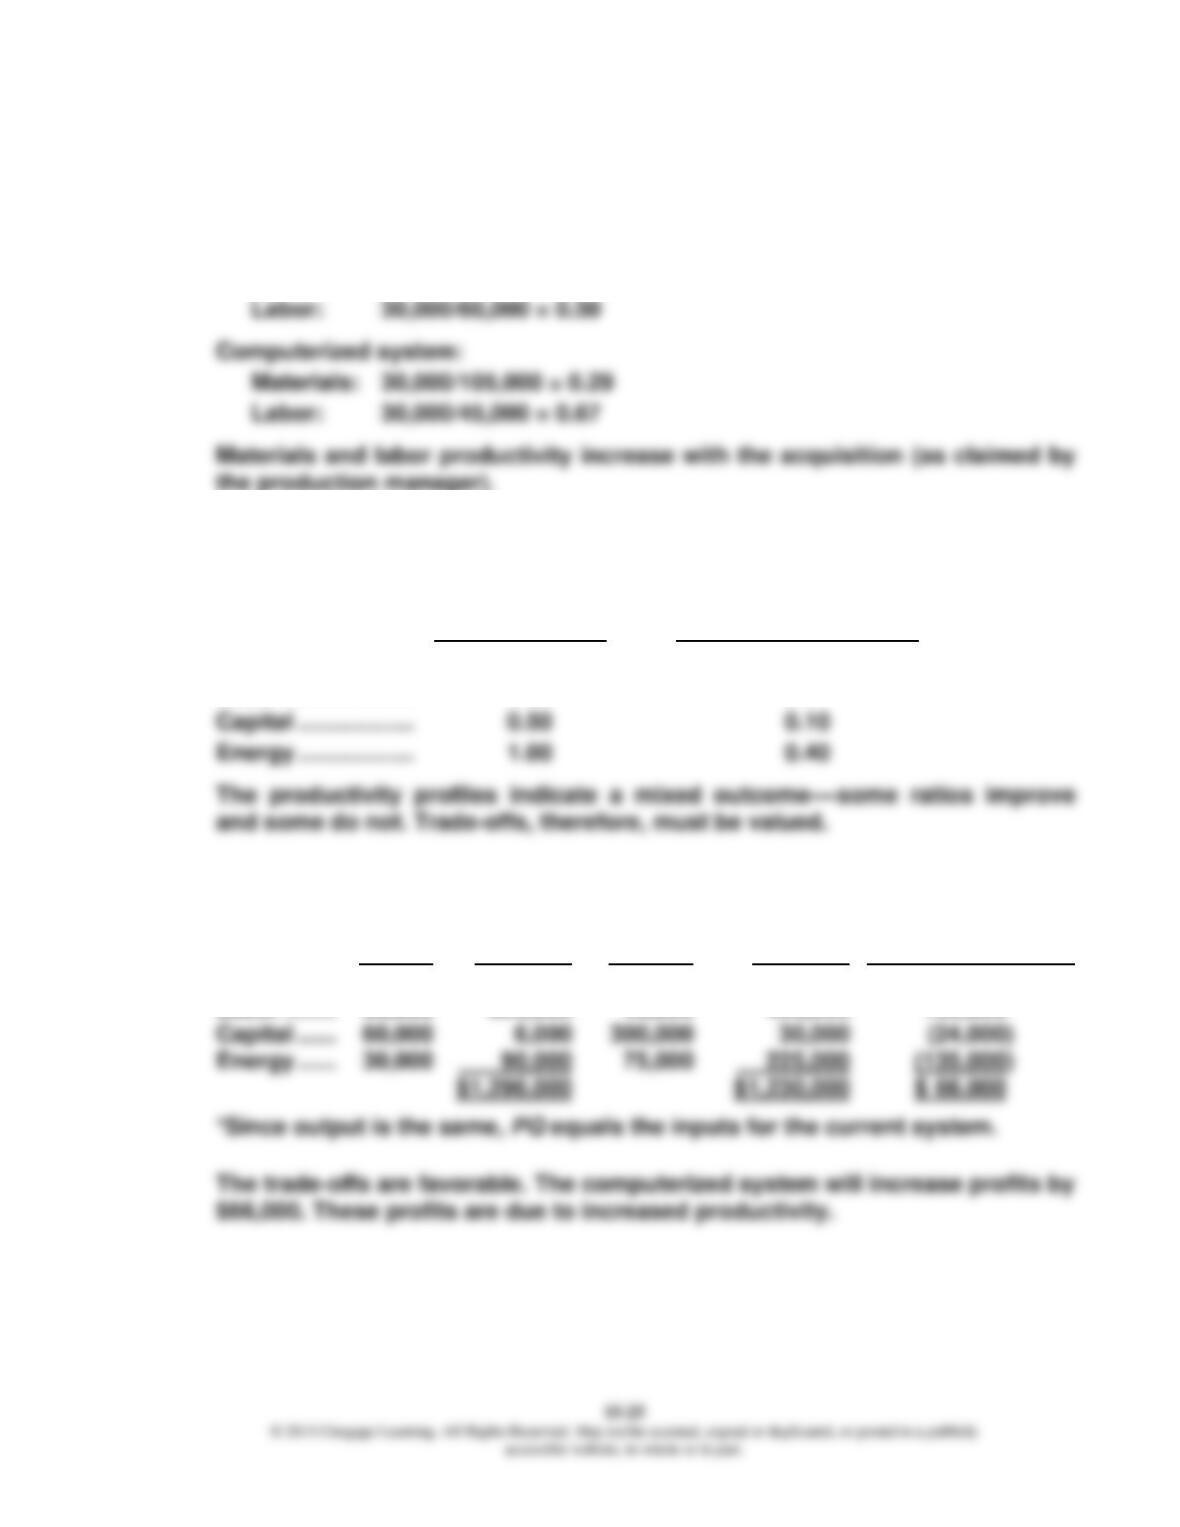
1. Productivity profiles:
Current system:
Materials: 30,000/120,000 = 0.25
2. To compare the alternatives, all inputs must be considered:
Productivity profiles:
Current System Computerized System
Materials …………… 0.25 0.29
Labor ……………….. 0.50 0.67
3. Profit-linked measurement (where P = $5.00, $10.00, 10.00%, and $3.00, re-
spectively):
PQ* PQ × P AQ AQ × P (PQ × P) – (AQ × P)
Materials … 120,000 $ 600,000 105,000 $ 525,000 $ 75,000
Labor …….. 60,000 600,000 45,000 450,000 150,000
Problem 15.27
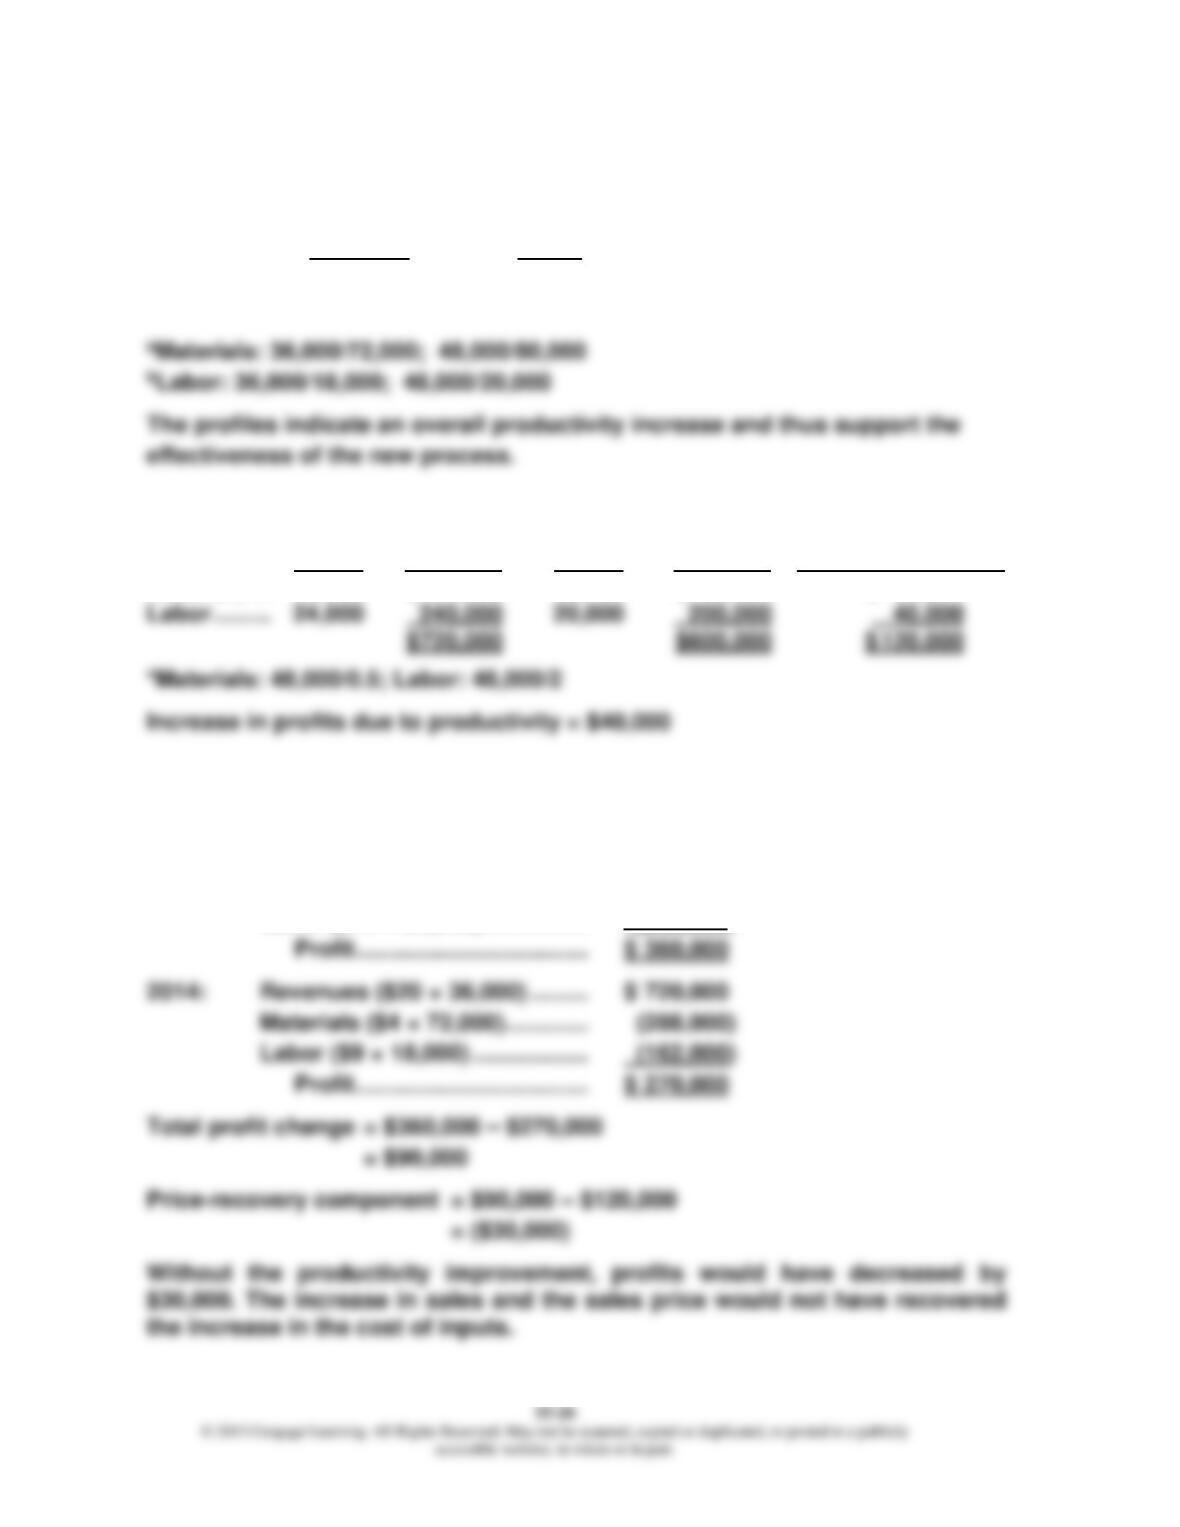
1. Productivity profiles:
Materialsa Laborb
2014 ……….. 0.50 2.0
2015 ……….. 0.60 2.4
2. Profit-linked measurement (where P = $5.00 and $10, respectively):
PQ* PQ × P AQ AQ × P (PQ × P) – (AQ × P)
Materials … 96,000 $480,000 80,000 $400,000 $ 80,000
3. Price-recovery component:
Total profit change:
2015: Revenues ($20 × 48,000) ……… $ 960,000
Materials ($5.00 × 80,000) …….. (400,000)
Labor ($10 × 20,000) ……………. (200,000)
Problem 15.28
1. Productivity profiles:
Materials Labor
a. 2014 …………………. 1.67 0.83
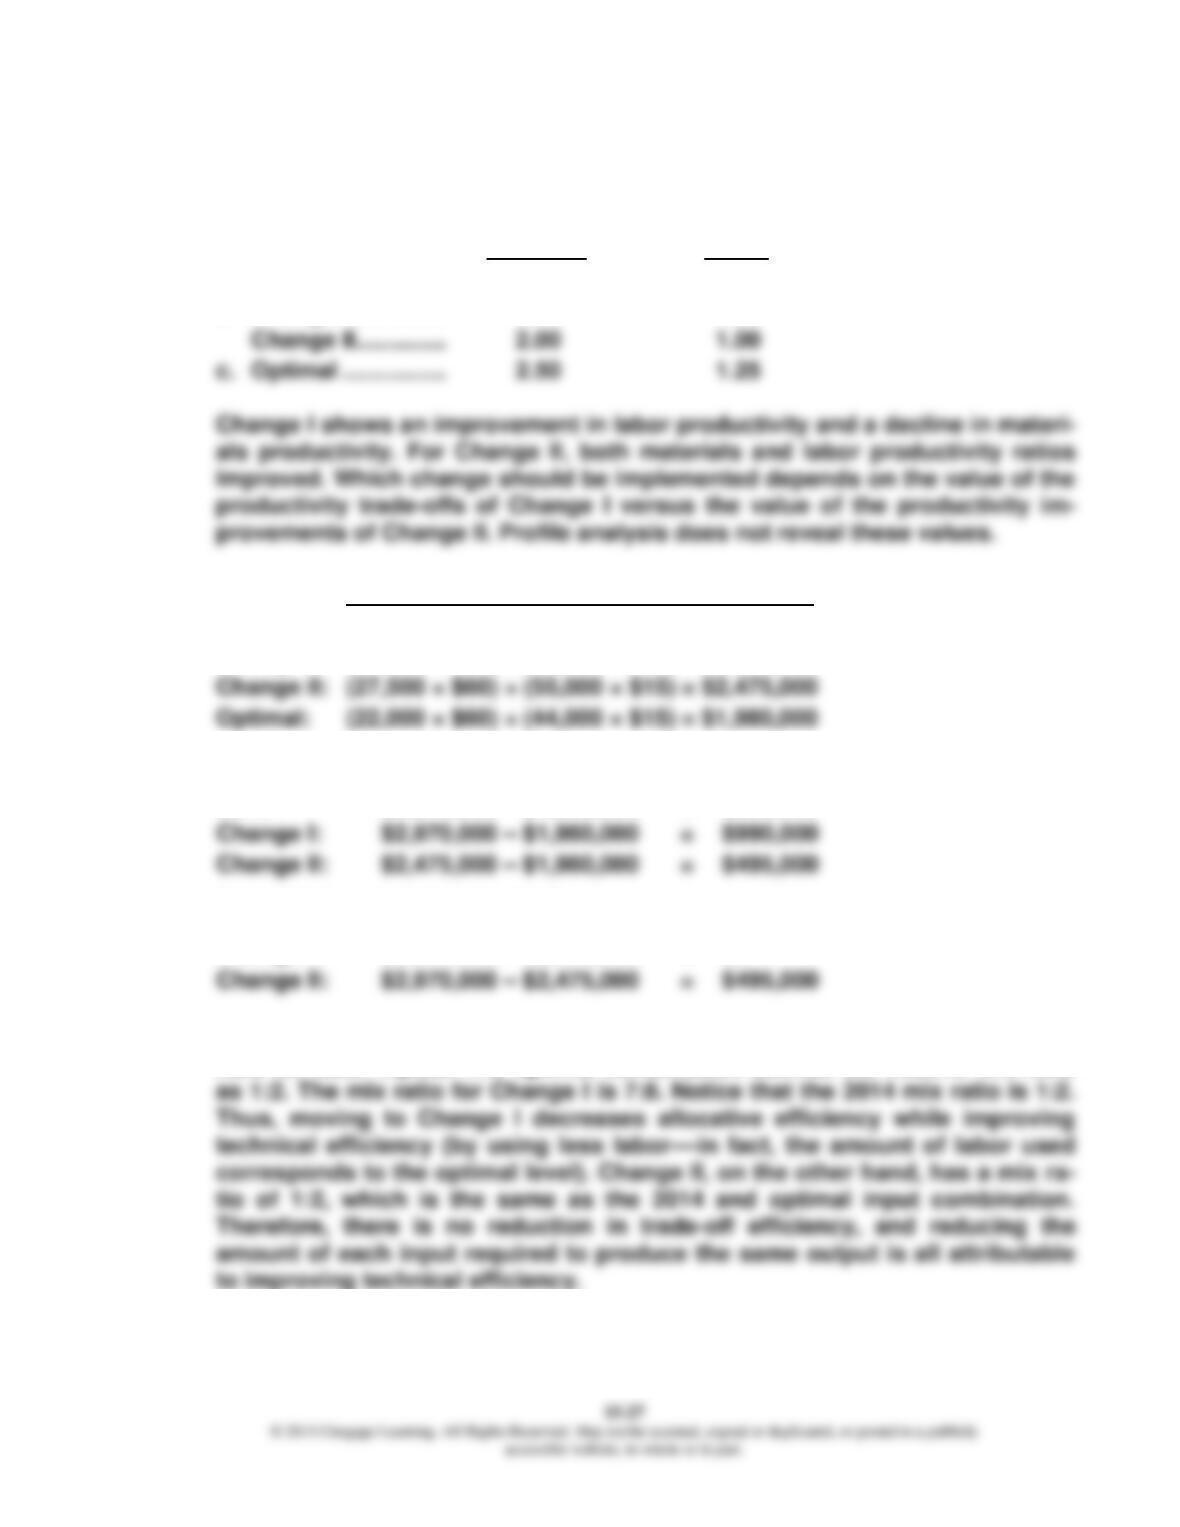
b. Change I …………… 1.43 1.25
2. Cost
2014: (33,000 × $60) + (66,000 × $15) = $2,970,000
Change I: (38,500 × $60) + (44,000 × $15) = $2,970,000
Cost of productive inefficiency:
2014: $2,970,000 – $1,980,000 = $990,000
Potential improvement for 2015:
Change I: $2,970,000 – $2,970,000 = $0
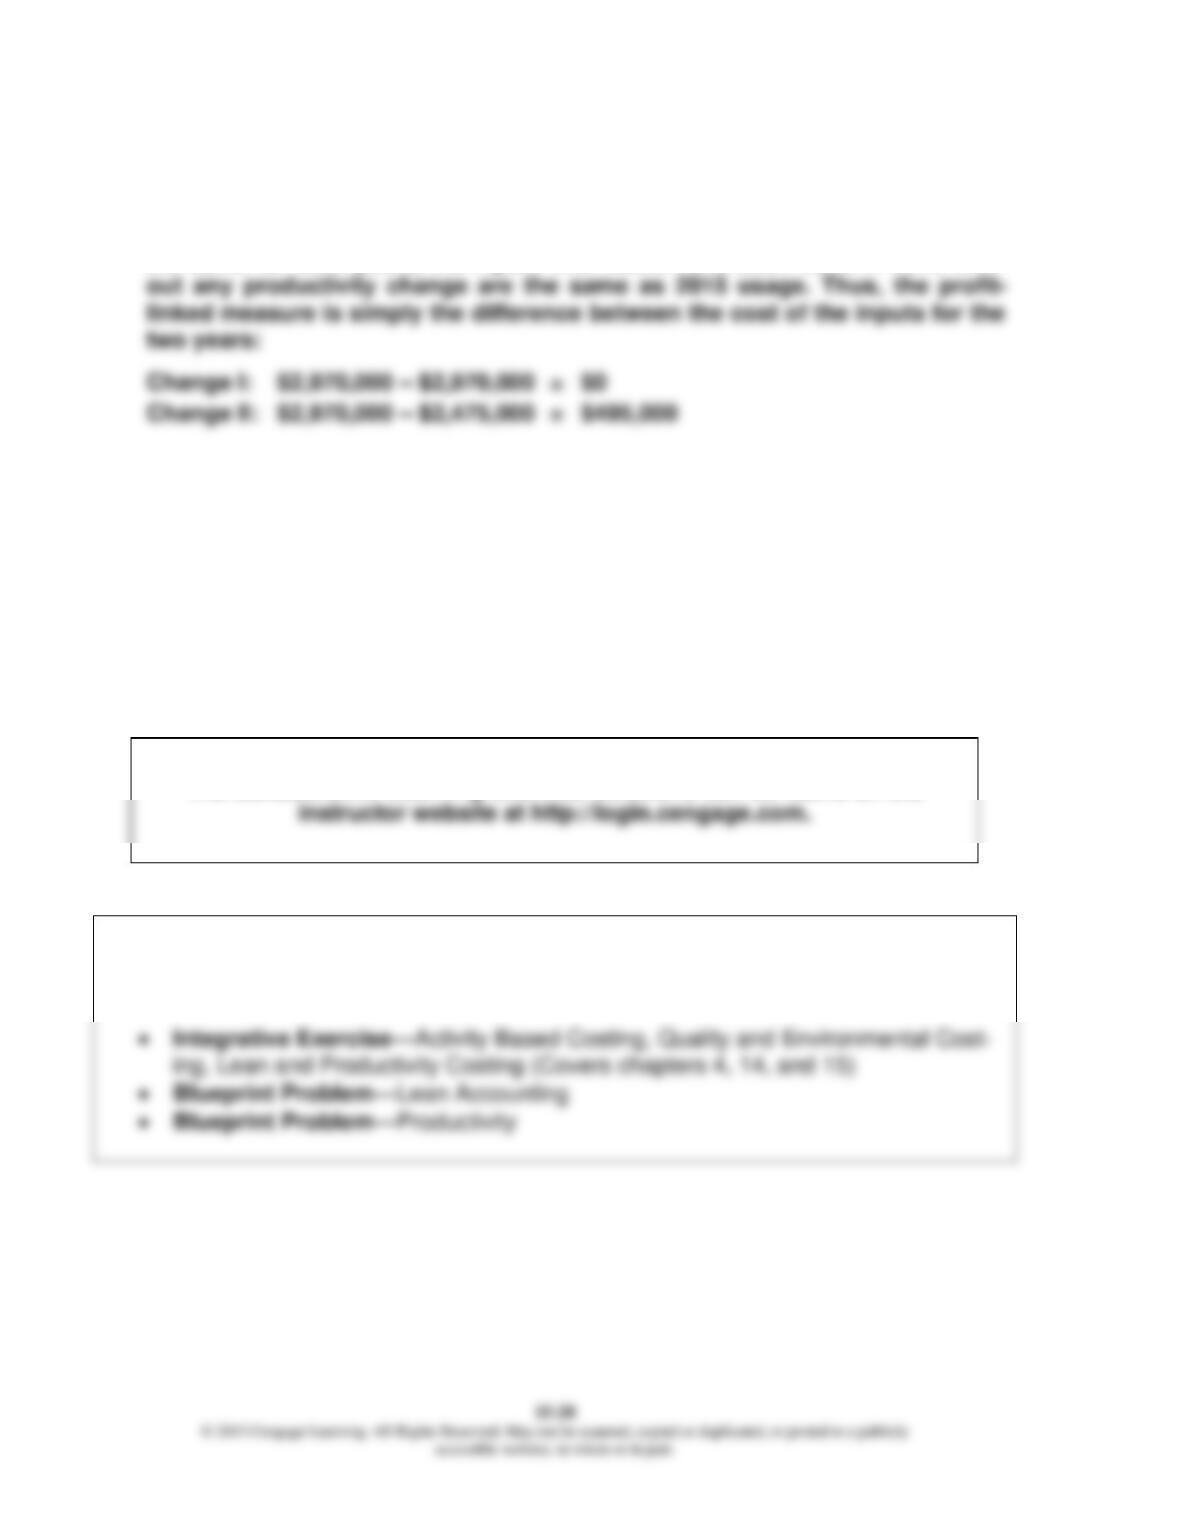
Change I improves the technical use of labor but does so by trading off mate-
rials for labor inputs. The optimal combination defines the relative mix ratio
Problem 15.28 (Concluded)
3. The profit-linked measurement approach will provide the same outcome with-
out requiring knowledge of the optimal input combination. Since the output is
the same for both years, the inputs that would have been used in 2015 with-
CYBER RESEARCH CASE
15.29
Answers will vary.
The following problems can be assigned within CengageNOW and are auto-
graded. See the last page of each chapter for descriptions of these new assign-
ments.
The Collaborative Learning Exercise Solutions can be found on the