CHAPTER 15 Statement of Cash Flows
Appendix 2 Prob. 15–4B
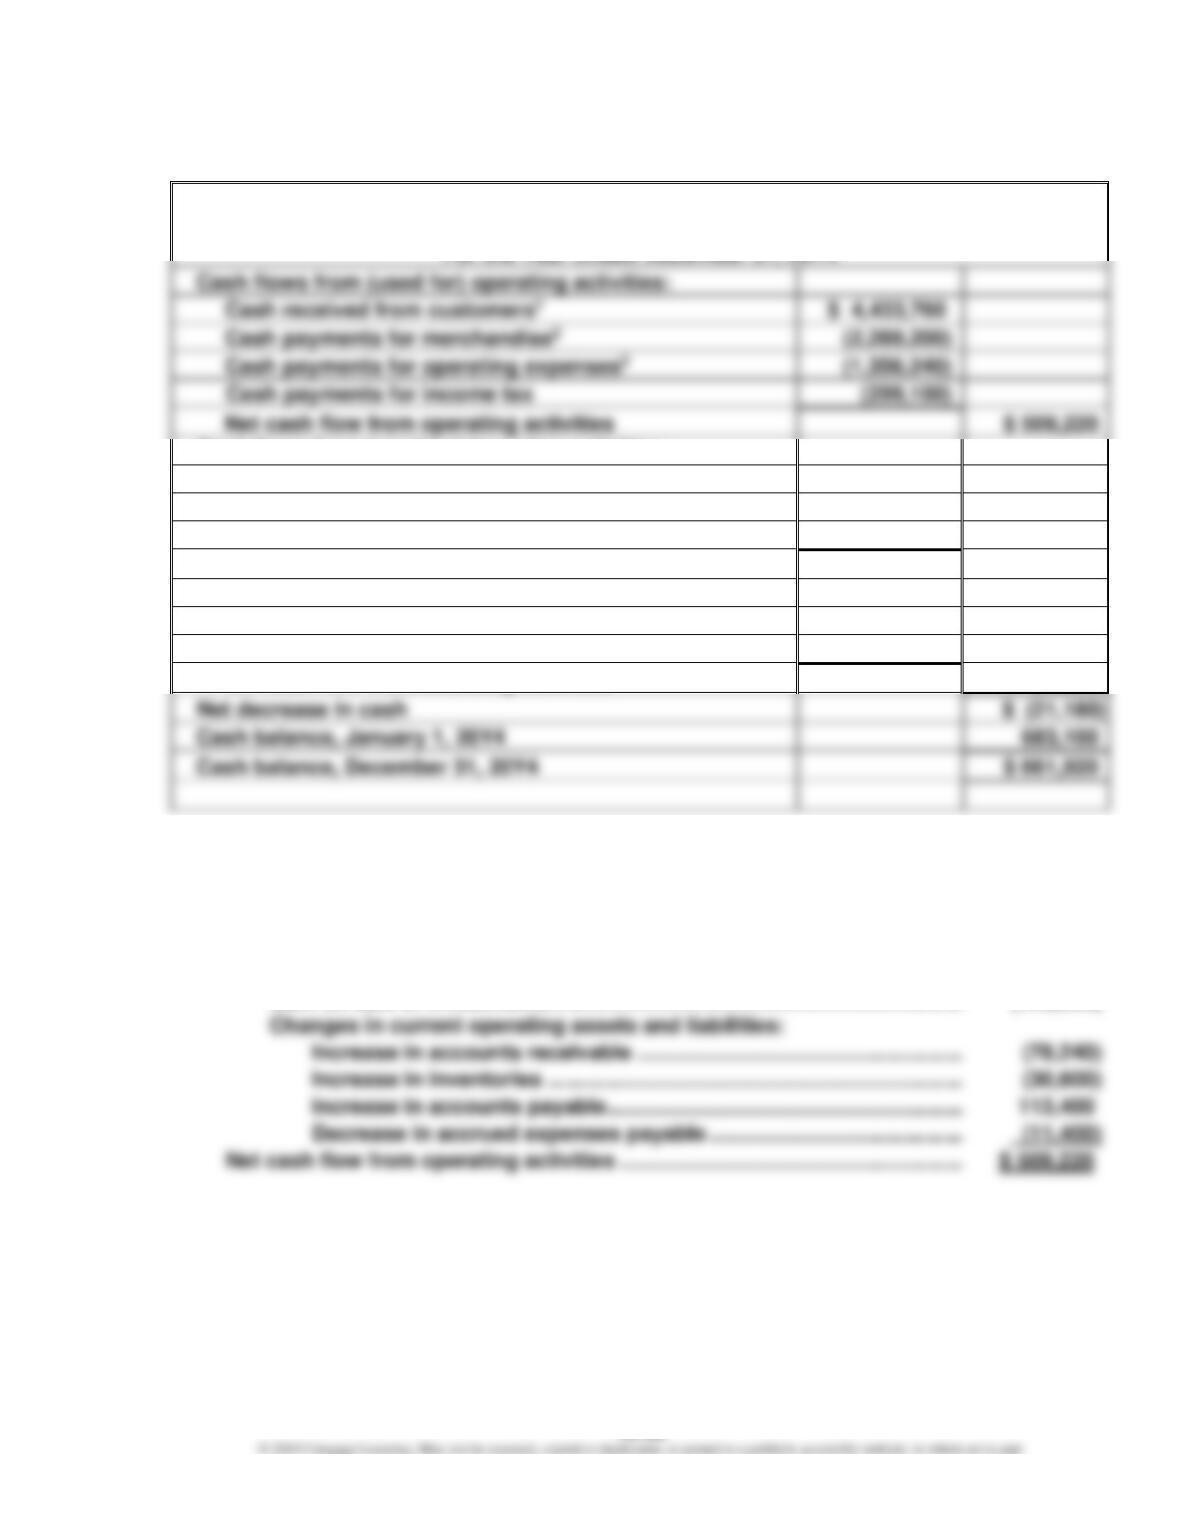
Martinez Inc.
Statement of Cash Flows
Cash flows from (used for) operating activities:
$ 4,433,760
Cash payments for income tax
(299,100)
Net cash flow from operating activities
Cash flows from (used for) investing activities:
Cash received from sale of investments
$ 588,000
Cash paid for land
(960,000)
Cash paid for equipment
(240,000)
Net cash flow used for investing activities
(612,000)
Cash flows from (used for) financing activities:
Cash received from sale of common stock
$ 600,000
Cash paid for dividends*
(518,400)
Net cash flow from financing activities
81,600
Net decrease in cash
Cash balance, January 1, 20Y4
Cash balance, December 31, 20Y4
Reconciliation of Net Income with Cash Flows from Operating Activities:
Net income …………………………………………………………………………………………. $ 558,960
Adjustments to reconcile net income to net cash flow
from operating activities:
Depreciation expense …………………………………………………………………… 113,100
* Dividends paid: $528,000 + $91,200 – $100,800 = $518,400
CHAPTER 15 Statement of Cash Flows
Appendix 2 Prob. 15–4B (Concluded)
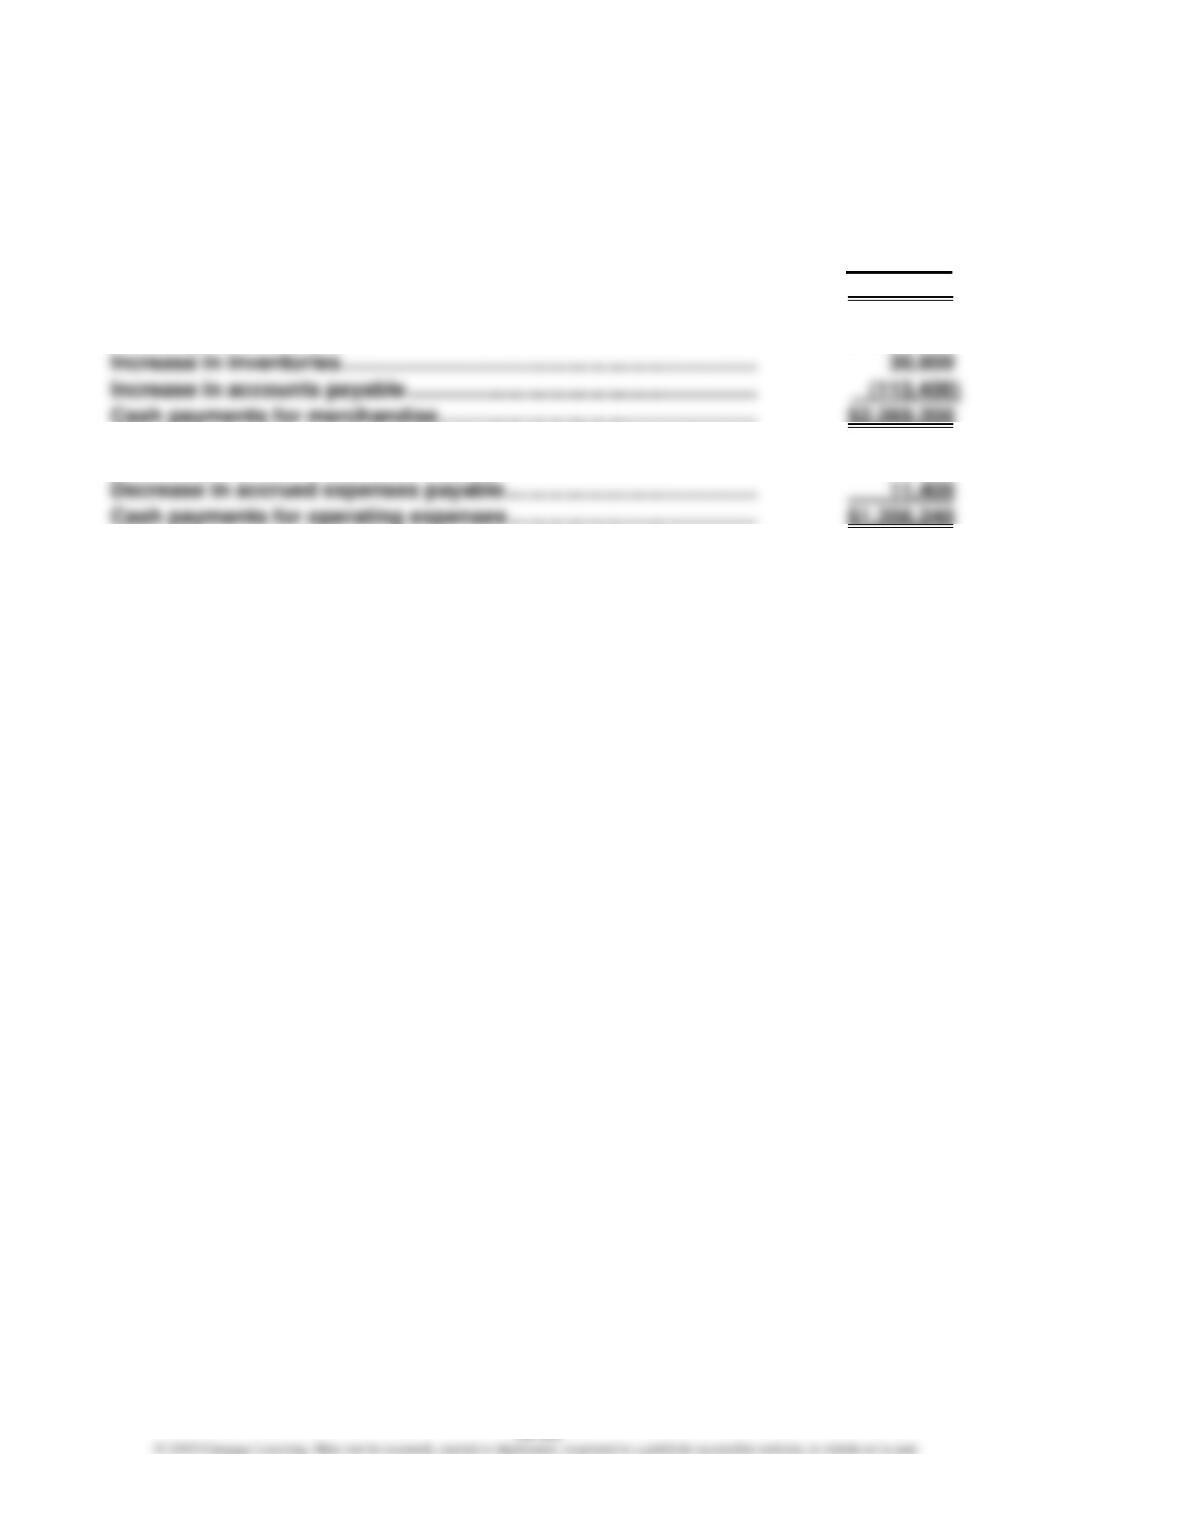
Computations:
1. Sales …………………………………………………………………………………….. $4,512,000
Increase in accounts receivable ……………………………………………… (78,240)
Cash received from customers ………………………………………………. $4,433,760
2. Cost of goods sold ………………………………………………………………… $2,352,000
3. Operating expenses other than depreciation …………………………... $1,344,840
CHAPTER 15 Statement of Cash Flows
Appendix 2 Prob. 15–5B
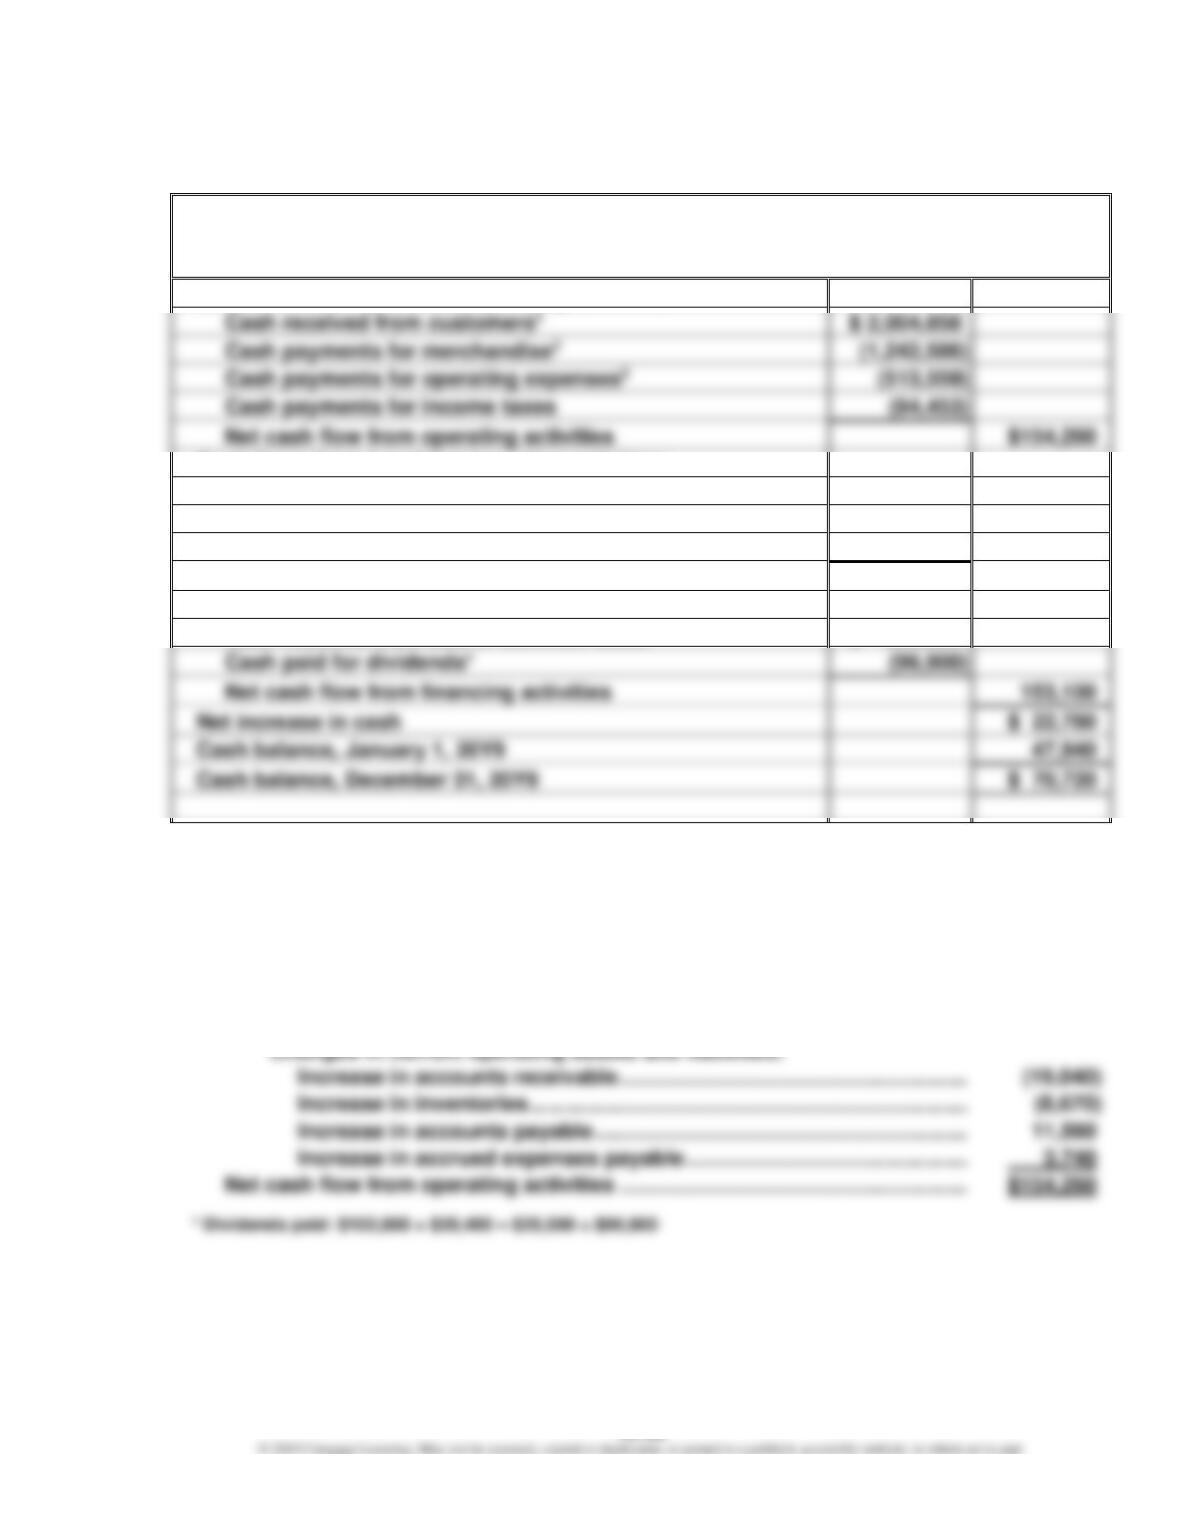
Merrick Equipment Co.
Statement of Cash Flows
For the Year Ended December 31, 20Y9
Cash flows from (used for) operating activities:
$ 2,004,858
(513,559)
Cash payments for income taxes
(94,453)
Net cash flow from operating activities
Cash flows from (used for) investing activities:
Cash received from sale of investments
$ 91,800
Cash paid for purchase of land
(295,800)
Cash paid for purchase of equipment
(80,580)
Net cash flow used for investing activities
(284,580)
Cash flows from (used for) financing activities:
Cash received from sale of common stock
$ 250,000
Cash paid for dividends*
(96,900)
Net cash flow from financing activities
153,100
Net increase in cash
Cash balance, January 1, 20Y9
Cash balance, December 31, 20Y9
Reconciliation of Net Income with Cash Flows from Operating Activities:
Net income ………………………………………………………………………………………….. $141,680
Adjustments to reconcile net income to net cash flow from operating
activities:
Depreciation …………………………………………………………………………………. 14,790
Loss on sale of investments ………………………………………………………….. 10,200
CHAPTER 15 Statement of Cash Flows
Appendix 2 Prob. 15–5B (Concluded)
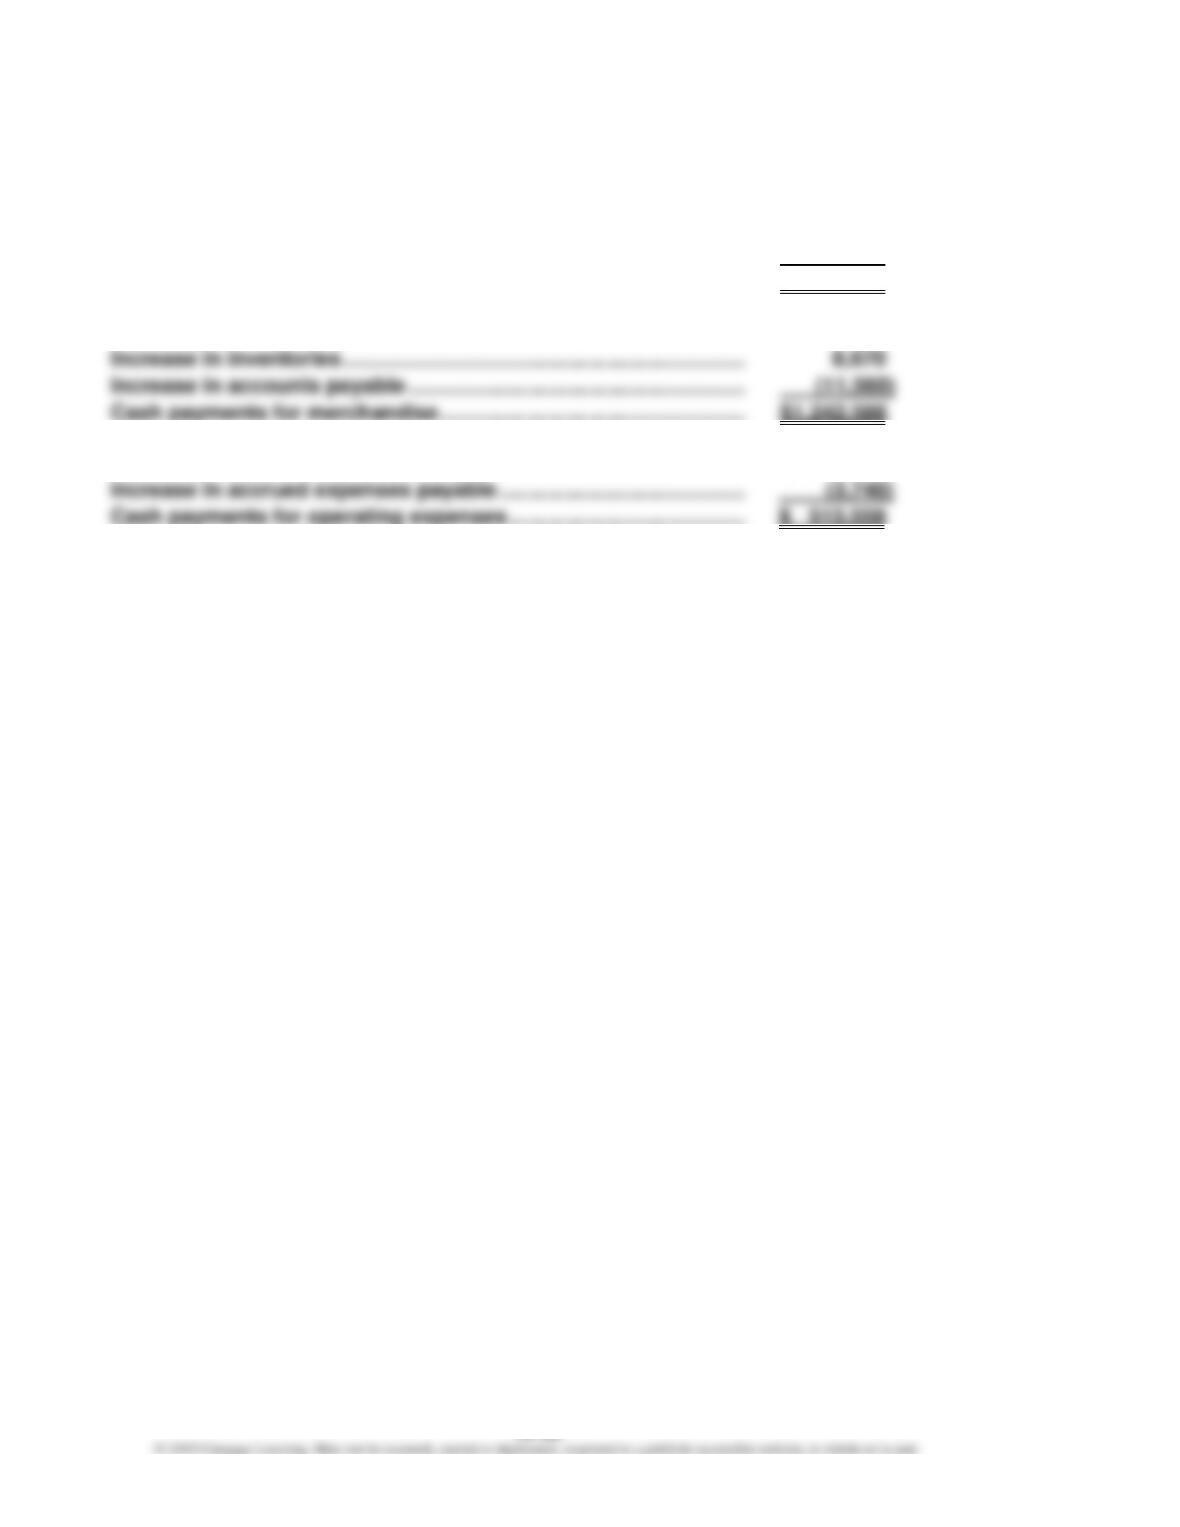
Computations:
1. Sales …………………………………………………………………………………… $2,023,898
Increase in accounts receivable ……………………………………………. (19,040)
Cash received from customers……………………………………………… $2,004,858
2. Cost of goods sold ………………………………………………………………. $1,245,476
3. Operating expenses other than depreciation …………………………. $ 517,299
CHAPTER 15 Statement of Cash Flows
MAKE A DECISION
MAD 15–1
a.
Amazon
Best Buy
Wal-Mart
Cash flows from operating activities
Cash used to purchase property,
plant, and equipment
Free cash flow
$1,963
$16,443
$2,545
$ 31,530
b.
Amazon
Best Buy
Wal-Mart
Ratio of free cash flow to sales
7.1%
5.0%
4.3%
($9,706 ÷
($1,963 ÷
($20,911 ÷
$135,987)
$39,403)
$485,873)
c. Amazon’s free cash flow is $9,706 million, which is higher than Best Buy’s but lower than
Wal-Mart’s. However, these companies vary greatly in size; thus, comparing absolute free
cash flow across these companies is not very meaningful. A relative measure that can be
MAD 15–2
a.
Apple
Coca-Cola
Verizon
Cash flows from operating activities
Cash used to purchase property,
(2,262)
(17,059)
Free cash flow
$ 6,534
$ 5,656
$ 65,824
$ 8,796
$ 22,715
b.
Apple
Coca-Cola
Verizon
Ratio of free cash flow to sales
24.6%
15.6%
4.5%
($53,090 ÷
$215,639)
($6,534 ÷
$41,863)
($5,656 ÷
$125,980)
c. Apple has the largest free cash flow. The ratio of free cash flow to sales is the best metric
CHAPTER 15 Statement of Cash Flows
MAD 15–3
a.
Year 3
Year 2
Year 1
Cash flows from operating activities
Cash used to purchase property,
$(68)
$(56)
$ (38)
b.
Year 3
Year 2
Year 1
Ratio of free cash flow to sales
–5.6%
–4.4%
–5.8%
[$(84) ÷
[$(80) ÷
[$(122) ÷
$1,507]
$1,839]
$2,091]
c. The free cash flow information does accurately show the financial stress on Aeropostale.
The free cash flow and ratio of free cash flow to sales were negative in the most recent
MAD 15–4
a. Total revenue is a good measure for assessing the relative size of the two companies.
b. Total revenue growth is measured horizontally for each company using Year 1 as the base
year as follows:
Year 3
Year 2
Year 1
AT&T
124%
111%
100%
Facebook
222%
144%
100%
144% = $17,928 ÷ $12,466
MAD 15–4 (Continued)
It is clear from these data that Facebook is growing much faster than AT&T. This is no
surprising in that Facebook is a young company that is expanding services and regions.
c. Cash used to purchase PP&E as a percentage of the cash flows from operating activities:
Year 3
Year 2
Year 1
AT&T
57%
56%
68%
Facebook
28%
24%
25%
AT&T
57% = $22,408 ÷ $39,344
56% = $20,015 ÷ $35,880
68% = $21,433 ÷ $31,338
Facebook
d. The data indicate that AT&T requires more cash to purchase PP&E than does Facebook.
e. AT&T:
Year 3
Year 2
Year 1
Cash flows from operating activities
$ 39,344
$ 35,880
$ 31,338
(20,015)
(21,433)
CHAPTER 15 Statement of Cash Flows
MAD 15–4 (Continued)
Facebook:
Year 3
Year 2
Year 1
Cash flows from operating activities
$16,108
$10,320
$ 7,326
(4,491)
Free cash flow
$11,617
$ 7,797
$ 5,495
$27,638)
$17,928)
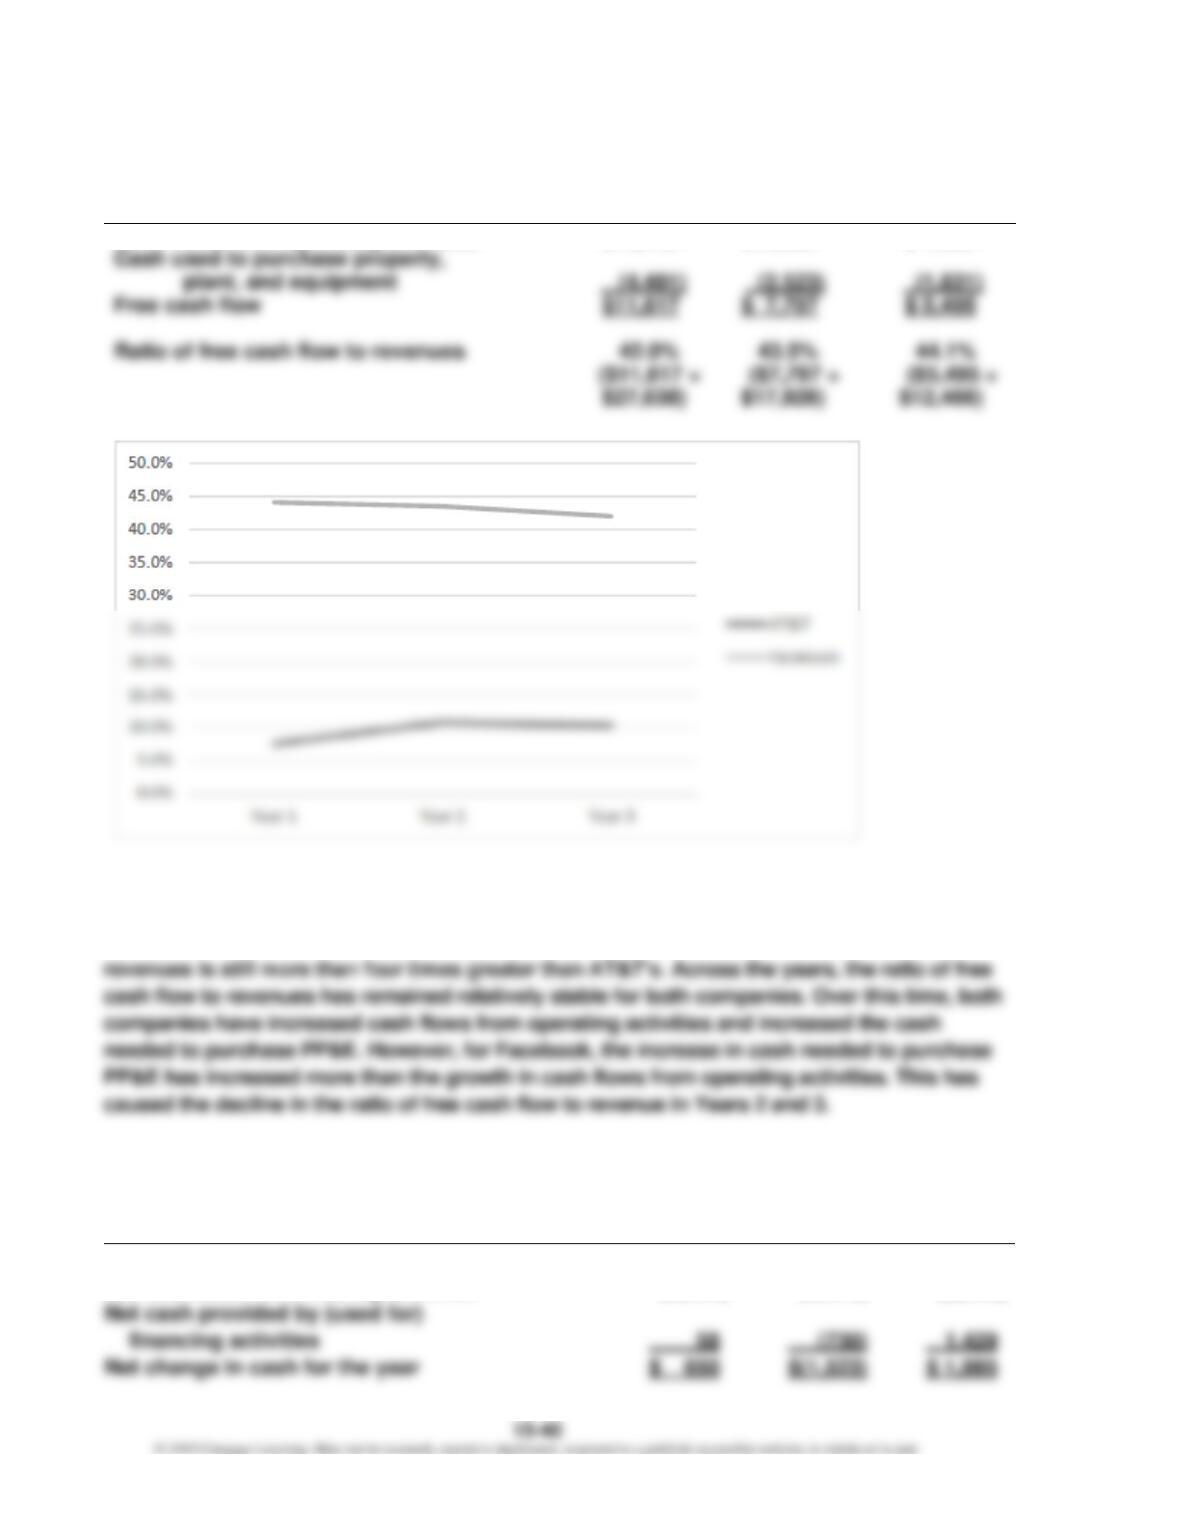
f. Facebook appears to have a better free cash flow position than does AT&T. In Year 1,
Facebook’s ratio of free cash flow to revenues is almost six times greater than AT&T’s. In
Years 2 and 3, the difference is smaller; however, Facebook’s ratio of free cash flow to
MAD 15–5
a. Net change in cash:
Year 3
Year 2
Year 1
Net cash provided by operating activities
$ 3,925
$ 3,102
$ 2,914
Net cash used for investing activities
Net cash provided by (used for)
(3,333)
(3,895)
(2,358)
MAD 15–5 (Concluded)
b. Free cash flow:
Year 3
Year 2
Year 1
Net cash provided by operating activities
$3,925
$3,102
$2,914
Additions to property, plant, and equipment
(220)
(174)
(132)
Free cash flow
$3,705
$2,928
$2,782
c. The free cash flow is almost $4 billion in Year 3. Over the three-year period, free cash flow
grew from $2,782 million to $3,705 million, or a 33% increase [($3,705 – $2,782) $2,782].
CHAPTER 15 Statement of Cash Flows
TAKE IT FURTHER
TIF 15–1
Although this situation might seem harmless at first, it is, in fact, a violation of generally
accepted accounting principles. The operating cash flow per share figure should not be
shown on the face of the income statement. The income statement is constructed under
accrual accounting concepts, while operating cash flow fiundoes” the accounting accruals.
TIF 15–2
A sample solution based on National Beverage Corp.’s Form 10-K for the fiscal year ended
April 30, 2016, follows:
1. a. $78,955 thousand
2. The company has a very strong cash position, generating considerably more cash flows
from operations than it requires for investing or financing activities.
CHAPTER 15 Statement of Cash Flows
TIF 15–3
Memo
To: My Instructor
From: A+ Student
Re: Tidewater Inc. Financial Condition
Tidewater Inc. is a retailer that has been unprofitable in recent years. While the company has
returned to profitability, there are several fired flags” indicating that the company’s future
prospects are highly uncertain. These red flags are discussed below.
• The company has initiated a new marketing campaign that significantly increased the
number of customers who are purchasing merchandise on credit using the company’s
• The purchases of deeply discounted merchandise appear to be backfiring. The company
has received some figood deals” on price. However, the merchandise is only a figood
merchandise.
• The company has not been able to pay off its accounts payable in a timely manner,
resulting in significant overdue accounts payable balances. While the company reports
These red flags suggest that the company is having severe operating cash flow difficulties,
and the company’s future prospects are highly uncertain.
CHAPTER 15 Statement of Cash Flows
TIF 15–4
Start-up companies are unique in that they frequently have negative retained earnings
earnings and operating cash flows. The negative retained earnings are often due to losses
from high start-up expenses. The negative operating cash flows are typical because growth
requires cash. Growth must be financed with cash before the cash returns. For example, a
company must expend cash to provide the service in Period 1 before selling the service and
receiving cash in Period 2. The start-up company constantly faces the problem of spending