Unlock document.
This document is partially blurred.
Unlock all pages and 1 million more documents.
Get Access
Analysis of Operating Activities 441
P14-4 TO: Marta Feliz
FROM: (student’s name)
DATE: (today’s date)
SUBJECT: Pricing of new dishwasher line
With regard to pricing our new, quiet dishwasher, we will of course want
to determine what selling price will maximize return to our stockholders.
This would be the price that will maximize profit on the line through get-
ting the highest possible excess of sales revenues over variable costs.
We need to consider whether the low sound level is a sufficiently at-
tractive feature to allow us to follow a product differentiation strategy for
P14-5 A. Discount Shoes probably would be located near lower-income resi-
dential areas and in lower-cost facilities. Buildings and equipment
would not be fancy. Shoes might be stacked in metal racks by shoe
size so customers could locate merchandise for themselves. Prod-
ucts would be low cost. Designs would be those for which high de-
442 Chapter 14
Elegant Footwear probably would be located in shopping malls and
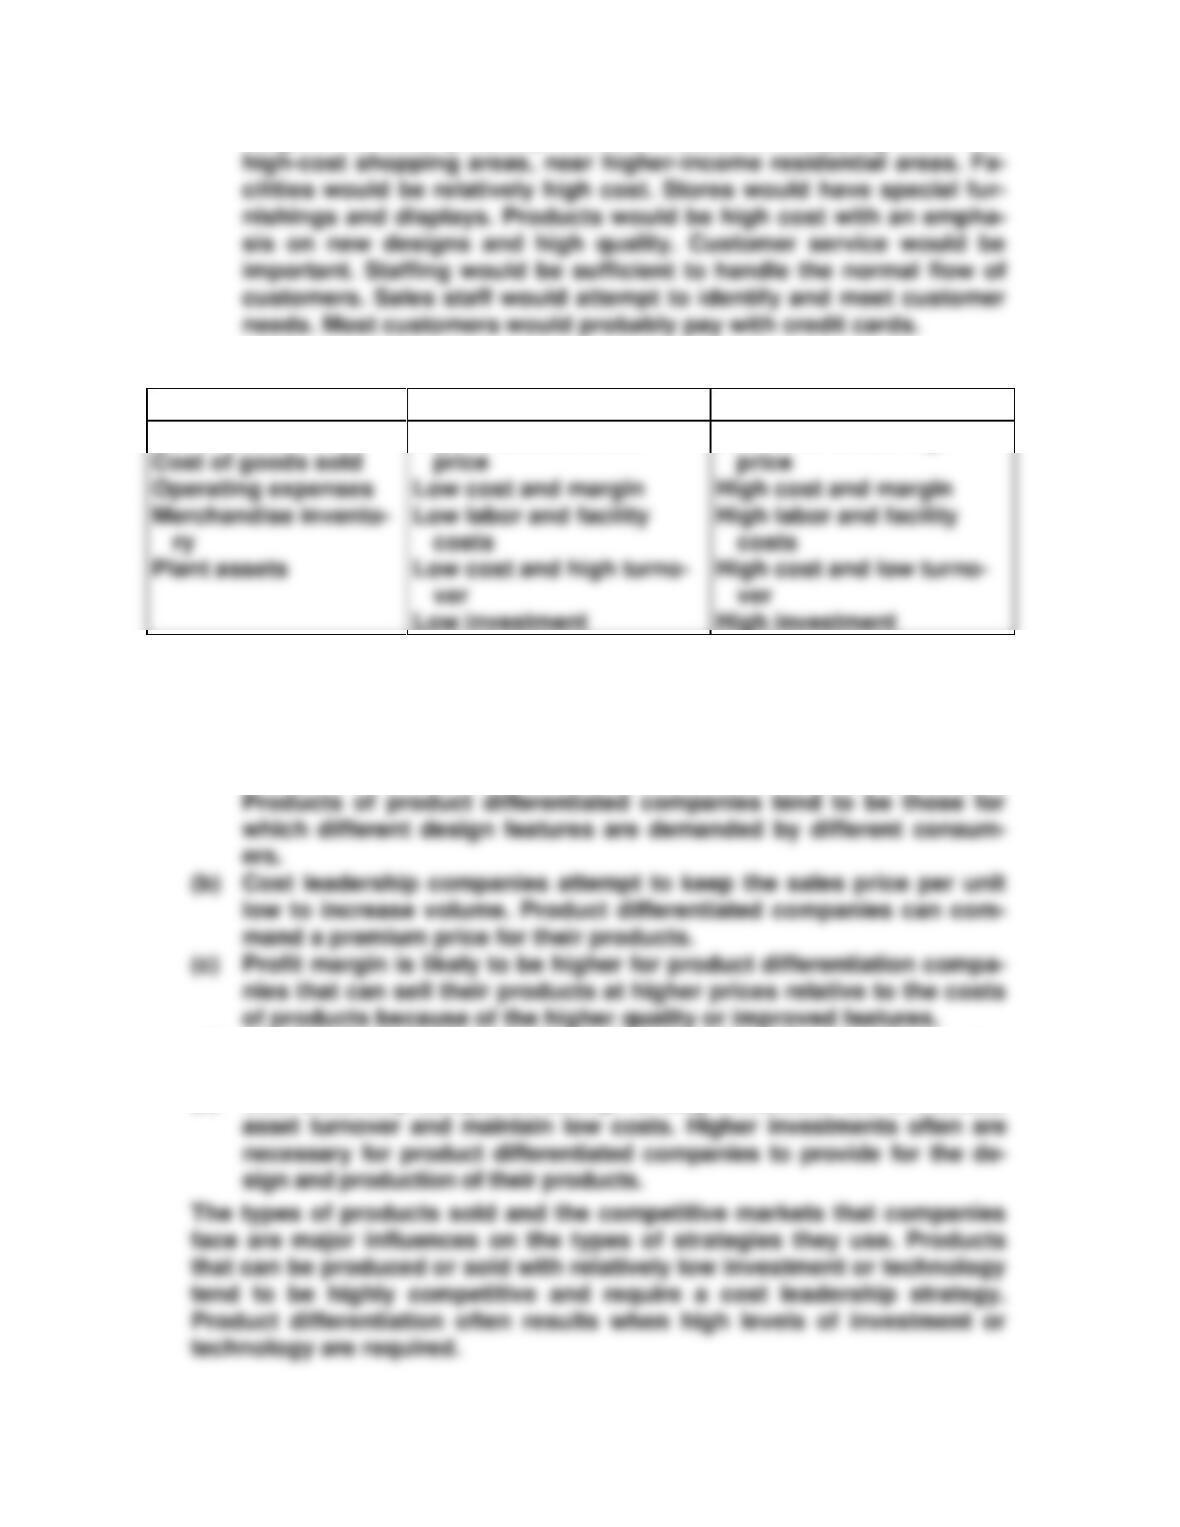
B. Relative to each other, the companies should exhibit the following:
Discount Shoes
Elegant Footwear
Sales revenues
High volume and low
Low volume and high
P14-6 Companies compete through product differentiation and cost leadership.
Product differentiation focuses on product quality and features. Cost
leadership focuses on cost control and low product prices.
(a) The products of cost leadership companies tend to be those that are
in high demand and that can be produced using standard designs.
(d) Asset turnover is likely to be higher for cost leadership companies
that attempt to generate high sales volumes.
(e) Cost leadership companies attempt to keep investment low to increase
Analysis of Operating Activities 443
P14-7
(In millions)
Dell
Apple
2004
2003
2004
2003
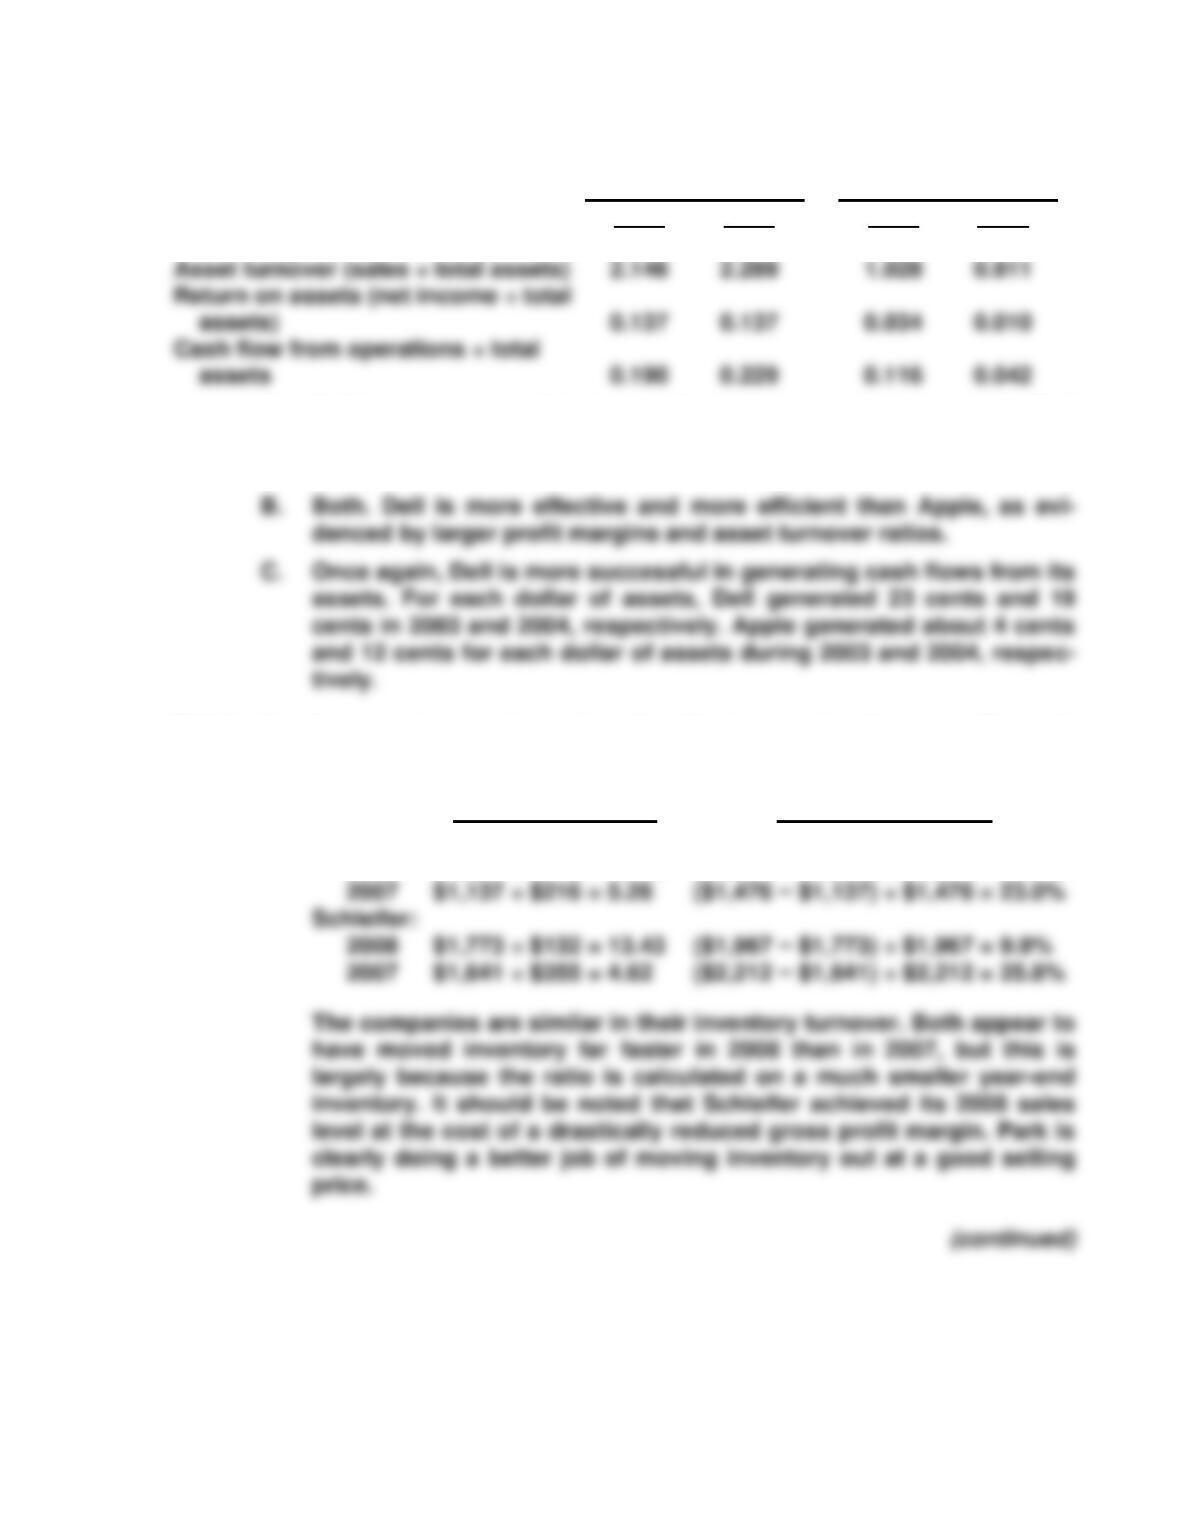
Profit margin (net income ÷ sales)
0.064
0.060
0.033
0.011
A. Dell is more successful at generating net income from its assets. Dell
produced an ROA of about 14% in both years, while Apple produced
an ROA of about 1% and 3% in 2003 and 2004, respectively.
P14-8 A. Inventory turnover (cost of goods sold ÷ inventory) and gross profit margin
[(sales − cost of goods sold) ÷ sales] are computed as follows:
Inventory turnover Gross profit margin
Park:
2008 $1,391 ÷ $115 = 12.10 ($1,811 − $1,391) ÷ $1,811 = 23.2%
444 Chapter 14
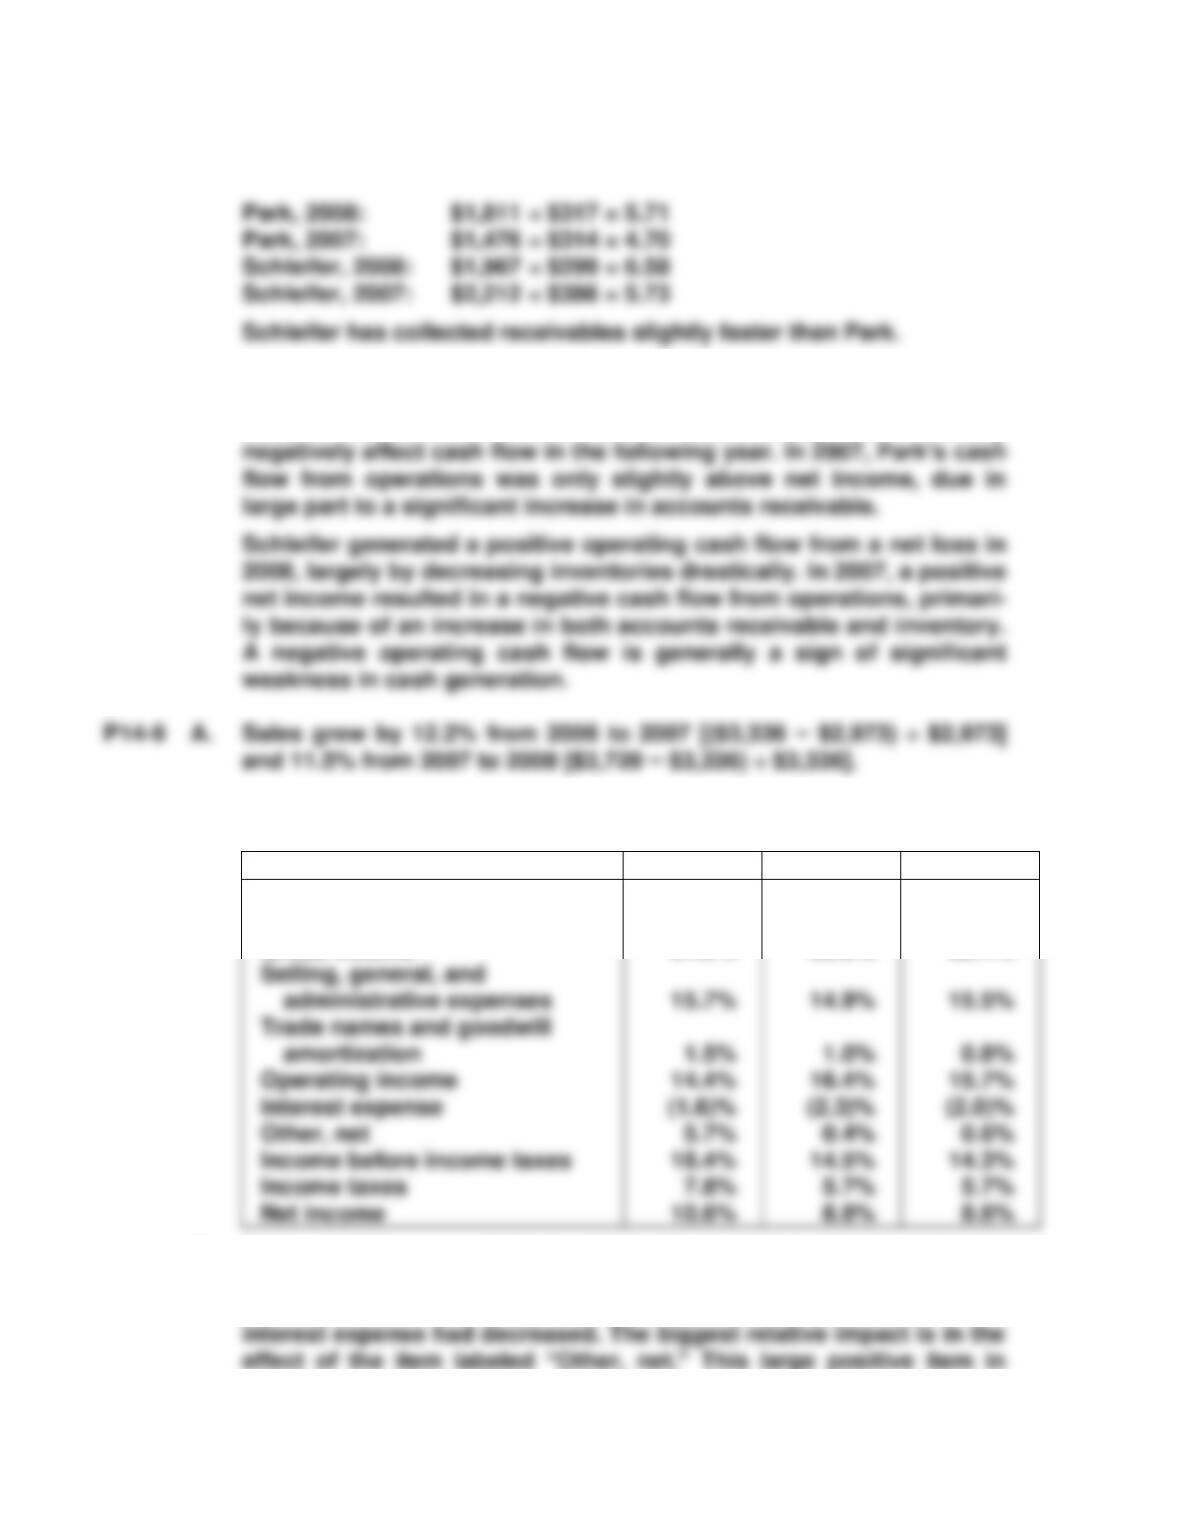
B. Receivable turnover (sales ÷ accounts receivable) can be computed
as follows:
C. Park, in 2008, generated a cash flow from operations that was about
2.6 times net income ($341 ÷ $131). The primary differences are de-
creases in inventories and increases in accounts payable, which may
B. Percentage analysis of the income statement has the following re-
sults:
2008
2007
2006
Net sales
Cost of sales
Gross income
100.00%
68.5%
31.5%
100.00%
67.7%
32.3%
100.00%
67.9%
32.1%
C. Because of increases in the cost of sales and in amortization of trade
names and goodwill, operating income (as a percentage of sales) has
decreased over the three-year period. One piece of good news is that
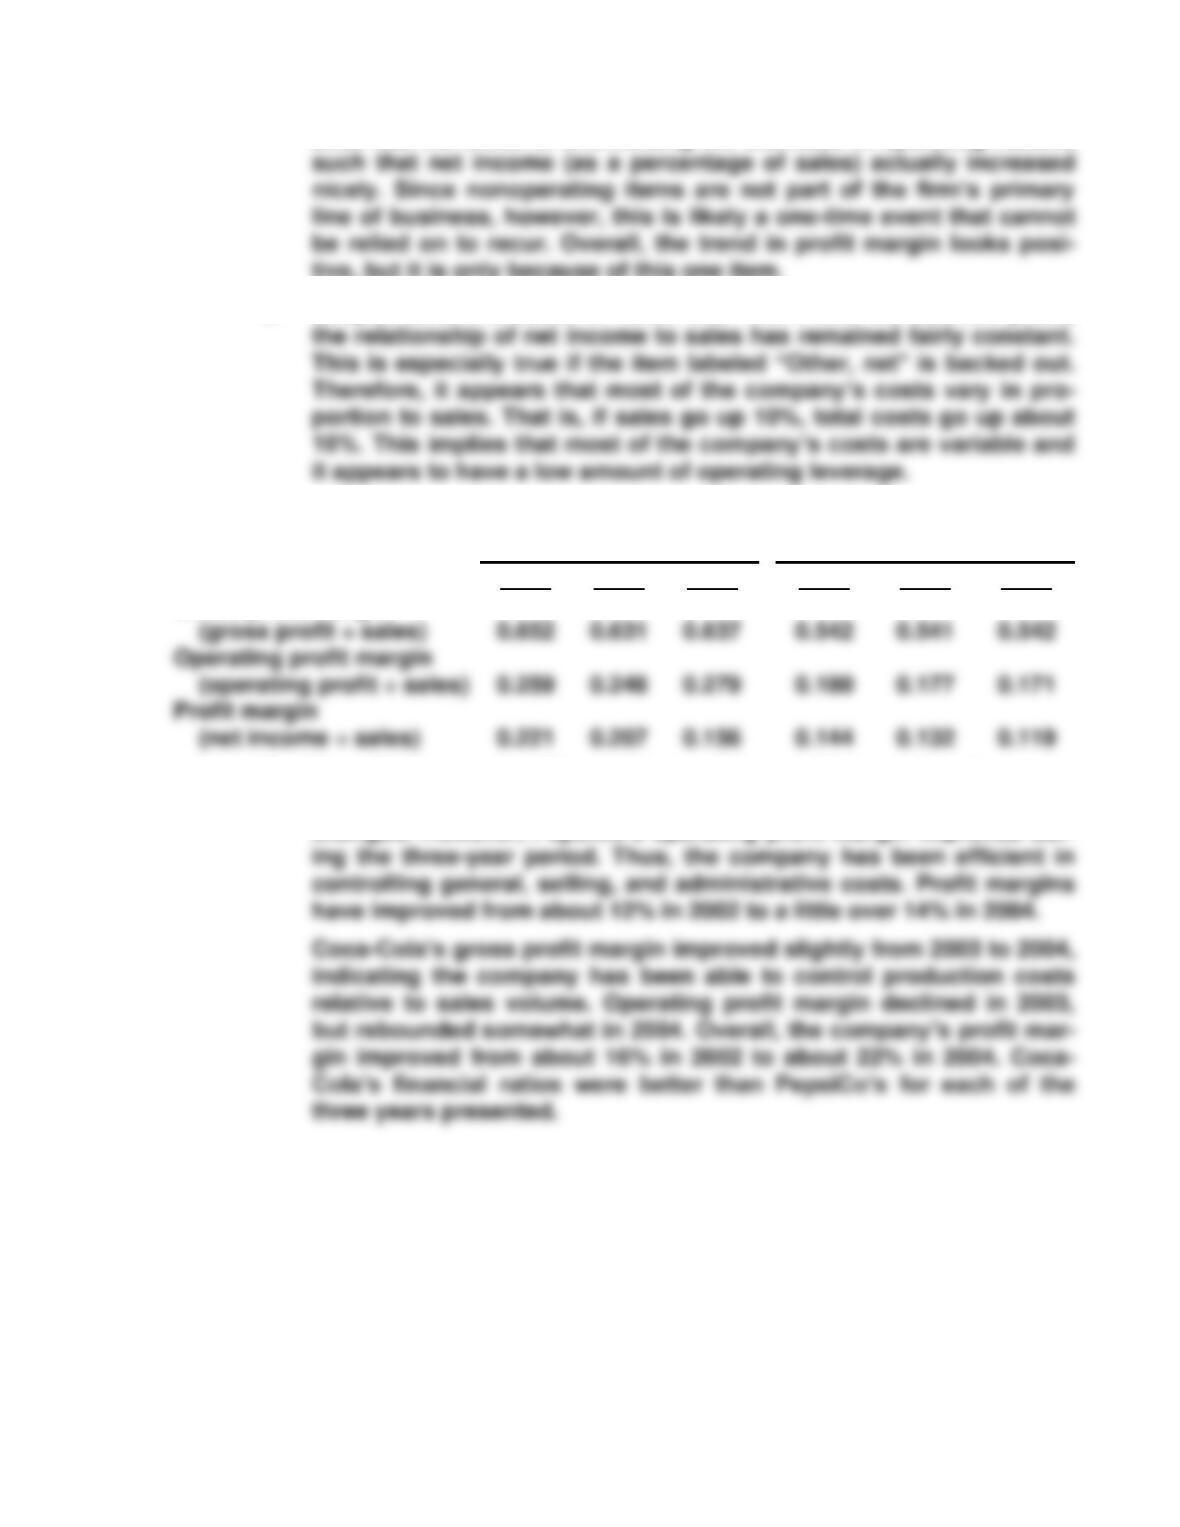
Analysis of Operating Activities 445
2008 had the effect of overcoming the decrease in operating income
tive, but it is only because of this one item.
D. Despite sales increases of 12.2% and 11.5% over the last two years,
P14-10 A.
Coca-Cola
PepsiCo
2004
2003
2002
2004
2003
2002
Gross profit margin
B. PepsiCo’s gross profit margin remained stable over the three-year
period, indicating production costs relative to sales have not
changed. However, PepsiCo’s operating profit margin improved dur-
446 Chapter 14
P14-11 A. Coca-Cola PepsiCo
2004 2003 2004 2003
Inventory turnover
(cost of goods sold ÷ inventory) 5.38 6.20 8.70 8.77
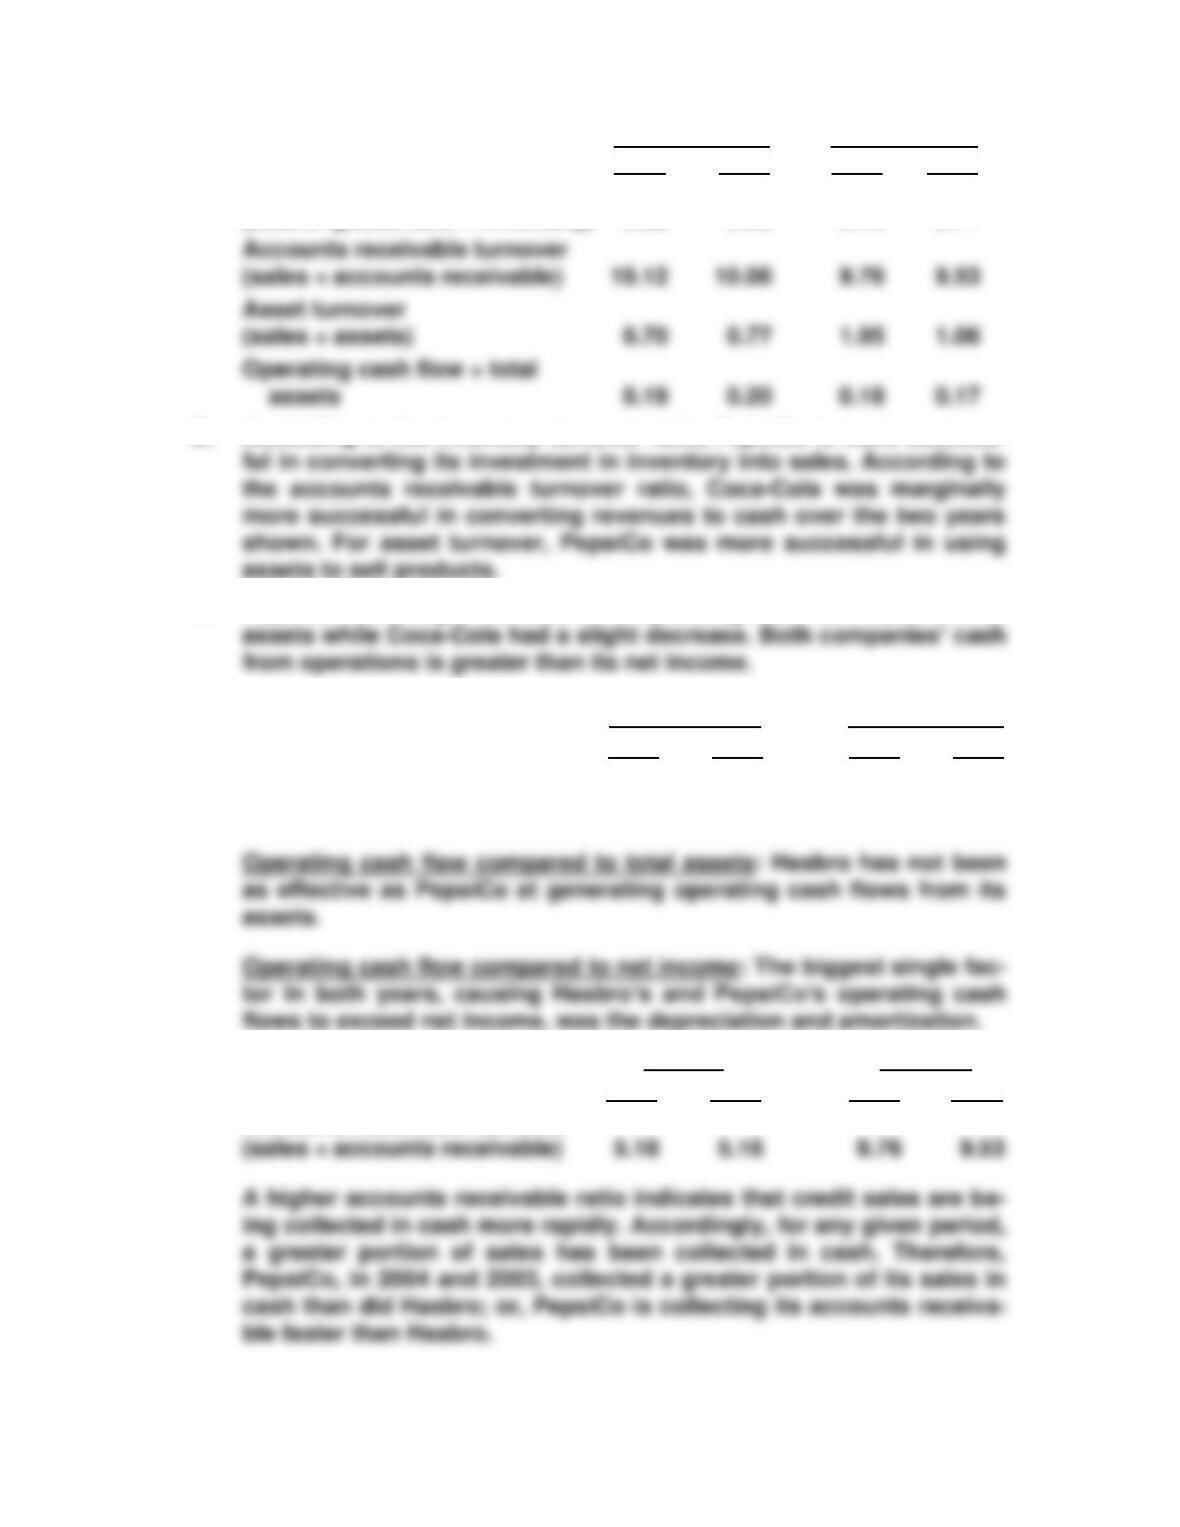
B. According to the inventory turnover ratio, PepsiCo is more success-
C. PepsiCo had a slight increase in its operating cash flow relative to its
P14-12 A. Hasbro PepsiCo
2004 2003 2004 2003
Cash flow from operations ÷ total assets 0.11 0.14 0.18 0.17
Cash flow from operations ÷ net income 1.83 2.87 1.20 1.21
B. Hasbro PepsiCo
2004 2003 2004 2003
Accounts receivable turnover
Analysis of Operating Activities 447
P14-13 A. 3M Corp. Eastman Chemical
2004 2003 2004 2003
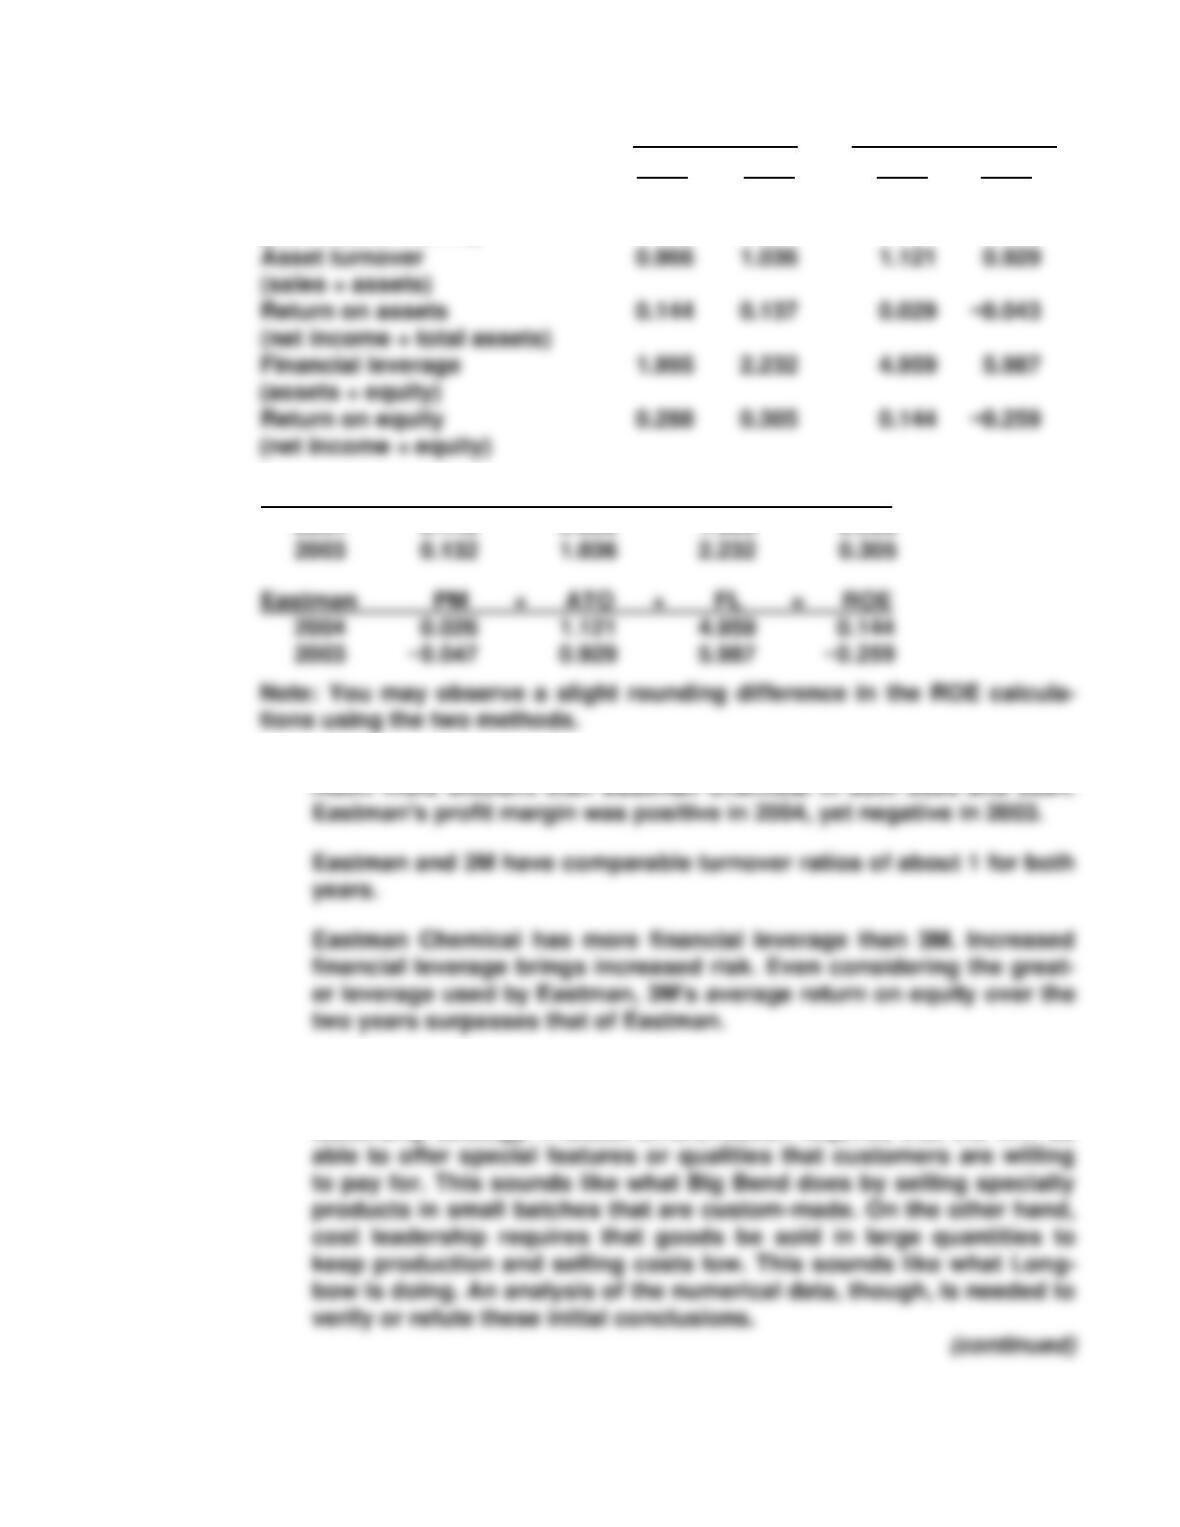
Profit margin 0.149 0.132 0.026 −0.047
(net income ÷ sales)
3M Corp PM × ATO × FL = ROE
2004 0.149 0.966 1.995 0.288
B. According to the profit margin percentage (PM), 3M Corp. has been
P14-14 A. Given the facts presented, Big Bend is likely to be using a product
differentiation strategy, while Longbow is probably using the cost
leadership strategy. Product differentiation requires that the firm be
448 Chapter 14
B.
Year 2008 results
Big Bend
Longbow
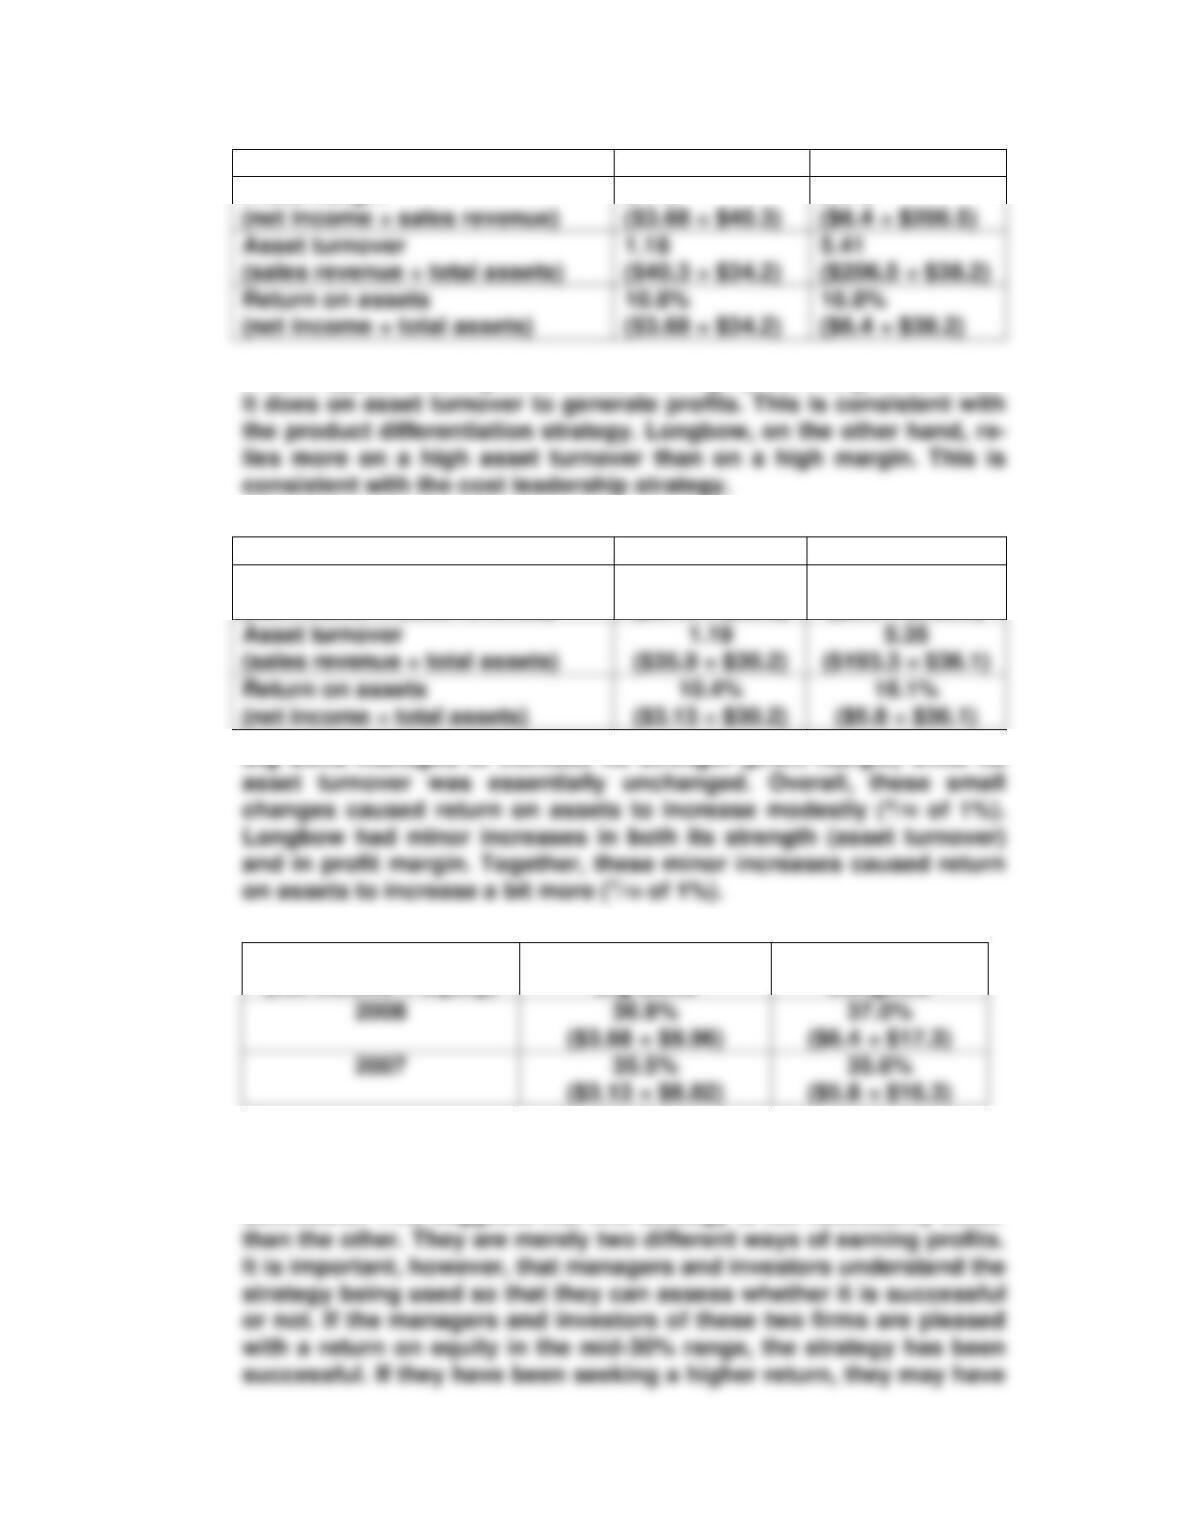
Profit margin
9.1%
3.1%
It does appear that Big Bend relies on a high profit margin more than
C.
Year 2007 results
Big Bend
Longbow
Profit margin
(net income ÷ sales revenue)
8.7%
($3.13 ÷ $35.9)
3.0%
($5.8 ÷ $193.3)
Big Bend managed to increase its strength (profit margin) while its
D.
Return on equity
(net income ÷ equity)
Big Bend
Longbow
E. Which strategy is most successful depends on the measure chosen
to represent success. Generally, the measure used is return on equi-
ty. By that measure, the results of the two companies are equally
successful. This suggests that one strategy is not necessarily better
Analysis of Operating Activities 449
to rework their strategies. This would also include issues of operat-
ing leverage and financial leverage.
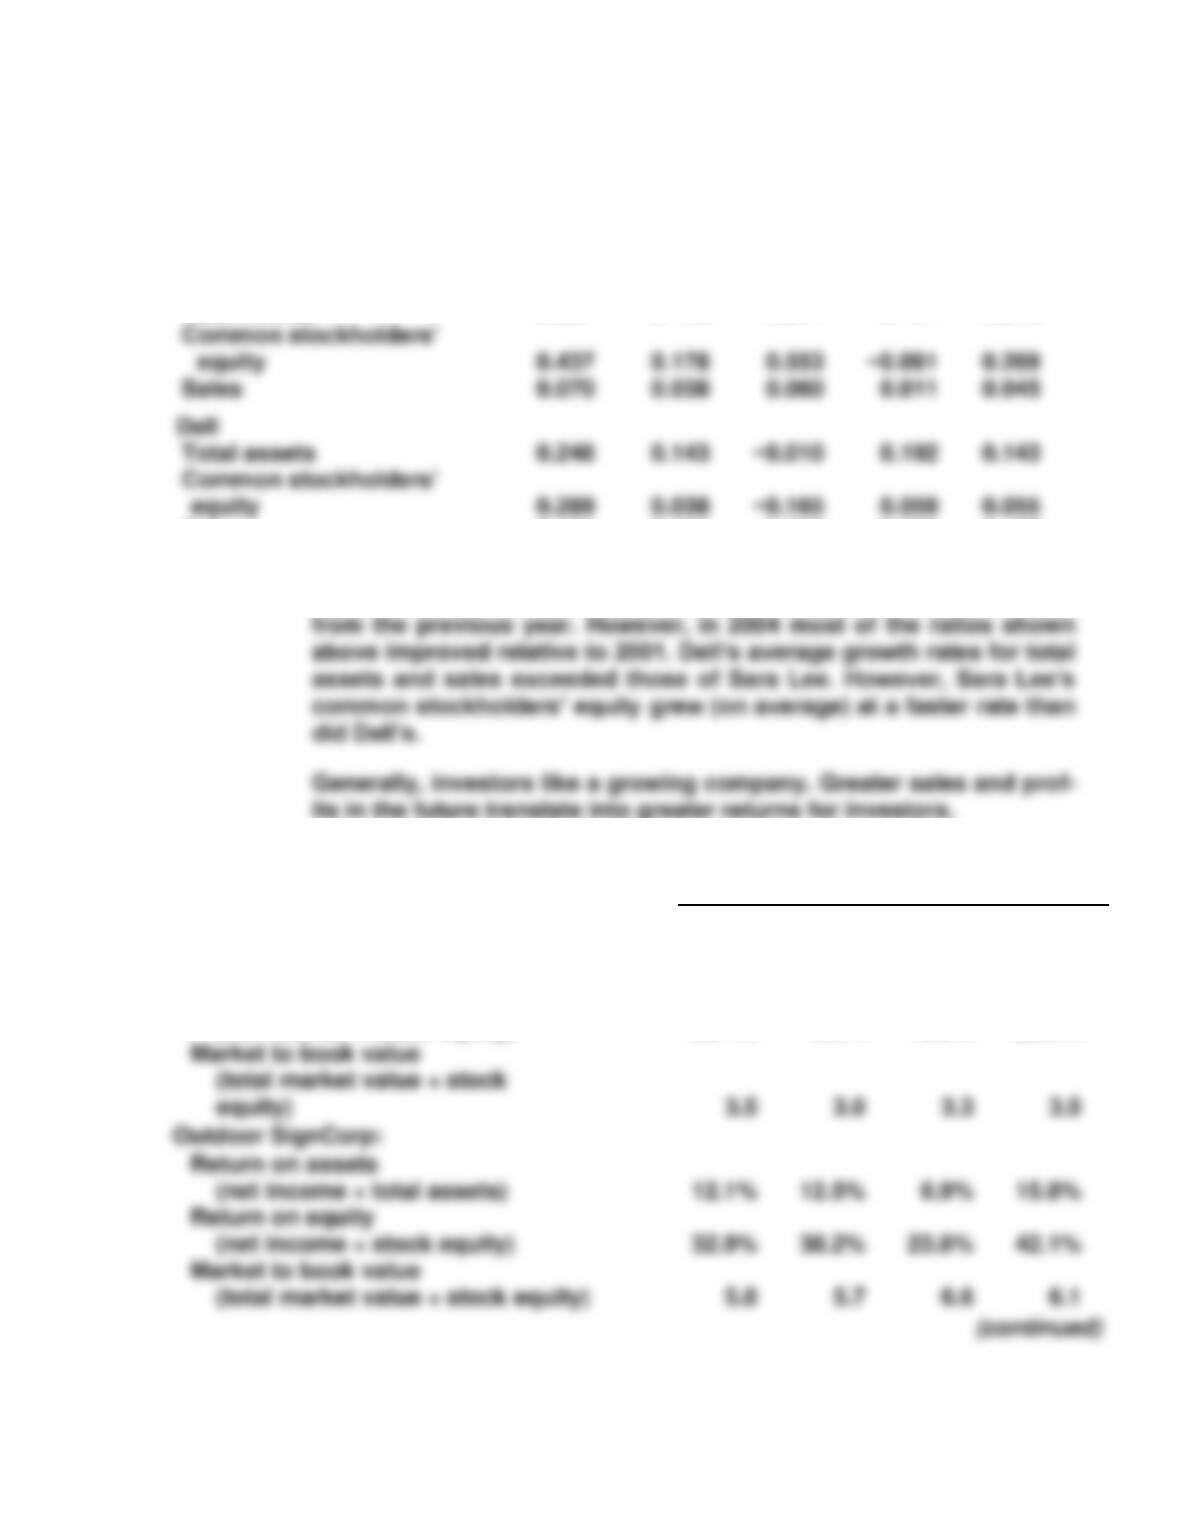
P14-15 A. Growth rates:
2004
2003
2002
2001
Average
Sara Lee
Total assets
−0.037
0.128
0.347
−0.124
0.079
Sales
0.171
0.136
−0.023
0.262
0.137
B. Both companies report wide fluctuations in their growth rates over
the periods evaluated. During 2002, all of Dell’s changes declined
P14-16 A.
2008
2007
2006
2005
Billboards–R–Us:
Return on assets
(net income ÷ total assets)
6.5%
1.7%
6.5%
7.6%
Return on equity
(net income ÷ stock equity)
20.4%
6.0%
19.8%
22.5%
450 Chapter 14
B. Outdoor SignCorp’s return on assets has been significantly higher
P14-17 A.
John, Inc.
Roberta Company
2008
2007
2008
2007
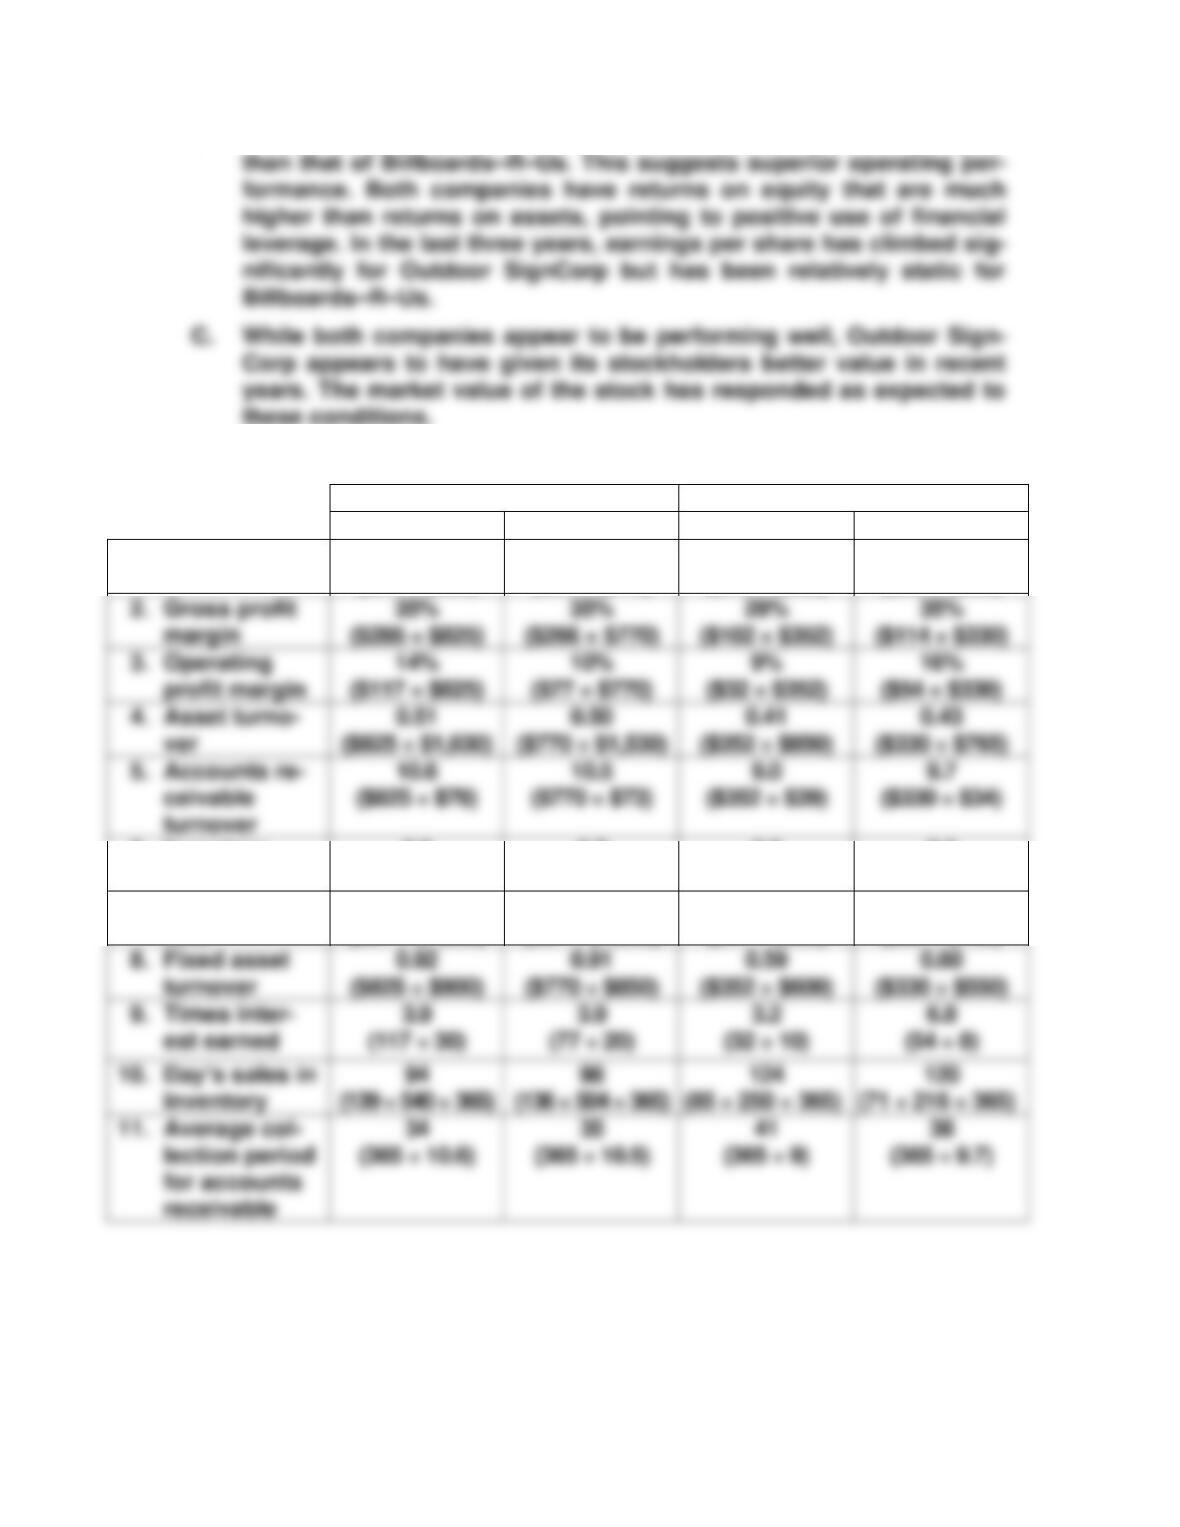
1. Profit margin
7%
($57 ÷ $825)
5%
($37 ÷ $770)
4%
($14 ÷ $352)
9%
($30 ÷ $330)
6. Inventory
turnover
3.9
($540 ÷ $139)
3.7
($504 ÷ $136)
2.9
($250 ÷ $85)
3.0
($216 ÷ $71)
7. Return on as-
sets
3%
($57 ÷ $1,630)
2%
($37 ÷ $1,530)
2%
($14 ÷ $850)
4%
($30 ÷ $765)
Analysis of Operating Activities 451
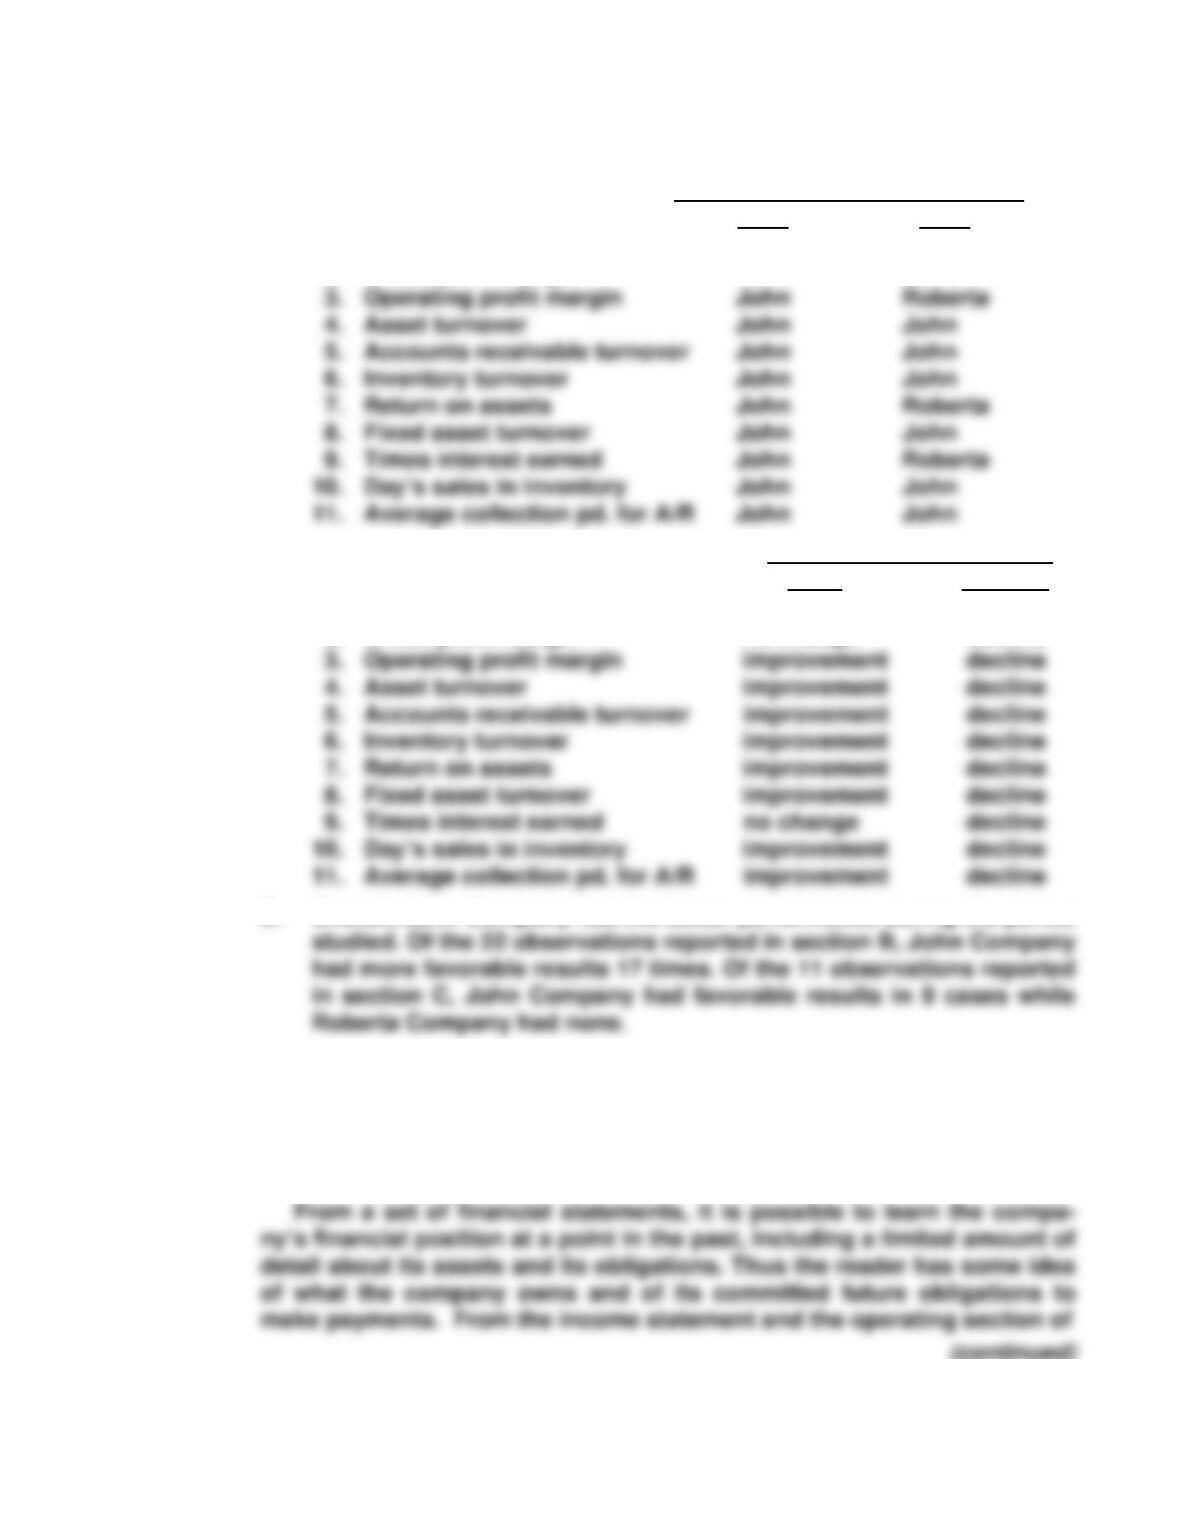
B. This table identifies which company had the better value for each ra-
tio during each year.
Company with better ratio value
2008 2007
1. Profit margin John Roberta
2. Gross profit margin John same
C. Change from 2007 to 2008
John Roberta
1. Profit margin improvement decline
2. Gross profit margin no change decline
D. Overall, John Company had the better performance during the period
P14-18 Financial statements give only a partial view of a business entity, but that
part is very important. The statements summarize the effects of past
transactions. Statements have evolved as a relatively efficient way of giv-
ing the decision maker a summarized, approximate view of the financial
affairs of the company.
452 Chapter 14
However, statements are limited as tools for predicting the future of a
company. They are summaries; they report on the past; they make exten-
A supplier’s ability to remain in business and avoid cash flow prob-
lems might be indicated by its ability to generate cash from operations.
The operating section of the cash flows statement reports on this for a
given period. The income statement can be viewed as an estimate of the
P14-19 A. Measurement rules determine which attributes of the transformation
process are entered into the accounting system. They involve both
amounts and timing. Reporting rules determine the type and format of
information reported in financial statements for external users.
B. Measurement and reporting rules help to make financial statements
Analysis of Operating Activities 453
E. It is easier to establish standards on a national basis than on a
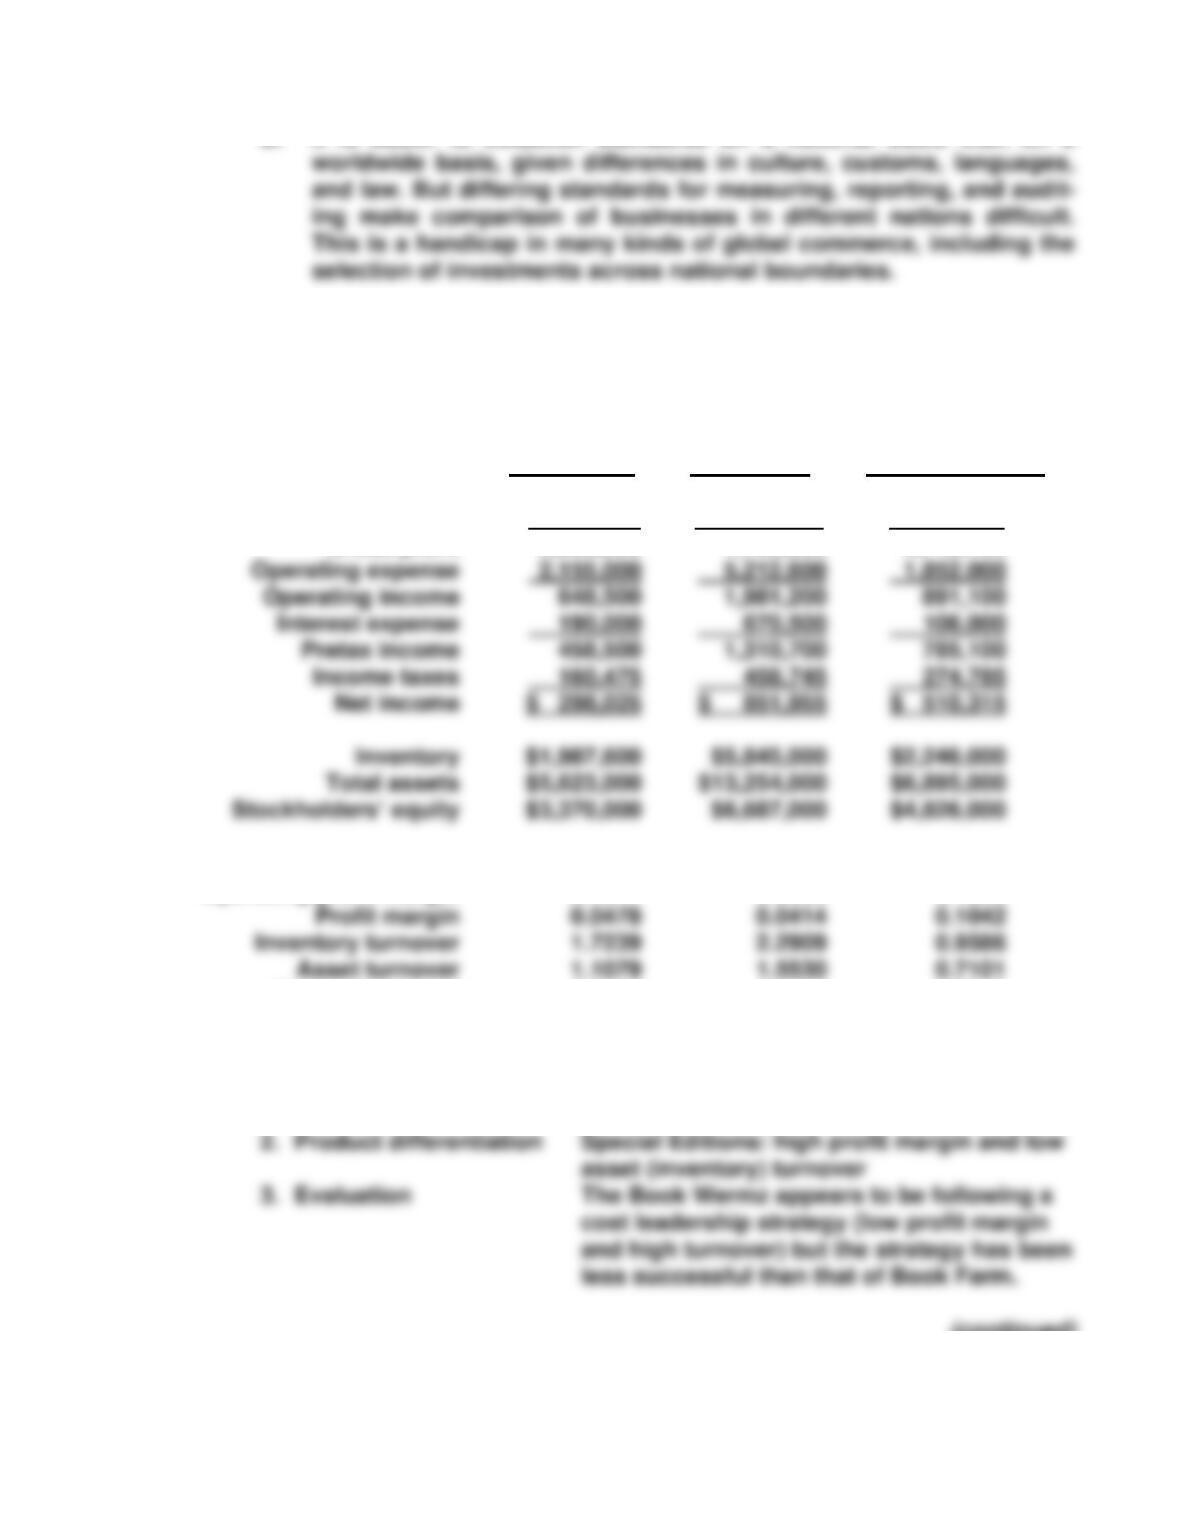
P14-20
Financial Analysis
Comparison
December 31, 2008
The Book
Wermz
Book Farm
Special Editions
Sales
$6,230,000
$20,584,000
$4,896,200
Cost of goods sold
3,426,500
13,390,200
2,153,100
Gross profit
2,803,500
7,193,800
2,743,100
Gross profit margin
0.4500
0.3495
0.5603
Operating profit margin
0.1041
0.0962
0.1820
Return on assets
0.0530
0.0643
0.0740
Financial leverage
1.6685
1.9821
1.4287
Return on equity
0.0884
0.1274
0.1057
1. Cost leadership Book Farm: low profit margin and high asset
(inventory) turnover
(continued)
4. Financial leverage Financial leverage is beneficial to all of the
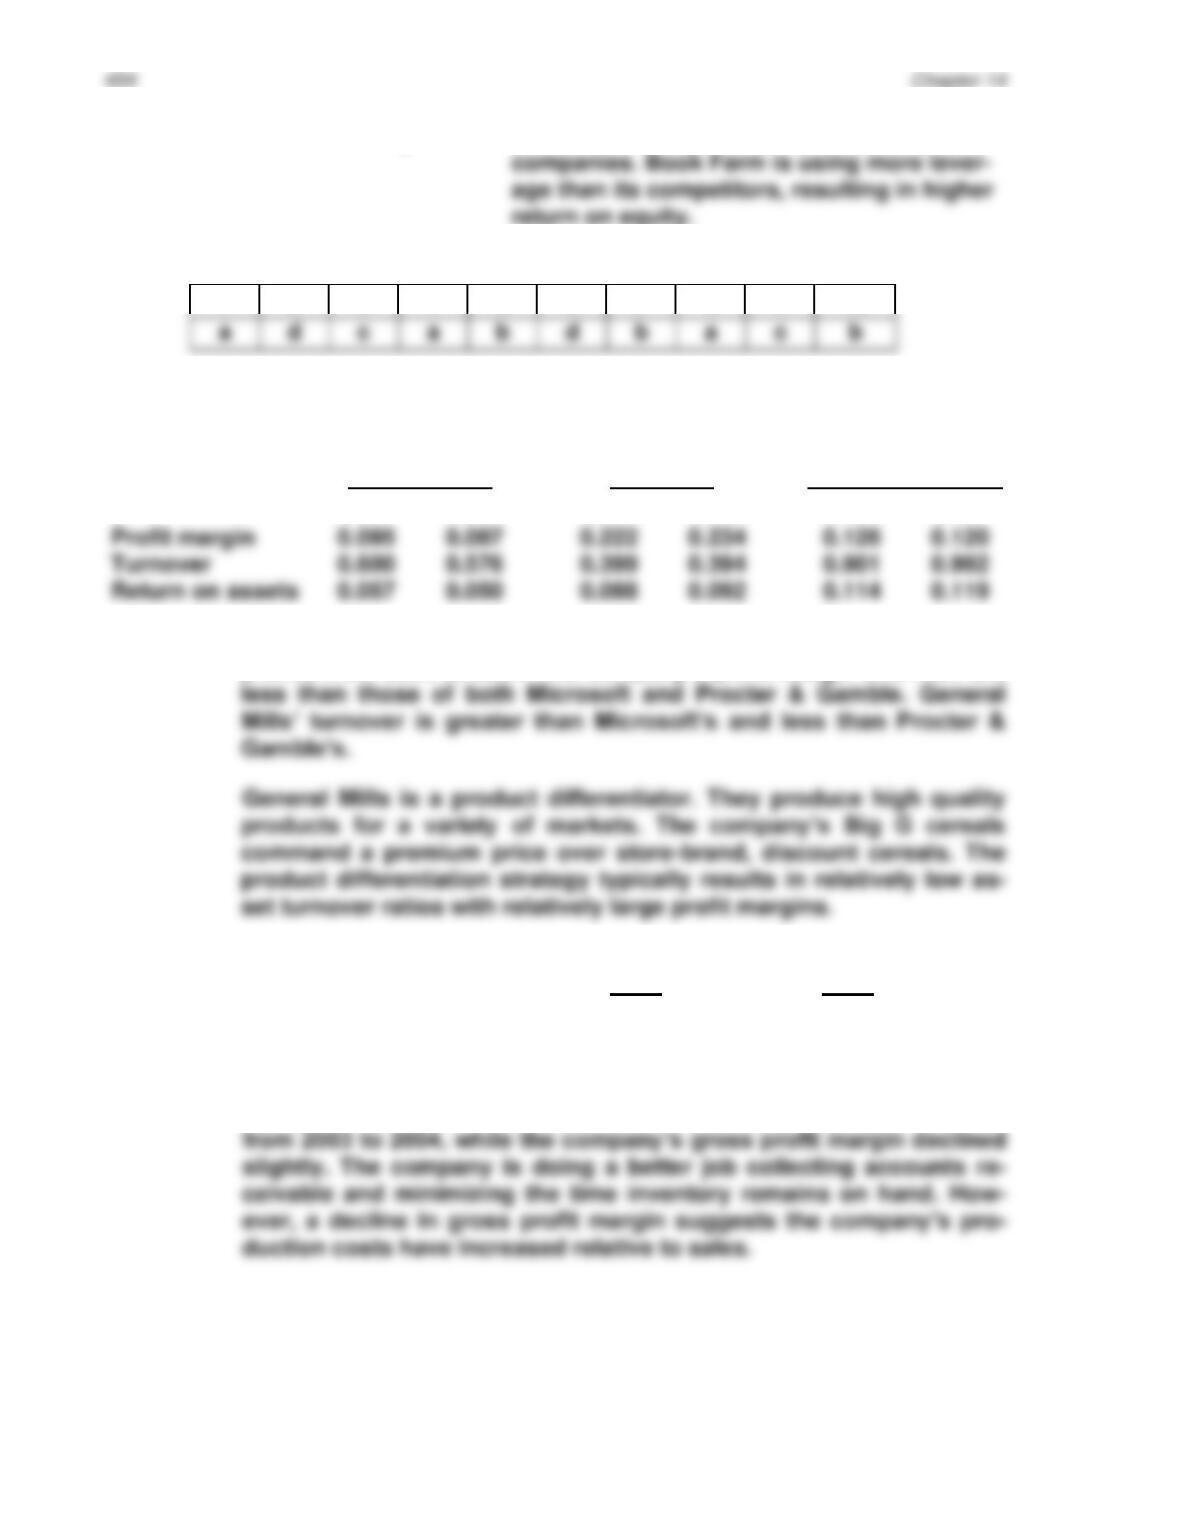
P14-21
1
2
3
4
5
6
7
8
9
10
CASES
C14-1 A. and B.
General Mills
Microsoft
Procter & Gamble
2004
2003
2004
2003
2004
2003
General Mills’ profit margin, turnover, and return on assets all im-
proved from 2003 to 2004. The company’s profit margin and ROA are
C.
2004
2003
Receivables turnover
10.96
10.72
Inventory turnover
6.19
5.65
Gross profit margin
0.405
0.419
General Mills’ receivables turnover and inventory turnover improved
Analysis of Operating Activities 455
D.
2004
2003
Return on equity
0.201
0.220
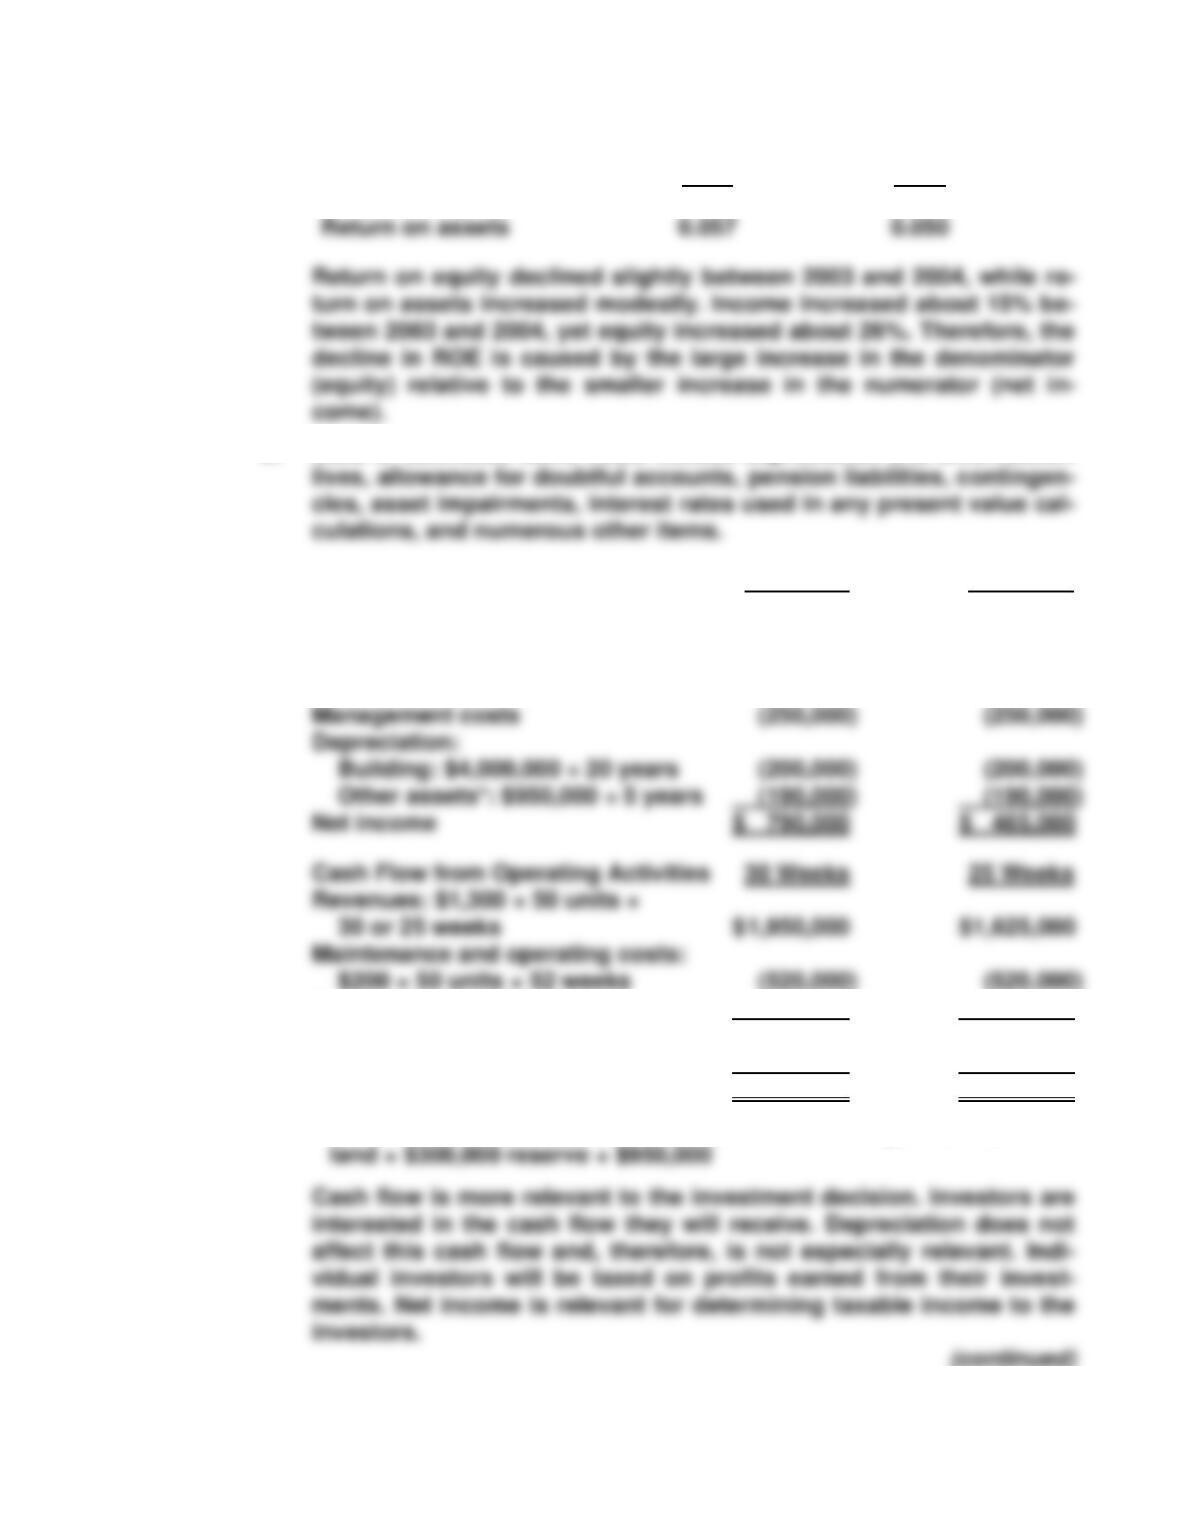
E. Lists of estimated items could include depreciation and amortization
C14-2 A. Net Income 30 Weeks 25 Weeks
Revenues: $1,300 × 50 units ×
30 or 25 weeks $ 1,950,000 $ 1,625,000
Maintenance and operating costs:
$200 × 50 units × 52 weeks (520,000) (520,000)
Management costs (250,000) (250,000)
Cash flow from operating activities 1,180,000 855,000
Required reinvestment (200,000) (200,000)
Cash flow to investors $ 980,000 $ 655,000
* Other assets = $5,500,000 = $4,000,000 for buildings + $250,000 for
456 Chapter 14
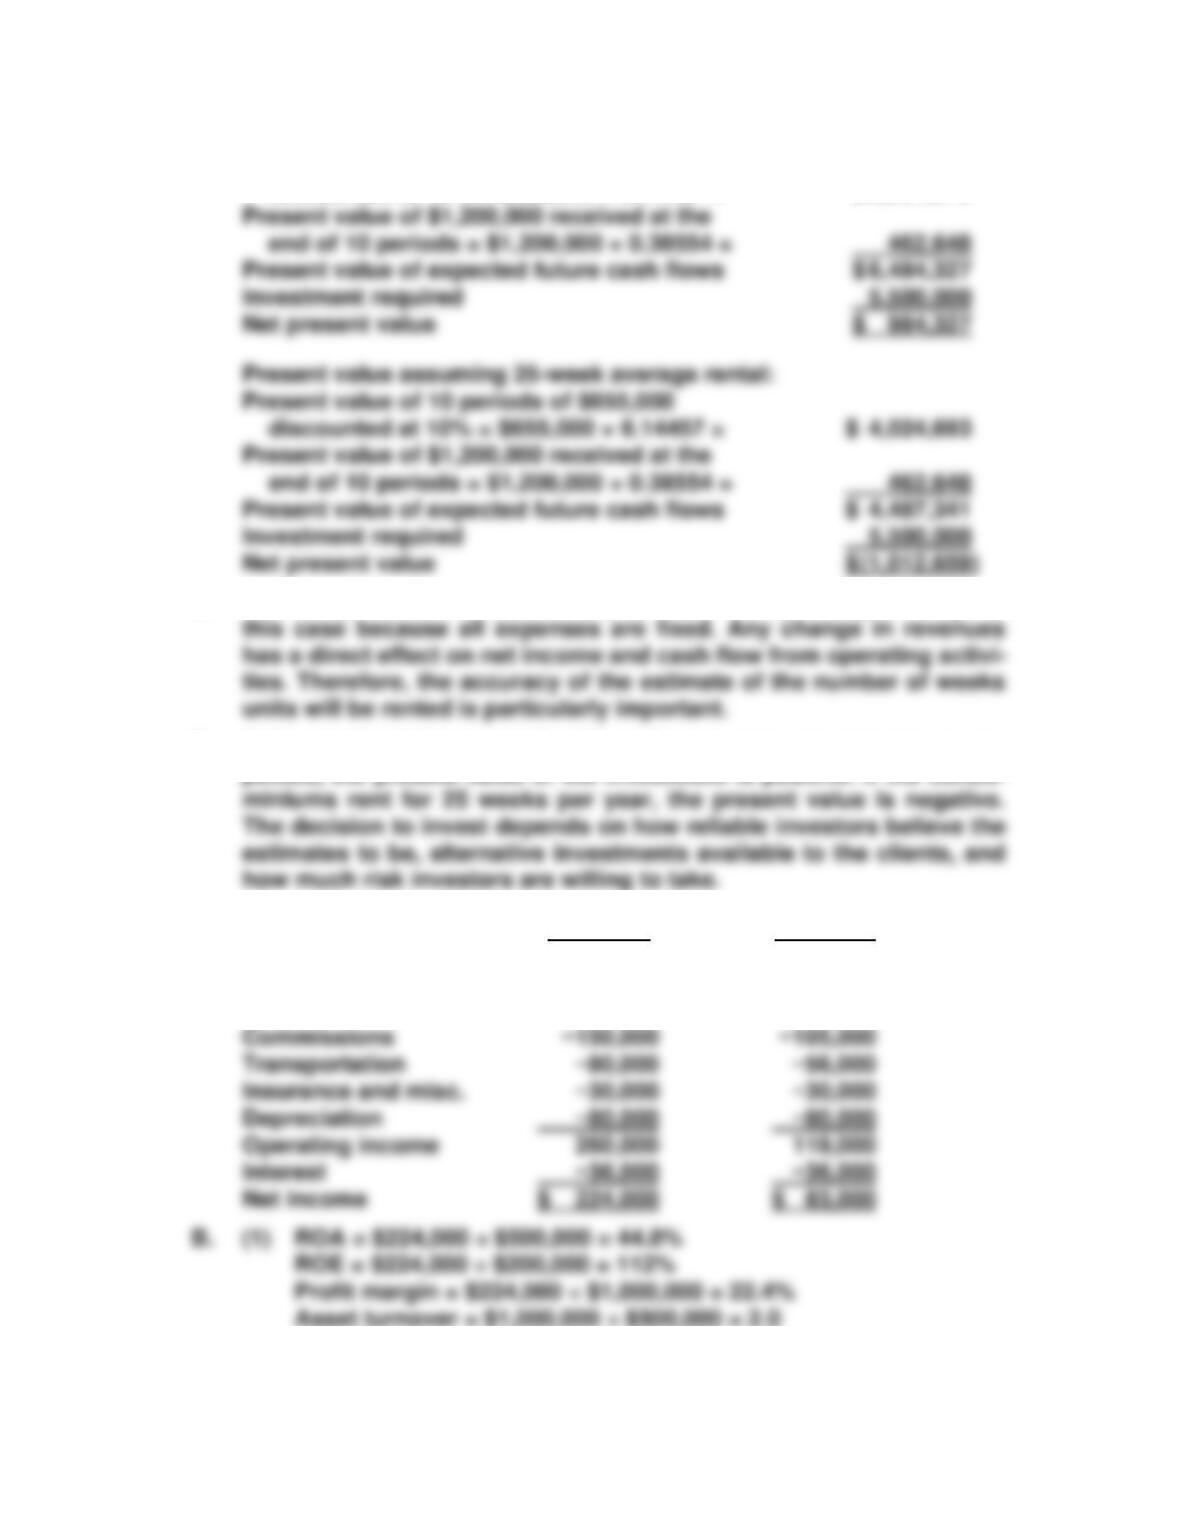
B. Present value assuming 30-week average rental:
Present value of 10 periods of $980,000
discounted at 10% = $980,000 × 6.14457 = $ 6,021,679
C. Operating results are particularly sensitive to operating leverage in
D. If the condominiums rent for 30 weeks per year, on average, as ex-
C14-3 A. Expected Minimum
Sales $ 1,000,000 $ 700,000
CGS −300,000 −210,000
Wages −100,000 −100,000
Analysis of Operating Activities 457
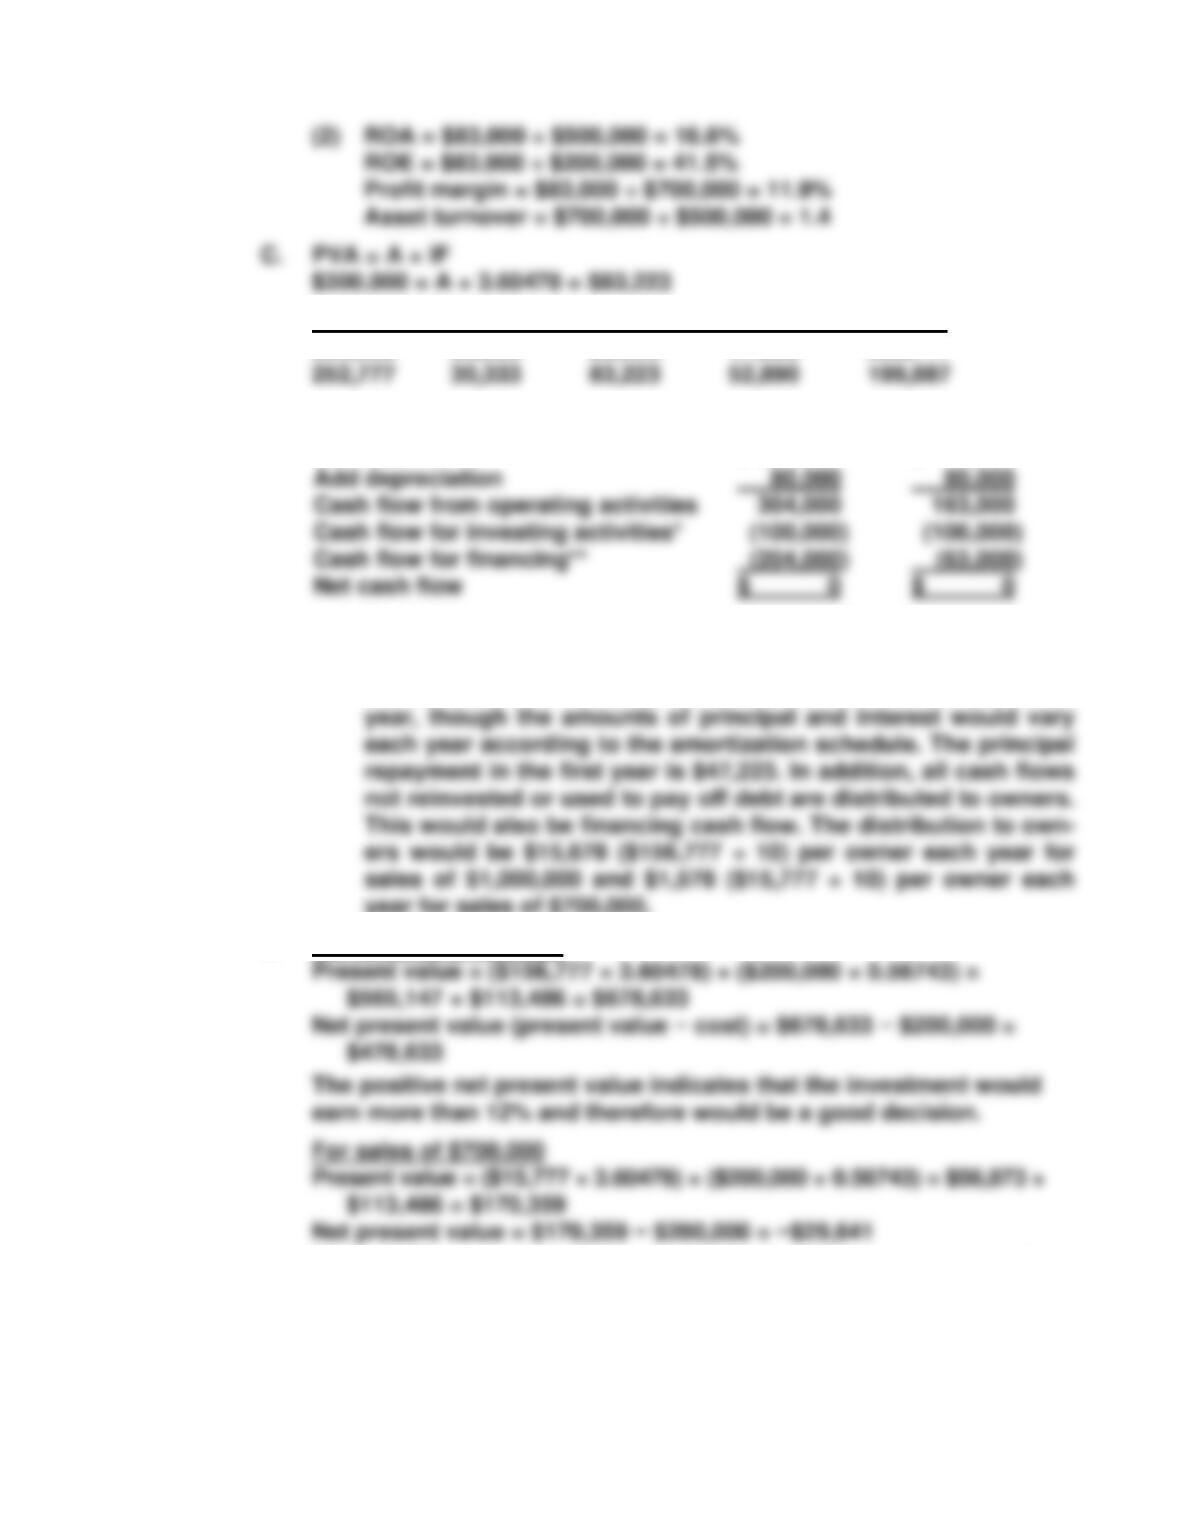
PV Beg. Int. Exp. Payment Principal PV End
300,000 36,000 83,223 47,223 252,777
D. Cash Flow from Operating Activities
Net income $ 224,000 $ 83,000
* The $100,000 or reinvestment is in the cash flow statement as
investing cash flow.
** Total payments for principal and interest would be $83,223 each
year for sales of $700,000.
E. For sales of $1,000,000
The negative net present value indicates that the investment would
earn less than 12% and therefore would not be a good decision.
(continued)
458 Chapter 14
F. The company’s expected earnings and cash flows are sufficient to
justify the investment. The investment is risky because of the high
potential variability of sales and because of the financial leverage. If


