CHAPTER 14
Analysis of Operating Activities
THINKING BEYOND THE QUESTION
How do operations create value for our business?
Good business decisions require reliable and timely information about
business activities. Accounting is the source of much of that information.
QUESTIONS
Q14-1 Generally, in this situation, one would expect that profits would increase
by a rate greater than the increase in sales. Since a large portion of the
Q14-2 Generally, in this situation, one would expect that profits would increase
by about the same rate as the increase in sales. Perhaps marginally fast-
Q14-3 Frankly, no. A product differentiation strategy is typically built around
enhancing the product. By imbuing the product with additional features
or value it is expected that customers will pay more. A successful prod-
424 Chapter 14
Q14-4 In general, one would expect this company to pursue a cost leadership
strategy. The products are identical chemically, and unless the firm can
add value by quicker delivery or in some other way, it is unlikely that
Q14-5 The facts of this situation suggest a classic product differentiation strat-
egy. New products are invented and introduced quickly. Because they are
Q14-6 The cost leadership strategy involves selling products at a low sales
price relative to competitors. The low prices result in low profit margins.
Q14-7 A cost leader must control its costs to permit it to keep its prices low and
still earn a profit. Economies of scale are important. Economies of scale
are achieved when a company can maintain sufficiently high volumes to
take advantage of operating leverage and reduce unit costs. A cost leader
Analysis of Operating Activities 425
Q14-8 The major reason for a price decrease would be the increase in sales vol-
ume that would tend to follow. However, a price decrease will decrease the
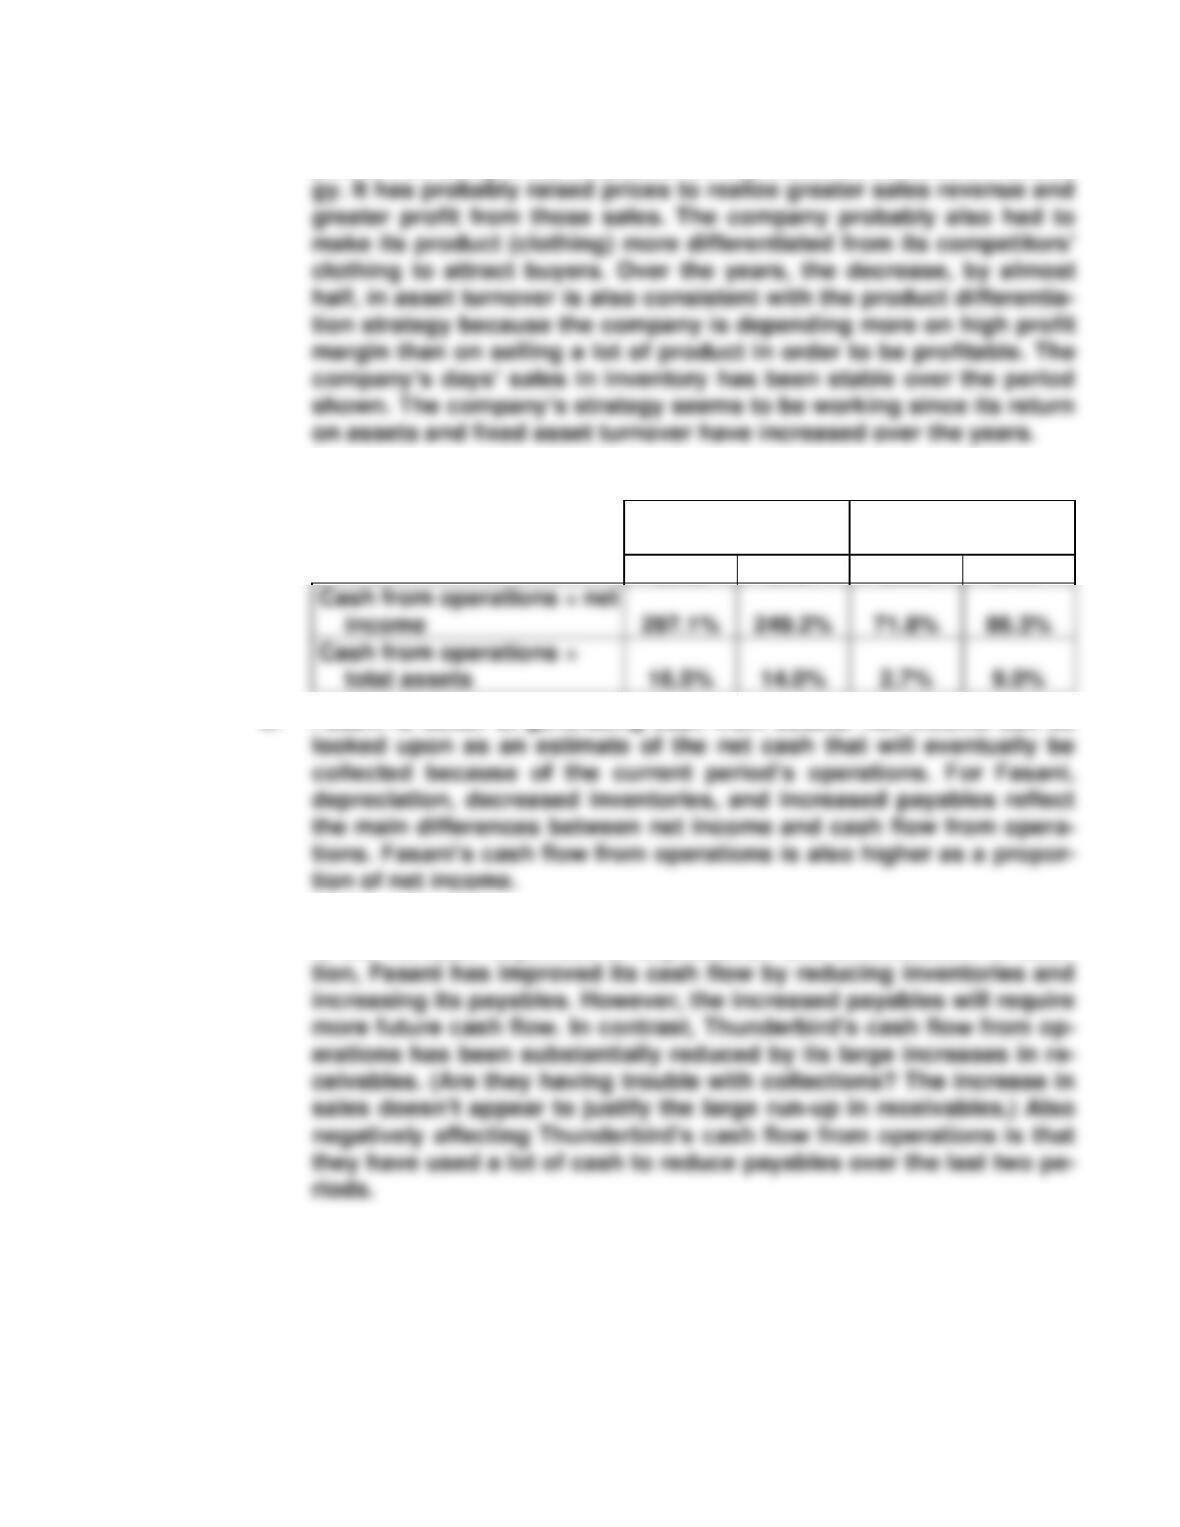
Q14-9 Normally, cash flow from operations will be significantly higher than net
income. Although net income is an estimate of the cash that is eventually
to flow because of the period’s operations, net income includes deduc-
tions for noncash expenses such as depreciation and amortization. The
Q14-10 Trends of net income and net cash flow from operations depend on the
length and nature of the operating cycle. Changes in income and cash flow
may occur at about the same time in a company with a short cycle. Cash
flow changes may lag behind income for a company with large, slowly col-
426 Chapter 14
Q14-11 Yes, there probably is a connection between cash flow problems and the
low turnover of both inventory and receivables. Low rates of turnover
Q14-12 The value of stock is the present value of expected future cash flows that
will be derived from it. Growth results in an increase in future cash flows
and, therefore, increases present value. Variability of earnings indicates
Q14-13 Return on assets measures the relationship between net income and total
investment. It reveals the average return on each dollar of assets, regard-
Q14-14 Financing decisions involve the capital structure of a company. They in-
volve the extent to which the company will use debt and equity financing.
This is related to whether financial leverage is used. Investing decisions
involve the type of assets the company will acquire, as well as changes in
Analysis of Operating Activities 427
EXERCISES
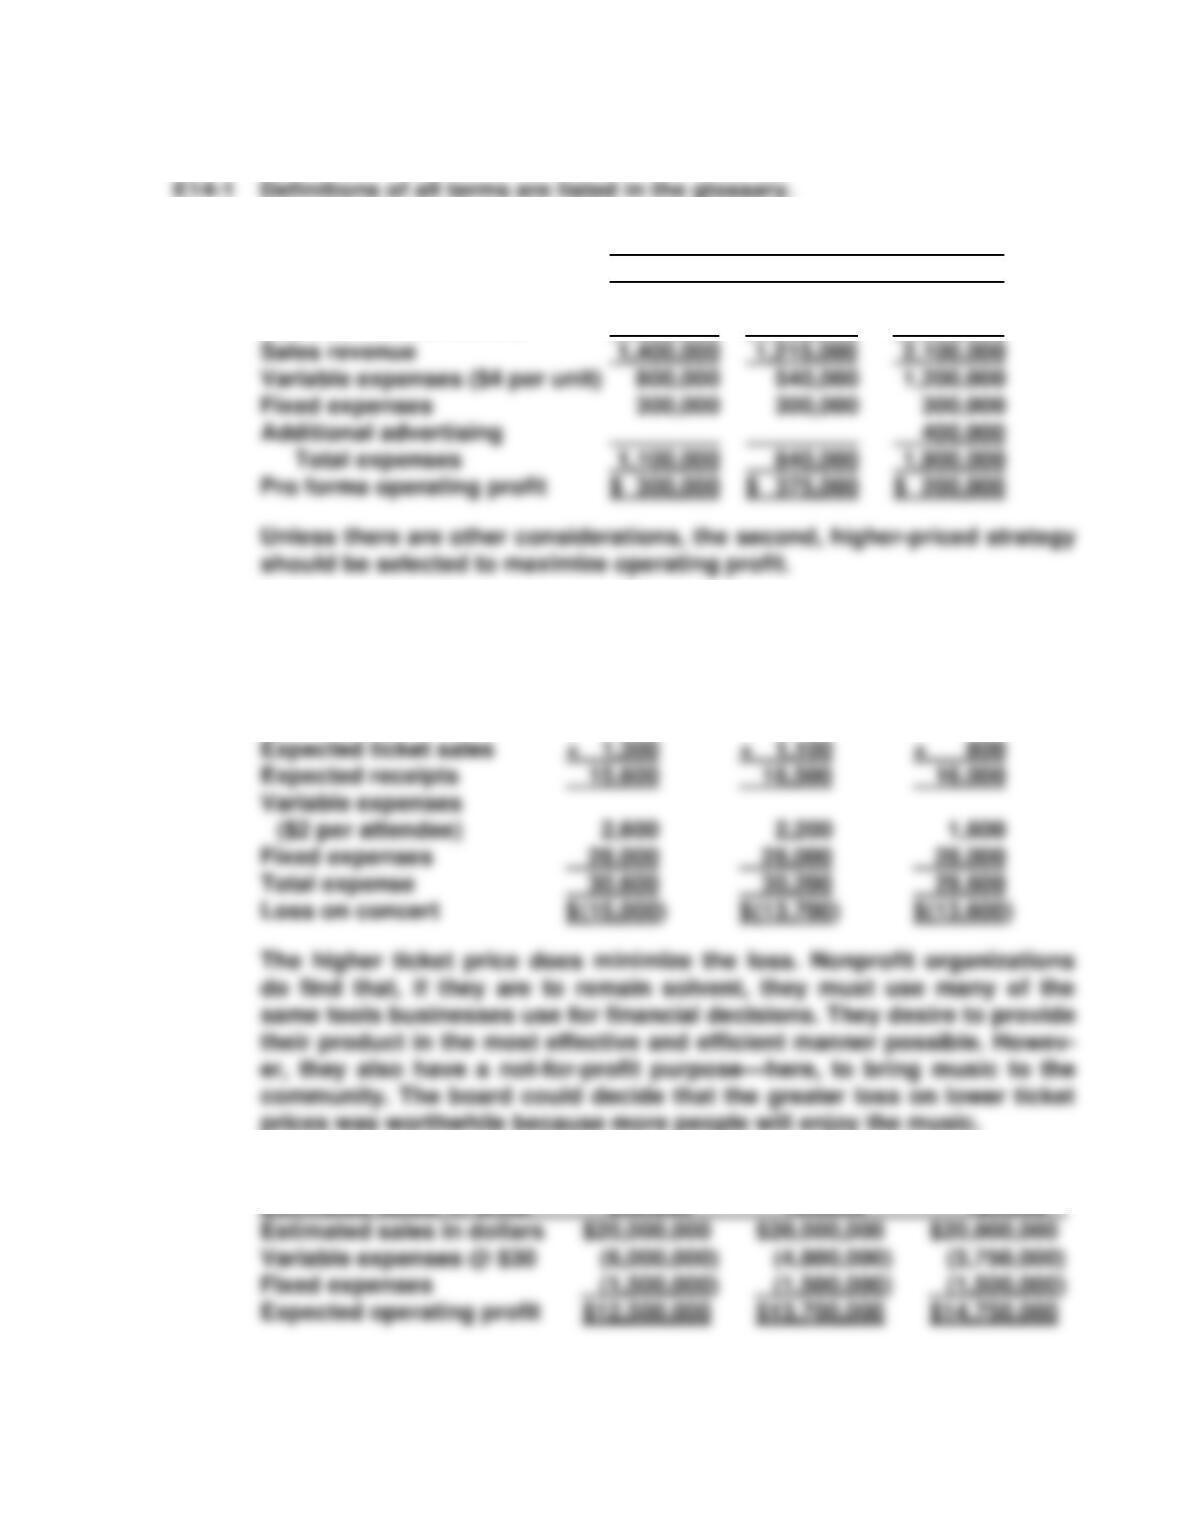
E14-2 Strategy
A B C
Unit price $ 7 $ 9 $ 7
Estimated sales in units × 200,000 × 135,000 × 300,000
E14-3 The financial objective here would be to minimize the loss on the concert,
thus minimizing the amount that must be raised through contributions.
The losses would be as follows:
Ticket price $ 12 $ 15 $ 20
E14-4 Unit Price: $100 $125 $160
Estimated sales, in units 200,000 160,000 125,000
428 Chapter 14
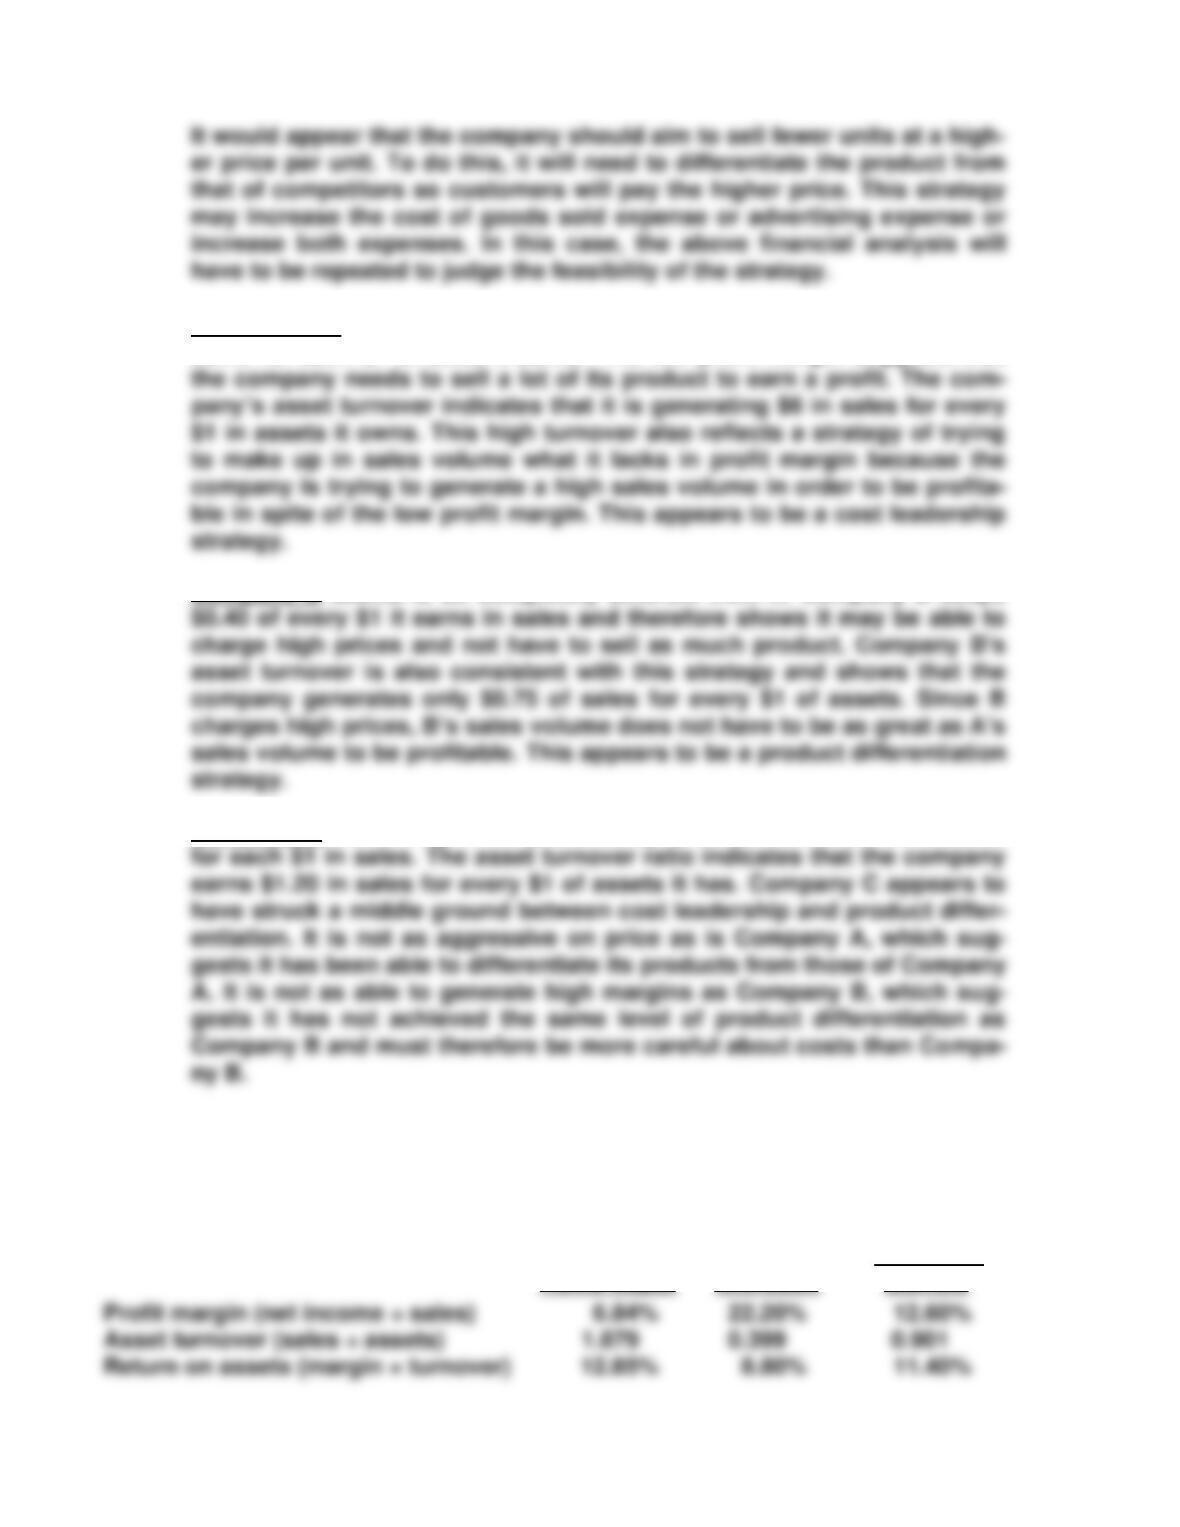
E14-5 Company A’s profit margin indicates that it realizes only $0.05 of net in-
come for each $1 of sales it earns. This low profit margin suggests that
Company B seems to be completely different from A. Company B keeps
Company C, according to the profit margin, realizes $0.25 of net income
All companies are equally profitable as measured by their 30% return on
assets.
E14-6 Profit margin, asset turnover, and return on assets are provided below for
Home Depot, Microsoft, and Procter & Gamble.
Home Depot
Microsoft
Procter &
Gamble
Analysis of Operating Activities 429
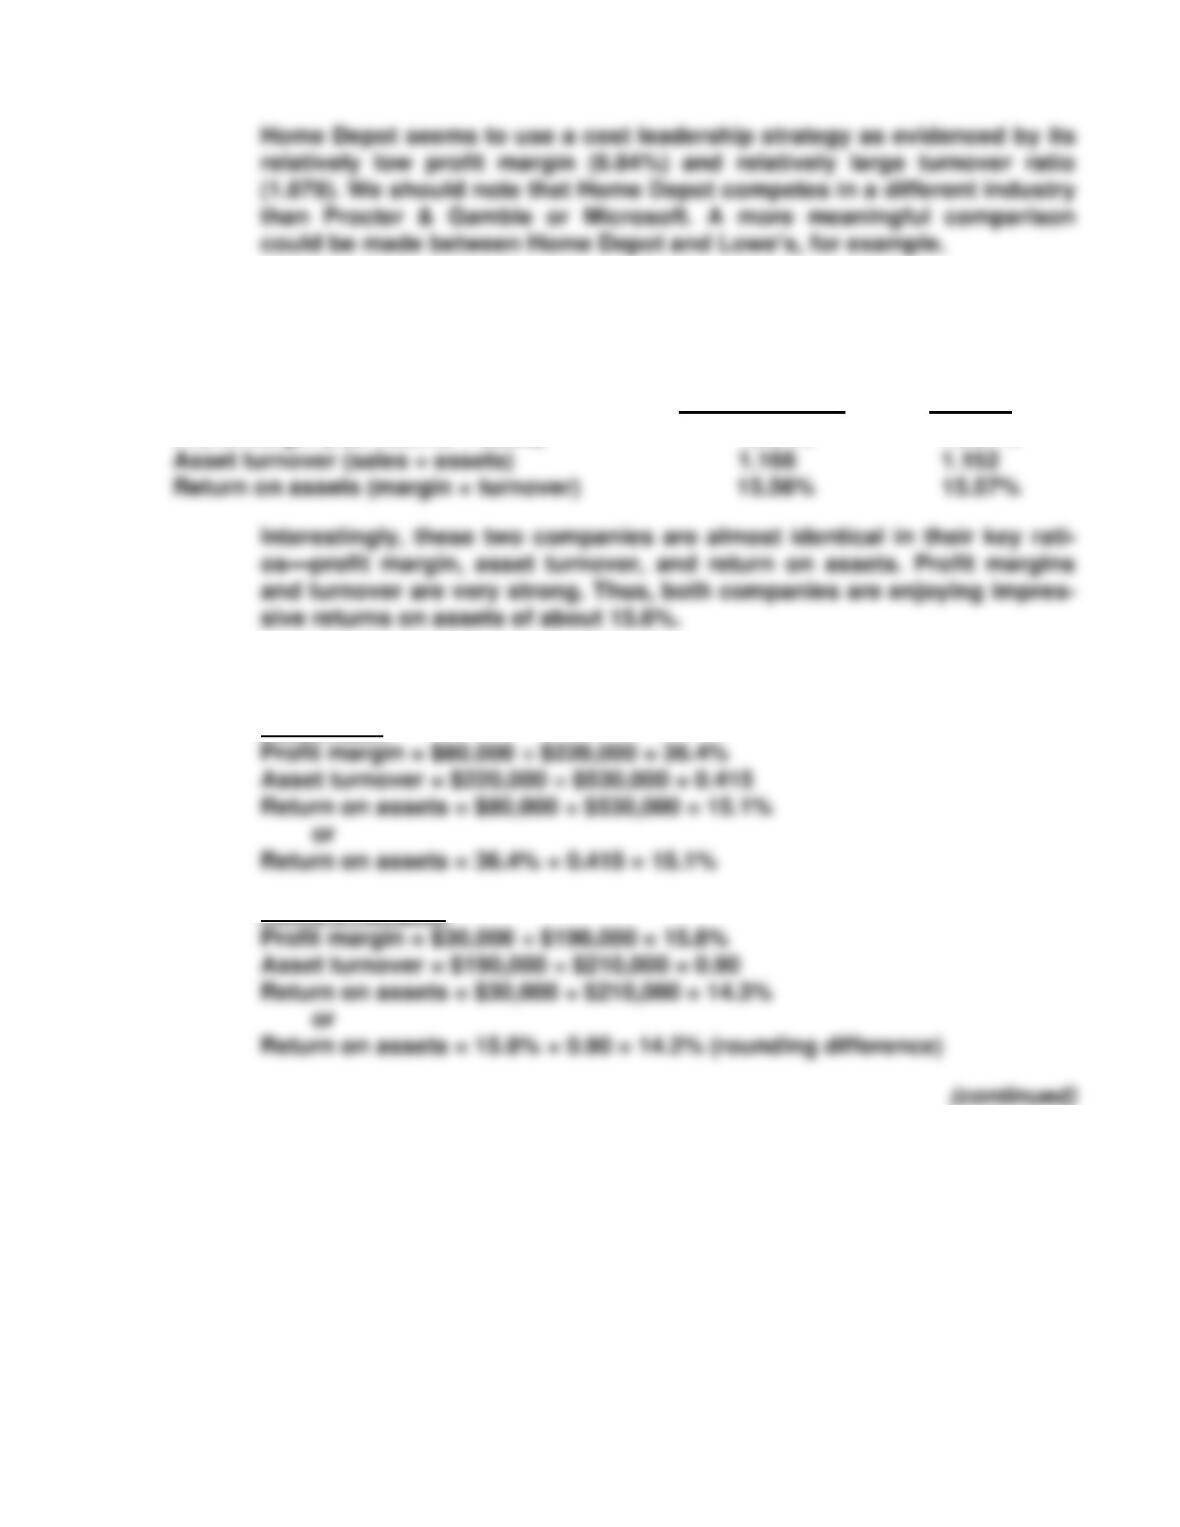
E14-7 Profit margin, asset turnover, and return on assets are provided below for
Hershey Foods and Wrigley.
Hershey Foods
Wrigley
Profit margin (net income ÷ sales)
13.34%
13.51%
Asset turnover (sales ÷ assets)
1.152
Return on assets (margin × turnover)
15.56%
15.57%
E14-8 Calculation of the components of return on assets will give some clues to
operating strategy.
Pat’s Place:
Henry’s Hangout:
430 Chapter 14
Return on assets is similar for the two restaurants. But Pat’s has a higher
profit margin and lower asset turnover, suggesting a product differentia-
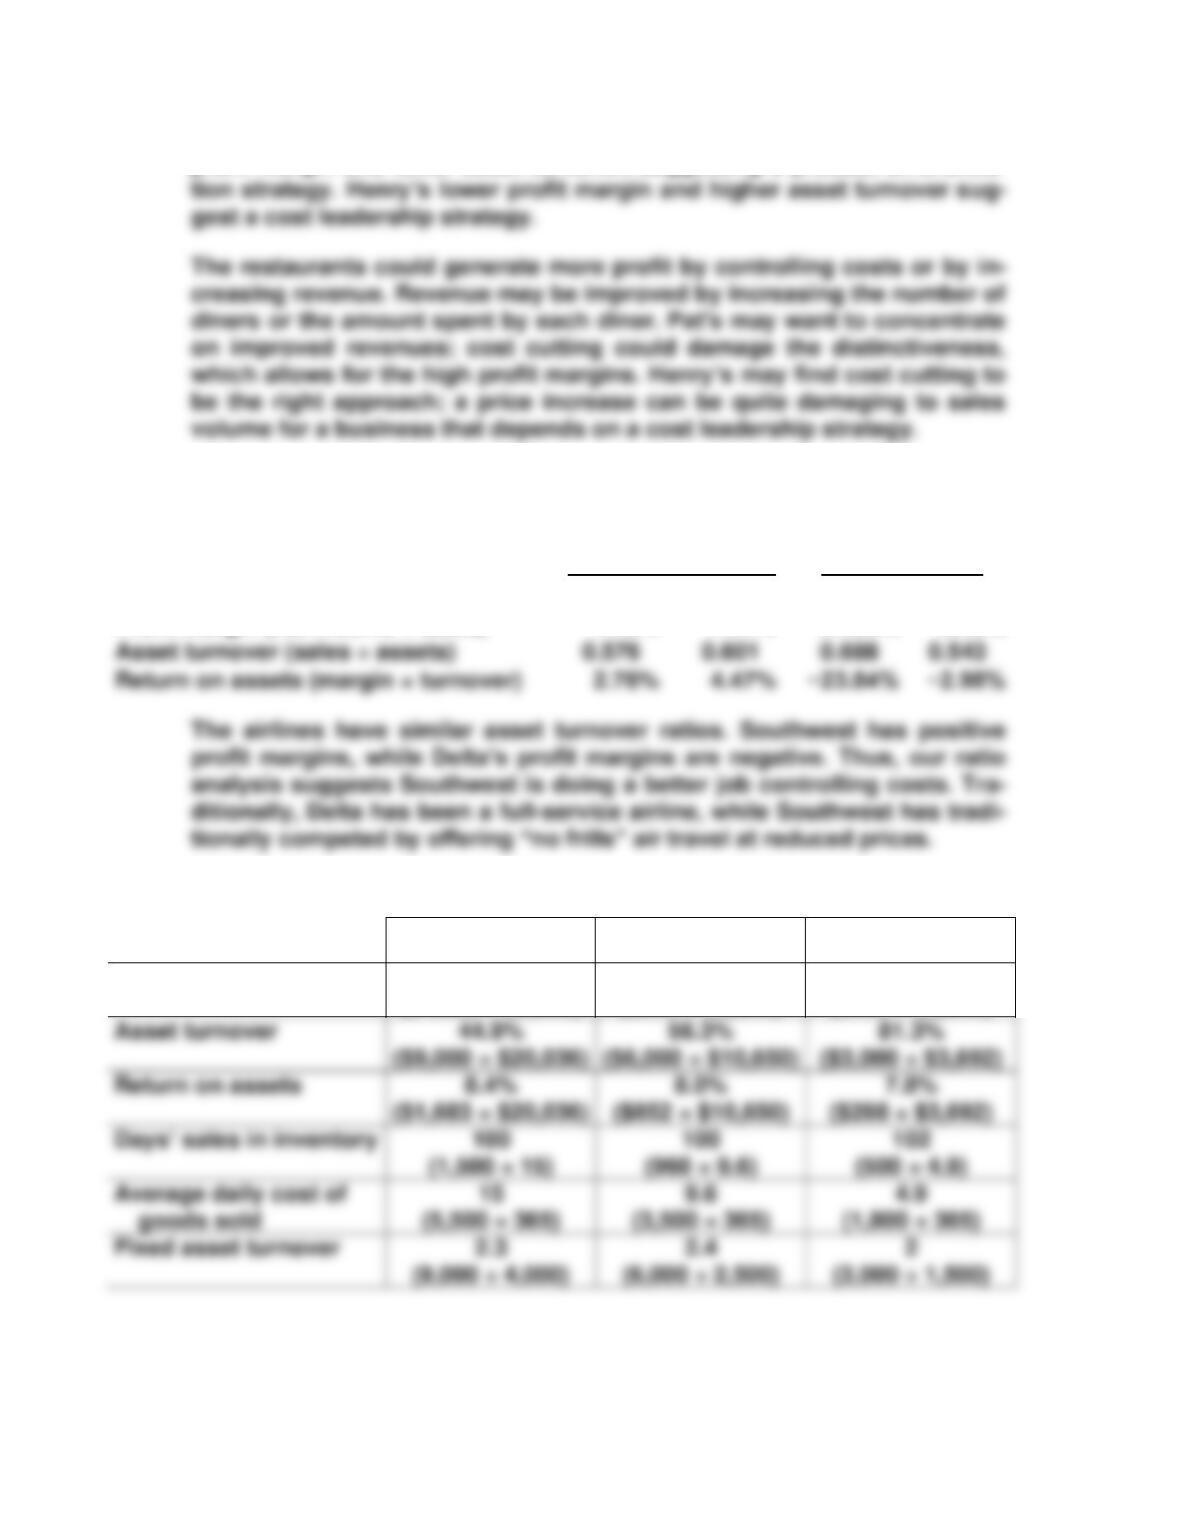
E14-9 Profit margin, asset turnover, and return on assets are provided below for
Southwest and Delta airlines.
Southwest Airlines
Delta Air Lines
2004
2003
2004
2003
Profit margin (net income ÷ sales)
4.79%
7.44%
−34.65%
−5.49%
0.688
Return on assets (margin × turnover)
2.76%
4.47%
−23.84%
−2.98%
E14-10 a.
2008
2007
2006
Profit margin
18.7%
($1,683 ÷ $9,000)
14.2%
($852 ÷ $6,000)
9.6%
($288 ÷ $3,000)
Asset turnover
44.9%
56.3%
81.3%
($3,000 ÷ $3,692)
Average daily cost of
Fixed asset turnover
Analysis of Operating Activities 431
b. The company’s profit margin has almost doubled over the three
years, indicating more emphasis on a product differentiation strate-
E14-11 a.
Fasani Enterprises
Thunderbird
Corporation
2008
2007
2008
2007
b. Fasani is better at generating cash from assets. Net income can be
c. A major difference between net income and cash flow for both firms
is the noncash expenses of depreciation and amortization. In addi-
E14-12 a. Disney’s earnings improved slightly from 2002 to 2003, and signifi-
cantly between 2003 and 2004. Cash flows from operating activities
followed a similar pattern.
(continued)
432 Chapter 14
b. It should not be surprising that differences exist between net earn-
ings and net cash from operating activities. Timing differences be-
E14-13
Federated
Wal-Mart
2004
2003
2004
2003
Inventory turnover
2.98
2.83
7.5
7.3
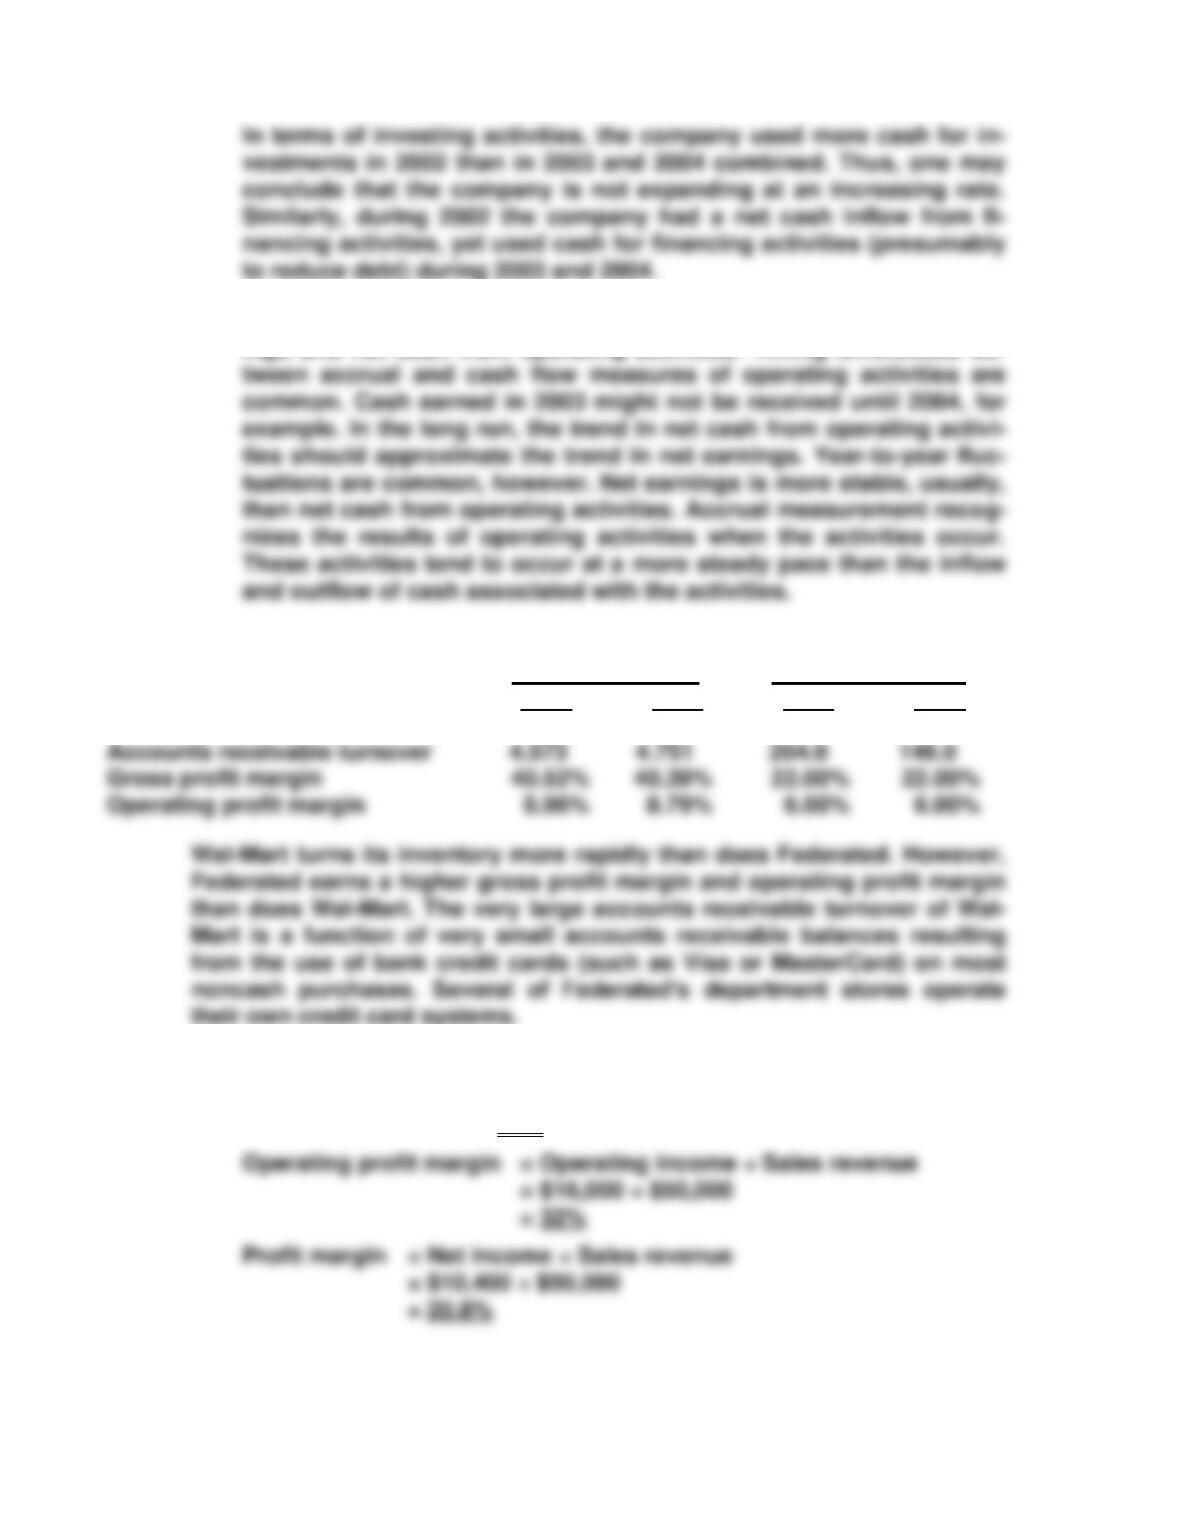
Accounts receivable turnover
4.573
Gross profit margin
Operating profit margin
E14-14 1. Gross profit margin = Gross profit ÷ Sales revenue
= $25,000 ÷ $50,000
= 50%
Analysis of Operating Activities 433
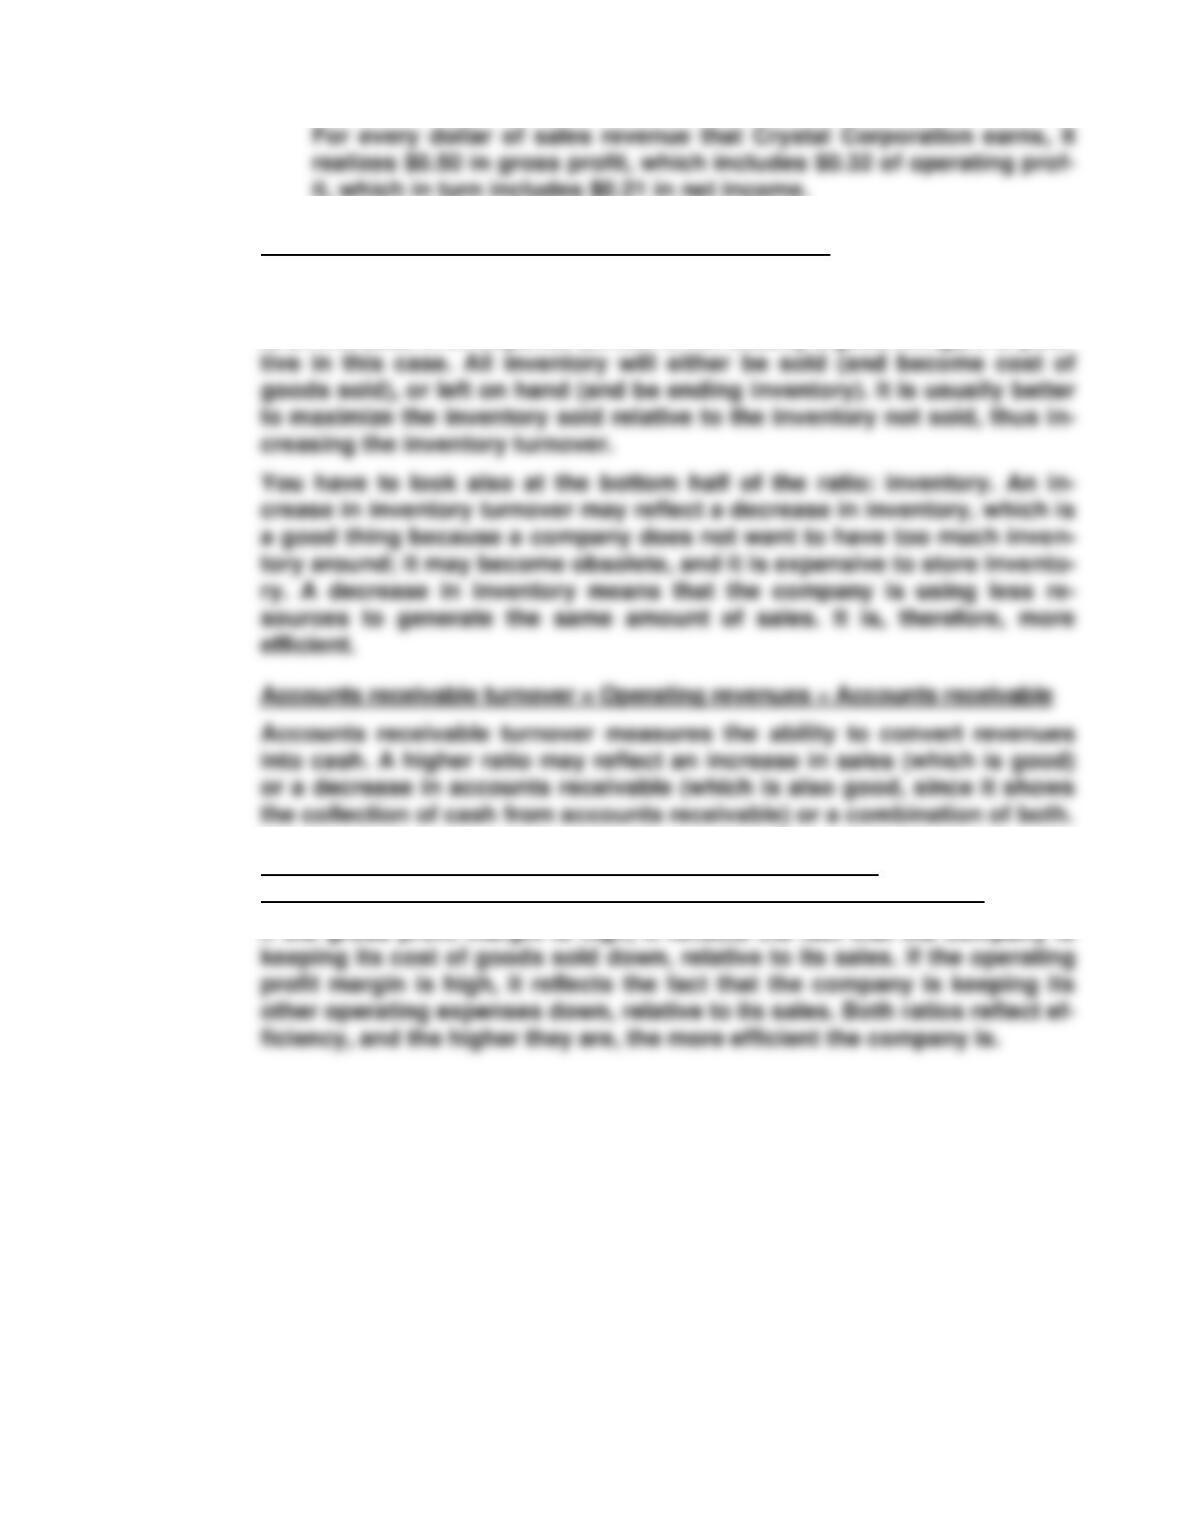
E14-15 Inventory turnover = Cost of goods sold ÷ Inventory
An increased inventory turnover means that either cost of goods sold
went up or inventory went down. While an increase in cost of goods sold
is an increase in an expense (which is not usually a good thing), it is posi-
Gross profit margin = Gross profit ÷ Operating revenues and
Operating profit margin = Operating income ÷ Operating revenues
If the gross profit margin is high, it reflects the fact that the company is
434 Chapter 14
E14-16 a.
Ratio
2008
Calculation
2007
Calculation
1.
Inventory turnover
(CGS ÷ inventory)
5.5
11,481 ÷ 2,093
6.0
11,606 ÷ 1,947
2.
Accounts receivable turn-
over (sales ÷ accounts
receivable)
9.9
14,472 ÷ 1,466
10.5
13,971 ÷ 1,330
8.
Return on equity (net
income ÷ SE)
26.7%
1,170 ÷ 4,386
24.4%
1,020 ÷ 4,180
9.
Times interest earned (in-
come before taxes ÷
interest expense)
1.6
1,636 ÷ 1,000
1.7
1,509 ÷ 900
able collection period
(accounts receivable ÷
average daily sales)
Fixed asset turnover
(sales ÷ fixed assets)
1.81
14,472 ÷ 8,000
1.86
13,971 ÷ 7,500
* Sales ($14,472) − cost of goods sold ($11,481) = gross margin ($2,991)
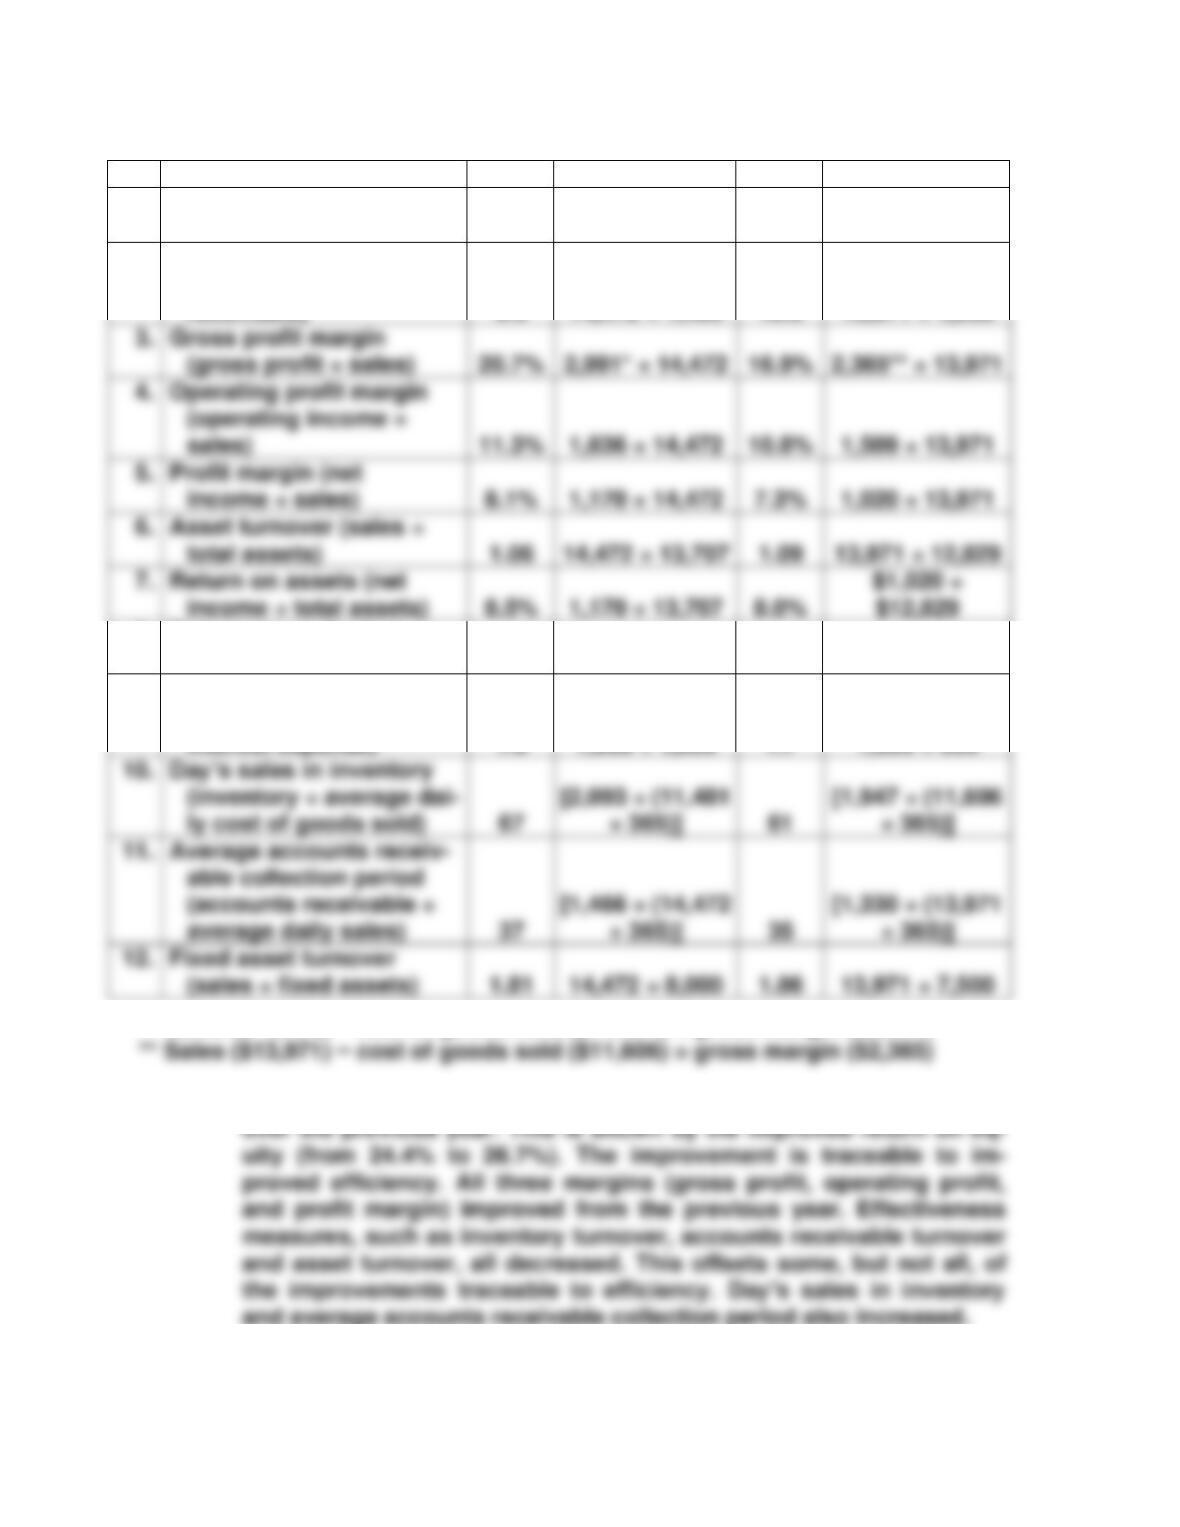
b. Overall, the company’s financial performance improved somewhat
and average accounts receivable collection period also increased.
E14-17
3.
Gross profit margin
(gross profit ÷ sales)
20.7%
16.9%
2,365** ÷ 13,971
4.
Operating profit margin
(operating income ÷
sales)
11.3%
1,636 ÷ 14,472
10.8%
1,509 ÷ 13,971
5.
Profit margin (net
8.1%
1,170 ÷ 14,472
7.3%
1,020 ÷ 13,971
6.
Asset turnover (sales ÷
1.06
14,472 ÷ 13,707
1.09
7.
Return on assets (net
income ÷ total assets)
8.5%
1,170 ÷ 13,707
8.0%
Analysis of Operating Activities 435
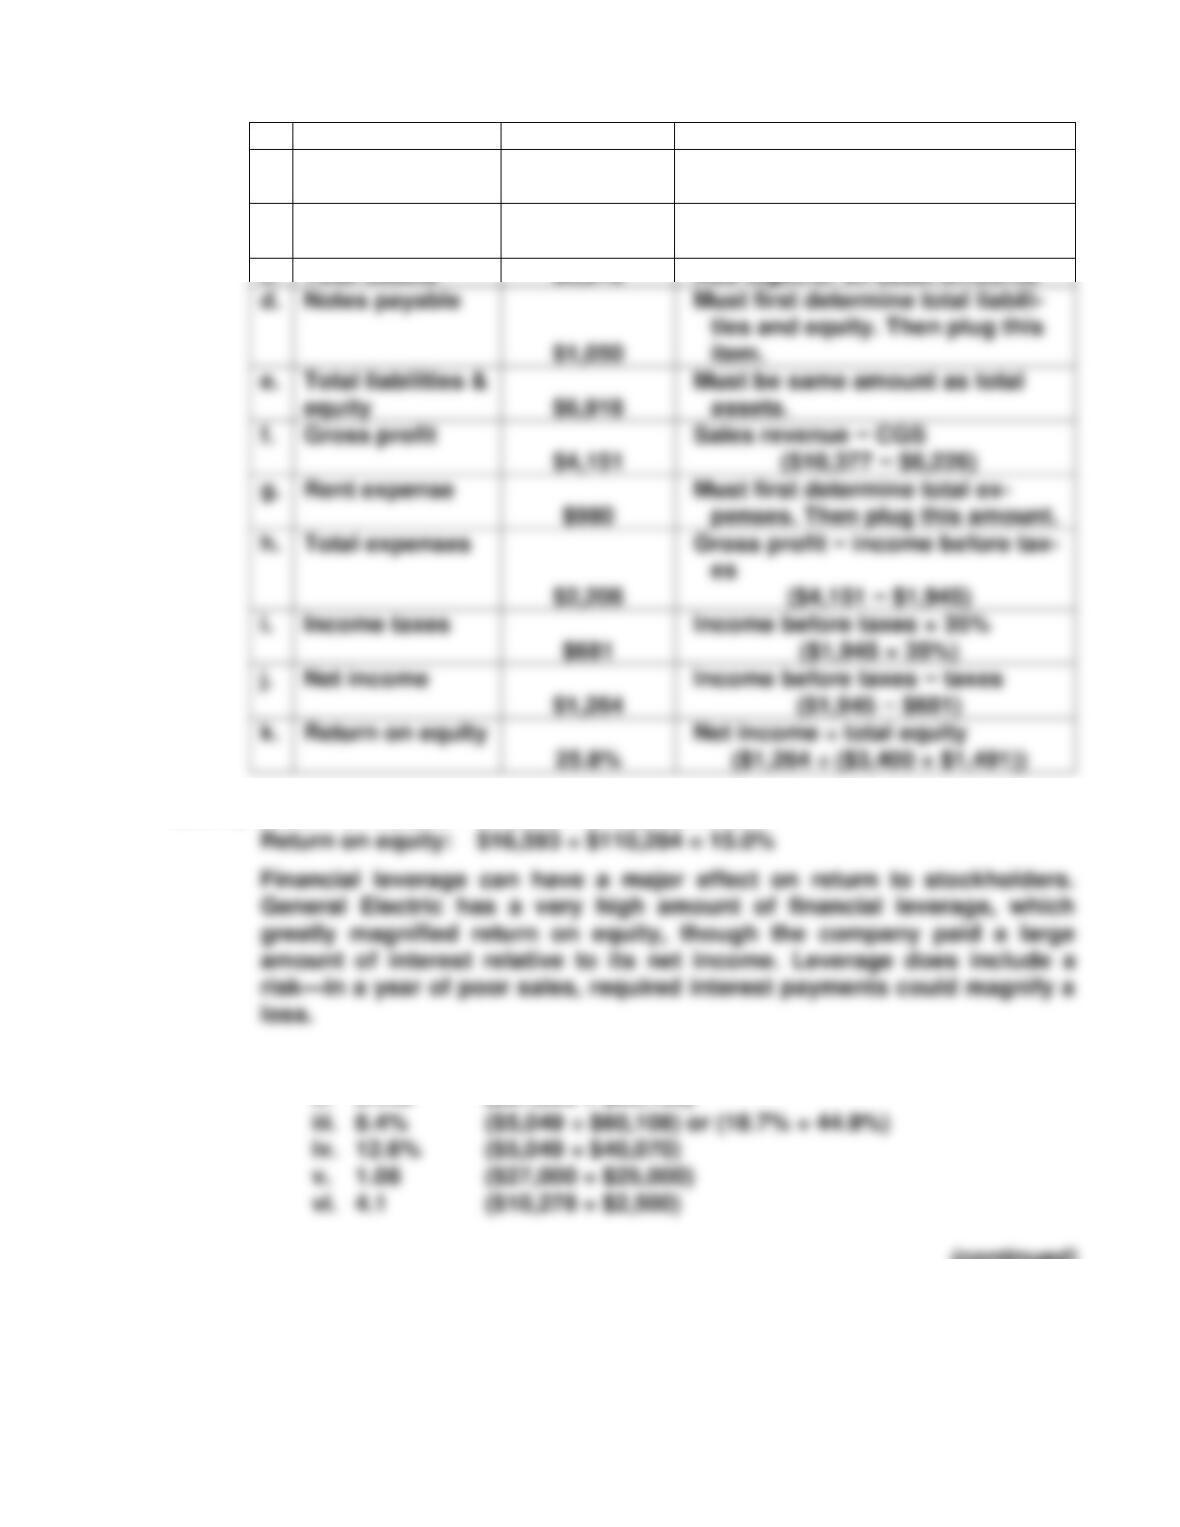
Missing item
Amount
Solution
a.
Accounts
receivable
$1,846
Sales ÷ accts receivable turnover
($10,377 ÷ 5.62)
b.
Inventory
$871
CGS ÷ inventory turnover
($6,226 ÷ 7.15)
c.
Total assets
$6,918
Add together all asset amounts
E14-18 Return on assets: $16,593 ÷ $750,330 = 2.2%
E14-19 a. i. 18.7% ($5,049 ÷ $27,000)
ii. 0.449 ($27,000 ÷ $60,108)
(continued)
$1,050
e.
Total liabilities &
equity
$6,918
Must be same amount as total
g.
Rent expense
$980
Must first determine total ex-
$2,206
Income taxes
$681
Income before taxes × 35%
($1,945 × 35%)
Net income
$1,264
Income before taxes − taxes
k.
Return on equity
Net income ÷ total equity
436 Chapter 14
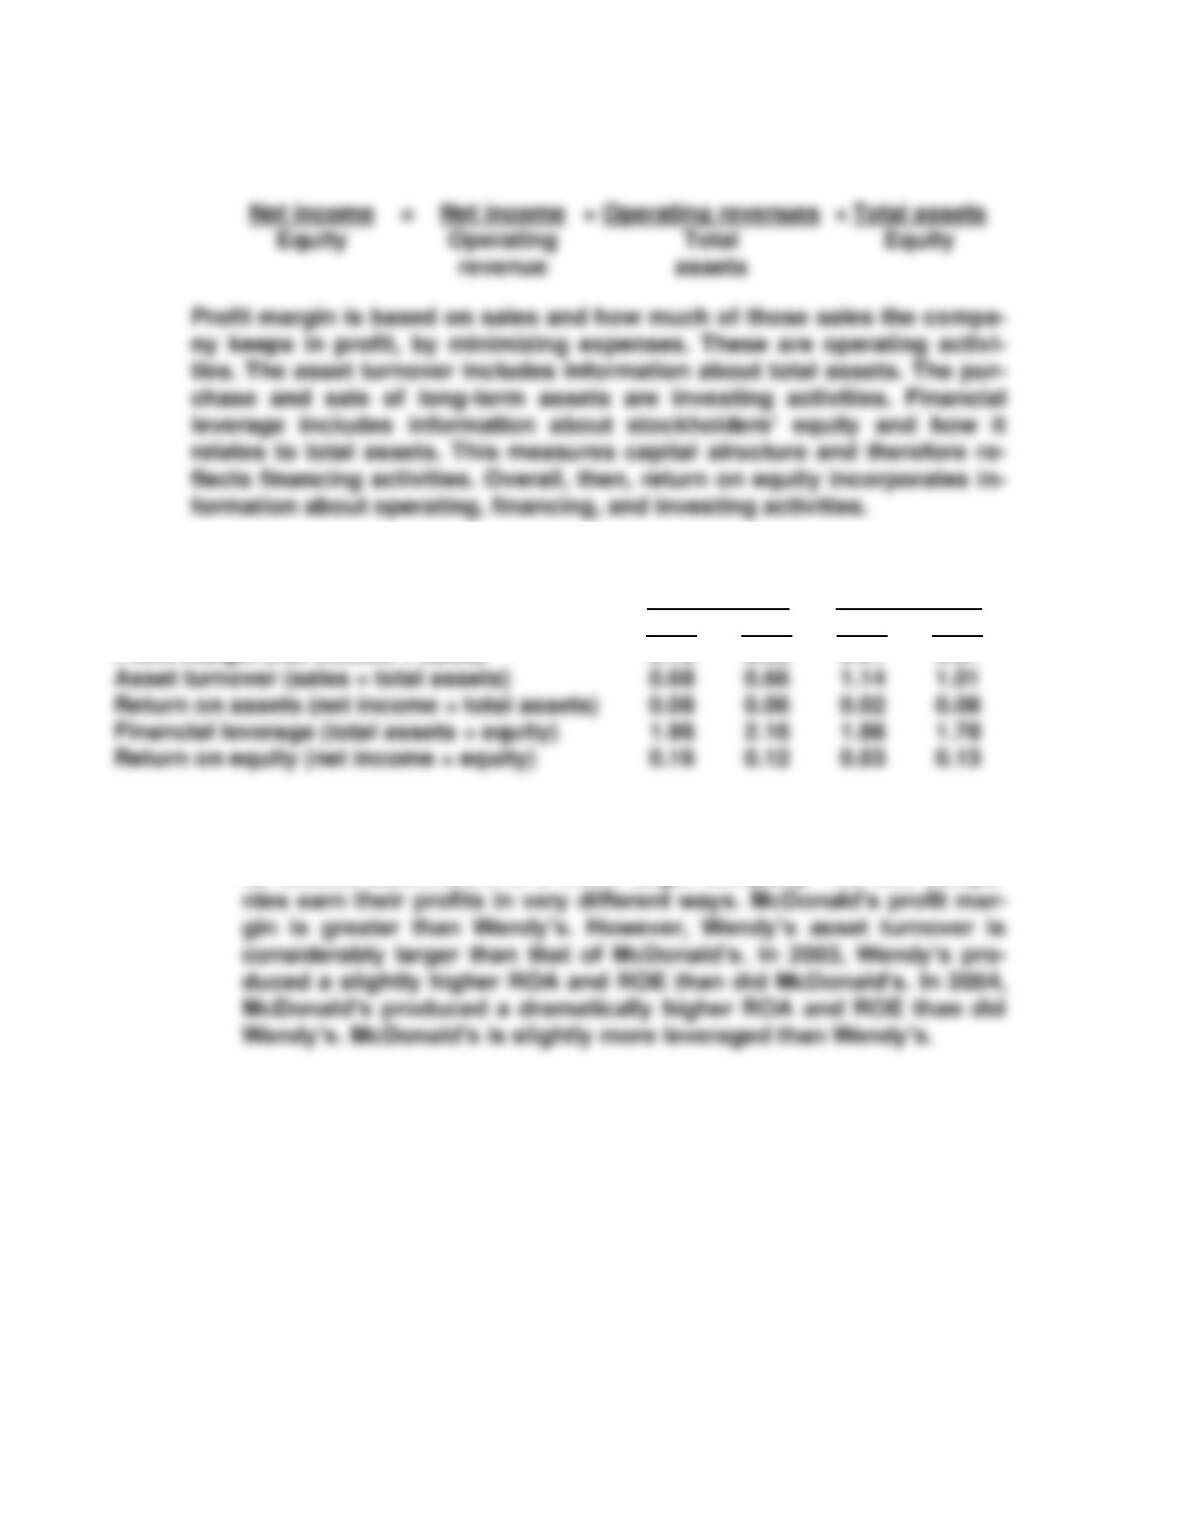
b. Return Profit Asset Financial
On equity = margin × turnover × leverage
E14-20 a.
McDonald’s
Wendy’s
2004
2003
2004
2003
Profit margin (net income ÷ sales)
0.12
0.09
0.01
0.07
Asset turnover (sales ÷ total assets)
0.68
0.66
1.14
1.01
Return on assets (net income ÷ total assets)
0.08
0.06
0.02
0.08
Financial leverage (total assets ÷ equity)
1.96
2.16
1.86
1.78
Return on equity (net income ÷ equity)
0.16
0.12
0.03
0.13
b. Overall, as measured by size of profits (dollars of net income) and to-
tal assets, McDonald’s is a much larger company. The two compa-
Analysis of Operating Activities 437
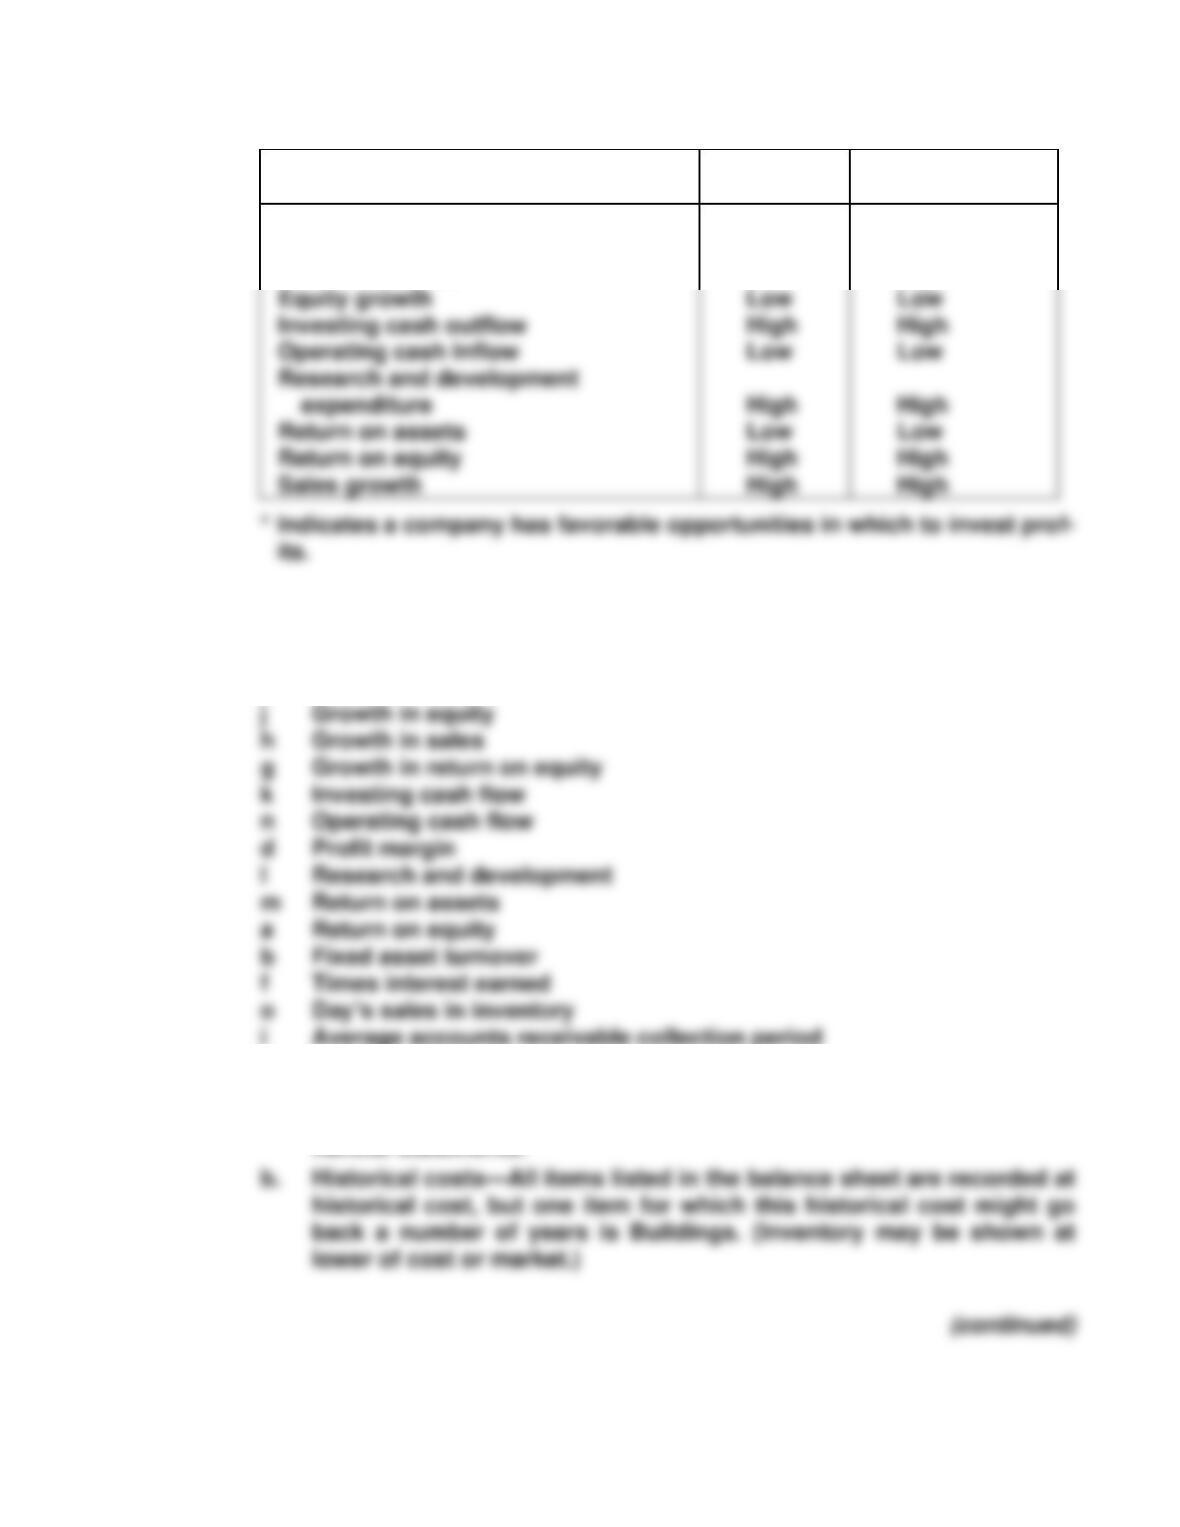
E14-21
Attribute
Magnitude
of Attribute
Expected
Company Value
Asset growth
Debt to assets
Dividend payout*
High
Low
Low
High
High
High
E14-22 Accounting Information
c Asset turnover
e Financial leverage
p Growth in assets
E14-23 a. Measurement units—Dollar values are used to measure the elements
(assets, liabilities, equity, revenues, and expenses) listed in the fi-
nancial statements.
438 Chapter 14
c. Accrual basis—Accounts receivable usually stands for revenues that
have been earned and recorded (and therefore accrued) but for
Also note, under GAAP, the recognition of revenues and expenses is
on an accrual basis. Thus, the income statement items all reflect the
accrual basis.
e. Matched—Cost of sales is matched with sales revenue so that the
PROBLEMS
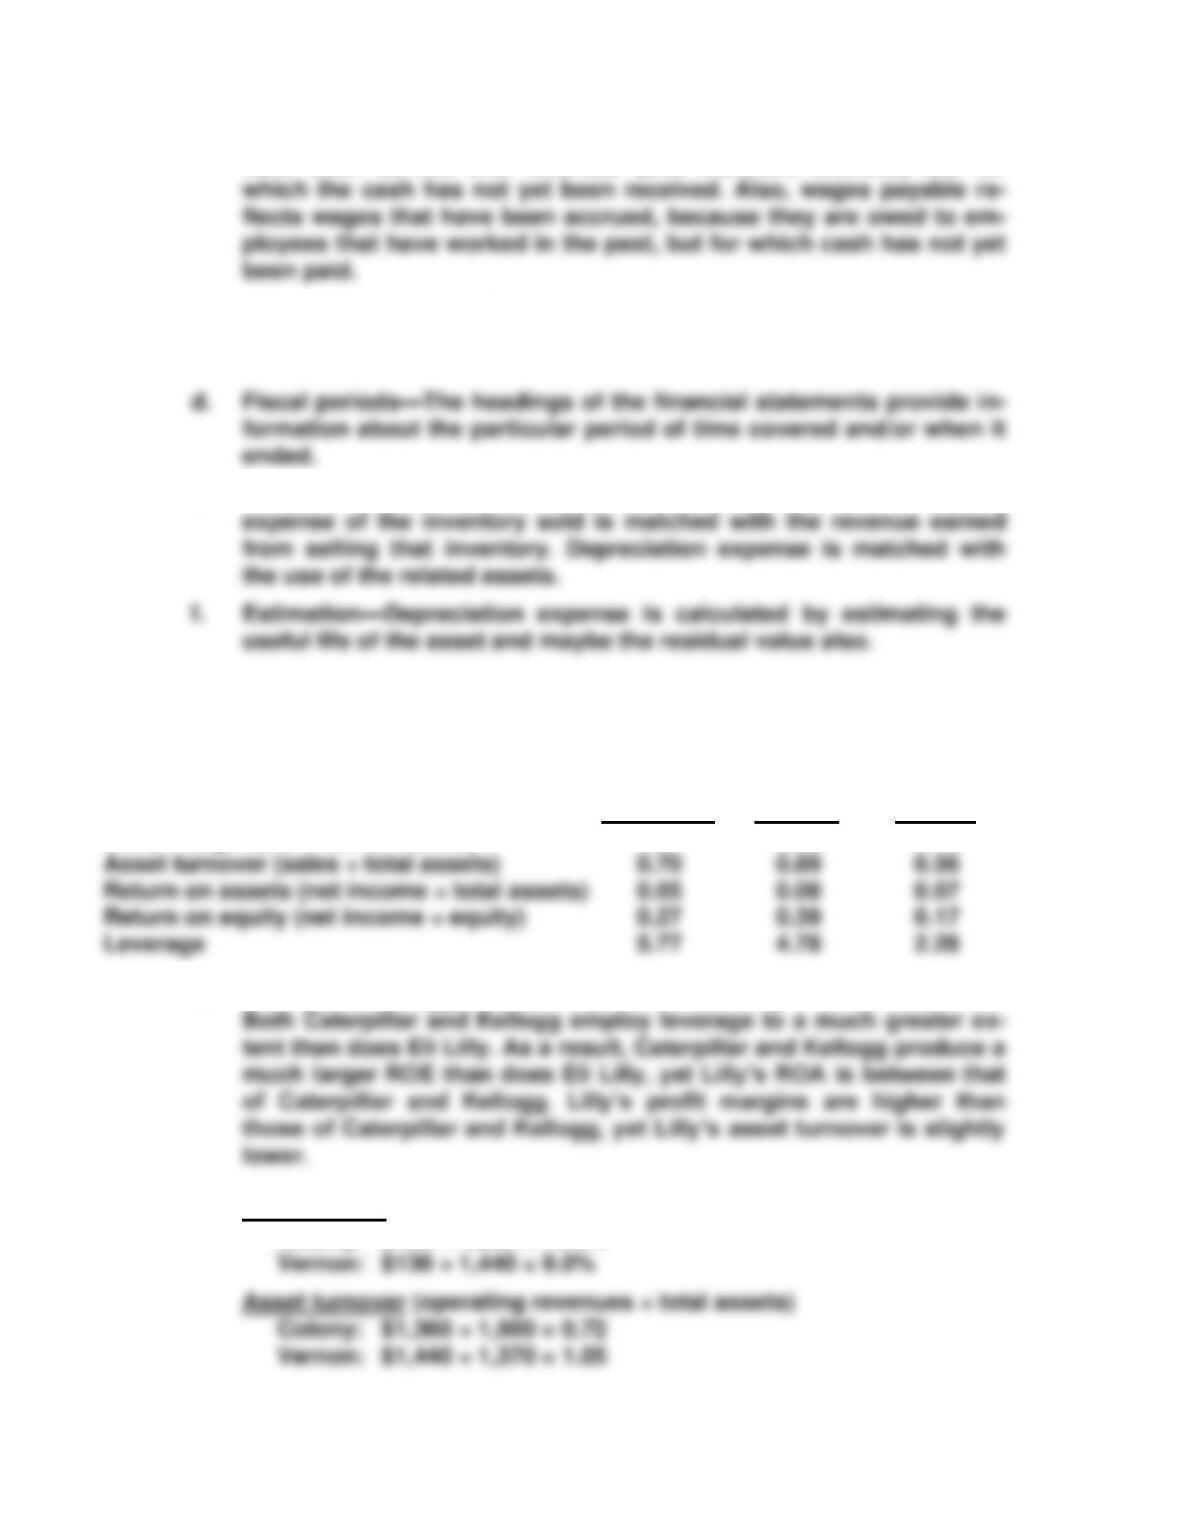
P14-1 A.
Caterpillar
Kellogg
Eli Lilly
Profit margin (net income ÷ sales)
0.07
0.09
0.13
Asset turnover (sales ÷ total assets)
0.70
0.89
0.56
Return on assets (net income ÷ total assets)
0.05
0.08
0.07
Return on equity (net income ÷ equity)
0.27
0.39
0.17
Leverage
5.77
4.78
2.28
B. Caterpillar, Kellogg, and Eli Lilly are in three very different industries.
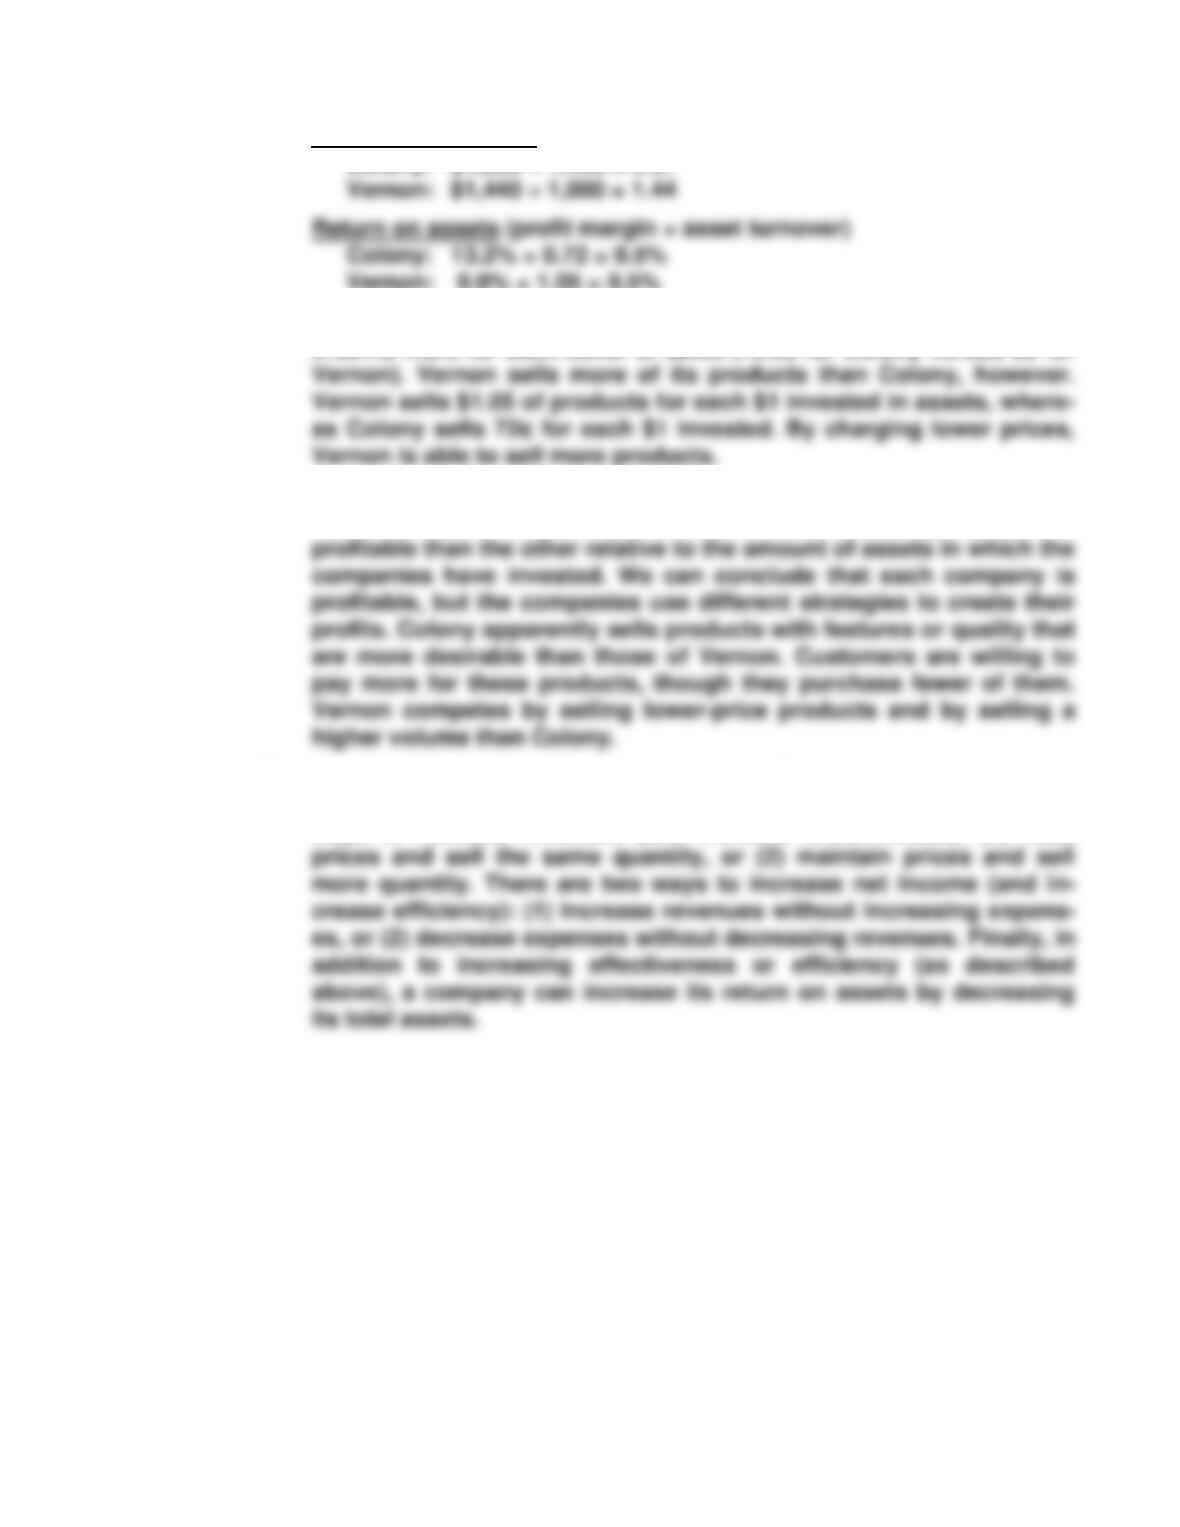
P14-2 A. Profit margin (net income ÷ operating revenues)
Colony: $180 ÷ 1,360 = 13.2%
Analysis of Operating Activities 439
Fixed asset turnover (operating revenues ÷ fixed assets)
Colony: $1,360 ÷ 1,400 = 0.97
Vernon: 9.0% × 1.05 = 9.5%
B. Colony appears to charge higher prices for its products than Vernon.
It earns more for each dollar of sales (13.2¢ for Colony versus 9¢ for
Colony earns a higher net income than Vernon, but each company
earns the same return on assets. Therefore, neither company is more
C. Revenues, expenses, and assets determine the return on assets.
Revenues depend on sales price and volume sold. There are two
ways to increase revenues (and increase effectiveness): (1) raise
440 Chapter 14
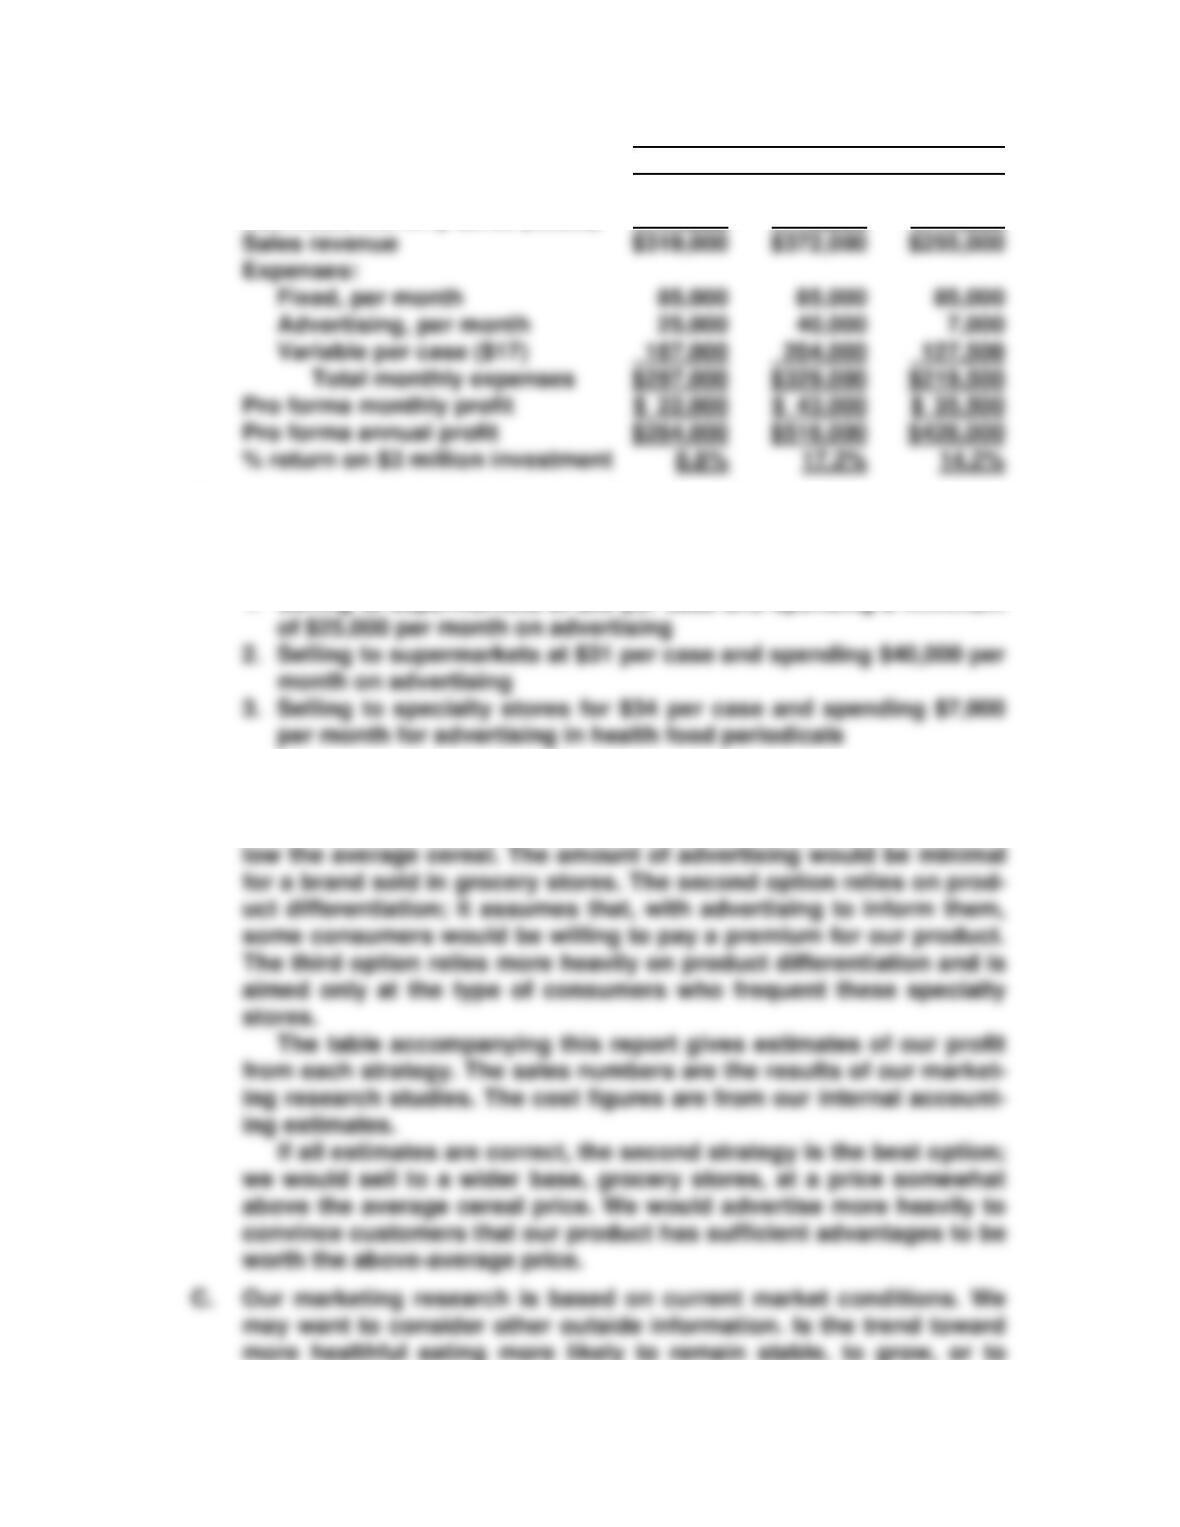
P14-3 A. Strategy
1 2 3
Selling price per case $ 29.00 $ 31.00 $ 34.00
Estimated monthly sales (cases) × 11,000 × 12,000 × 7,500
B. Long Life Pricing and Operating Strategy
By (student name)
Long Life is evaluating three possible selling strategies for its cereal:
1. Selling to supermarkets at $29 per case and spending a minimum
The average case of competitors’ cereals of the size we will sell is
priced at $30 to grocery stores. Thus, the first option is based on
cost leadership; our very healthy cereal would be priced slightly be-