SOLUTION
Chapter 14 Waterways Continuing Problem
WCP14
(a)
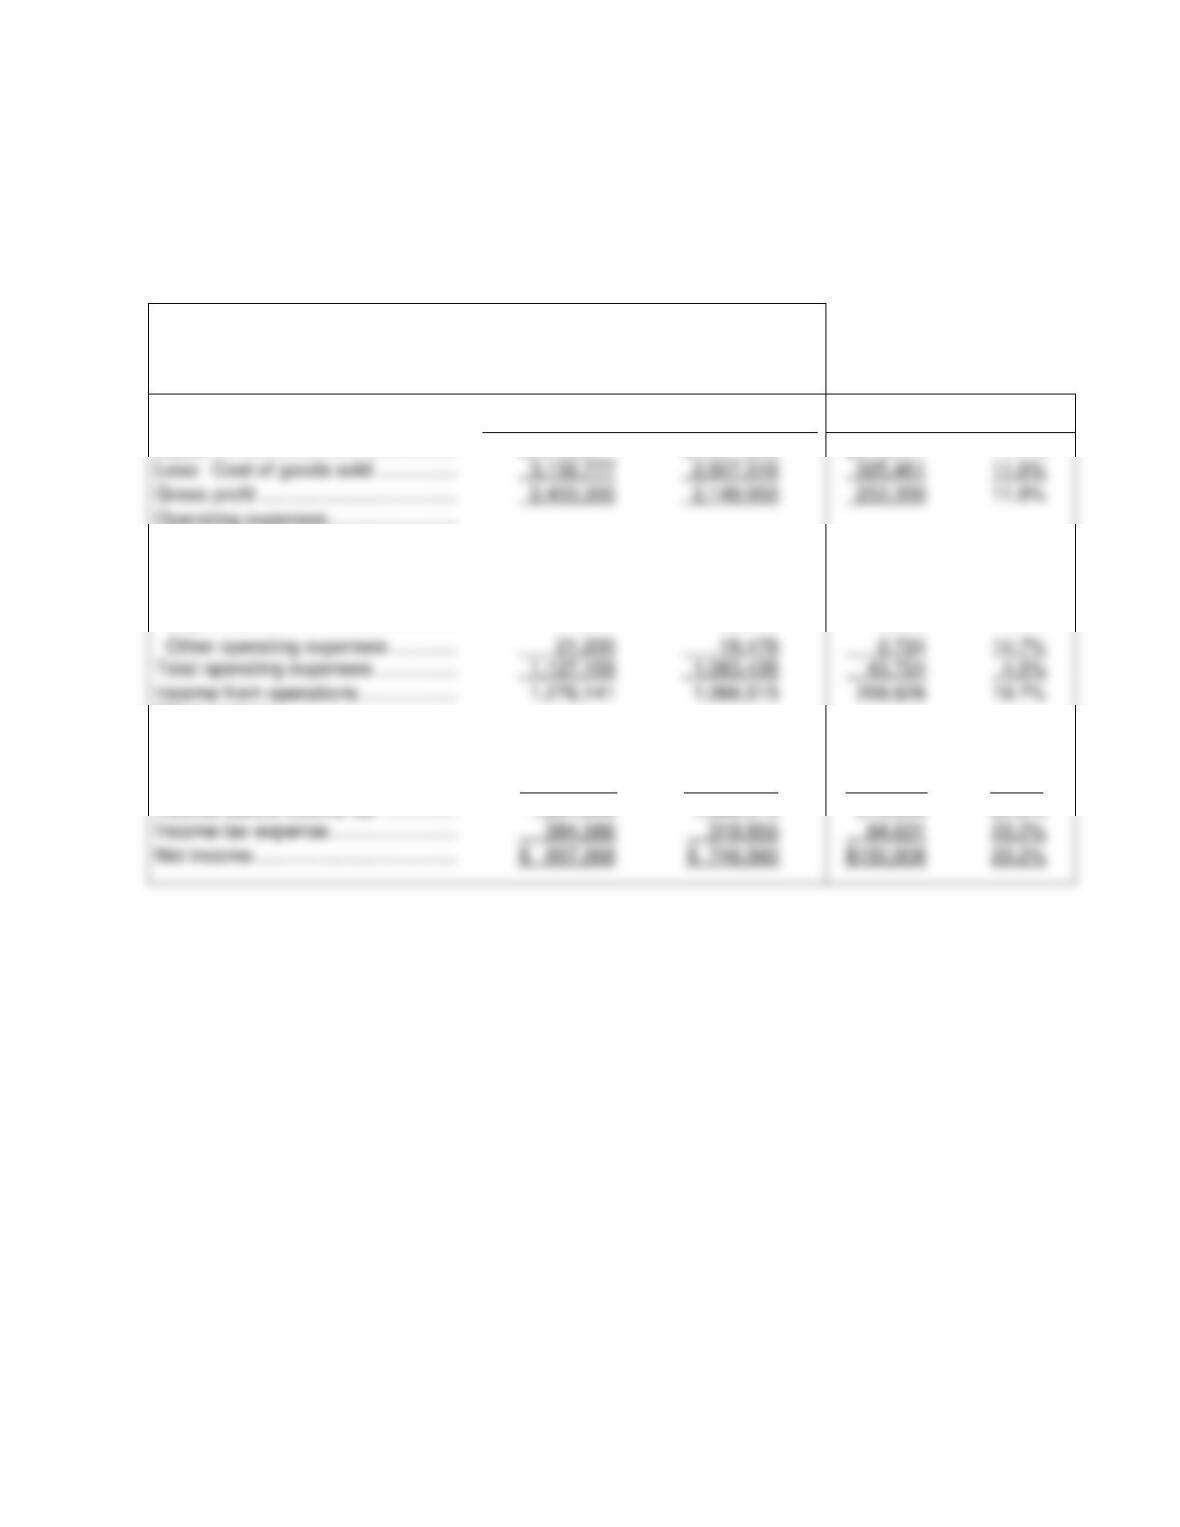
WATERWAYS CORPORATION—Irrigation Installation Division
Income Statement
For the Years Ended December 31
2017
2016
Amount
Percent
Sales ………………………………………..
$5,536,077
$4,957,266
$578,811
11.7%
Operating expenses ……………………
Advertising ………………………………
50,000
48,000
2,000
4.2%
Insurance ………………………………..
400,000
400,000
0
0.0%
Salaries and wages…………………..
584,640
554,640
30,000
5.4%
Depreciation …………………………….
71,319
62,319
9,000
14.4%
Other operating expenses …………
21,200
2,724
14.7%
Total operating expenses ……………
1,127,159
43,724
Income from operations ………………
1,276,141
1,066,515
209,626
19.7%
Other income …………………………….
Gain on sale of equipment …………
18,000
—
18,000
NA
Other expenses ………………………….
Interest expense ………………………
(12,187)
—
(12,187)
NA
Income before income tax …………..
1,281,954
1,066,515
215,439
20.2%
Income tax expense ……………………
384,586
64,631
20.2%
Net income ………………………………..
$ 897,368
$150,808
20.2%
Less: Cost of goods sold ……………
3,132,777
325,461
11.6%
Gross profit ……………………………….
2,403,300
253,350
11.8%
(b)
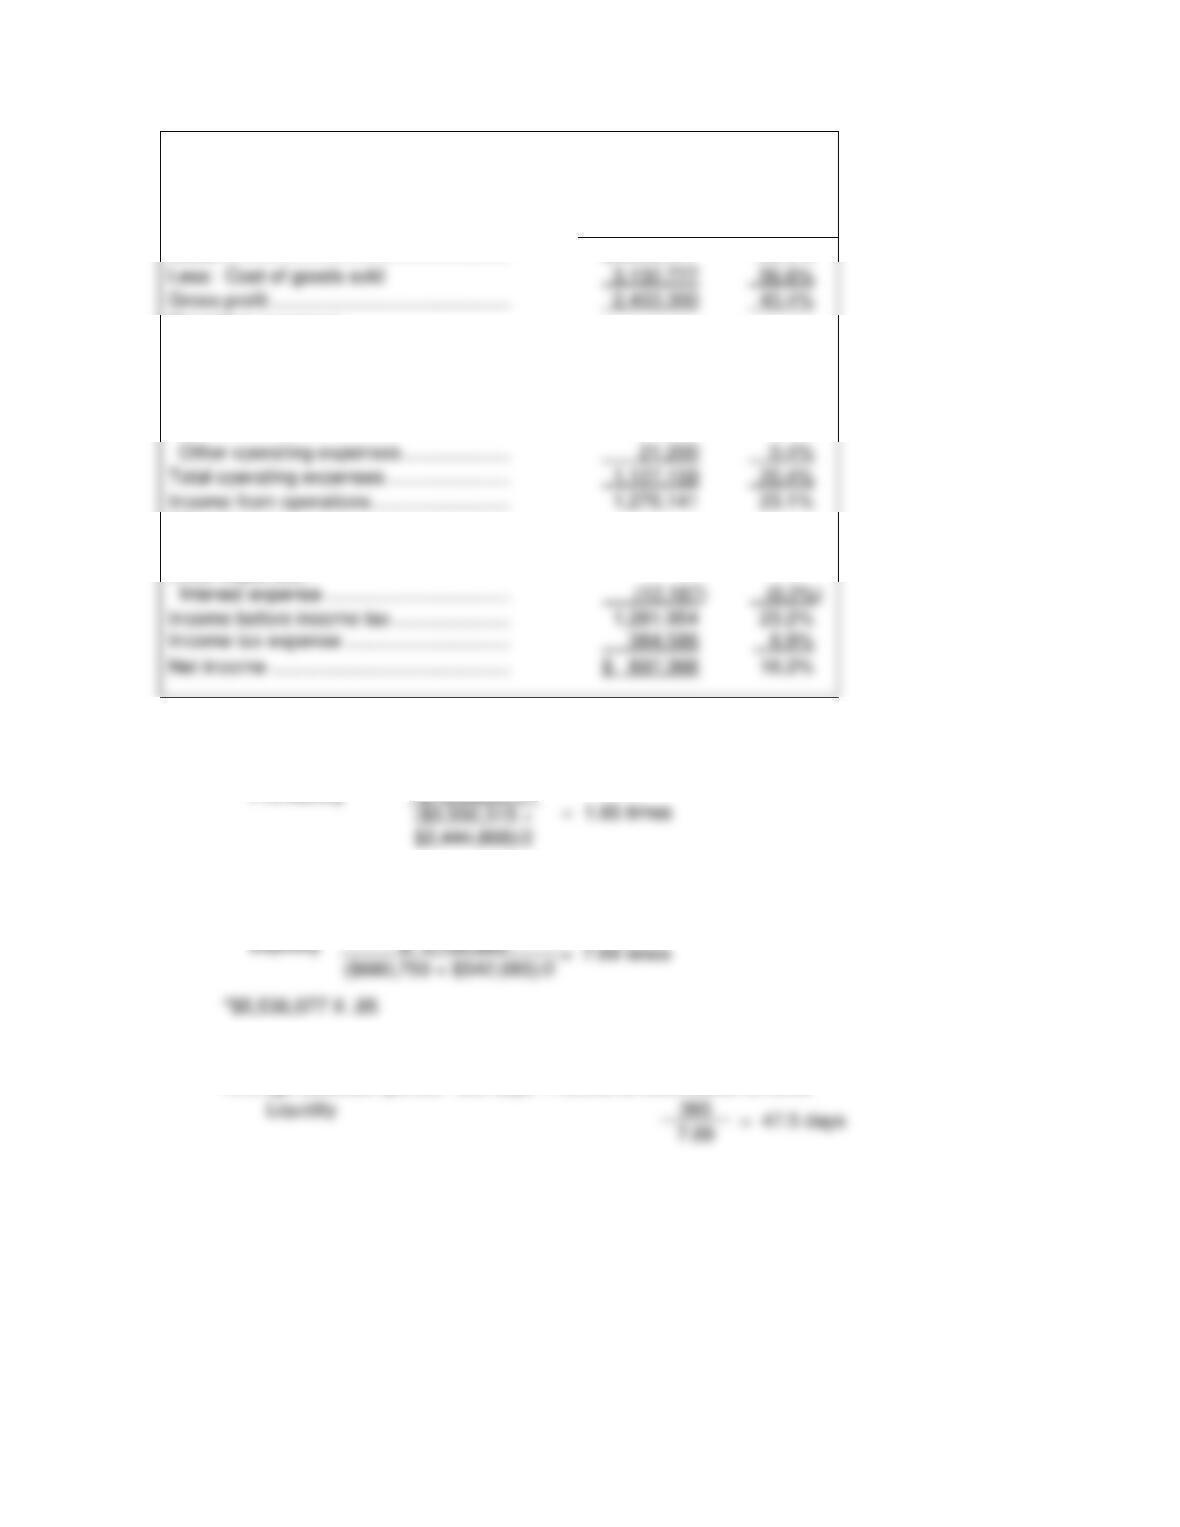
Income Statement
For the Year Ending December 31, 2017
Amount
Percent
Sales ……………………………………………….
$5,536,077
100.0%
Operating expenses
Advertising ……………………………………..
50,000
0.9%
Insurance ……………………………………….
400,000
7.2%
Salaries and wages …………………………
584,640
10.6%
Depreciation …………………………………..
71,319
1.3%
Other operating expenses ………………..
Income from operations ……………………..
23.1%
Other income ……………………………………
Gain on sale of equipment ……………….
18,000
0.3%
Other expenses
Interest expense ……………………………..
(0.2%)
Income before income tax ………………….
23.2%
Income tax expense ………………………….
Net income ………………………………………
$ 897,368
16.2%
(c) (1)
Asset turnover: Net sales Average total assets
Profitability
$ 5,536,077
(2)
Accounts receivable turnover: Net credit sales Average net accounts receivable
Liquidity
(3)
Average collection period: 365 days Accounts receivables turnover
Liquidity
Less: Cost of goods sold
56.6%
Gross profit ………………………………………
(4)
Current ratio: Current assets Current liabilities
Liquidity
$2,313,022
= 7.88:1
$ 293,658
(8)
Return on assets: Net income Average total assets
Profitability
$897,368
= 29.9%
($3,550,315 + $2,444,868)/2
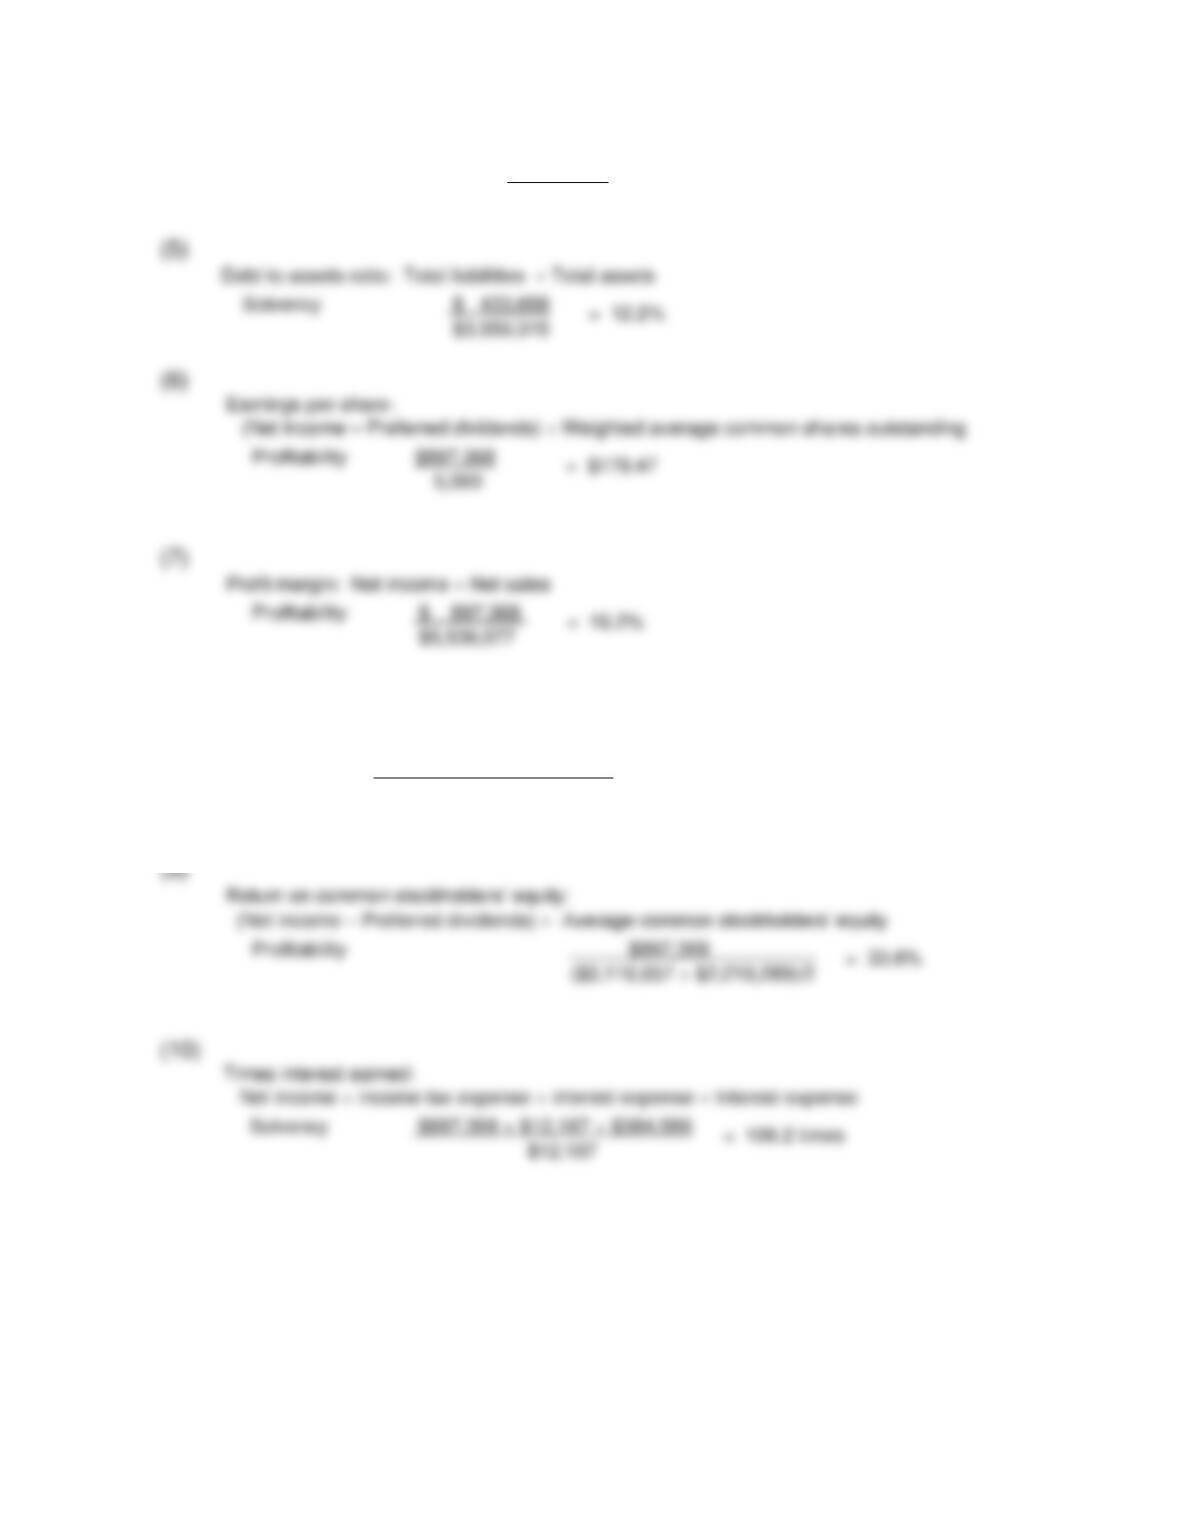
(Net income – Preferred dividends) Average common stockholders’ equity
Profitability
Net income + income tax expense + interest expense Interest expense
= 106.2 times
Debt to assets ratio: Total liabilities Total assets
Solvency
$ 433,658
= 12.2%
$3,550,315
(Net income – Preferred dividends) Weighted average common shares outstanding
Profitability
Profit margin: Net income Net sales
Profitability
$ 897,368
= 16.2%
$5,536,077
(d) The company’s liquidity, as reflected in its current ratio of 7.58:1 is strong . . . perhaps far
too strong. A ratio of 2:1 would be considered very good. It appears that the company
has more cash on hand than it needs. Its liquidity is aided by a reasonable collection
period of 47.5 days.
The company’s solvency is very high. Its debt to assets ratio of 12.2% reflects very low
reliance on debt. As a consequence, it also has a very high times interest earned ratio.