E14–21
a.
Operations from
Income sing‘Manufactur
Retina in Increase
=
Price
Market
–
Unit per Cost
Variable
×
dTransferre
Units
$225,000 = ($75 – $66) × 25,000
Price
Transfer
dTransferre
Units
This is the amount the Aircraft Division saves by purchasing from the Elec-
tronic Division at an internal price that is lower than the market price.
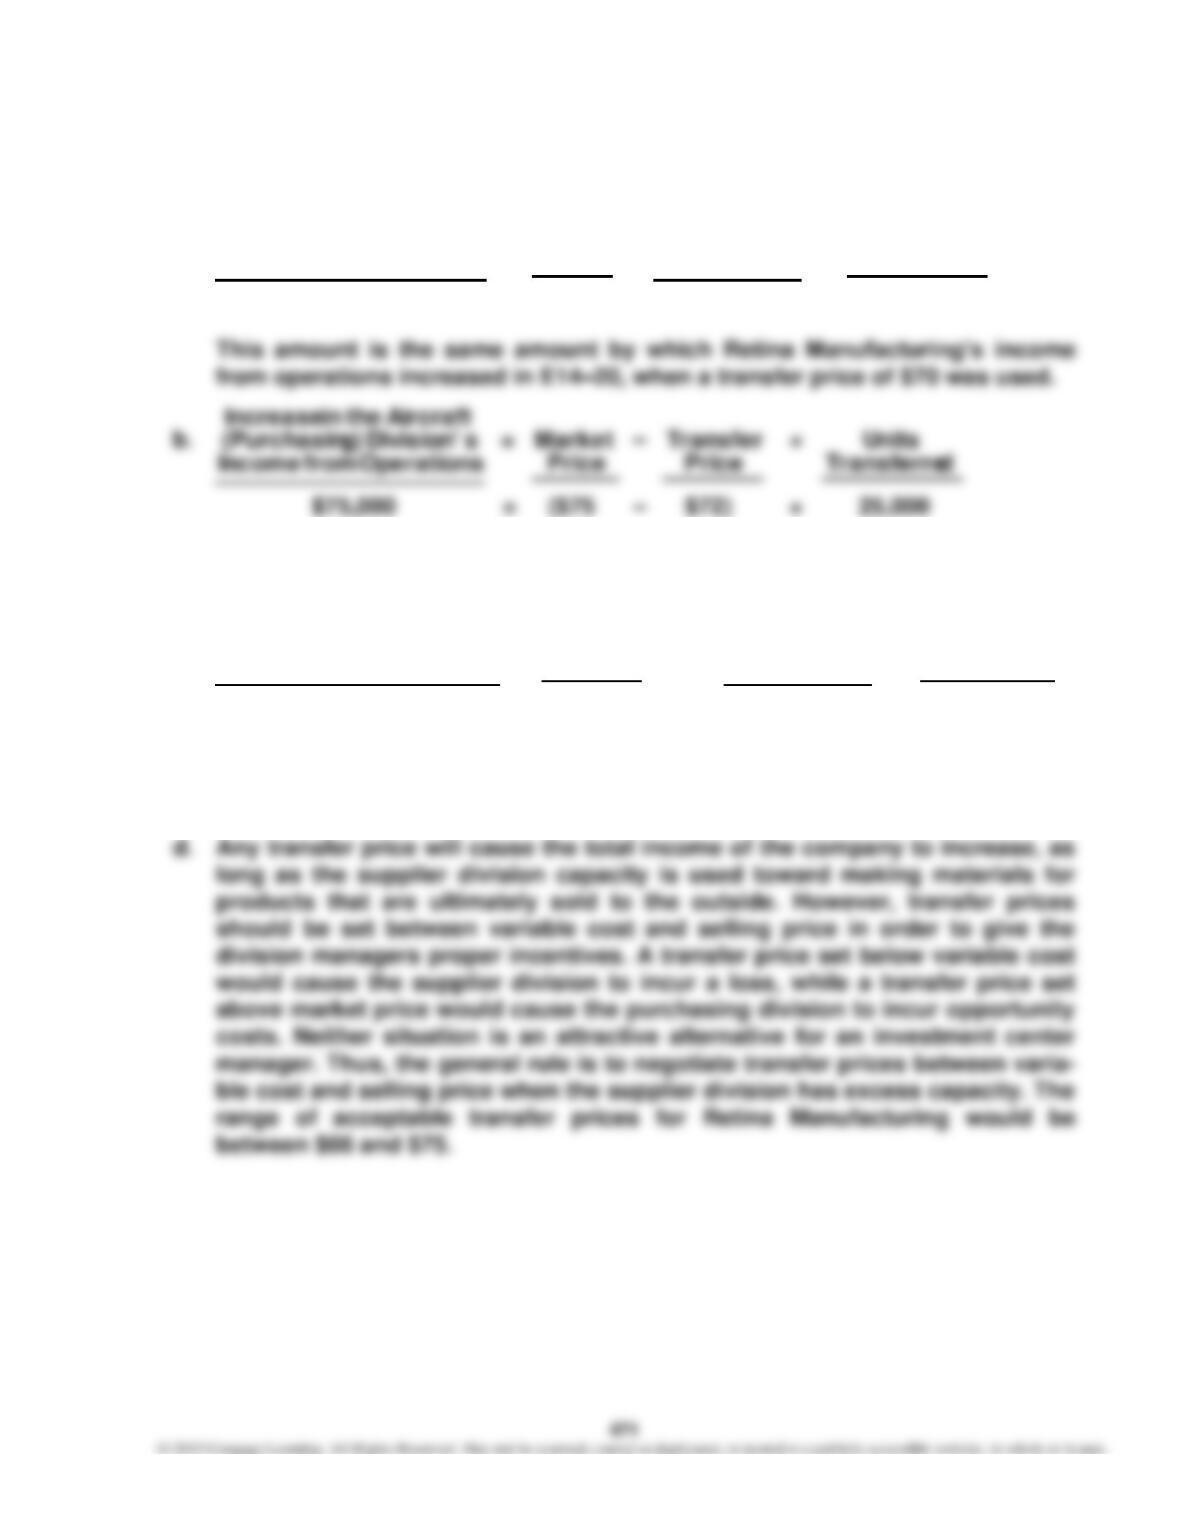
c.
Operations from Income
sDivision‘ )(Supplying
Electronic the in Increase
=
Price
Transfer
–
Unit per Cost
Variable
×
dTransferre
Units
$150,000 = ($72 – $66) × 25,000
This is the amount the Electronic Division earns by using available excess
capacity to produce and sell products above variable cost to the Aircraft Divi-
sion.
472
PROBLEMS
P14–1
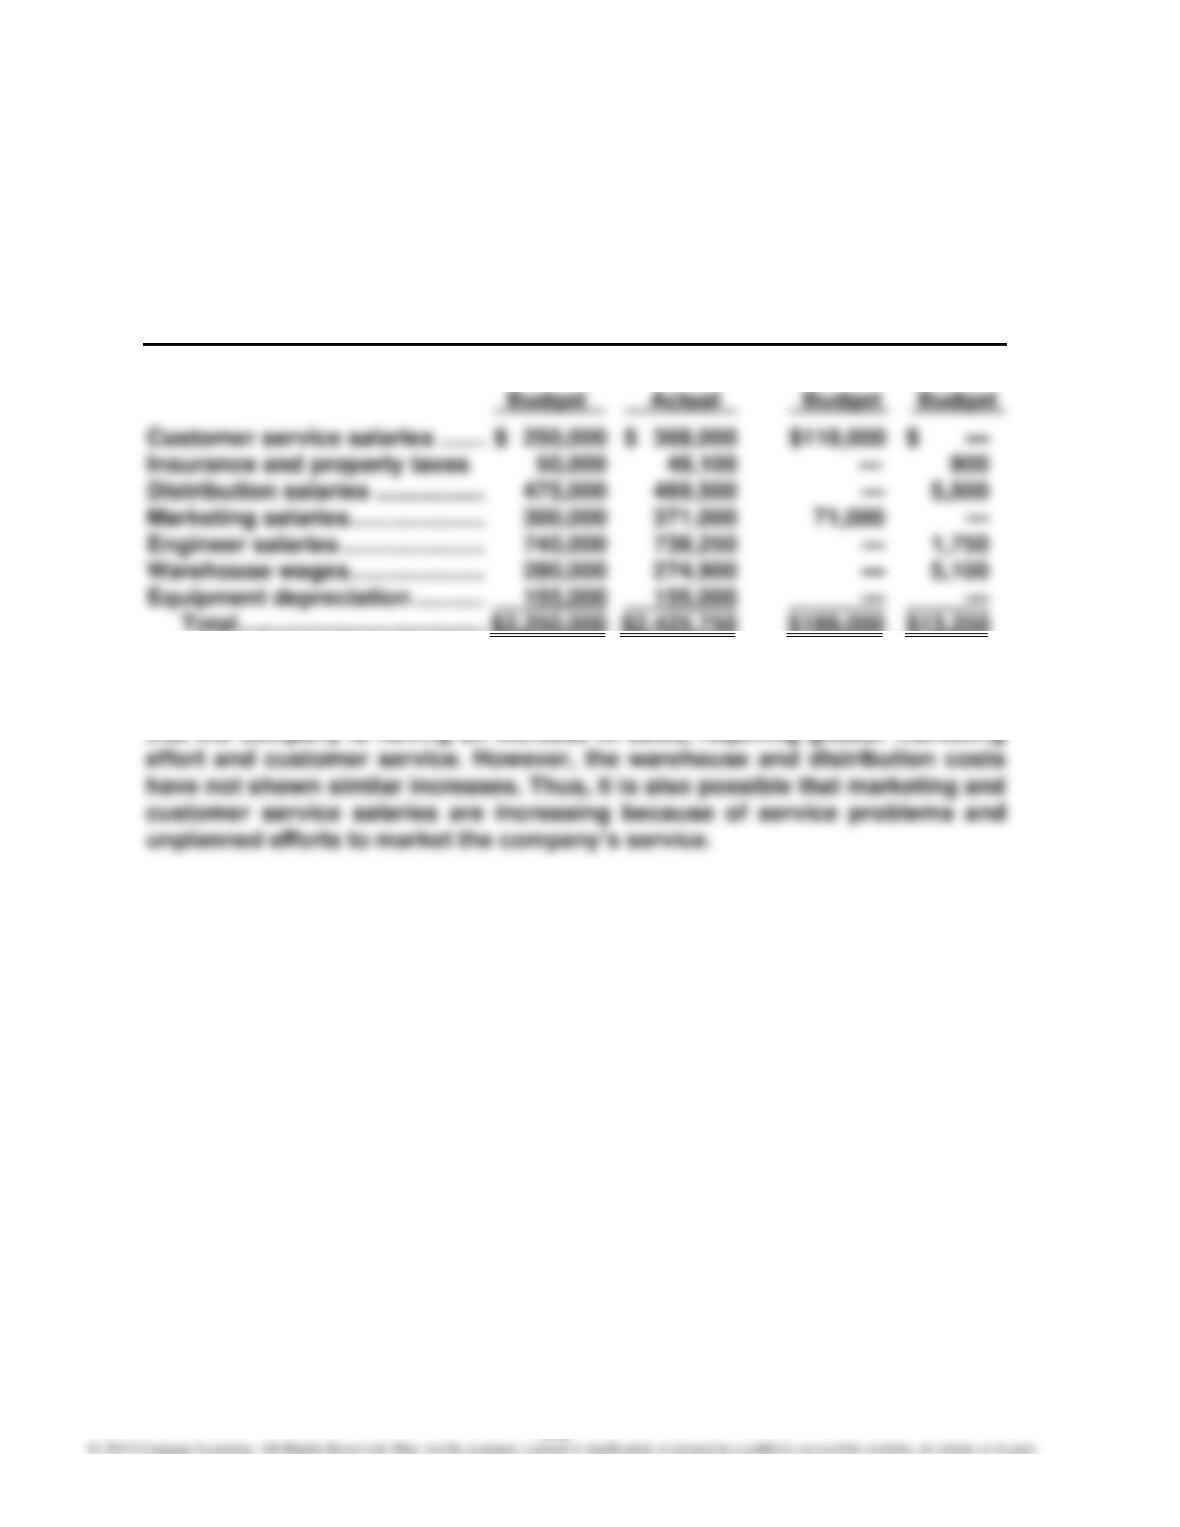
1. SNEED INDUSTRIES COMPANY
Budget Performance Report—Director, Crane Division
For the Month Ended August 31, 20Y6
Over Under
2. The customer service and marketing salaries are significantly over budget.
The director should investigate the cause of these results. One possibility is
that the company is having an increase in sales, requiring greater marketing
473
P14–2
1.
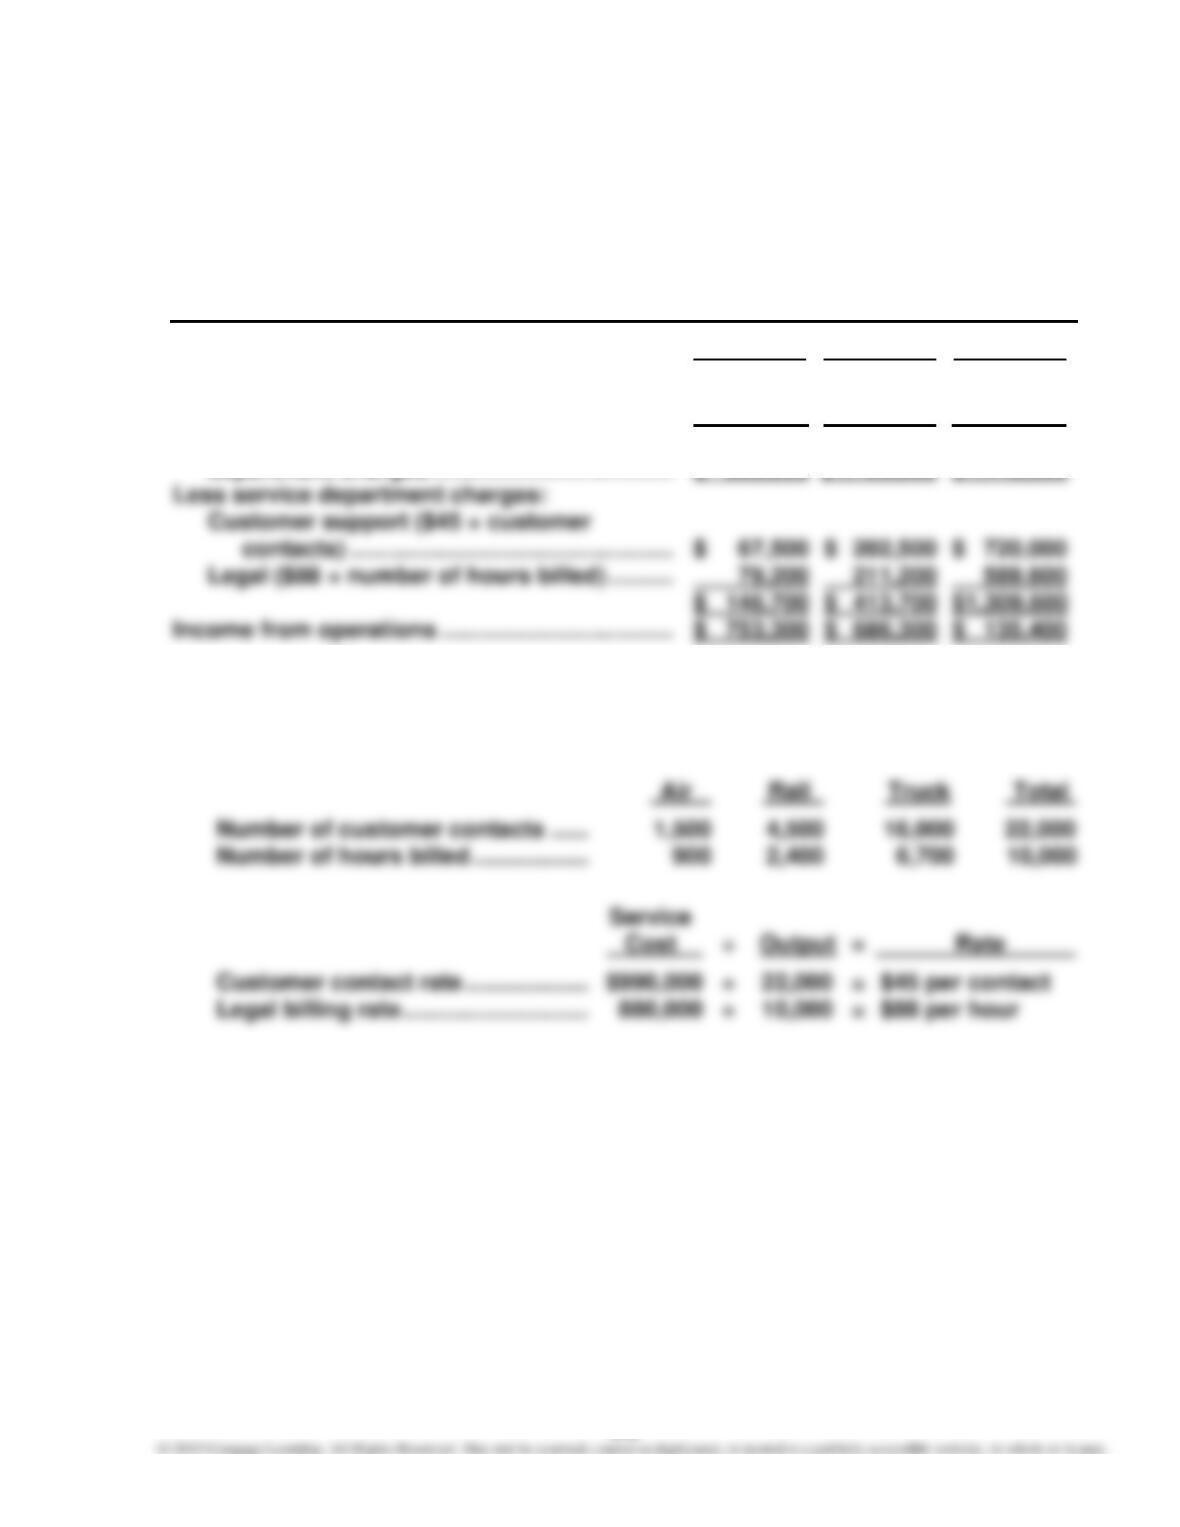
A-ONE FREIGHT INC.
Divisional Income Statements
For the Quarter Ended December 31, 20Y3
Air Rail Truck
Revenues …………………………………………………… $5,000,000 $6,000,000 $9,000,000
Operating expenses ……………………………………. 4,100,000 4,900,000 7,555,000
Income from operations before service
department charges ………………………………. $ 900,000 $1,100,000 $1,445,000
Supporting schedules:
Service department charge rates for the two service departments, Customer
Support and Legal, are determined as follows:
Note: The Shareholder Relations Department and general corporate officers’ sala-
ries are not controllable by division management and thus are not included in
determining division income from operations.
474
P14–2, Concluded
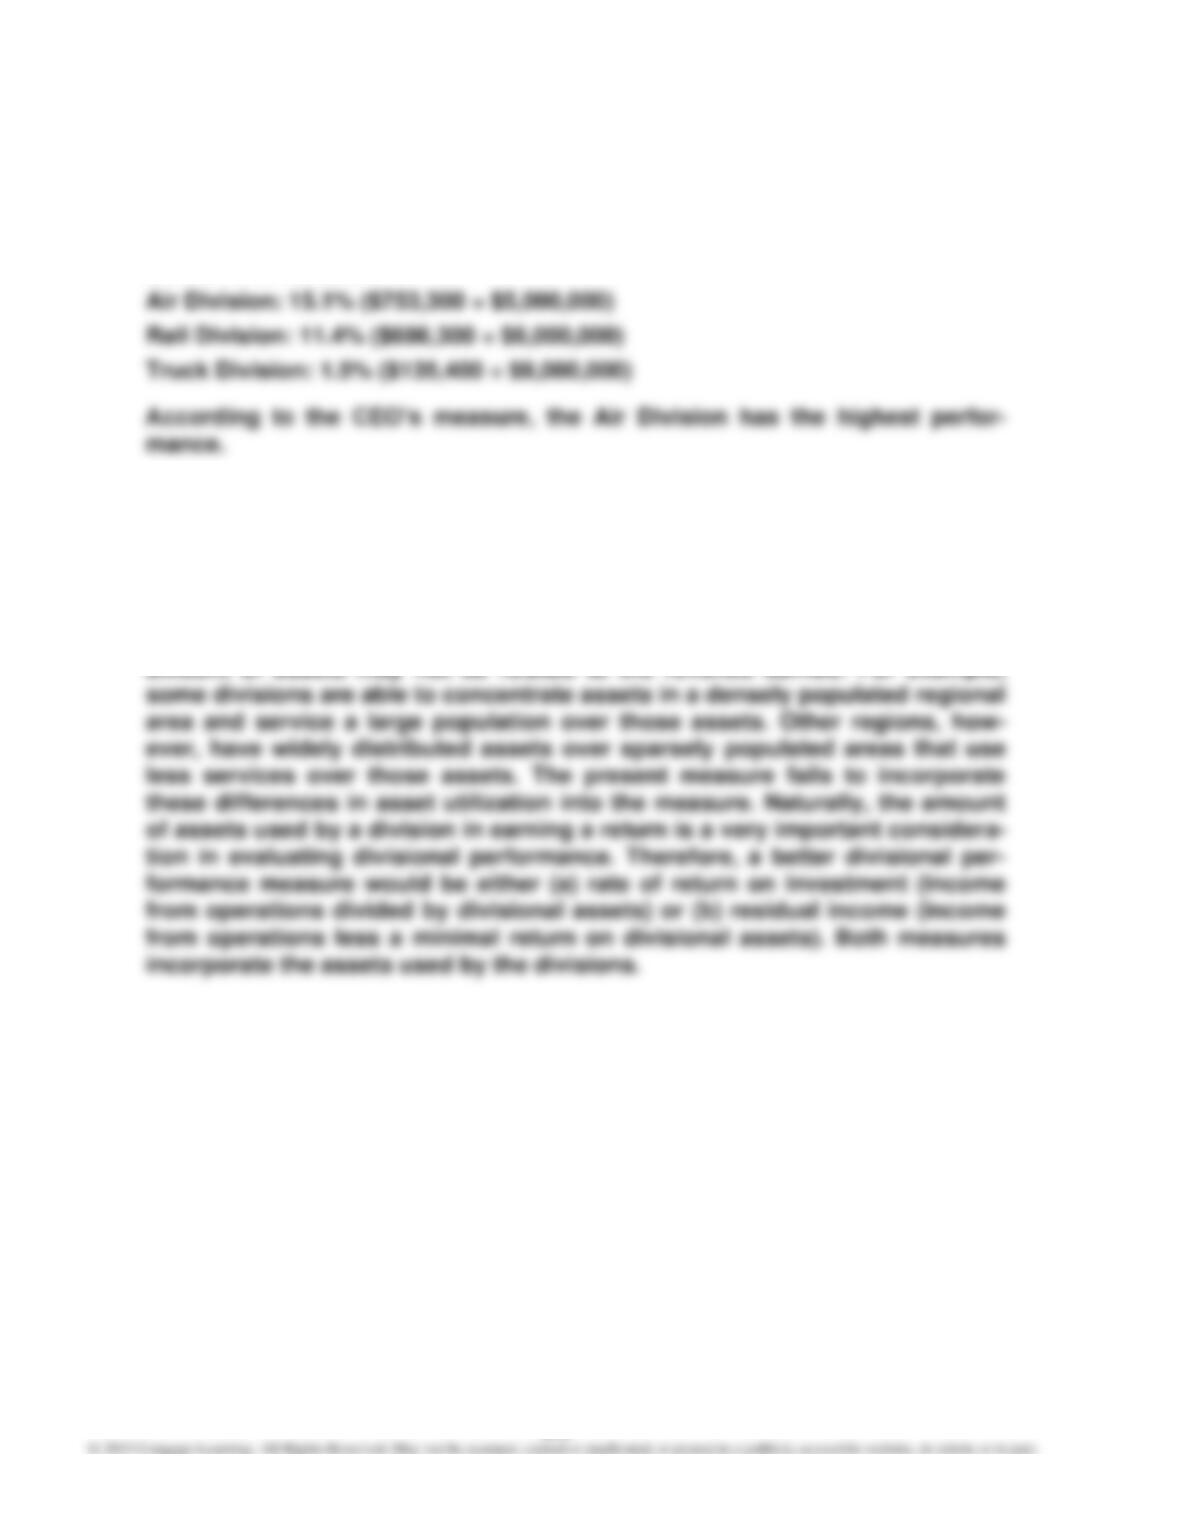
2. The CEO evaluates the three divisions using income from operations as a
percent of revenues (profit margin). This measure is calculated for the three
divisions as follows:
3. To: CEO
The method used to evaluate the performance of the divisions should be
reevaluated. The present method identifies the amount of income from opera-
tions per dollar of earned revenue. However, this company requires a signifi-
cant investment in fixed assets and distribution facilities. In addition, the
amount of assets may not be related to the revenue earned. For example,
475
P14–3
1.
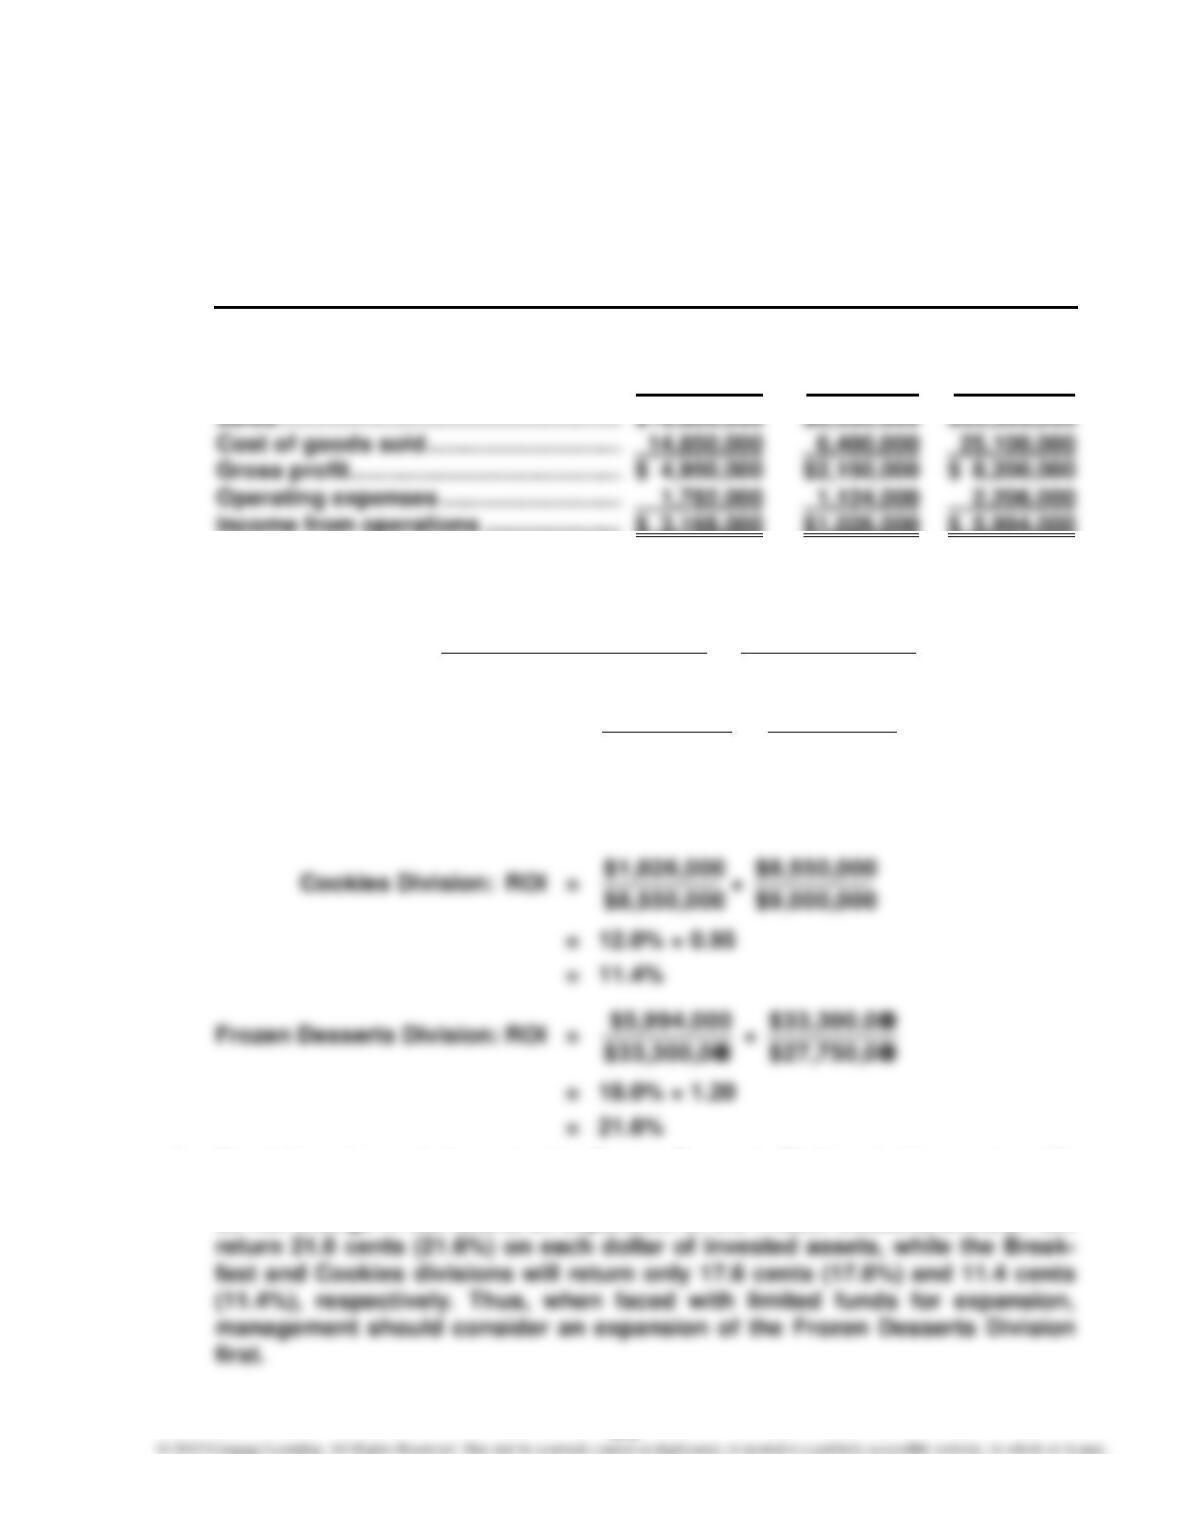
PASTRY INC.
Divisional Income Statements
For the Year Ended April 30, 20Y7
Frozen
Breakfast Cookies Desserts
Division Division Division
Income from operations ………………… $ 3,168,000 $1,026,000 $ 5,994,000
2.
Investment
on Return of Rate
= Profit Margin × Investment Turnover
Investment
on Return of Rate
=
Sales
Operations from Income
×
AssetsInvested
Sales
Breakfast Division: ROI =
0$19,800,00
$3,168,000
×
0$18,000,00
0$19,800,00
= 16.0% × 1.10
= 17.6%
0$33,300,00
$5,994,000
0$27,750,00
0$33,300,00
3. Per dollar of invested assets, the Frozen Desserts Division is the most profit-
able of the three divisions. Assuming that the rates of return on investments
do not change in the future, an expansion of the Frozen Desserts Division will
476
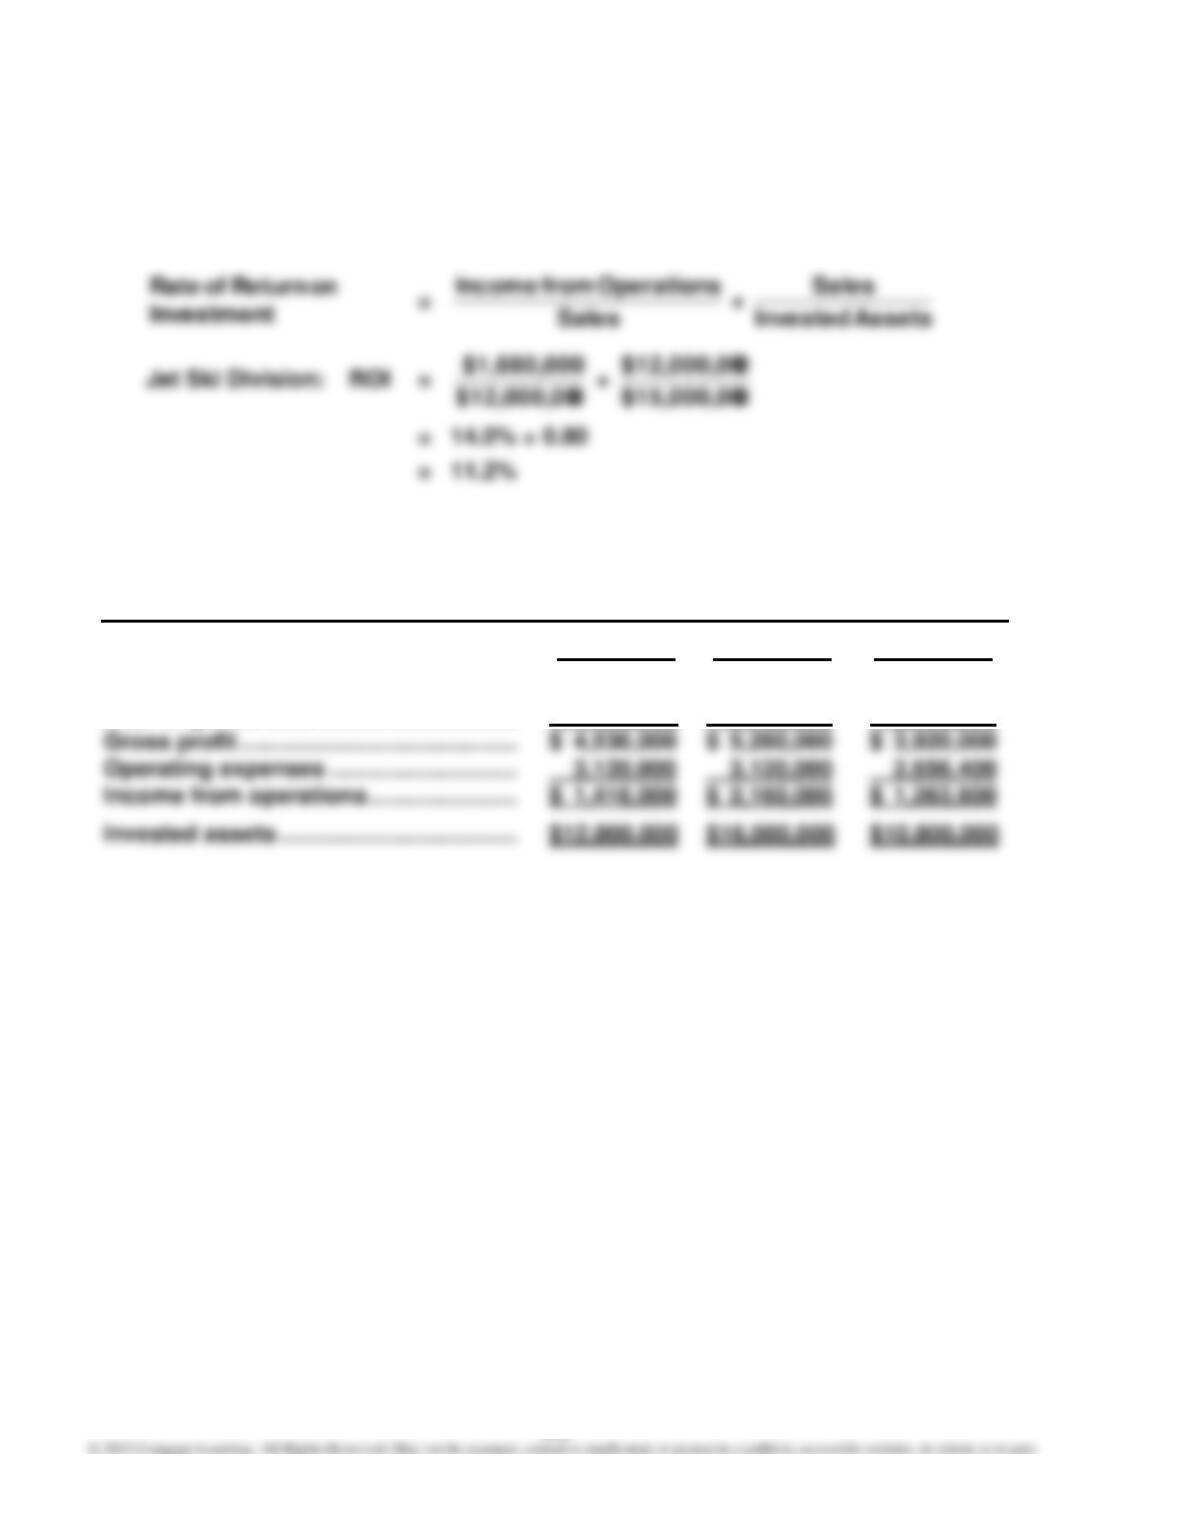
P14–4
1.
Investment
on Return of Rate
= Profit Margin × Investment Turnover
Investment
on Return of Rate
2.
AMAZING RIDES INC.—JET SKI DIVISION
Estimated Income Statements
For the Year Ended December 31, 20Y2
Proposal 1 Proposal 2 Proposal 3
Sales ……………………………………………… $12,000,000 $12,000,000 $ 9,720,000
Cost of goods sold …………………………. 7,464,000 6,720,000 5,800,000
477
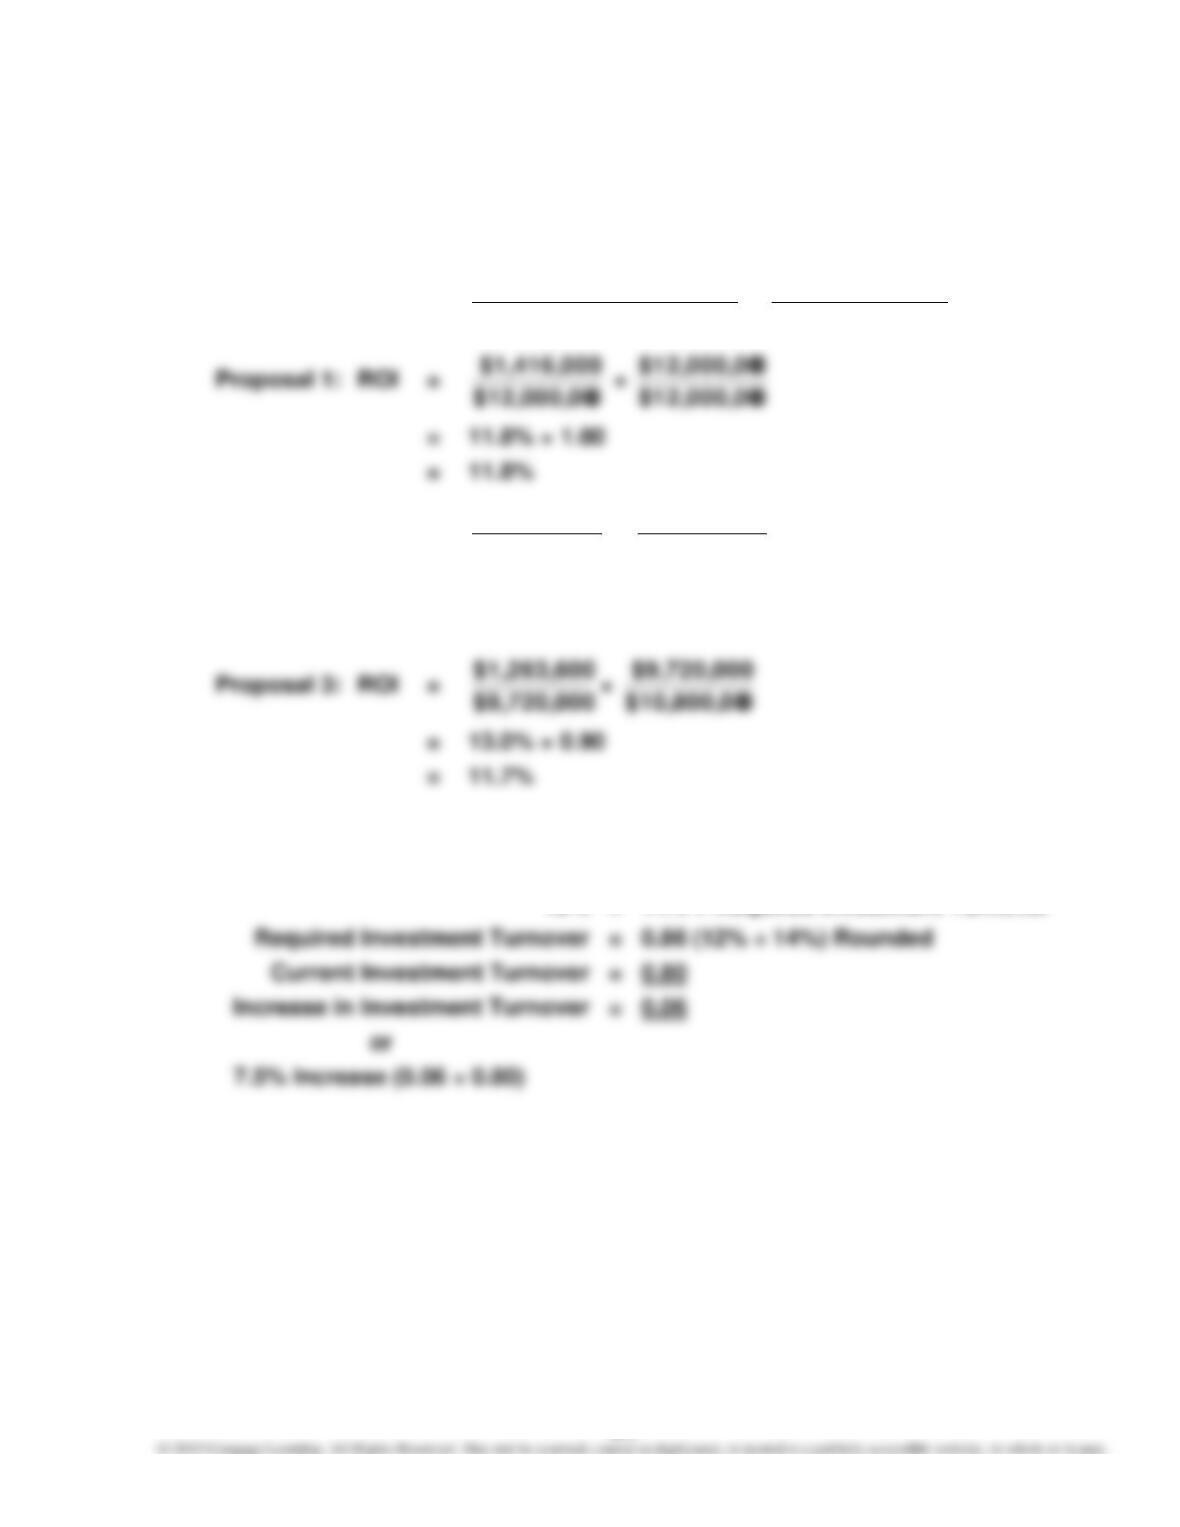
P14–4, Concluded
3.
Investment
on Return of Rate
= Profit Margin × Investment Turnover
Investment
on Return of Rate
=
Sales
Operations from Income
×
AssetsInvested
Sales
0$12,000,00
$1,416,000
0$12,000,00
0$12,000,00
Proposal 2: ROI =
0$12,000,00
$2,160,000
×
0$16,000,00
0$12,000,00
= 18.0% × 0.75
= 13.5%
0$10,800,00
$9,720,000
4. Proposal 2 would yield a rate of return on investment of 13.5%.
5. Rate of Return on Investment = Profit Margin × Required Investment Turnover
12% = 14% × Required Investment Turnover
478
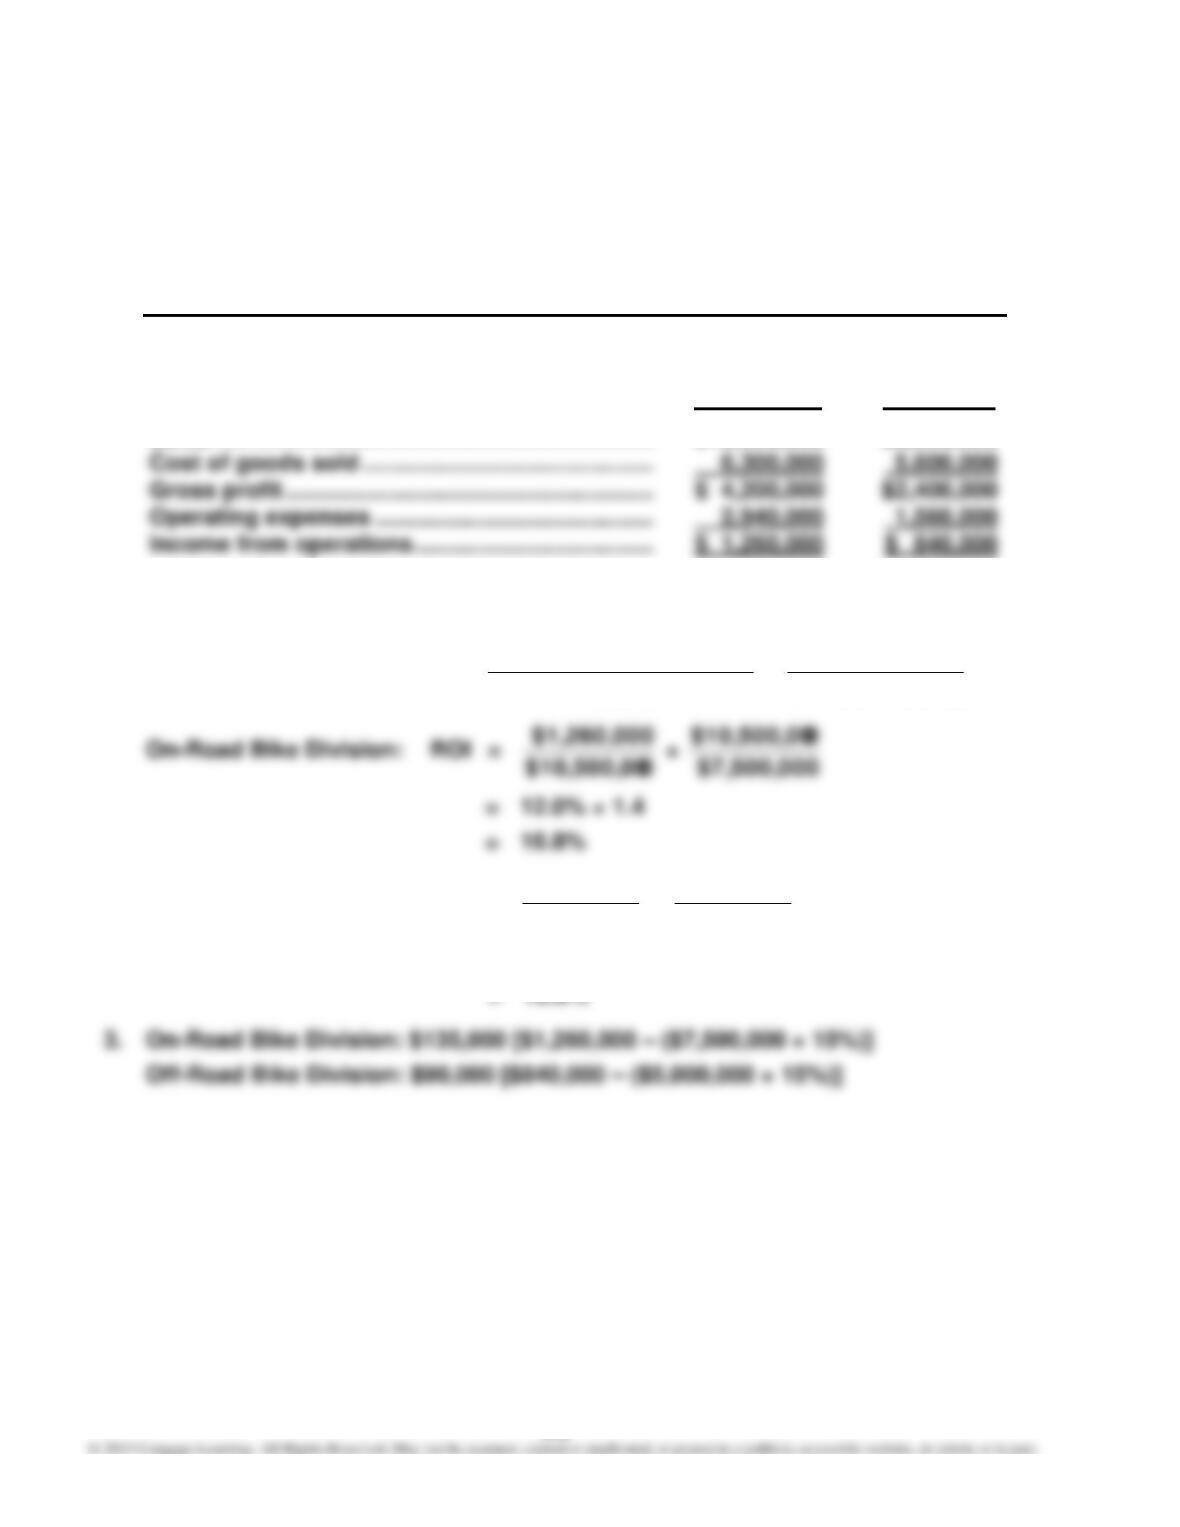
P14–5
1.
MONTANA BIKE COMPANY
Divisional Income Statements
For the Year Ended December 31, 20Y9
On-Road Off-Road
Bike Bike
Division Division
Sales ………………………………………………………….. $10,500,000 $8,000,000
2.
Investment
on Return of Rate
= Profit Margin × Investment Turnover
Investment
on Return of Rate
=
Sales
Operations from Income
×
AssetsInvested
Sales
Off-Road Bike Division: ROI =
$8,000,000
$840,000
×
$5,000,000
$8,000,000
= 10.5% × 1.6
P14–5, Concluded
4. On the basis of income from operations, the On-Road Bike Division generated
$420,000 ($1,260,000 – $840,000) more income from operations than did the
Off-Road Bike Division. However, income from operations does not consider
the amount of invested assets in each division.
480
P14–6
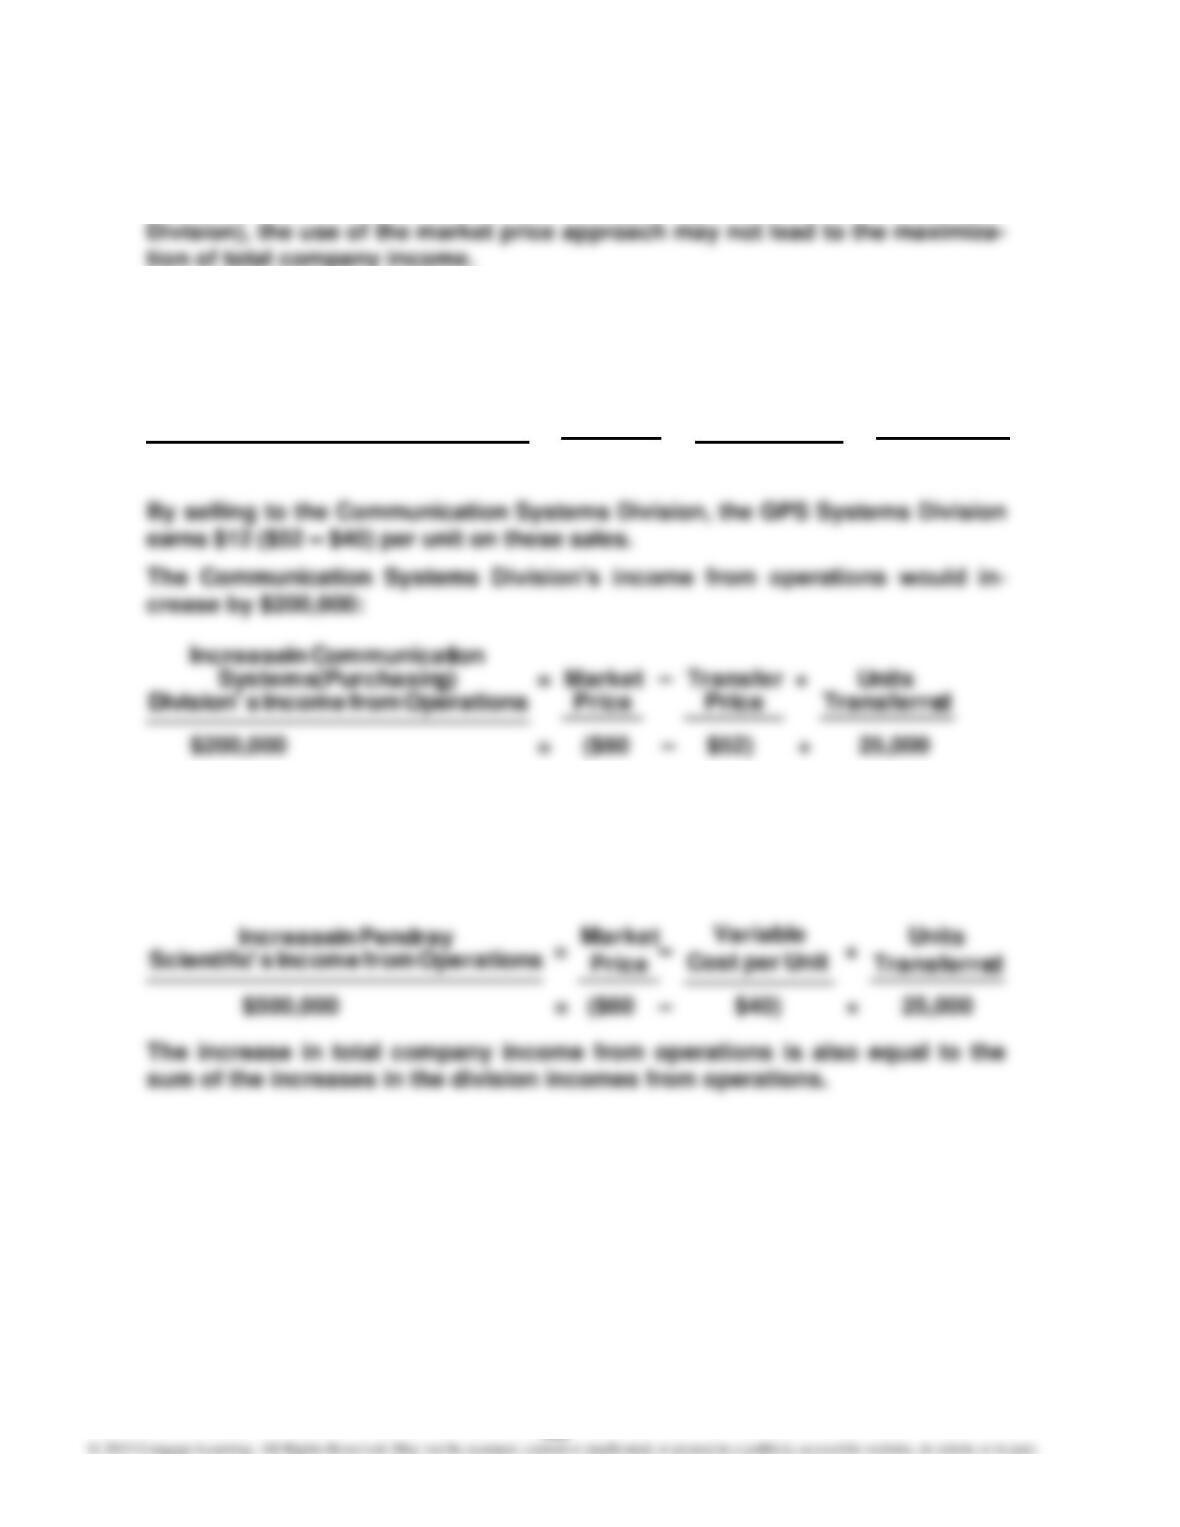
1. No. When unused capacity exists in the supplying division (the GPS Systems
2. The GPS Systems Division’s income from operations would increase by
$300,000:
Operations from Income sDivision‘
)(Supplying
Systems GPS in Increase
=
Price
Transfer
–
Unit per Cost
Variable
×
dTransferre
Units
$300,000 = ($52 – $40) × 25,000
Operations from Income sDivision‘
Price
Transfer
dTransferre
Units
By purchasing from the GPS Systems Division, the Communication Systems
Division saves $8 ($60 – $52) per unit on its purchases.
Pendray Scientific Inc.’s total income from operations would increase by
$500,000:
481
P14–6, Continued
3.
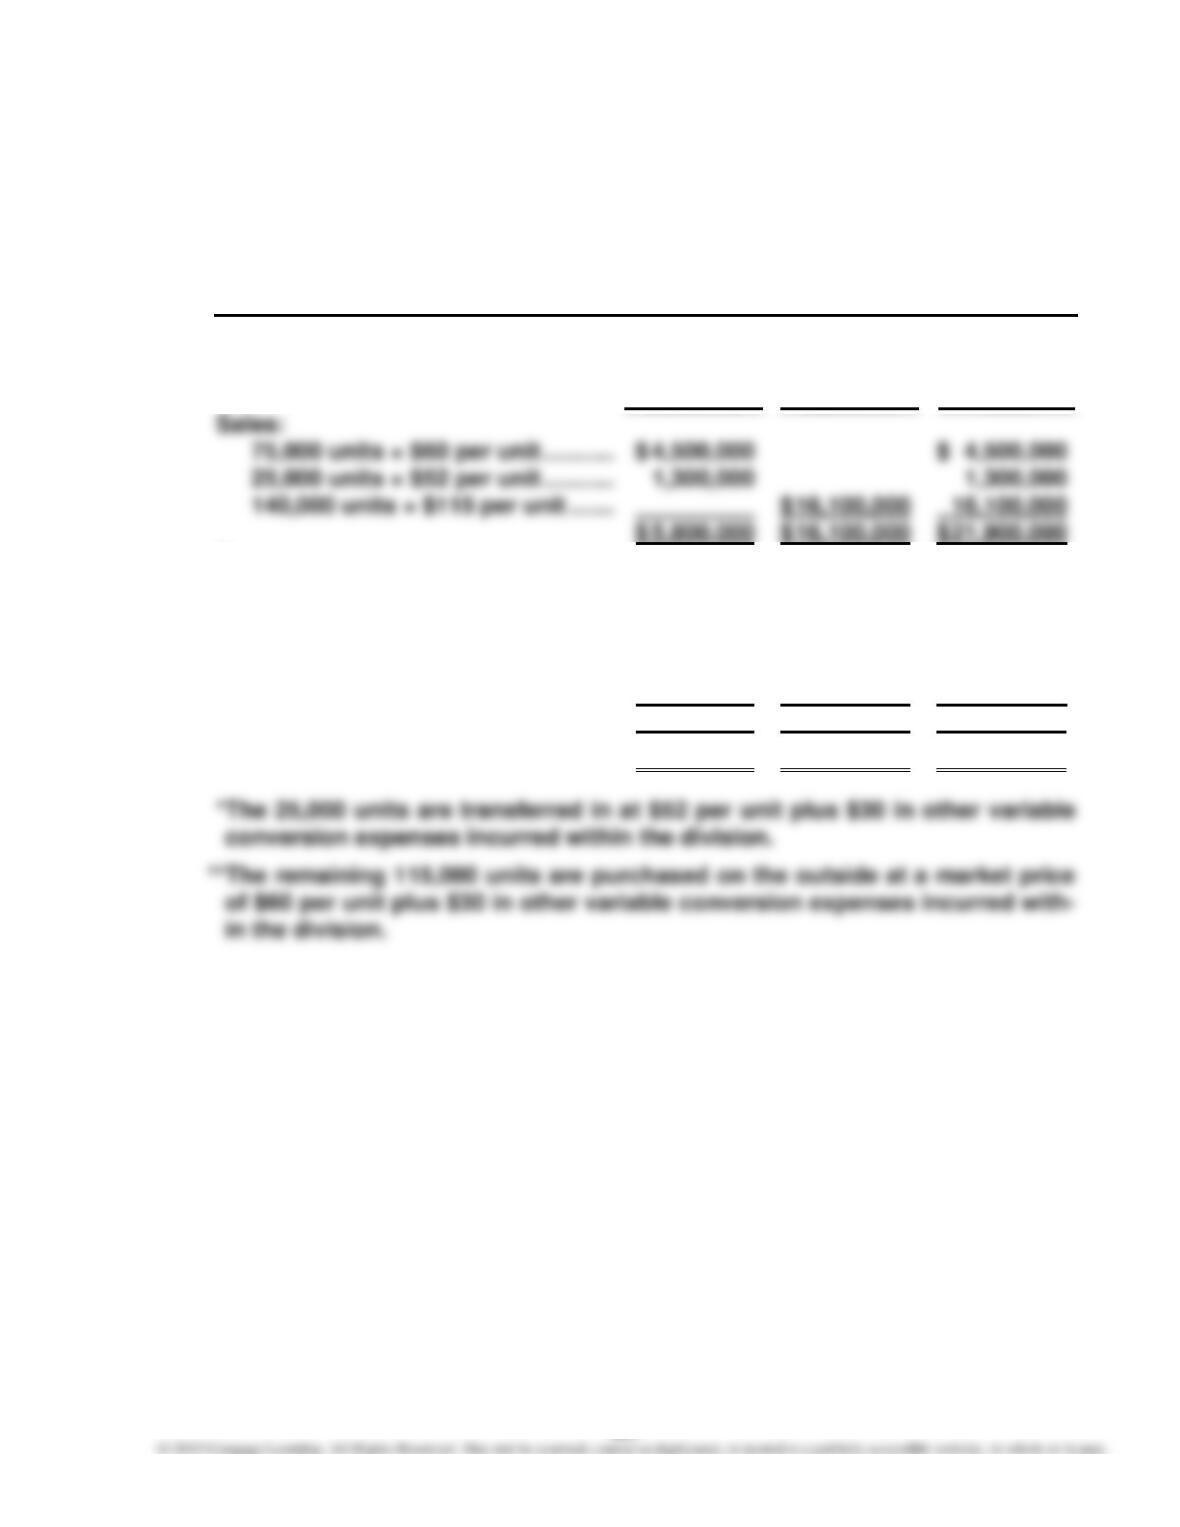
PENDRAY SCIENTIFIC INC.
Divisional Income Statements
For the Year Ended December 31, 20Y5
GPS Communication
Systems Systems Total
Expenses:
Variable:
100,000 units × $40 per unit ….. $ 4,000,000 $ 4,000,000
25,000 units × $82* per unit …… $ 2,050,000 2,050,000
115,000 units × $90** per unit .. 10,350,000 10,350,000
Fixed ………………………………………. 250,000 500,000 750,000
Total expenses …………………….. $ 4,250,000 $ 12,900,000 $ 17,150,000
Income from operations ……………….. $ 1,550,000 $ 3,200,000 $ 4,750,000
482
P14–6, Concluded
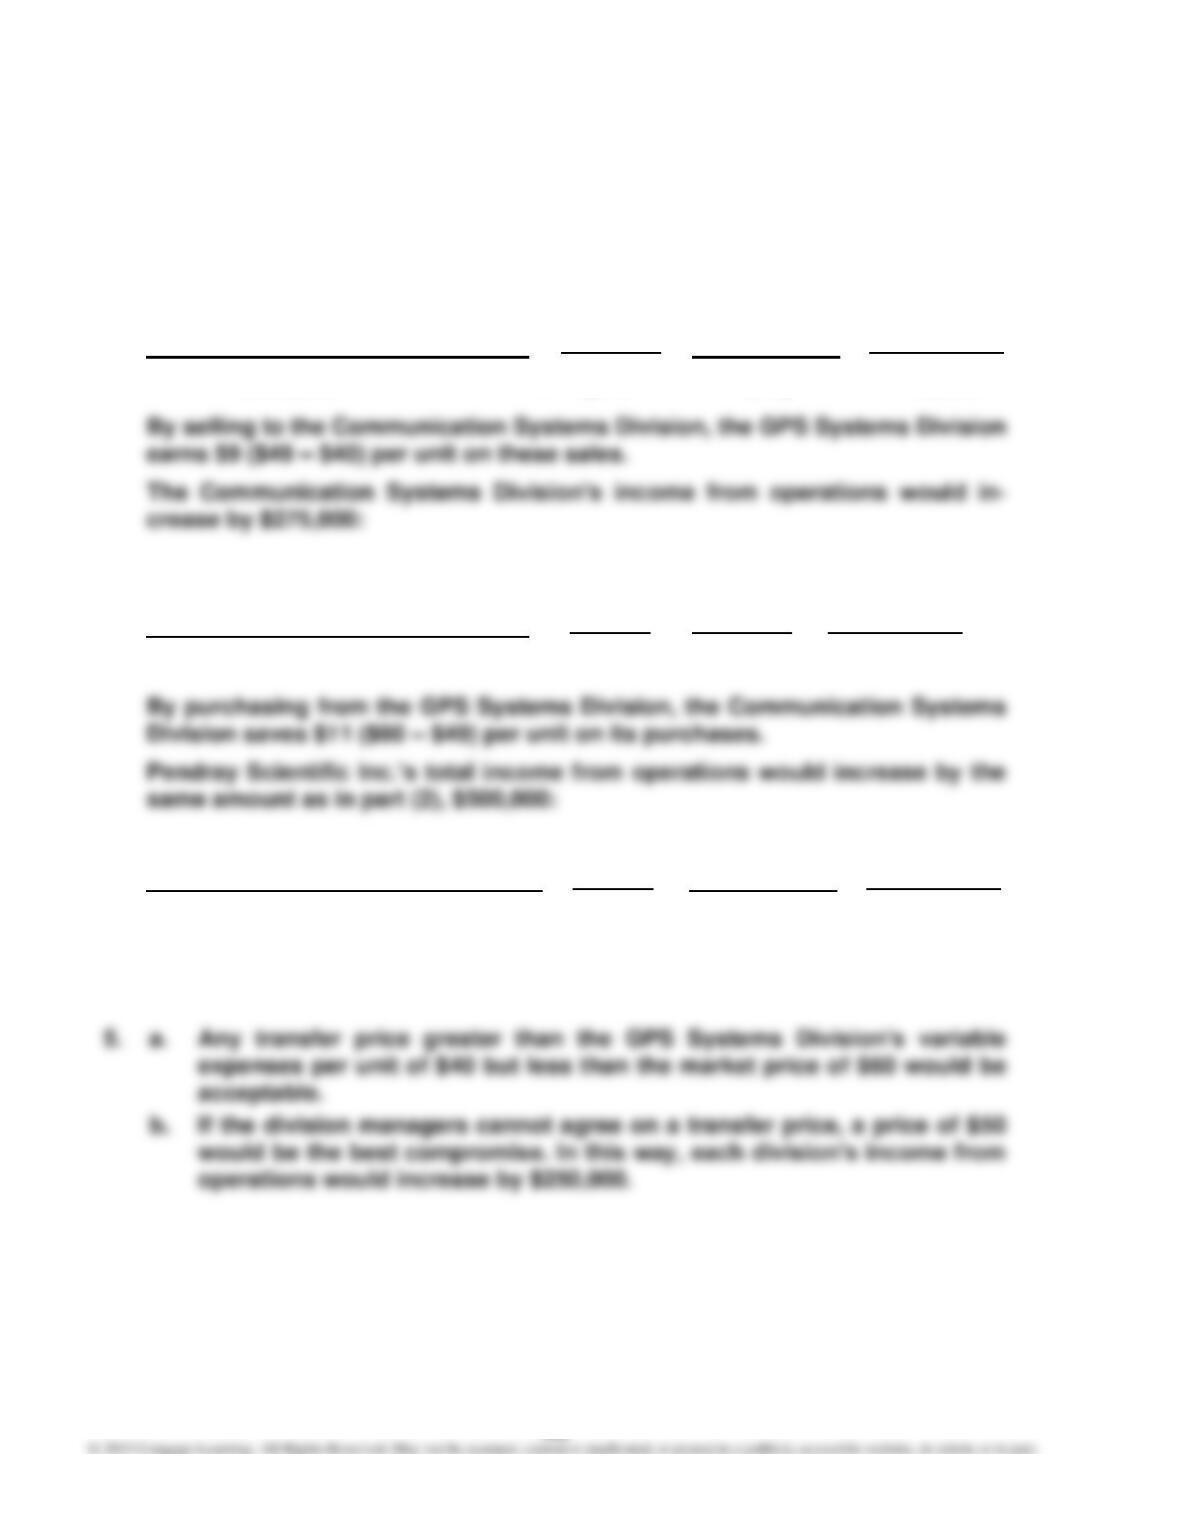
4. The GPS Systems Division’s income from operations would increase by
$225,000:
Operations from Income sDivision’
)(Supplying
Systems GPS in Increase
=
Price
Transfer
–
Unit per Cost
Variable
×
dTransferre
Units
$225,000 = ($49 – $40) × 25,000
Operations from Income sDivision’
g)(Purchasin Systems
ionCommunicat in Increase
=
Price
Market
–
Price
Transfer
×
dTransferre
Units
$275,000 = ($60 – $49) × 25,000
Operations from Income s‘Scientific
Pendray in Increase
=
Price
Market
–
Unit per Cost
Variable
×
dTransferre
Units
$500,000 = ($60 – $40) × 25,000
The increase in total company income from operations is also equal to the
sum of the increases in the division incomes from operations.
483
CASES
Case 14–1
This scenario is a negotiation between two divisions. Newt is not behaving unethically
by attempting to get a good price from the Optic Lens Division. Also, he is not behav-
ing unethically because he refuses market price. This may not seem “fair,” but price
negotiation is a very typical business activity and is part of Newt’s job. It would be un–
Case 14–2
The department head is responsible for the quantity of service, but not the source of
the service (i.e., not the price). Most accountants would hold the department head re–
sponsible for the cost by transferring the cost of the brochures to the Customer Ser–
vice Department, even though the price is 15% higher than could be obtained from the
outside. This may not seem fair, but it does control the use of internal services to
some degree. If there were no internal transfer price, departments would view the Pub–
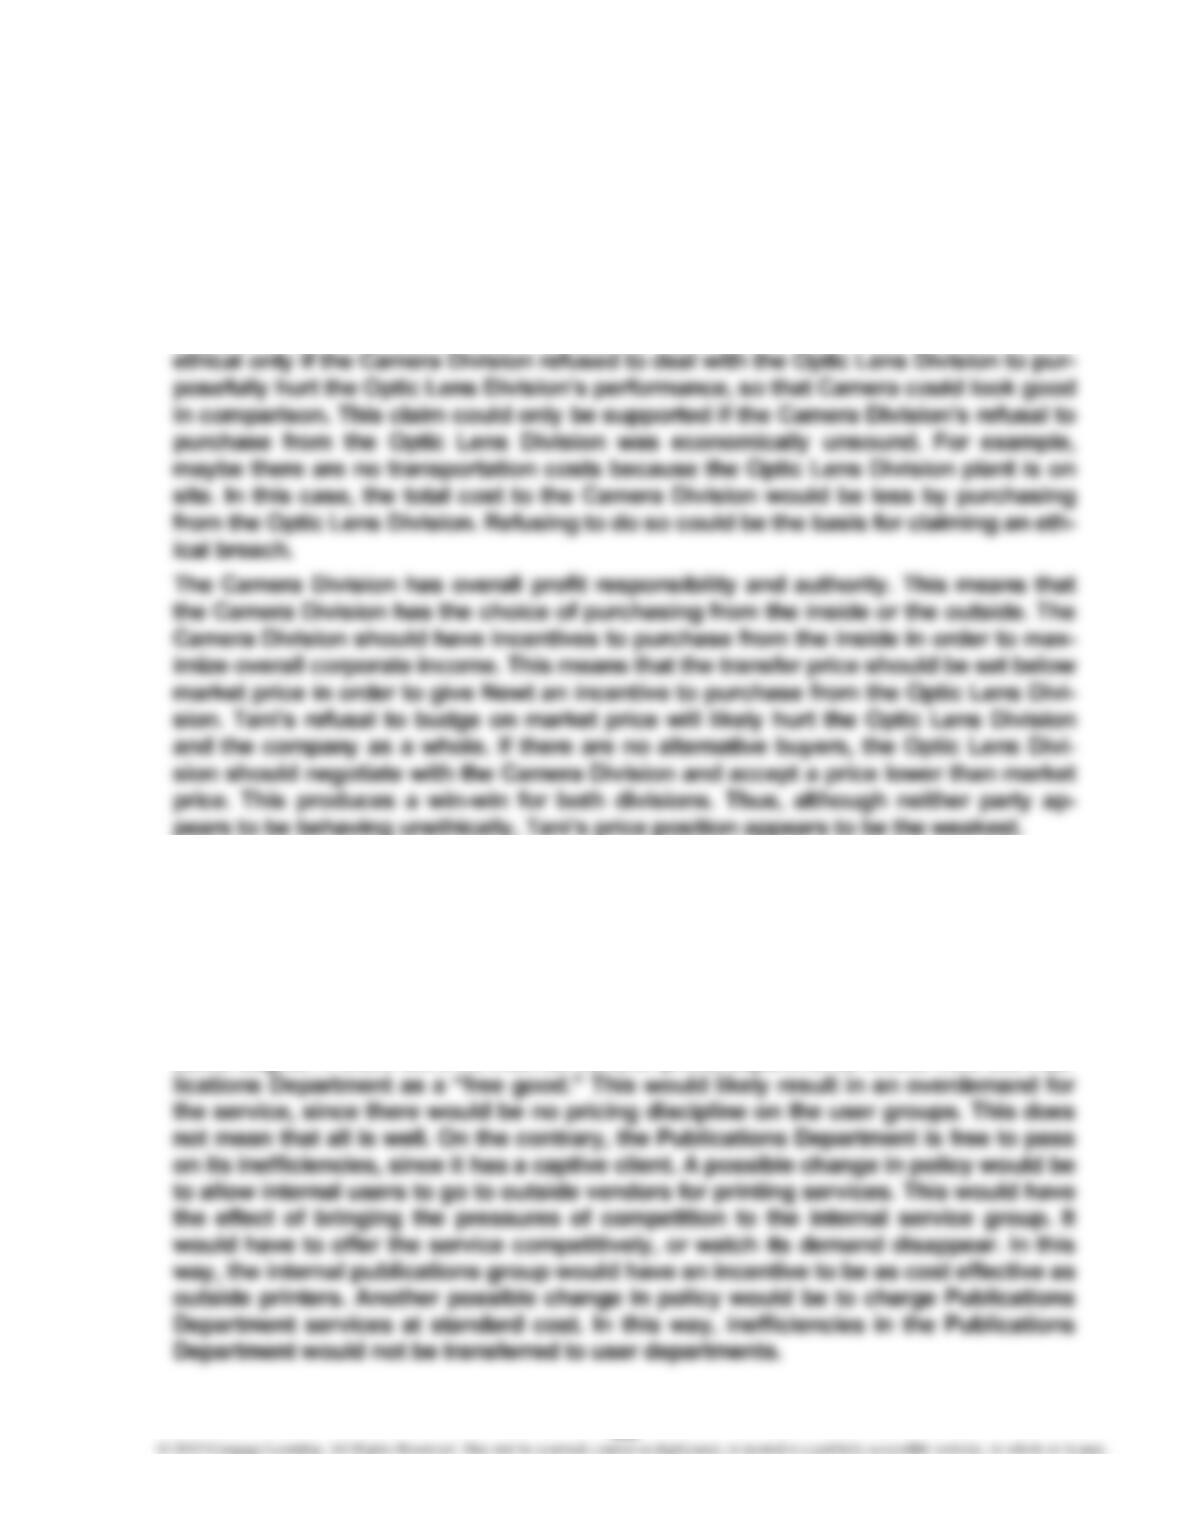
Case 14–3
1. The rate of return on invested assets is computed as follows:
Cereal Produce Snacks
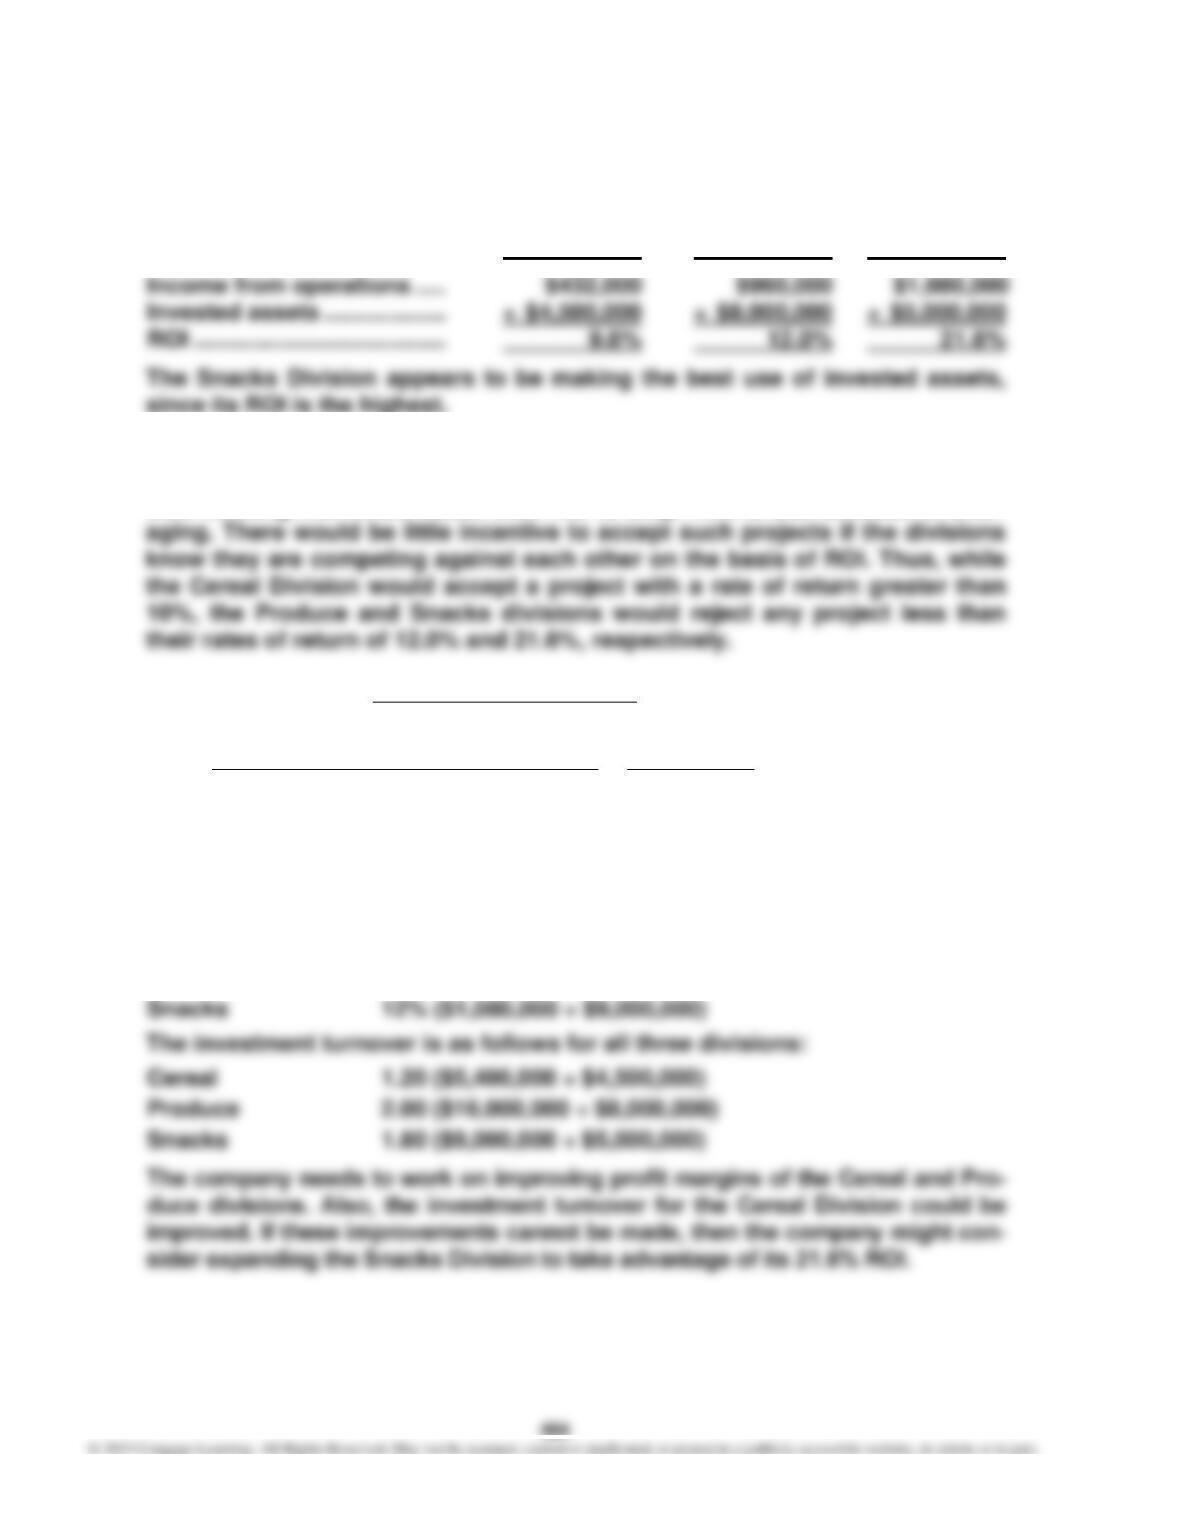
2. Not all projects that have greater than a 10% rate of return would be accepted.
This is because any project that is accepted between the 10% minimum and
their existing ROI would cause their ROI to drop. This is true because of aver-
3.
Investment
on Return of Rate
=
AssetsInvested
Operations from Income
=
000,000,5$ + 000,000,8$ + 000,500,4$
000,080,1$ + 000,960$ + 000,432$
=
000,500,17$
000,472,2$
= 14.1%
4. There are two approaches to improving Dixie Foods’ overall rate of return of
14.1%: (1) improving the profit margin or (2) improving the investment turno-
ver. The profit margin for all three divisions is as follows:
Cereal 8% ($432,000 ÷ $5,400,000)
Produce 6% ($960,000 ÷ $16,000,000)
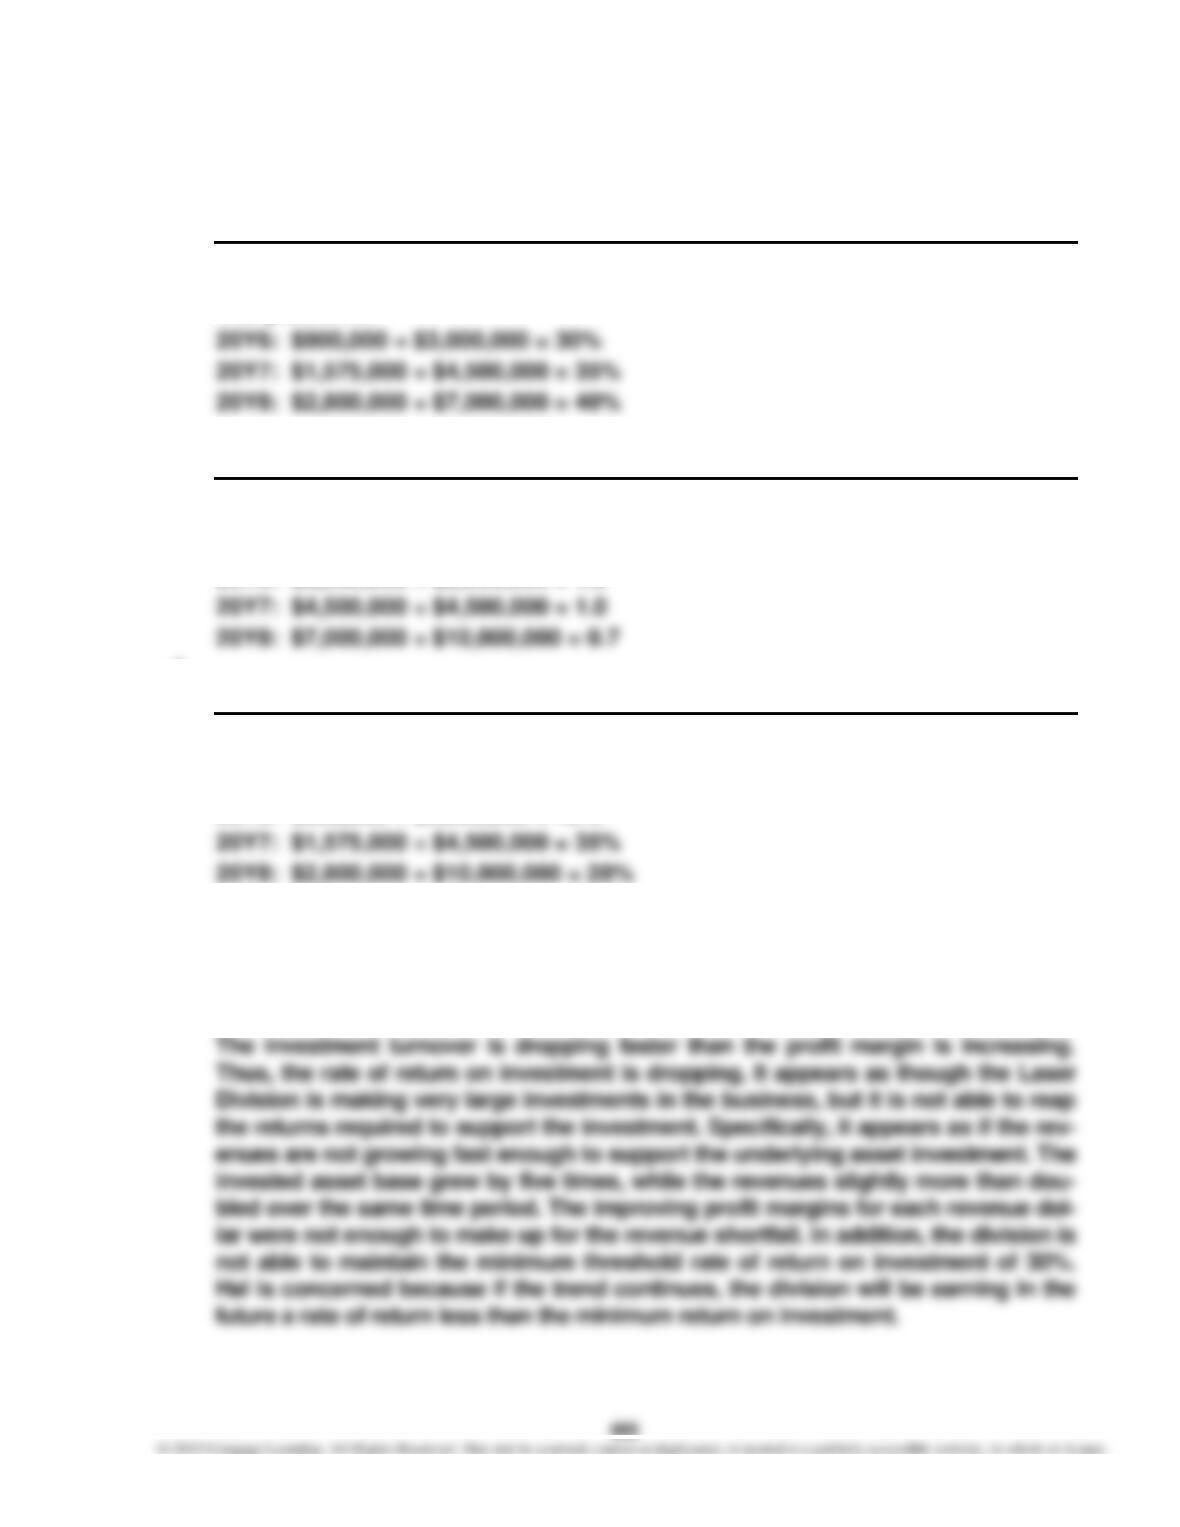
Case 14–4
1.
20Y6 20Y7 20Y8
Profit margin …………………………………….. 30% 35% 40%
Computations:
2.
20Y6 20Y7 20Y8
Investment turnover ………………………….. 1.5 1.0 0.7
Computations:
20Y6: $3,000,000 ÷ $2,000,000 = 1.5
3.
20Y6 20Y7 20Y8
Rate of return on investment …………….. 45% 35% 28%
Computations:
20Y6: $900,000 ÷ $2,000,000 = 45%
4. Hal is concerned about the Laser Division because the return on investment ap–
pears to be deteriorating over the 20Y6–20Y8 operating periods. This is happening
even though the profit margin is increasing over this time period. In order for this to
occur, the investment turnover must be dropping, which is the case in part (2).
486
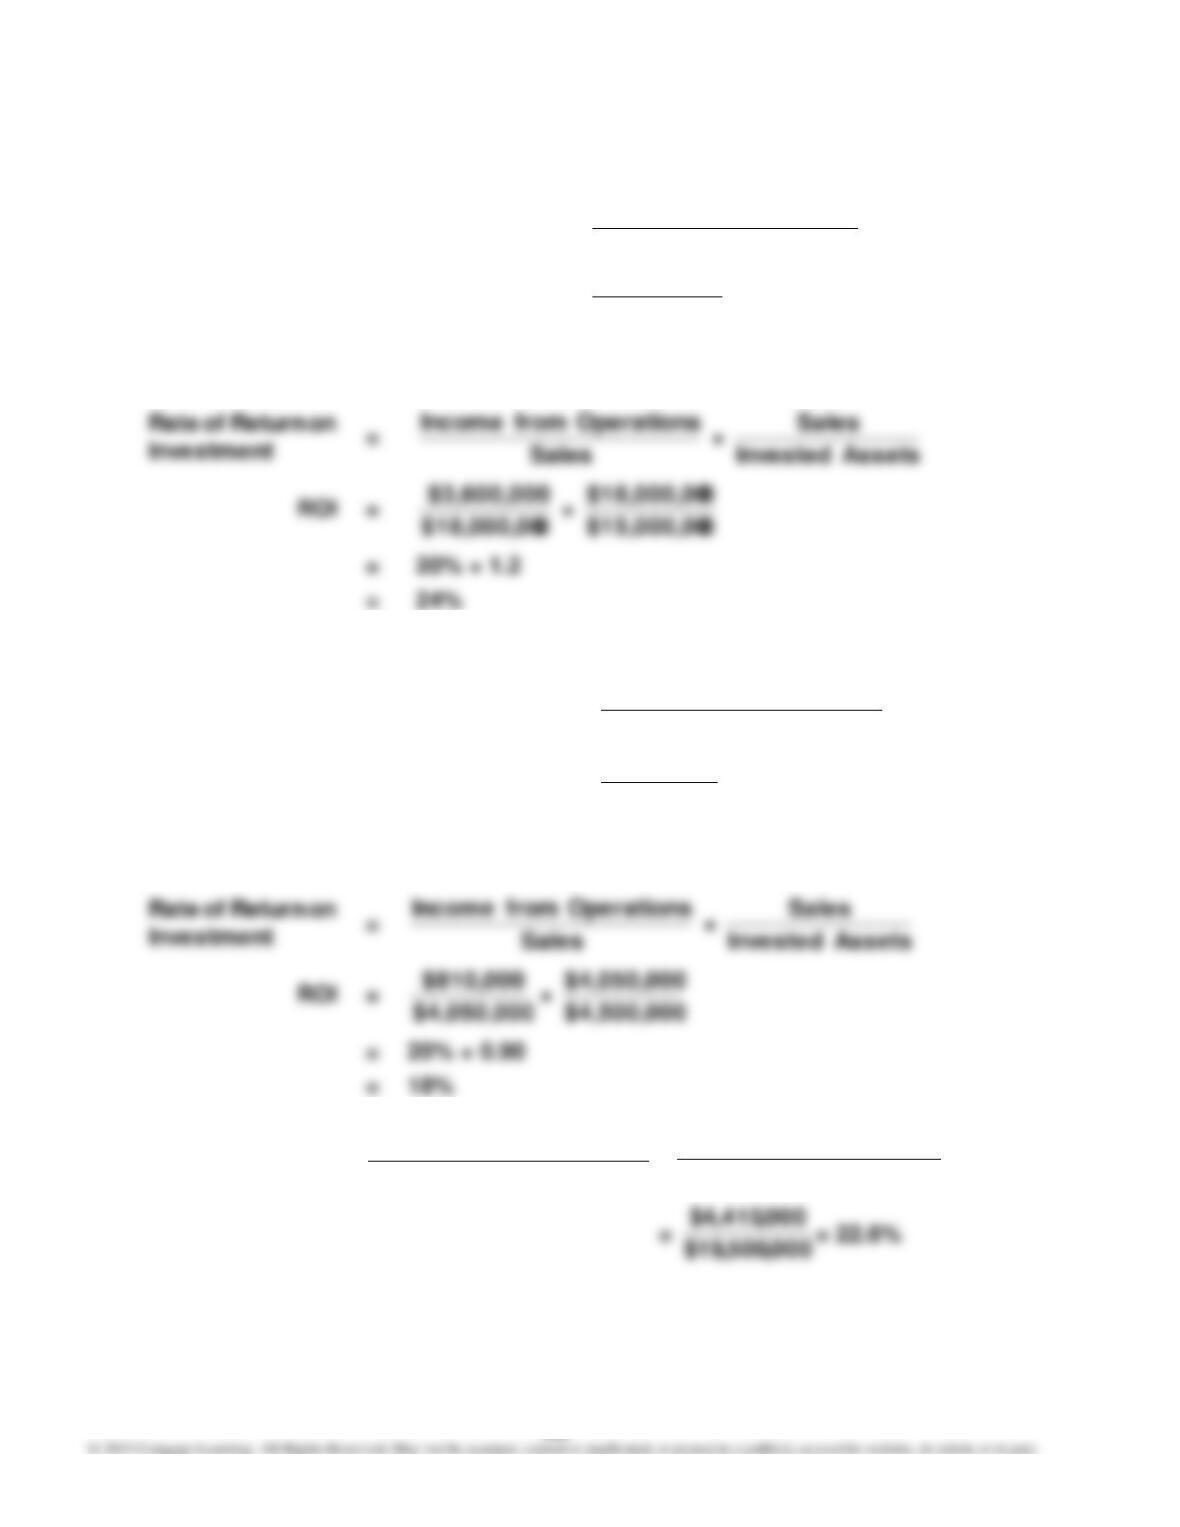
Case 14–5
1. Rate of Return on Investment =
AssetsInvested
Operations from Income
ROI =
0$15,000,00
$3,600,000
= 24%
or
0$18,000,00
$3,600,000
0$15,000,00
2. $100,000 (10 × $10,000 = $100,000, where 10 = 24% – 14%)
3. Rate of Return on Investment =
Assets Invested
Operations from Income
ROI =
$4,500,000
$810,000
= 18%
or
$4,050,000
$810,000
4.
Investment
on Return of Rate
=
Assets Invested
Operations from Income
=
000,500,4$ + 000,000,15$
000,810$ + 000,600,3$
487
Case 14–5, Concluded
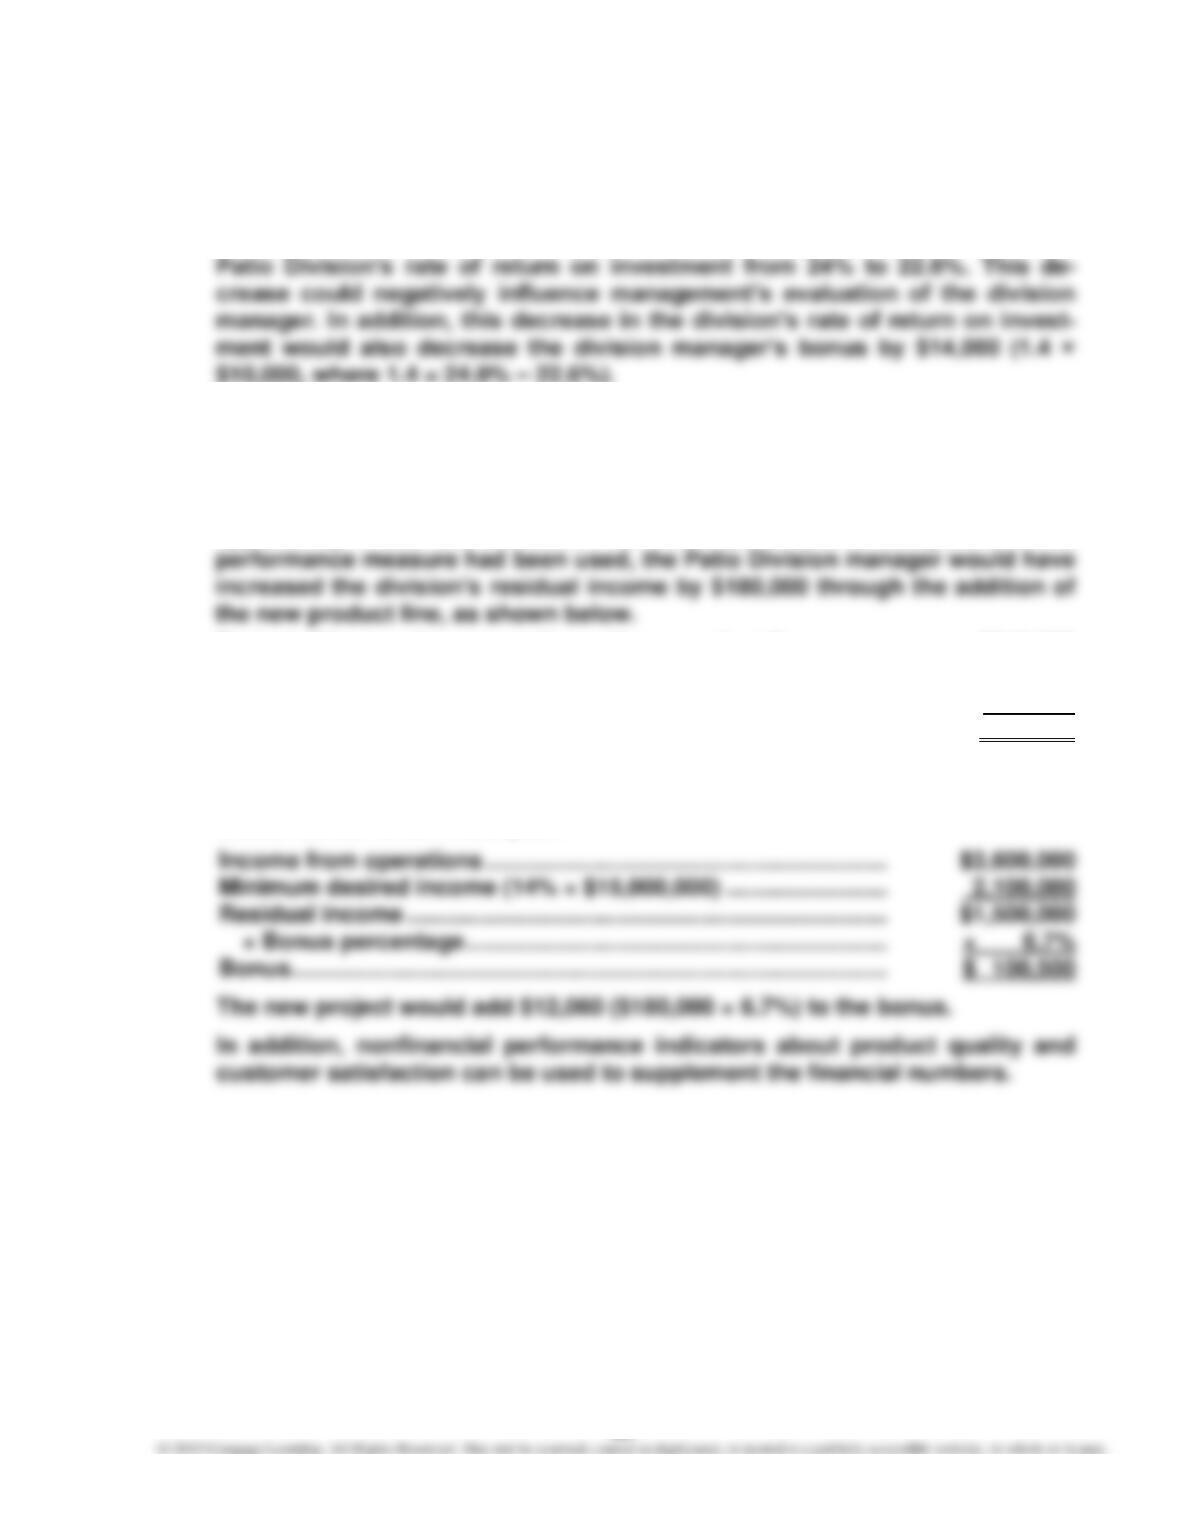
5. Even though the addition of the new product line would increase the overall
company rate of return on investment, its addition would decrease the
6. Use of residual income as a performance measure and as the basis for grant-
ing bonuses would motivate division managers to accept investment oppor-
tunities that exceed a minimum rate of return. If the minimum rate of return
was set at 14%, the overall company average rate of return, any investment
opportunity whose rate exceeded 14% would be viewed as acceptable. If this
Projected income from operations of new product line ……….. $810,000
Minimum amount of desired income from operations
($4,500,000 × 14%) ………………………………………………………… 630,000
Residual income from new product line ……………………………… $180,000
The manager’s bonus could then be calculated as a percent of residual in-
come. In this case, a bonus equal to 6.7% of residual income would achieve a
bonus similar to the initial plan:
488
Case 14–6
This activity is designed to introduce students to two very popular divisional
performance measurement approaches, the balanced scorecard and economic
value added (EVA). Both methods are getting very strong support in corporate
America. The two consulting firms’ home pages provided in this activity have
financial measure that is strongly oriented to maximizing wealth to the share-
holder. Hopefully, the students will recognize EVA as a specific application of the
residual income concept. EVA’s strength is in its simplicity and its apparent
association with wealth maximization (share values). It is interesting to note that
the two methods flow from two different philosophies. The balanced scorecard
takes a multiple stakeholder perspective, while EVA is taking a stockholder