14-60
Required:
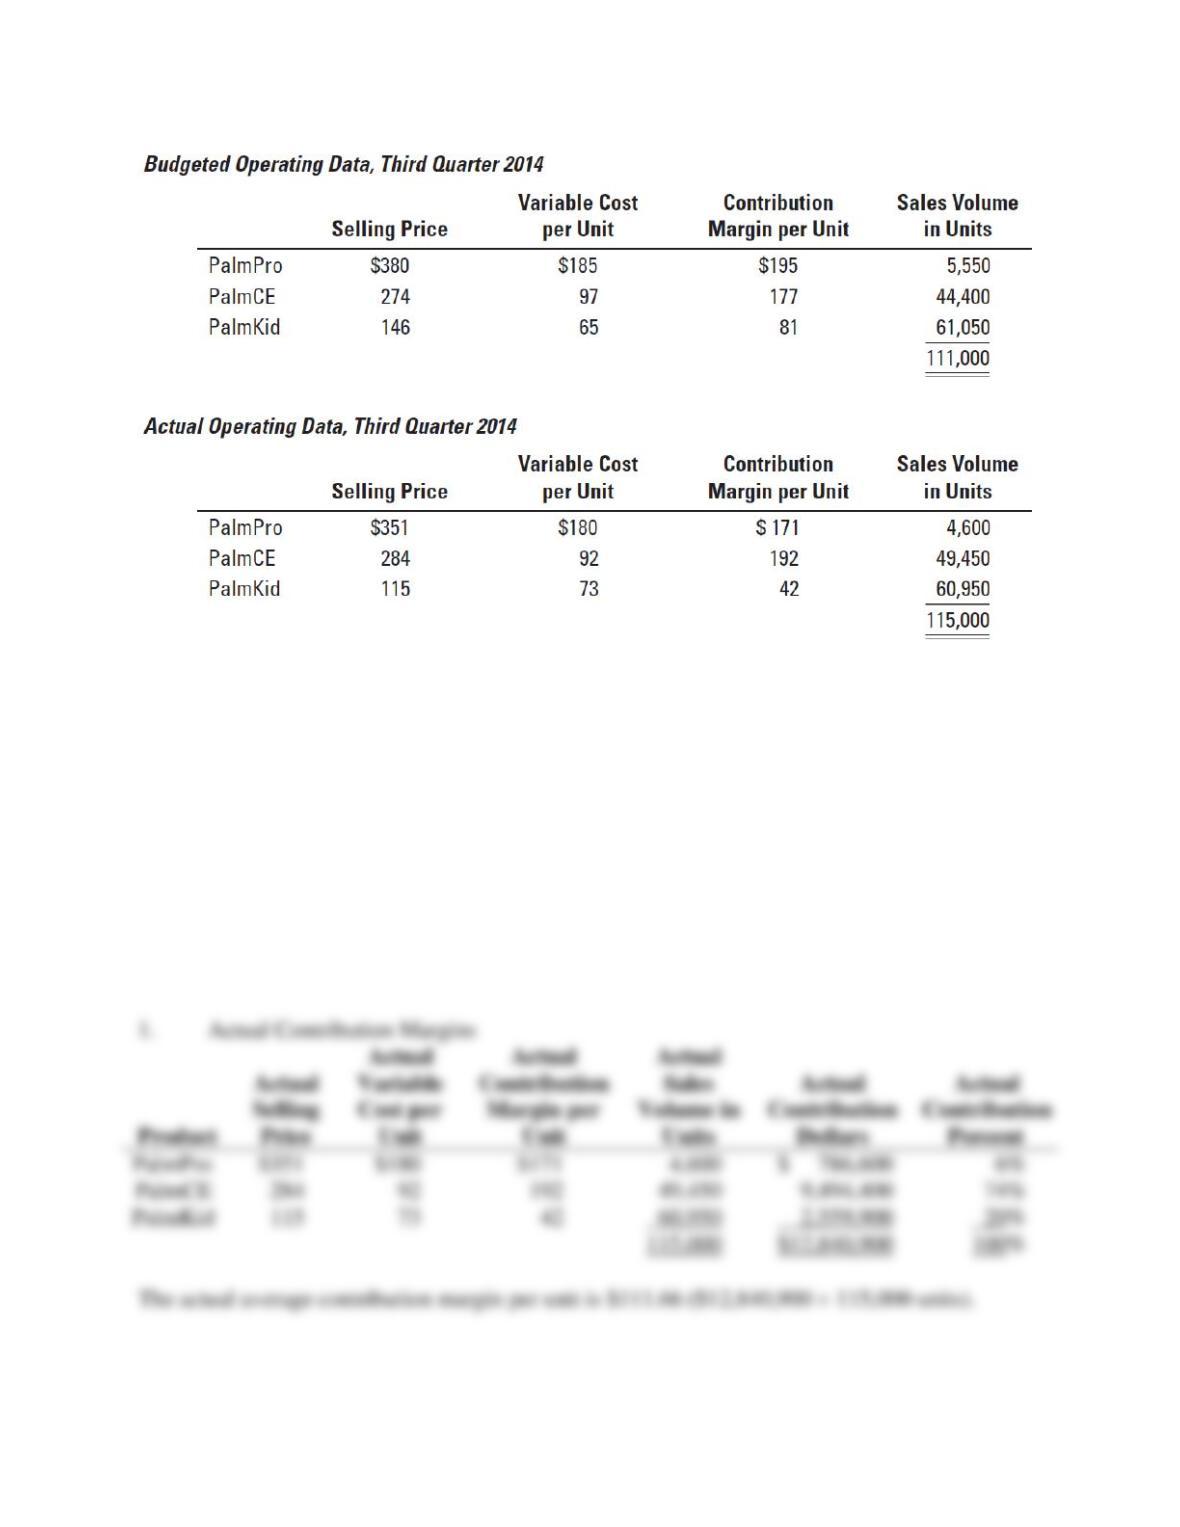
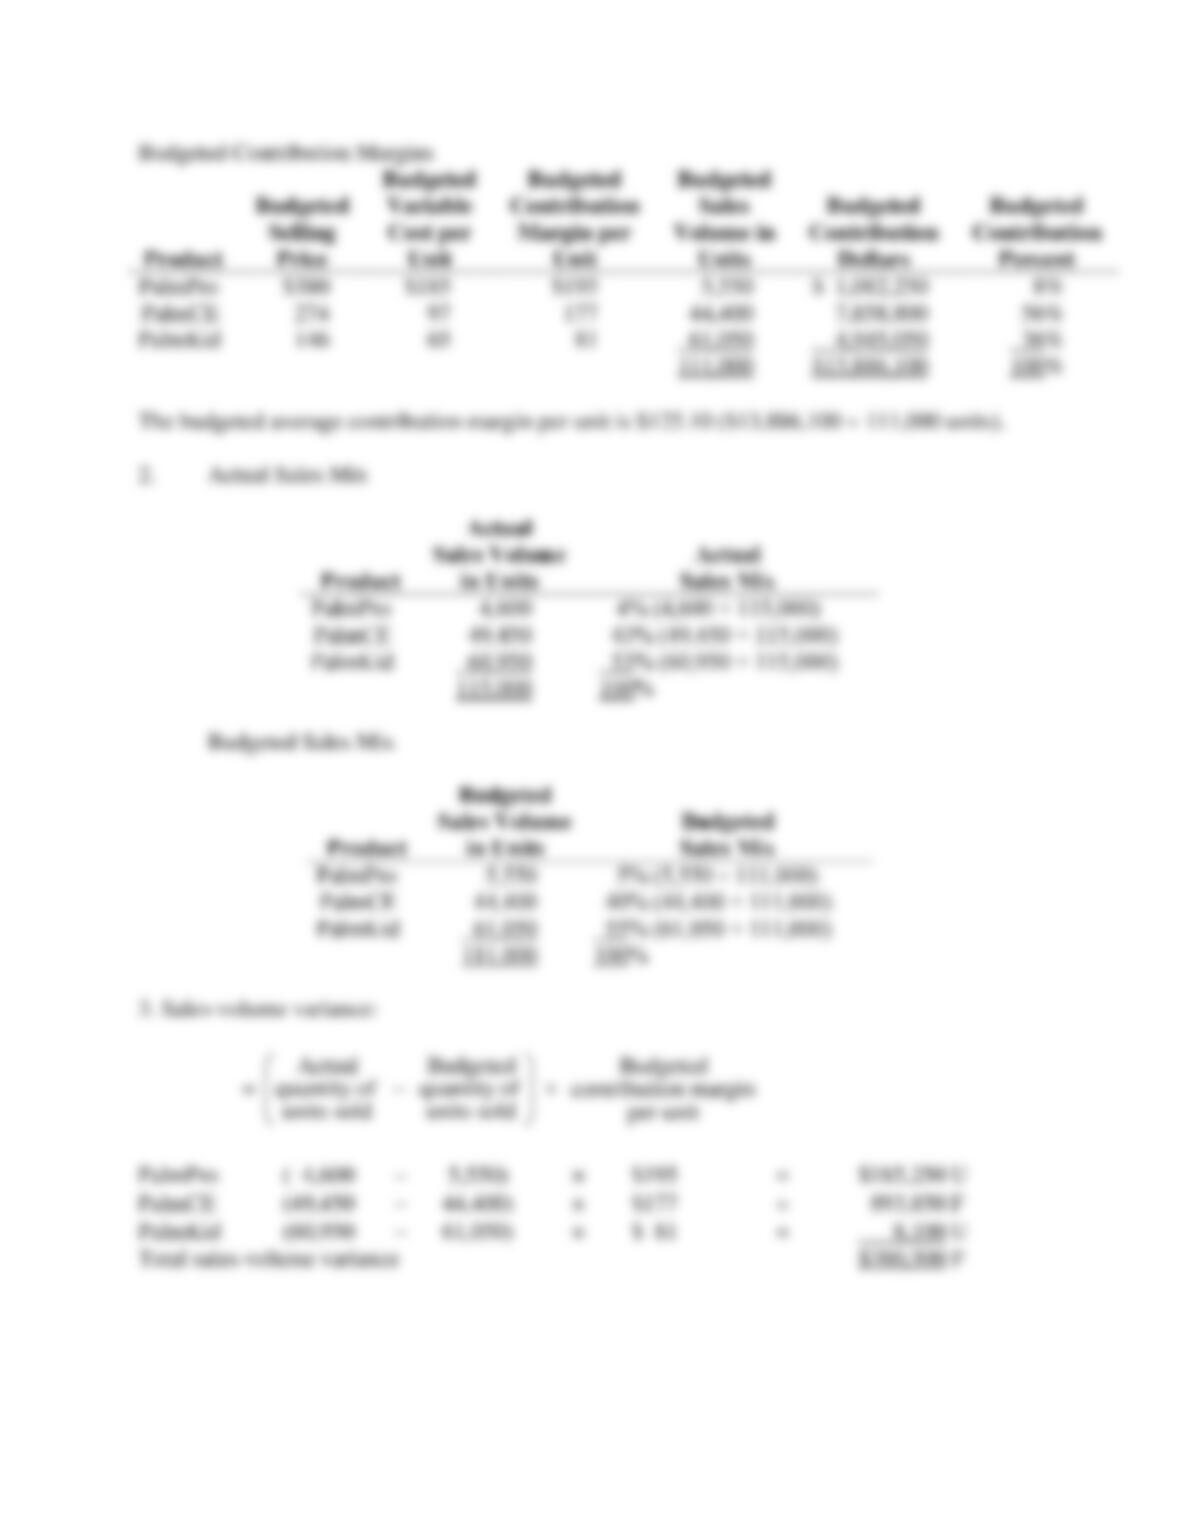
1. Compute the actual and budgeted contribution margins in dollars for each product and in
total for the third quarter of 2014.
2. Calculate the actual and budgeted sales mixes for the three products for the third quarter of
2014.
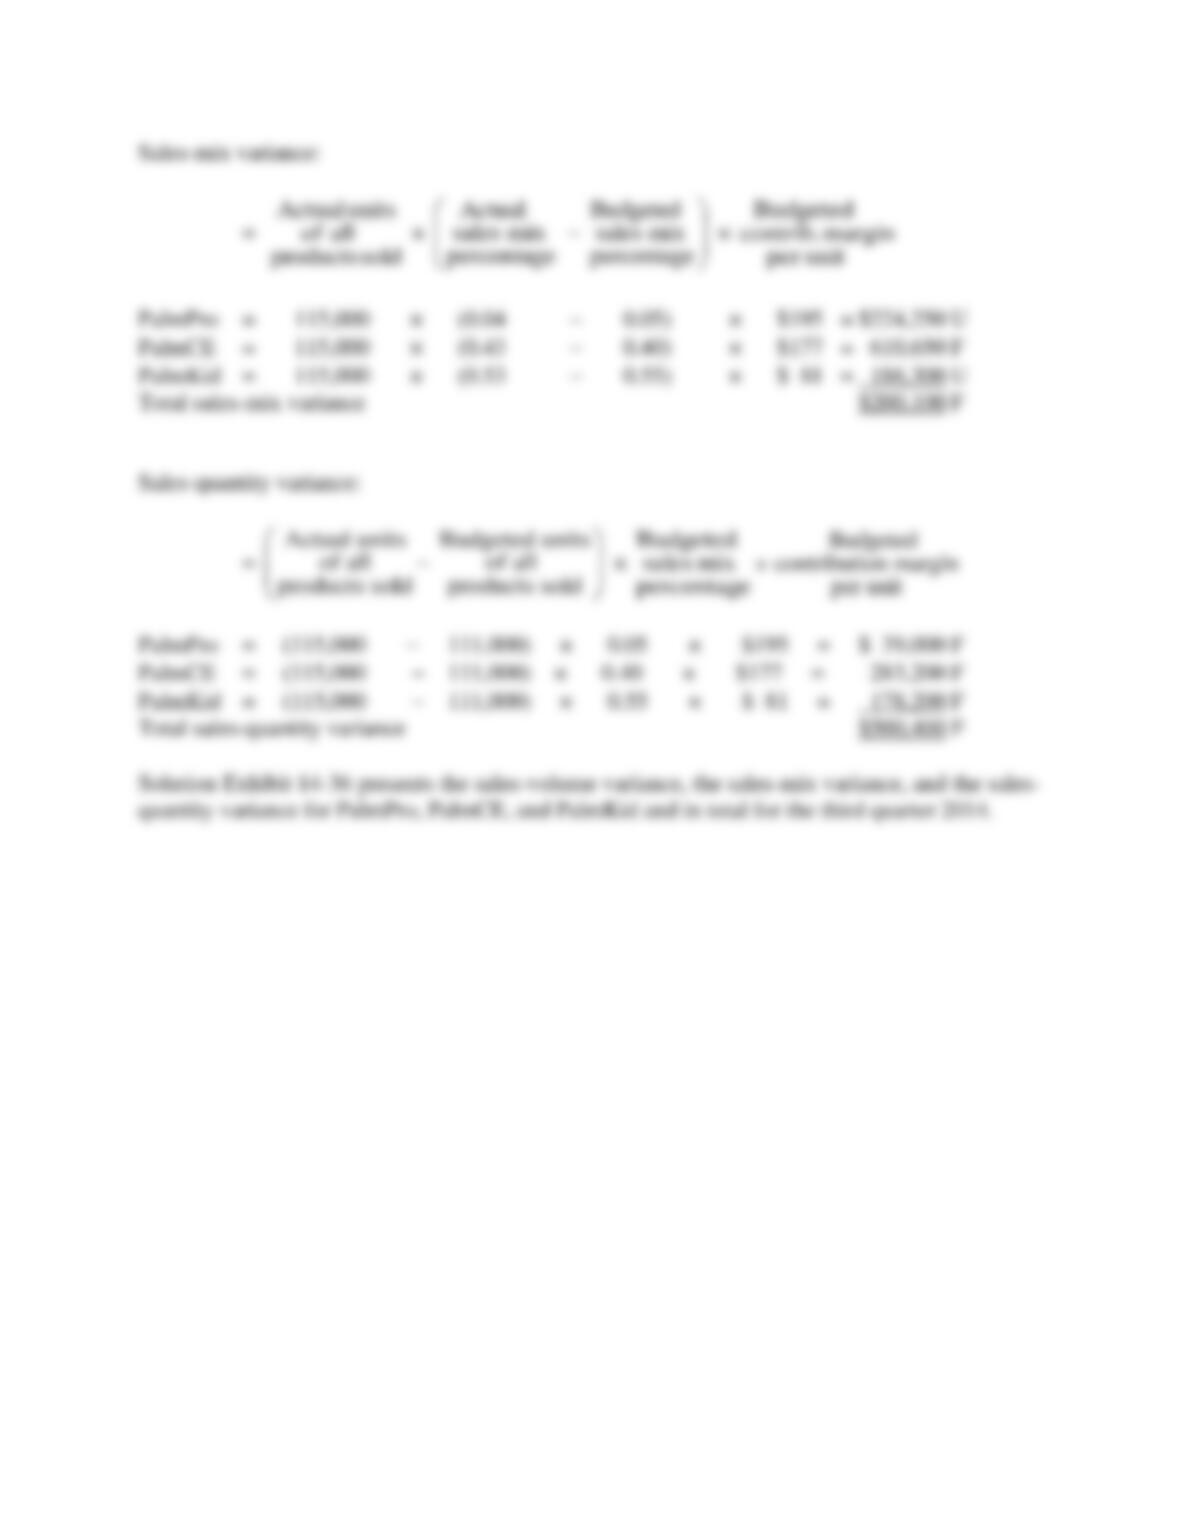
3. Calculate total sales-volume, sales-mix, and sales-quantity variances for the third quarter of
2014. (Calculate all variances in terms of contribution margins.)
4. Given that your CEO is known to have temper tantrums, you want to be well prepared for
this meeting. In order to prepare, write a paragraph or two comparing actual results to
budgeted amounts.
SOLUTION
14-61
14-62
14-63
SOLUTION EXHIBIT 14-36
Sales-Mix and Sales-Quantity Variance Analysis of Houston Infonautics for the Third
Quarter 2014.
Flexible Budget: Static Budget:
Actual Units of Actual Units of Budgeted Units of
All Products Sold All Products Sold All Products Sold
Actual Sales Mix Budgeted Sales Mix Budgeted Sales Mix
Budgeted Contribution Budgeted Contribution Budgeted Contribution
Margin Per Unit Margin Per Unit Margin Per Unit
PalmPro 115,000 0.04 $195 = $ 897,000 115,000 0.05 $195 = $ 1,121,250 111,000 0.05 $195 = $ 1,082,250
PalmCE 115,000 0.43 $177 = 8,752,650 115,000 0.40 $177 = 8,142,000 111,000 0.40 $177 = 7,858,800
PalmKid 115,000 0.53 $ 81 = 4,936,950 115,000 0.55 $ 81 = 5,123,250 111,000 0.55 $ 81 = 4,945,050
$14,586,600 $14,386,500 $13,886,100
$200,100 F $500,400 F
Sales-mix variance Sales-quantity variance
$700,500 F
Sales-volume variance
F = favorable effect on operating income; U= unfavorable effect on operating income
4. The following factors help explain the difference between actual and budgeted amounts:
• The difference in actual versus budgeted quantities multiplied by the budgeted
contribution margins was $700,500 favorable ($14,586,600 − $13,886,100). The
contribution margins from PalmPro and the PalmKid were lower than expected, but
the contribution margin from PalmCE was much higher and more than the lower
margins on PalmPro and PalmKid.
• In percentage terms, the PalmCE accounted for 60% $8,752,650 ÷ $14,586,600) of
contribution margin at budgeted rates for actual quantities sold versus a planned 56%
($7,858,800 ÷ $13,886,100) budgeted contribution margin. However, the PalmPro
accounted for 6% ($897,000 ÷ $14,586,600) versus planned 8% ($1,082,250 ÷
13,886,100) and the PalmKid accounted for 34% $4,936,950 ÷ $14,586,100) versus a
planned 36% ($4,945,050 ÷ $13,886,100).
• In unit terms (rather than in contribution terms), the PalmCE accounted for 43% of
the sales mix, a little more than the planned 40%. However, the PalmPro accounted
for only 4% versus a budgeted 5%, and the PalmCE accounted for 53% versus a
planned 55%.
• Variance analysis for the PalmPro and PalmKid shows an unfavorable sales-mix
variance but a favorable sales-quantity variance producing an unfavorable sales–
volume variance.
• The PalmCE gained sales-mix share at 43%—as a result, the sales-mix variance is
positive. PalmCE also had a favorable sales quantity variance and a favorable sales
volume variance.
• Overall, there was a favorable total sales–volume variance. However, the large drop in
PalmPro’s and PalmKid’s actual contribution margin per unit relative to the budgeted
14-64
contribution margin per unit combined with a decrease in the actual number of
PalmPro and PalmKid units sold led to the total contribution margin being much
lower than budgeted despite PalmCe’s higher actual contribution margin per unit
relative to the budget and the higher number of actual units sold relative to the
budget.
Other factors could be discussed here—for example, it seems that the PalmKid did
not achieve much success with a much lower price point—selling price was budgeted
at $146 but dropped to $115. At the same time, variable costs increased. This could
have been due to a marketing push that did not succeed.
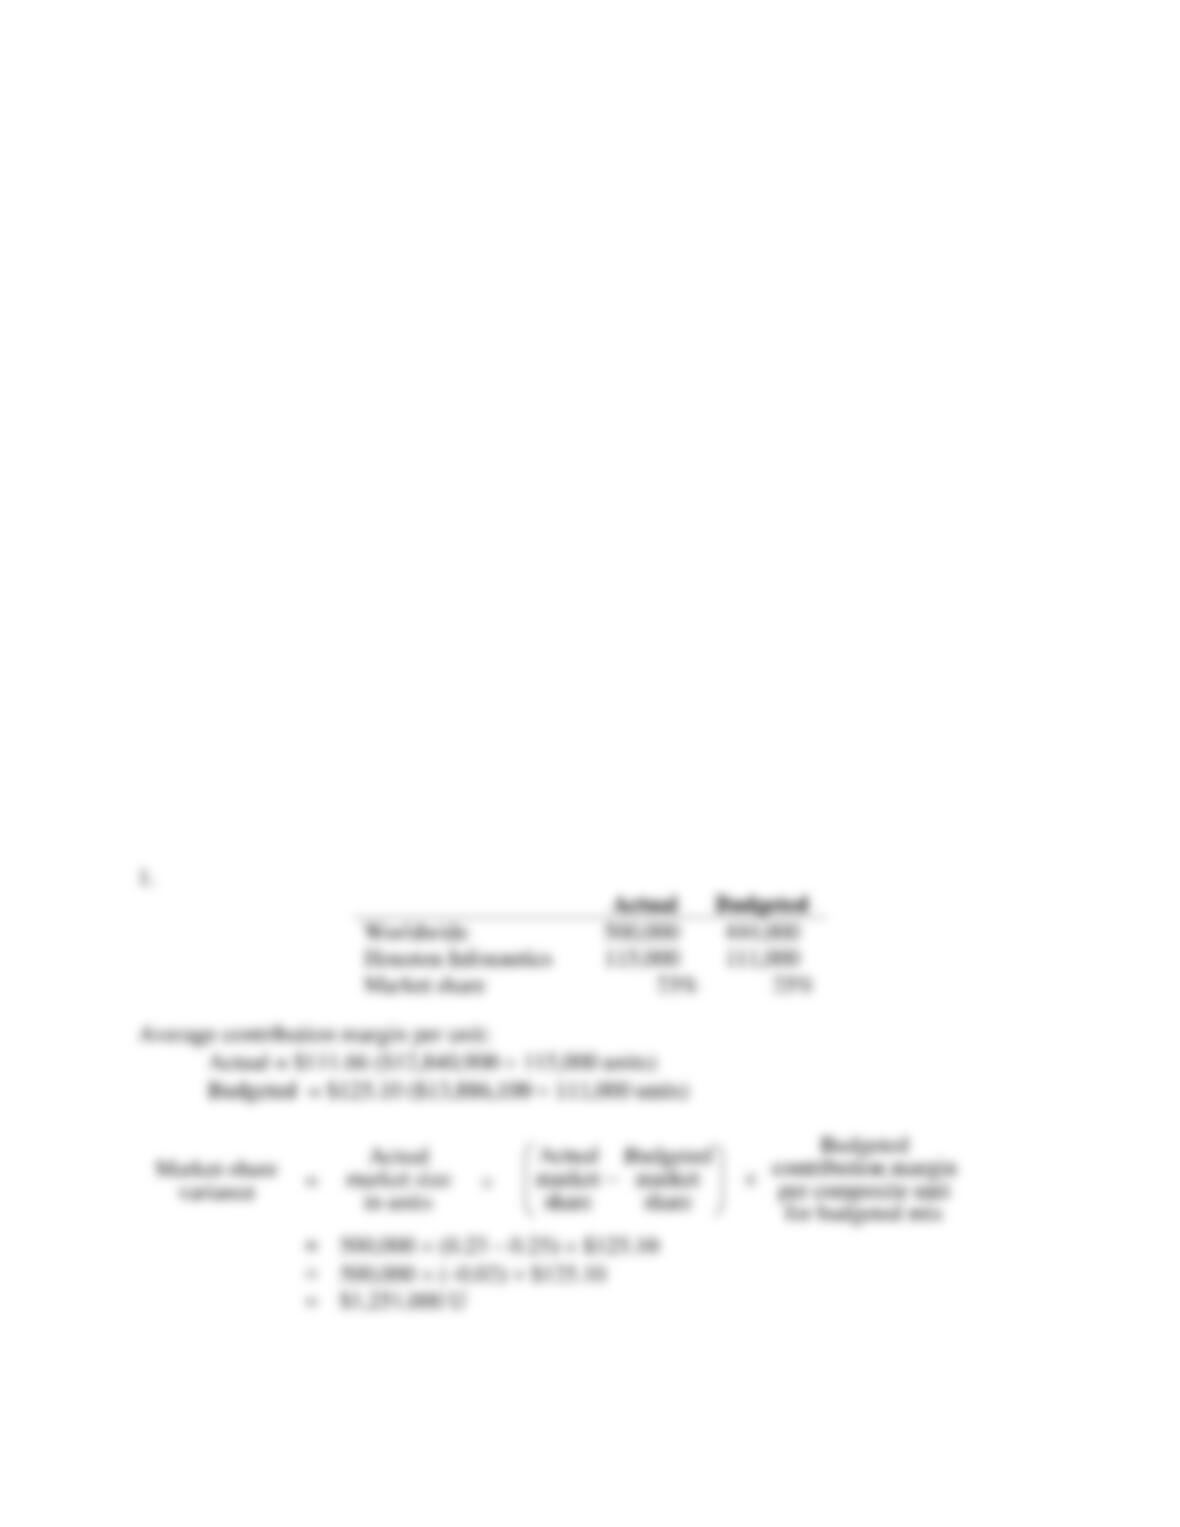
14-37 (20 min.) Market-share and market-size variances (continuation of 14-32).
Houston Infonautics’ senior vice president of marketing prepared his budget at the beginning of
the third quarter assuming a 25% market share based on total sales. Foolinstead Research
estimated that the total handheld-organizer market would reach sales of 444,000 units worldwide
in the third quarter. However, actual sales in the third quarter were 500,000 units.
1. Calculate the market-share and market-size variances for Houston Infonautics in the third
quarter of 2014 (calculate all variances in terms of contribution margins).
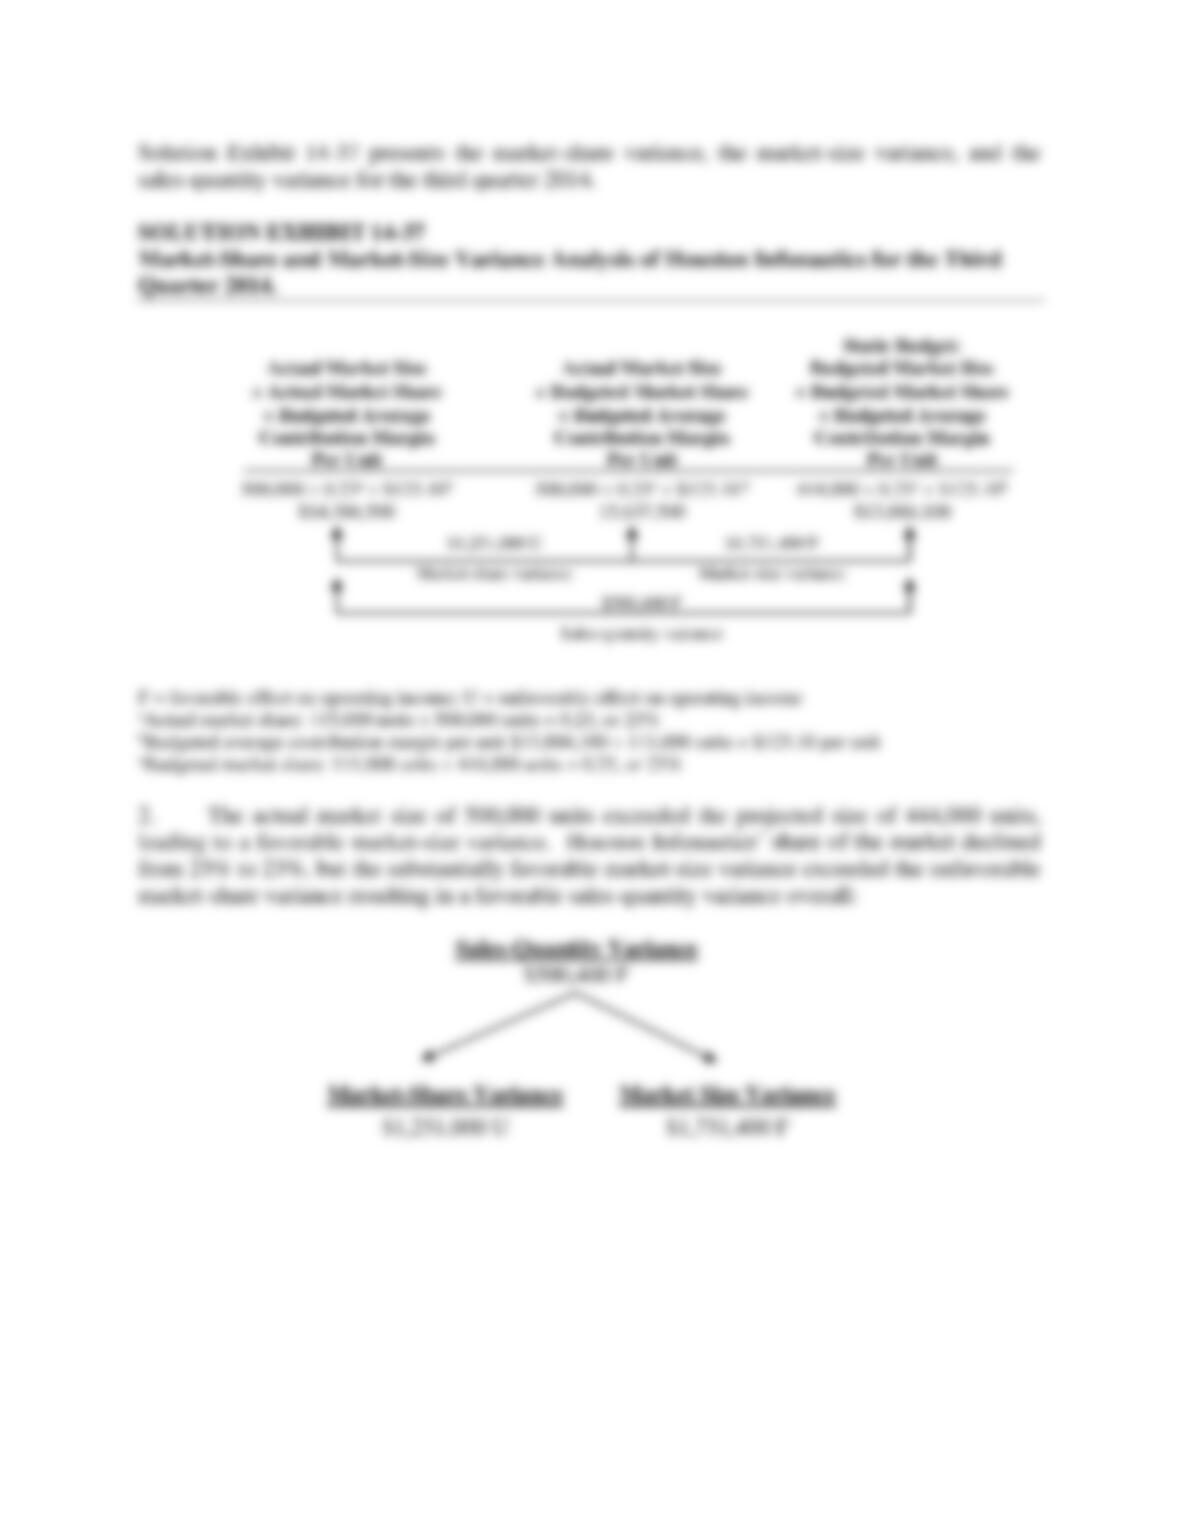
2. Explain what happened based on the market-share and market-size variances.
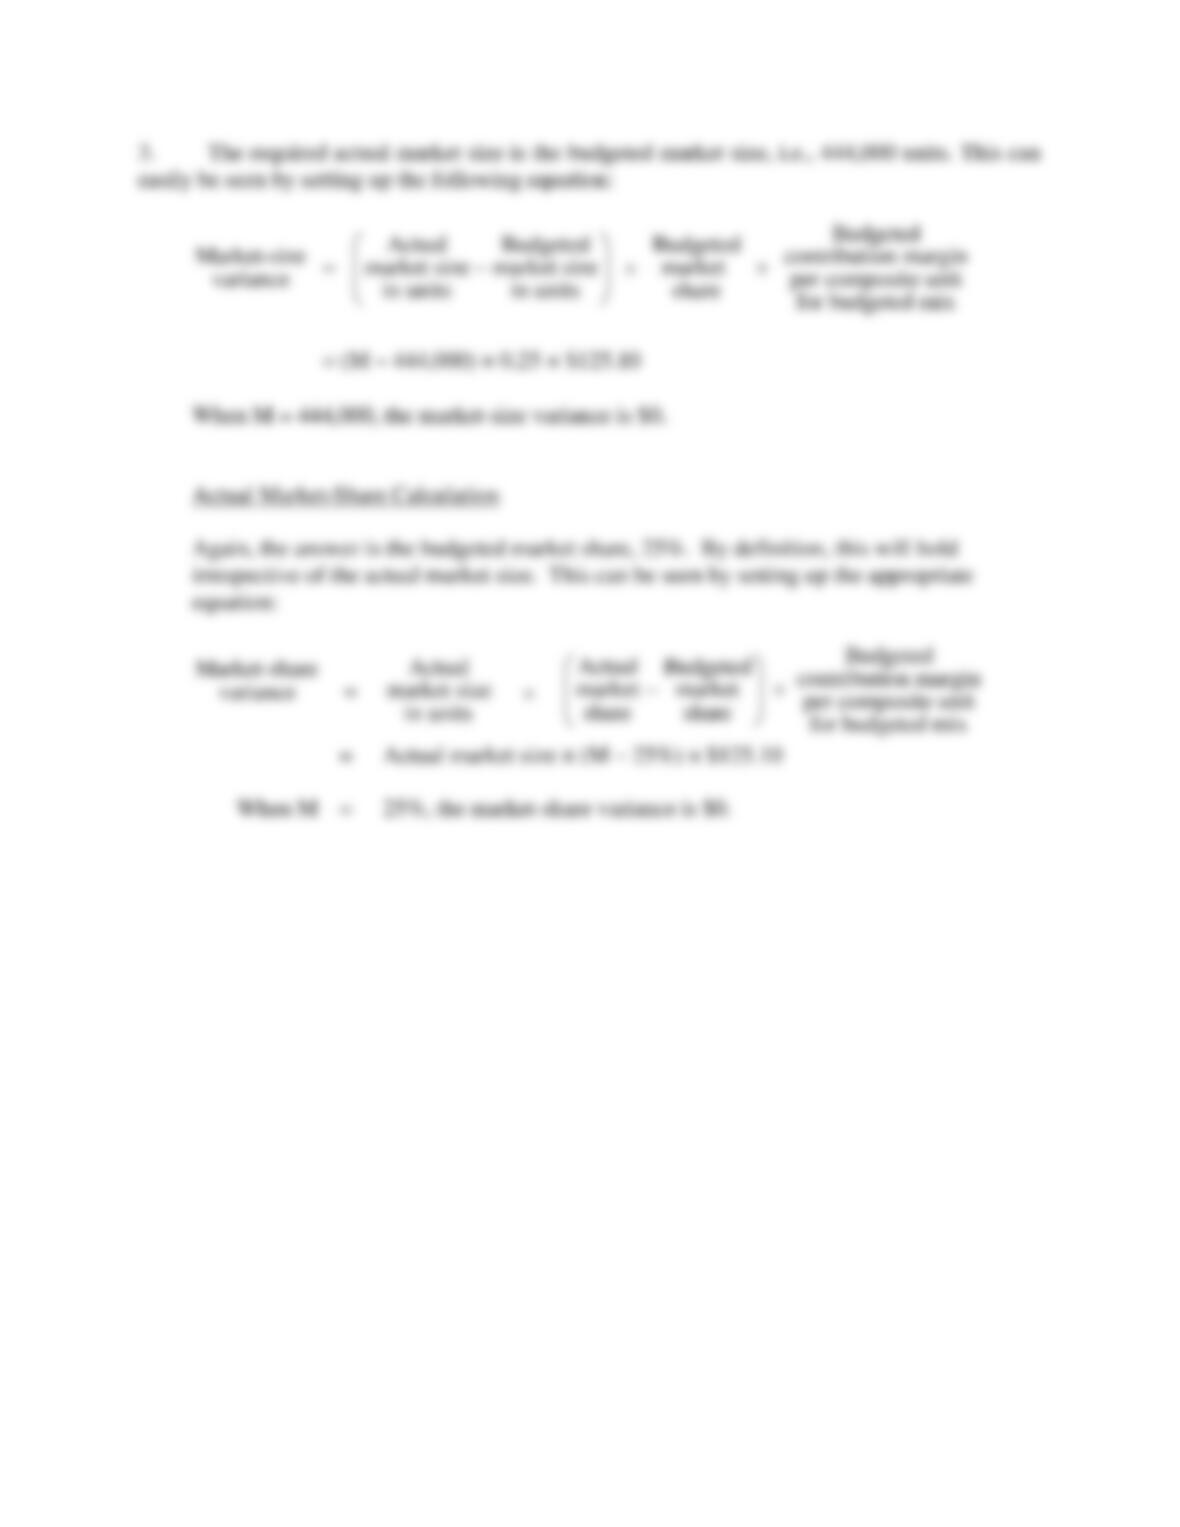
3. Calculate the actual market size, in units, that would have led to no market-size variance
(again using budgeted contribution margin per unit). Use this market-size figure to calculate
the actual market share that would have led to a zero market-share variance.
SOLUTION

14-65
14-66
14-67
14-68
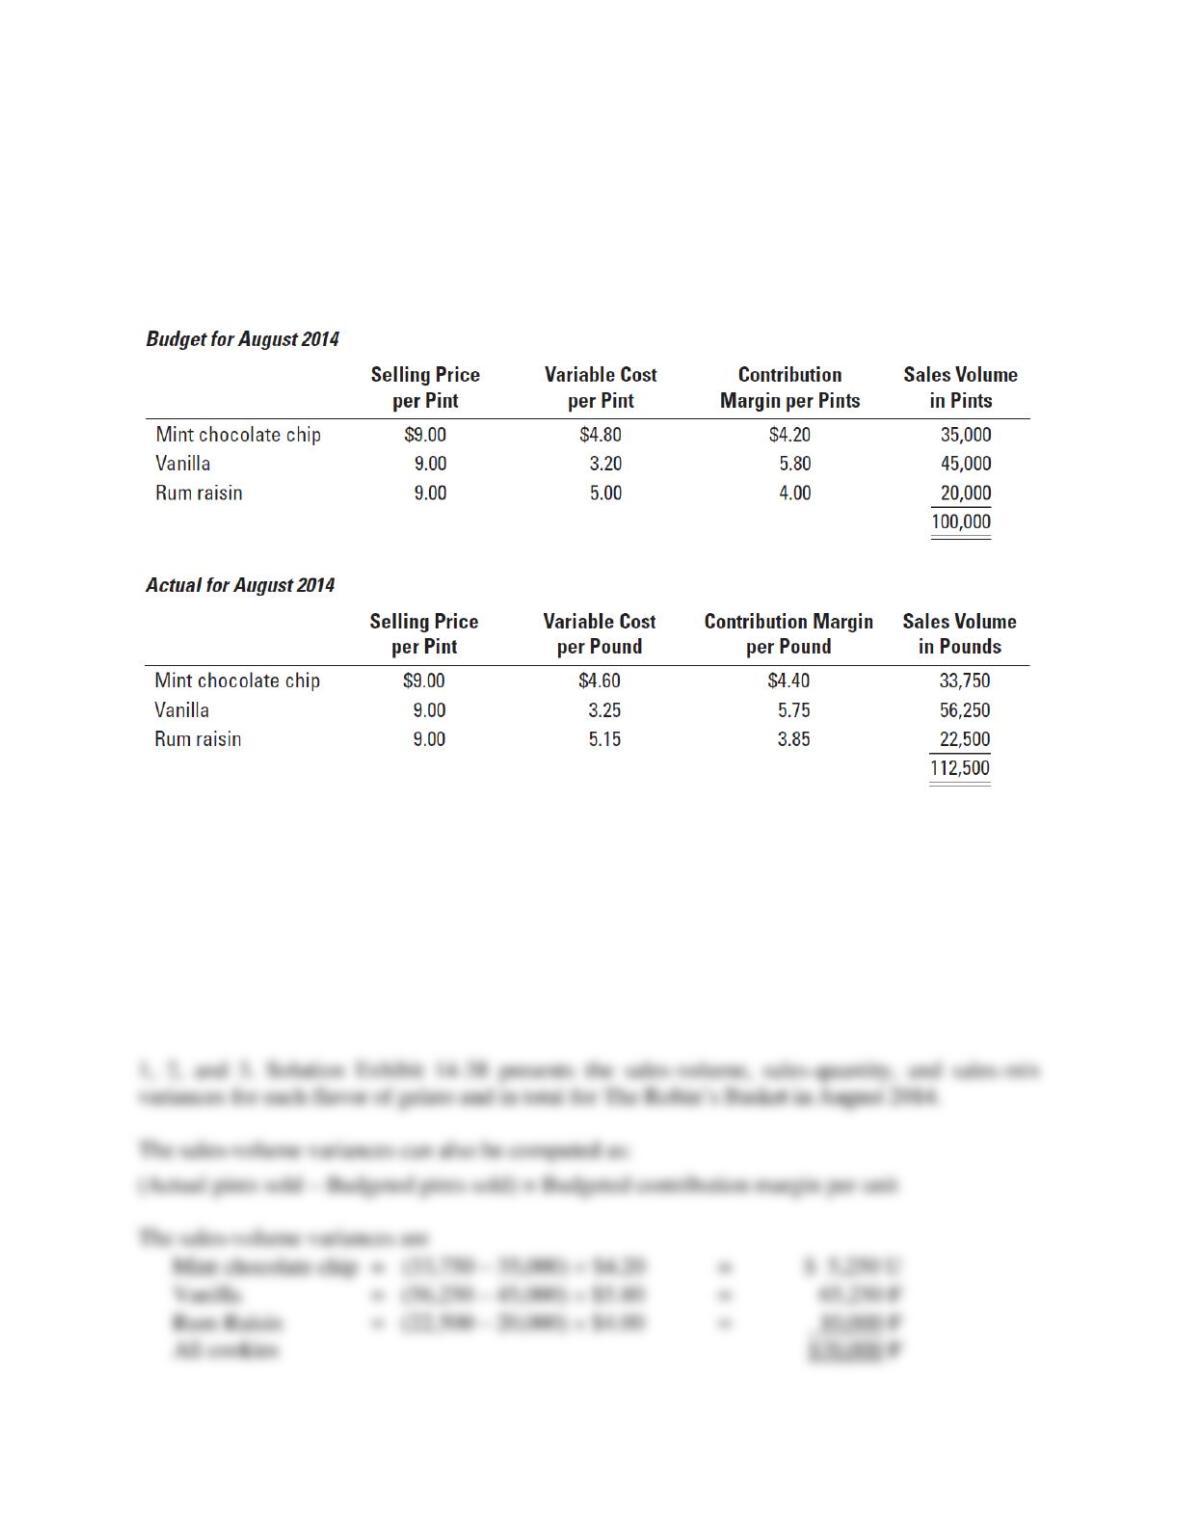
14-38 (40 min.) Variance analysis, multiple products.
The Robin’s Basket operates a chain of Italian gelato stores. Although the Robin’s Basket
charges customers the same price for all flavors, production costs vary, depending on the type of
ingredients. Budgeted and actual operating data of its Washington, D.C., store for August 2014
are as follows:
The Robin’s Basket focuses on contribution margin in its variance analysis.
Required:
1. Compute the total sales-volume variance for August 2014.
2. Compute the total sales-mix variance for August 2014.
3. Compute the total sales-quantity variance for August 2014.
4. Comment on your results in requirements 1, 2, and 3.
SOLUTION

14-69
14-70

14-71
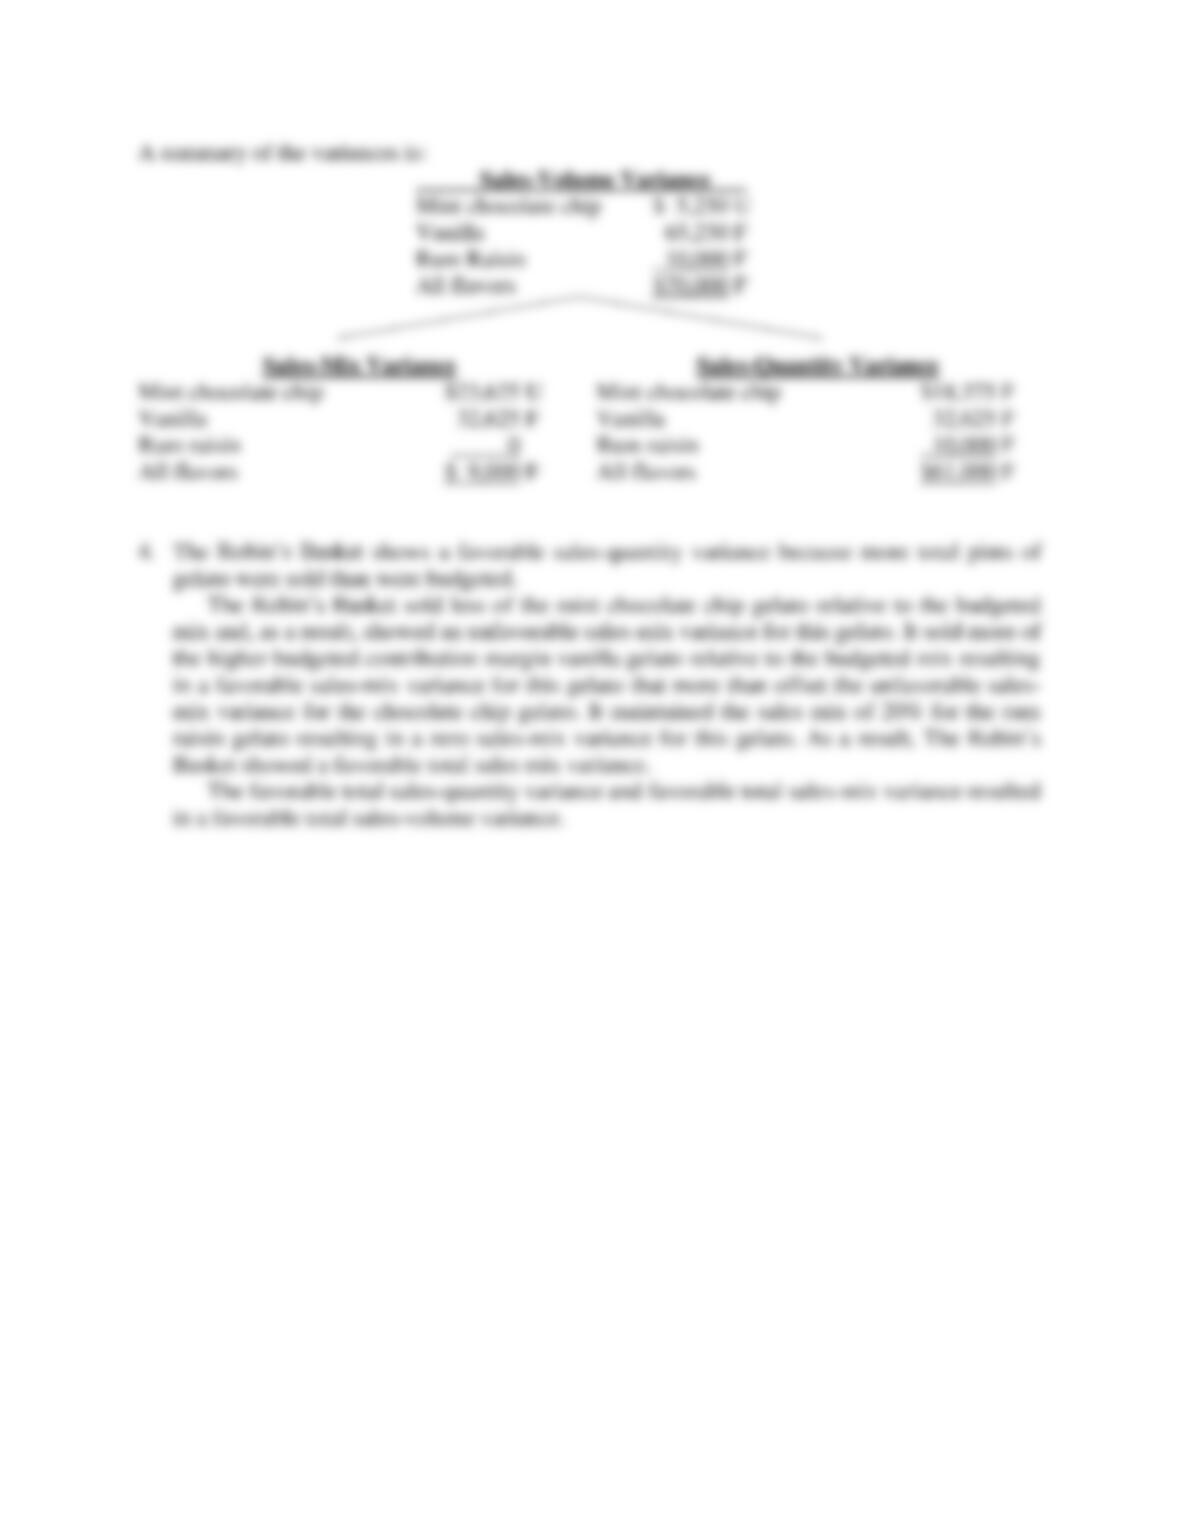
SOLUTION EXHIBIT 14-38
Columnar Presentation of Sales-Volume, Sales-Quantity, and Sales-Mix Variances
for The Robin’s Basket
Flexible Budget:
Actual Pints of
All Flavors Sold
× Actual Sales Mix
× Budgeted Contribution
Margin per Pint
(1)
Actual Pints of
All Flavors Sold
× Budgeted Sales Mix
× Budgeted Contribution
Margin per Pint
(2)
Static Budget:
Budgeted Pints of
All Flavors Sold
× Budgeted Sales Mix
× Budgeted Contribution
Margin per Pint
(3)
Panel A:
Mint choc. chip
(112,500 × 0.30a) × $4.20
33,750 × $4.20
(112,500 × 0.35b) × $4.20
39,375 × $4.20
(100,000 × 0.35b) × $4.20
35,000 × $4.20
$141,750 $165,375 $147,000
Panel B:
Vanilla
(112,500 × 0.50c) × $5.80
56,250 × $5.80
(112,500 × 0.45d) × $5.80
50,625 × $5.80
(100,000 × 0.45d) × $5.80
45,000 × $5.80
$326,250 $293,625 $261,000
Panel C:
Rum Raisin
(112,500 × 0.20e) × $4.00
22,500 × $4.00
(112,500 × 0.20f) × $4.00
22,500 × $4.00
(100,000 × 0.20f) × $4.00
20,000 × $4.00
$90,000 $90,000 $80,000
F = favorable effect on operating income; U = unfavorable effect on operating income.
Actual Sales Mix:
aMint choc. chip = 33,750 ÷ 112,500 = 30%
cVanilla = 56,250 ÷ 112,500 = 50%
eRum raisin = 22,500 ÷ 112,500 = 20%
Budgeted Sales Mix:
bMint choc. chip = 35,000 ÷ 100,000 = 35%
dVanilla = 45,000 ÷ 100,000 = 45%
f Rum raisin = 20,000 ÷ 100,000 = 20%
$23,625 U
Sales-mix variance
$18,375 F
Sales-quantity variance
$5,250 U
Sales-volume variance
$32,625 F
Sales-mix variance
$32,625 F
Sales-quantity variance
$65,250 F
Sales-volume variance
$0
Sales-mix variance
$10,000 F
Sales-quantity variance
$10,000 F
Sales-volume variance
14-72
SOLUTION EXHIBIT 14-38 (Cont’d.)
Columnar Presentation of Sales-Volume, Sales-Quantity, and Sales-Mix Variances
for The Robin’s Basket
Flexible Budget:
Actual Pints of
All Flavors Sold
× Actual Sales Mix
× Budgeted Contribution
Margin per Pint
(1)
Actual Pounds of
All Cookies Sold
× Budgeted Sales Mix
× Budgeted Contribution
Margin per Pound
(2)
Static Budget:
Budgeted Pounds of
All Cookies Sold
× Budgeted Sales Mix
× Budgeted Contribution
Margin per Pound
(3)
Panel F: $558,000g $549,000h $488,000j
All Flavors
F = favorable effect on operating income; U = unfavorable effect on operating income.
g$141,750 + $326,250 + $90,000 = $558,000
h$165,375 + $293,625 + $90,000 = $549,000
j$147,000 + $261,000 + $80,000 = $488,000
$9,000 F
Total sales-mix variance
$61,000 F
Total sales-quantity variance
$70,000 F
Total sales-volume variance
14-73
14-39 (60 min.) Customer profitability and ethics.
KC Corporation manufactures an air-freshening device called GoodAir, which it sells to six
merchandising firms. The list price of a GoodAir is $30, and the full manufacturing costs are
$18. Salespeople receive a commission on sales, but the commission is based on number of
orders taken, not on sales revenue generated or number of units sold. Salespeople receive a
commission of $10 per order (in addition to regular salary).
KC Corporation makes products based on anticipated demand. KC carries an inventory of
GoodAir, so rush orders do not result in any extra manufacturing costs over and above the $18
per unit. KC ships finished product to the customer at no additional charge for either regular or
expedited delivery. KC incurs significantly higher costs for expedited deliveries than for regular
deliveries. Customers occasionally return shipments to KC, and the company subtracts these
returns from gross revenue. The customers are not charged a restocking fee for returns.
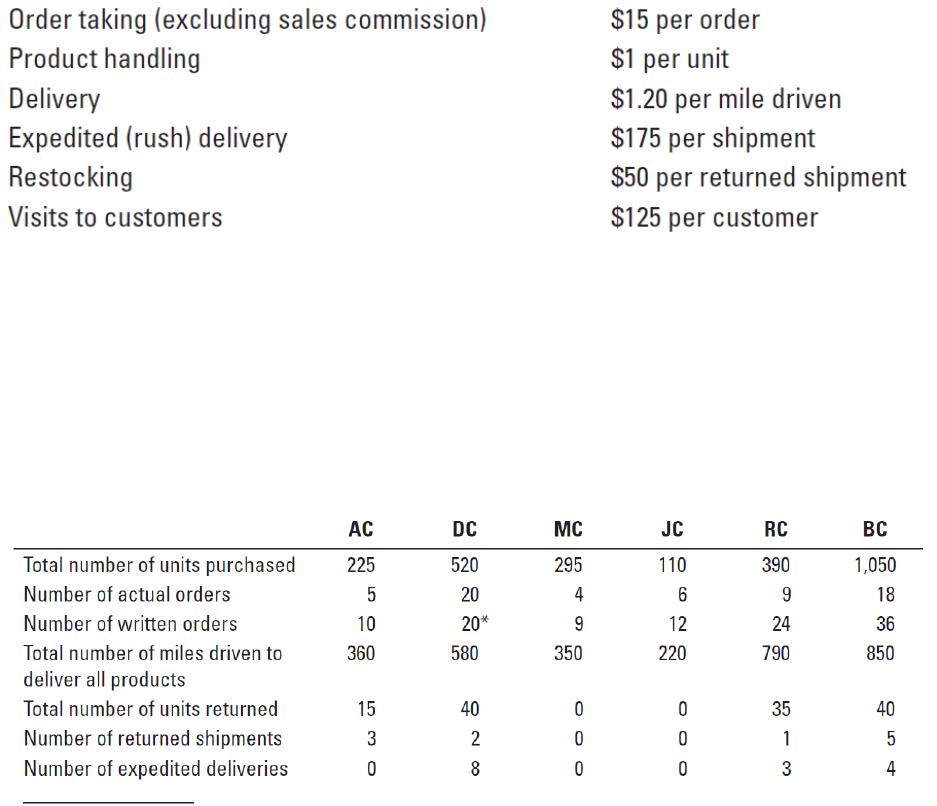
Budgeted (expected) customer-level cost driver rates are:
Because salespeople are paid $10 per order, they often break up large orders into multiple
smaller orders. This practice reduces the actual order-taking cost by $7 per smaller order (from
$15 per order to $8 per order) because the smaller orders are all written at the same time. This
lower cost rate is not included in budgeted rates because salespeople create smaller orders
without telling management or the accounting department. All other actual costs are the same as
budgeted costs.
Information about KC’s clients follows:
* Because DC places 20 separate orders, its order costs are $15 per order. All other orders are
multiple smaller orders and so have actual order costs of $8 each.
14-74
Required:
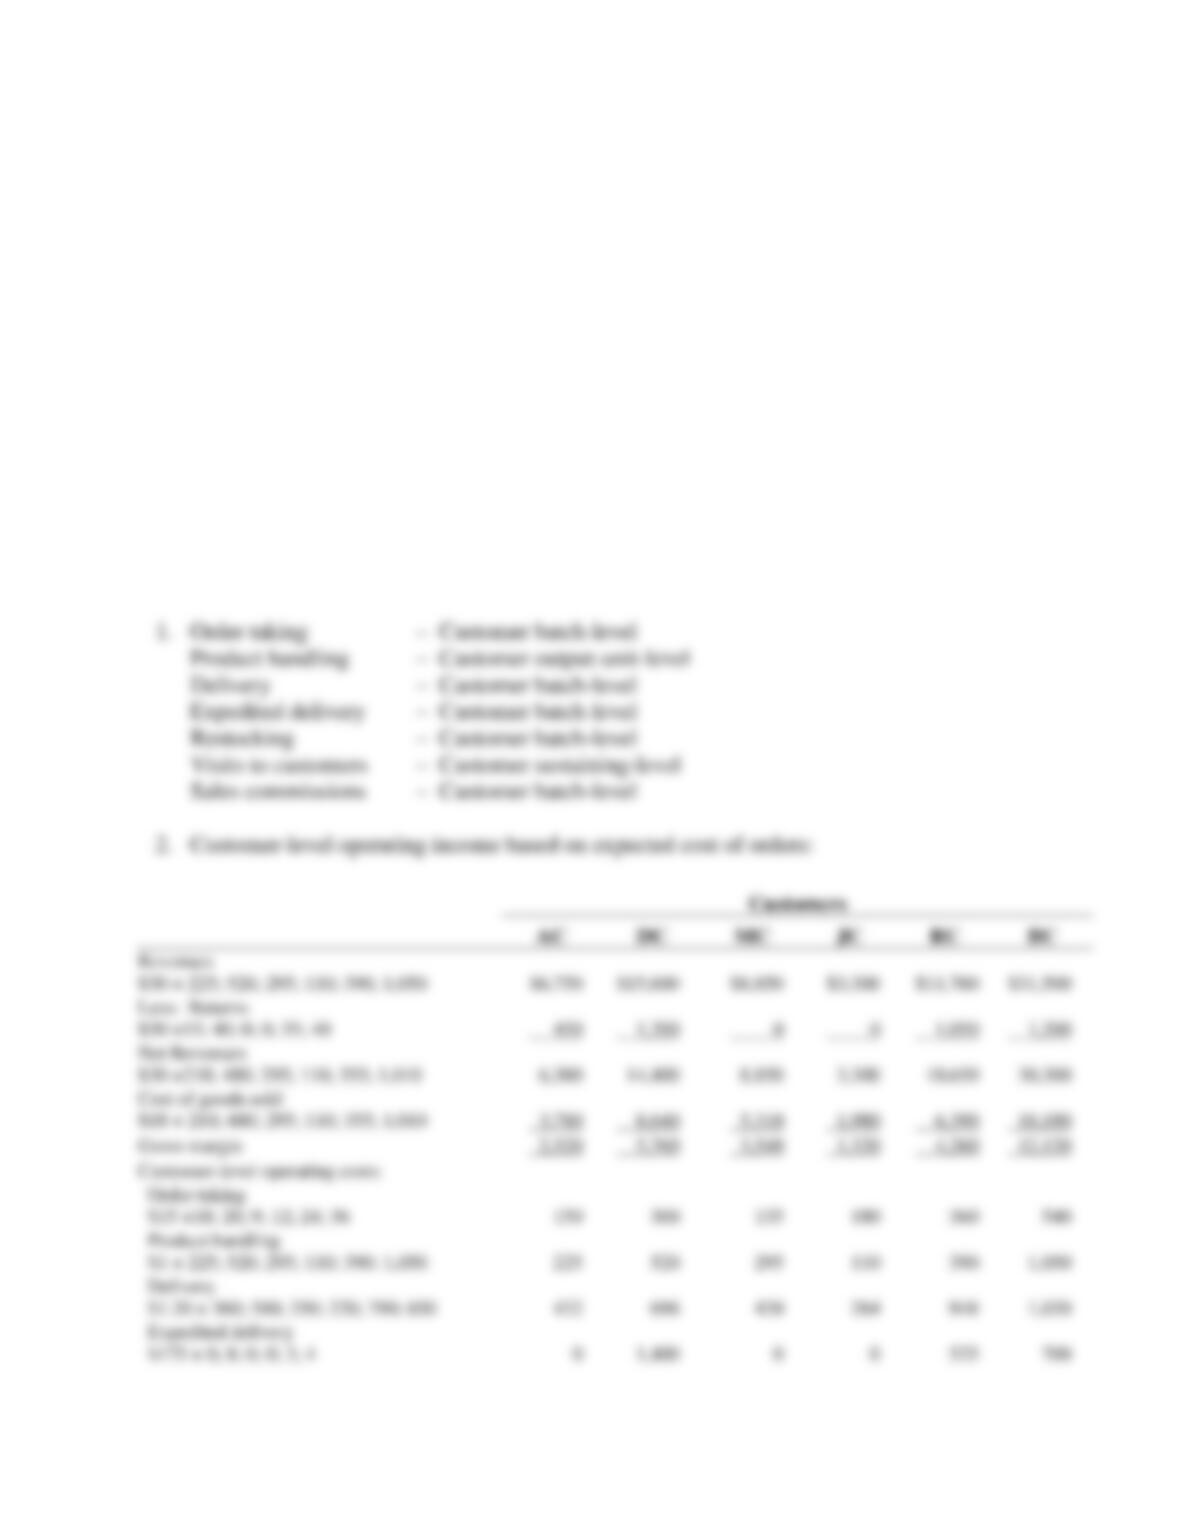
1. Classify each of the customer-level operating costs as a customer output unit–level, customer
batch-level, or customer-sustaining cost.
2. Using the preceding information, calculate the expected customer-level operating income for
the six customers of KC Corporation. Use the number of written orders at $15 each to
calculate expected order costs.
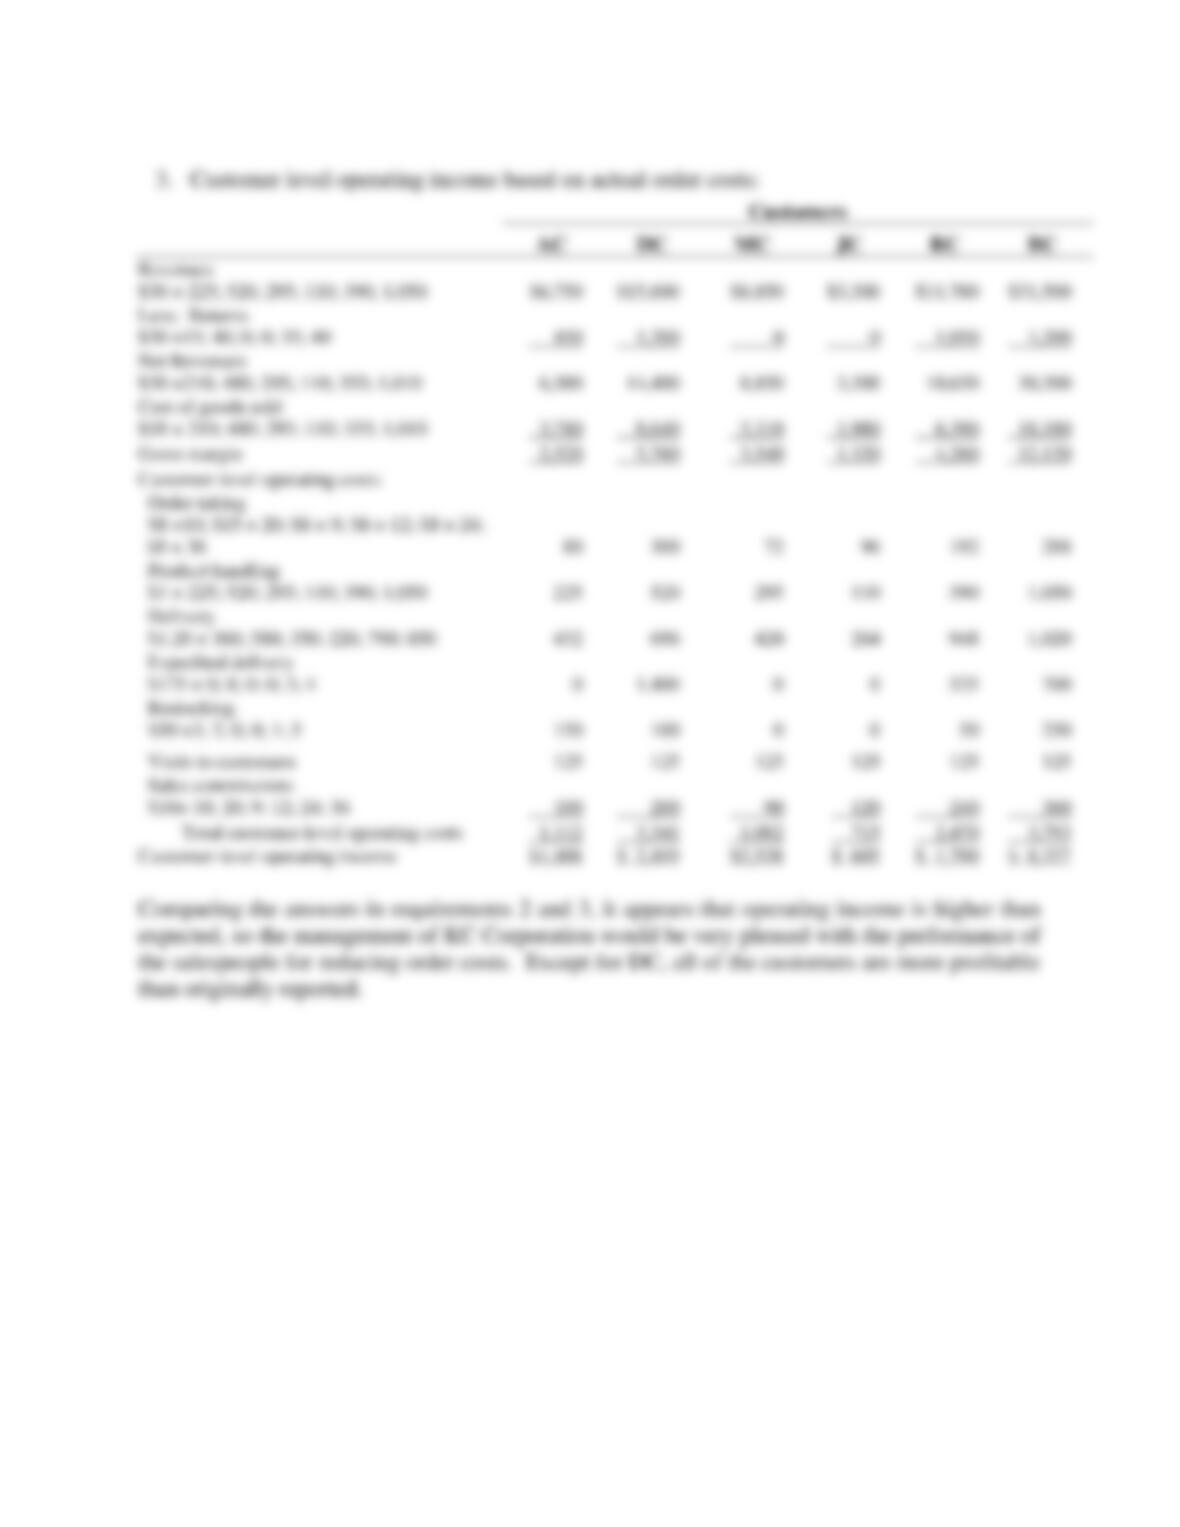
3. Recalculate the customer-level operating income using the number of written orders but at
their actual $8 cost per order instead of $15 (except for DC, whose actual cost is $15 per
order). How will KC Corporation evaluate customer-level operating cost performance this
period?
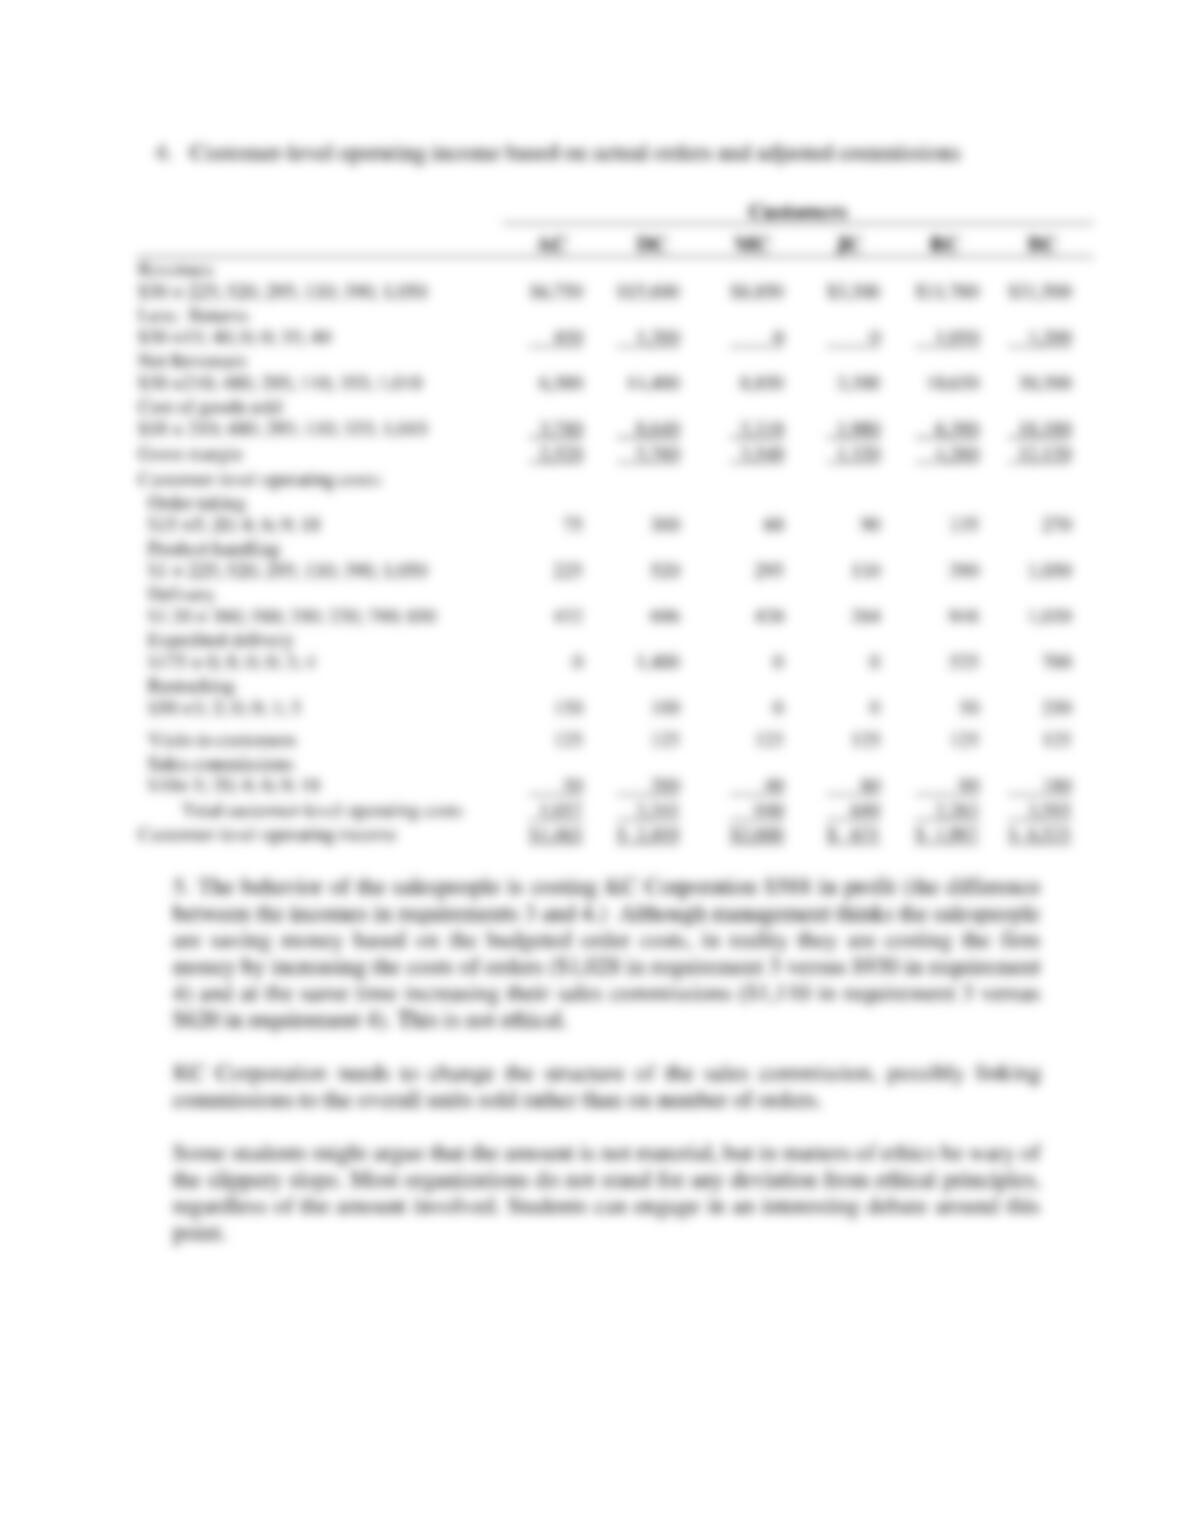
4. Recalculate the customer-level operating income if salespeople had not broken up actual
orders into multiple smaller orders. Don’t forget to also adjust sales commissions.
5. How is the behavior of the salespeople affecting the profit of KC Corporation? Is their
behavior ethical? What could KC Corporation do to change the behavior of the salespeople?
SOLUTION

14-75
14-76
14-77