14-21
14-22 (25 min.) Cost allocation to divisions.
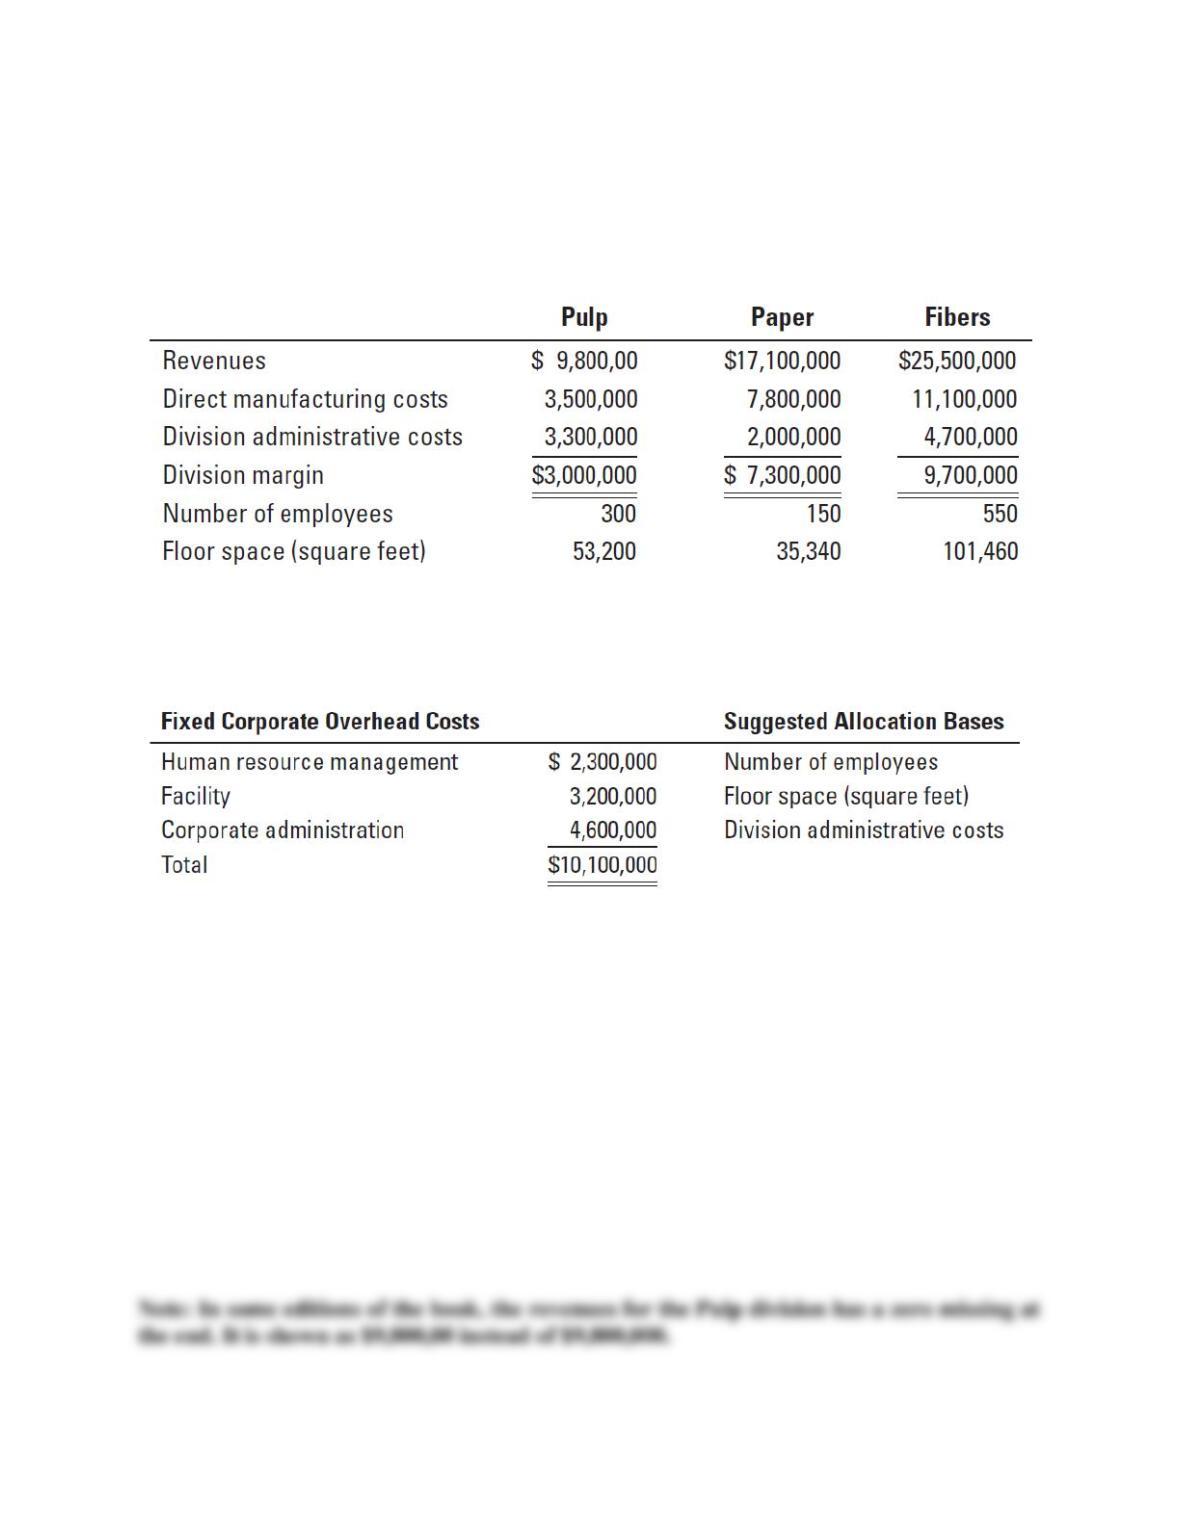
Holbrook Corporation has three divisions: pulp, paper, and fibers. Holbrook’s new controller,
Paul Weber, is reviewing the allocation of fixed corporate-overhead costs to the three divisions.
He is presented with the following information for each division for 2013:
Until now, Holbrook Corporation has allocated fixed corporate-overhead costs to the divisions
on the basis of division margins. Weber asks for a list of costs that comprise fixed corporate
overhead and suggests the following new allocation bases:
Required:
1. Allocate 2013 fixed corporate-overhead costs to the three divisions using division margin as
the allocation base. What is each division’s operating margin percentage (division margin
minus allocated fixed corporate-overhead costs as a percentage of revenues)?
2. Allocate 2013 fixed costs using the allocation bases suggested by Weber. What is each
division’s operating margin percentage under the new allocation scheme?
3. Compare and discuss the results of requirements 1 and 2. If division performance is linked to
operating margin percentage, which division would be most receptive to the new allocation
scheme? Which division would be the least receptive? Why?
4. Which allocation scheme should Holbrook Corporation use? Why? How might Weber
overcome any objections that may arise from the divisions?
SOLUTION
14-22
14-23
14-24
14-23 (30–40 min.) Variance analysis, multiple products.
The Chicago Wolves play in the American Ice Hockey League. The Wolves play in the
Downtown Arena, which is owned and managed by the City of Chicago. The arena has a
capacity of 17,500 seats (6,500 lower-tier seats and 11,000 upper-tier seats). The arena charges
the Wolves a per-ticket charge for use of its facility. All tickets are sold by the Reservation
Network, which charges the Wolves a reservation fee per ticket. The Wolves’ budgeted
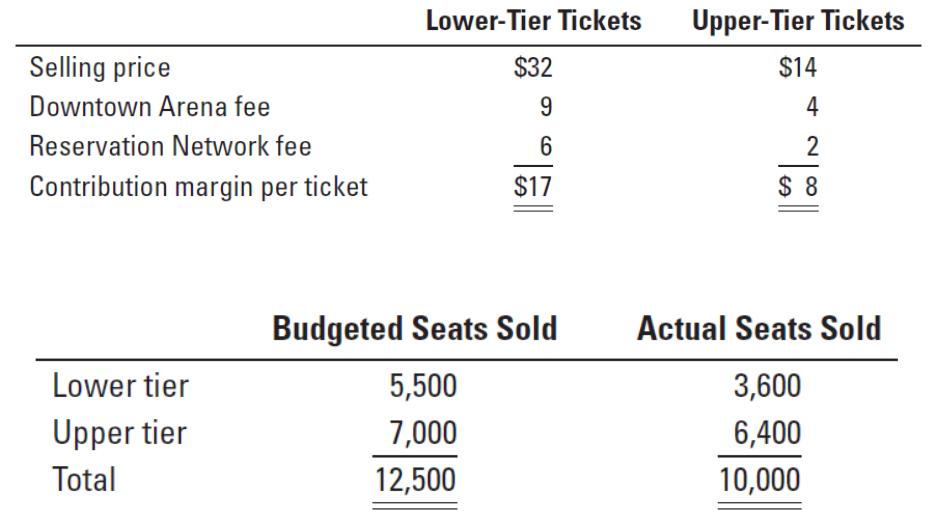
contribution margin for each type of ticket in 2013 is computed as follows:
The budgeted and actual average attendance figures per game in the 2013 season are as follows:
There was no difference between the budgeted and actual contribution margin for lower-tier or
upper-tier seats.
The manager of the Wolves was unhappy that actual attendance was 20% below budgeted
attendance per game, especially given the booming state of the local economy in the past six
months.
Required:
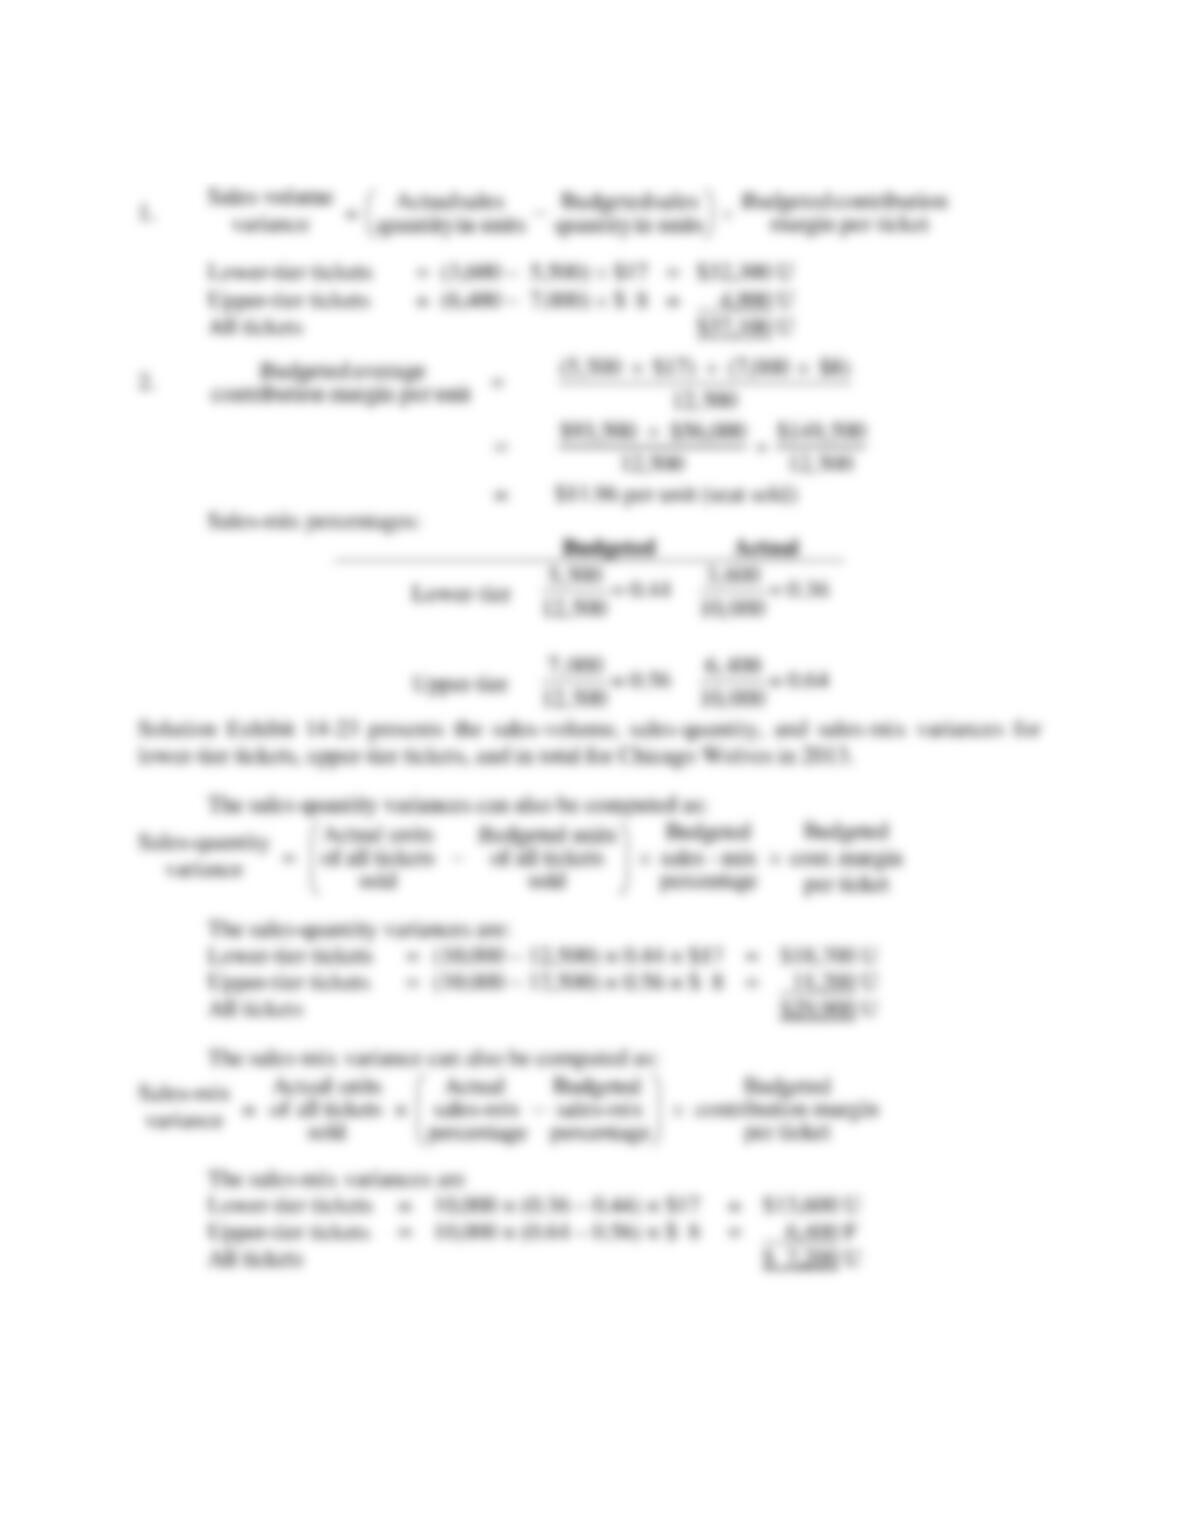
1. Compute the sales-volume variance for each type of ticket and in total for the Chicago
Wolves in 2013. (Calculate all variances in terms of contribution margins.)
2. Compute the sales-quantity and sales-mix variances for each type of ticket and in total in
2013.
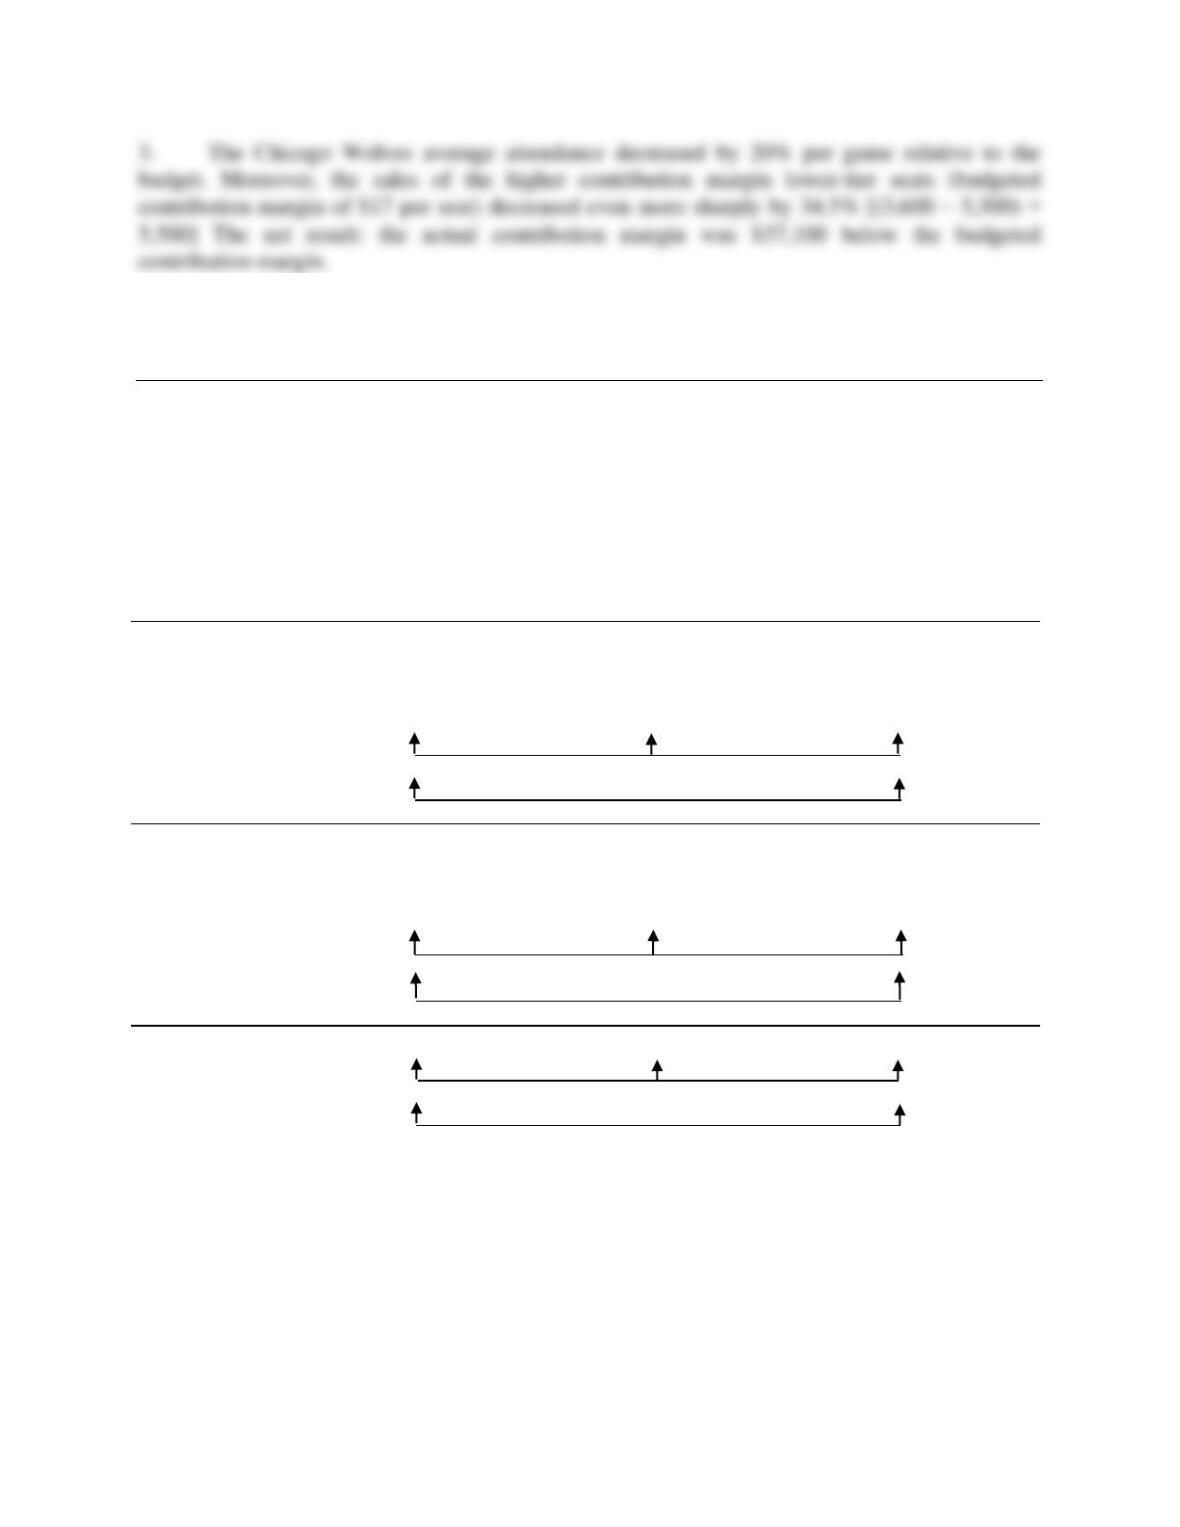
3. Present a summary of the variances in requirements 1 and 2. Comment on the results.
14-25
SOLUTION
14-26
SOLUTION EXHIBIT 14-23
Columnar Presentation of Sales-Volume, Sales-Quantity and Sales-Mix Variances for Chicago
Wolves
Flexible Budget:
Actual Units of
All Products Sold
× Actual Sales Mix
× Budgeted
Contribution
Margin per Unit
(1)
Actual Units of
All Products Sold
× Budgeted Sales Mix
× Budgeted
Contribution Margin
per Unit
(2)
Static Budget:
Budgeted Units of
All Products Sold
× Budgeted Sales Mix
× Budgeted
Contribution
Margin per Unit
(3)
Panel A:
Lower-tier
(10,000 × 0.36a) × $17
3,600 × $17
(10,000 × 0.44b) × $17
4,400 × $17
(12,500 × 0.44b) × $17
5,500 × $17
$61,200 $74,800 $93,500
$13,600U $18,700 U
Sales-mix variance Sales-quantity variance
$32,300 U
Sales-volume variance
Panel B:
Upper-tier
(10,000 × 0.64c) × $8
6,400 × $8
(10,000 × 0.56d) × $8
5,600 × $8
(12,500 × 0.56d) × $8
7,000 × $8
$51,200 $44,800 $56,000
$6,400 F $11,200 U
Sales-mix variance Sales-quantity variance
$4,800 U
Sales-volume variance
Panel C:
All Tickets
(Sum of Lower-
tier and Upper-
tier Tickets)
$112,400e $119,600f $149,500g
$7,200 U $29,900 U
Total sales-mix variance Total sales-quantity variance
$37,100 U
Total sales-volume variance
F = favorable effect on operating income; U = unfavorable effect on operating income.
Actual Sales Mix:
aLower-tier = 3,600 ÷ 10,000 = 36%
cUpper-tier = 6,400 ÷ 10,000 = 64%
e$61,200 + $51,200 = $112,400
Budgeted Sales Mix:
bLower-tier = 5,500 ÷ 12,500 = 44%
dUpper-tier = 7,000 ÷ 12,500 = 56%
f $74,800 + $44,800 = $119,600
g $93,500 + $56,000 = $149,500
14-27
14-24 (30 min.) Variance analysis, working backward.
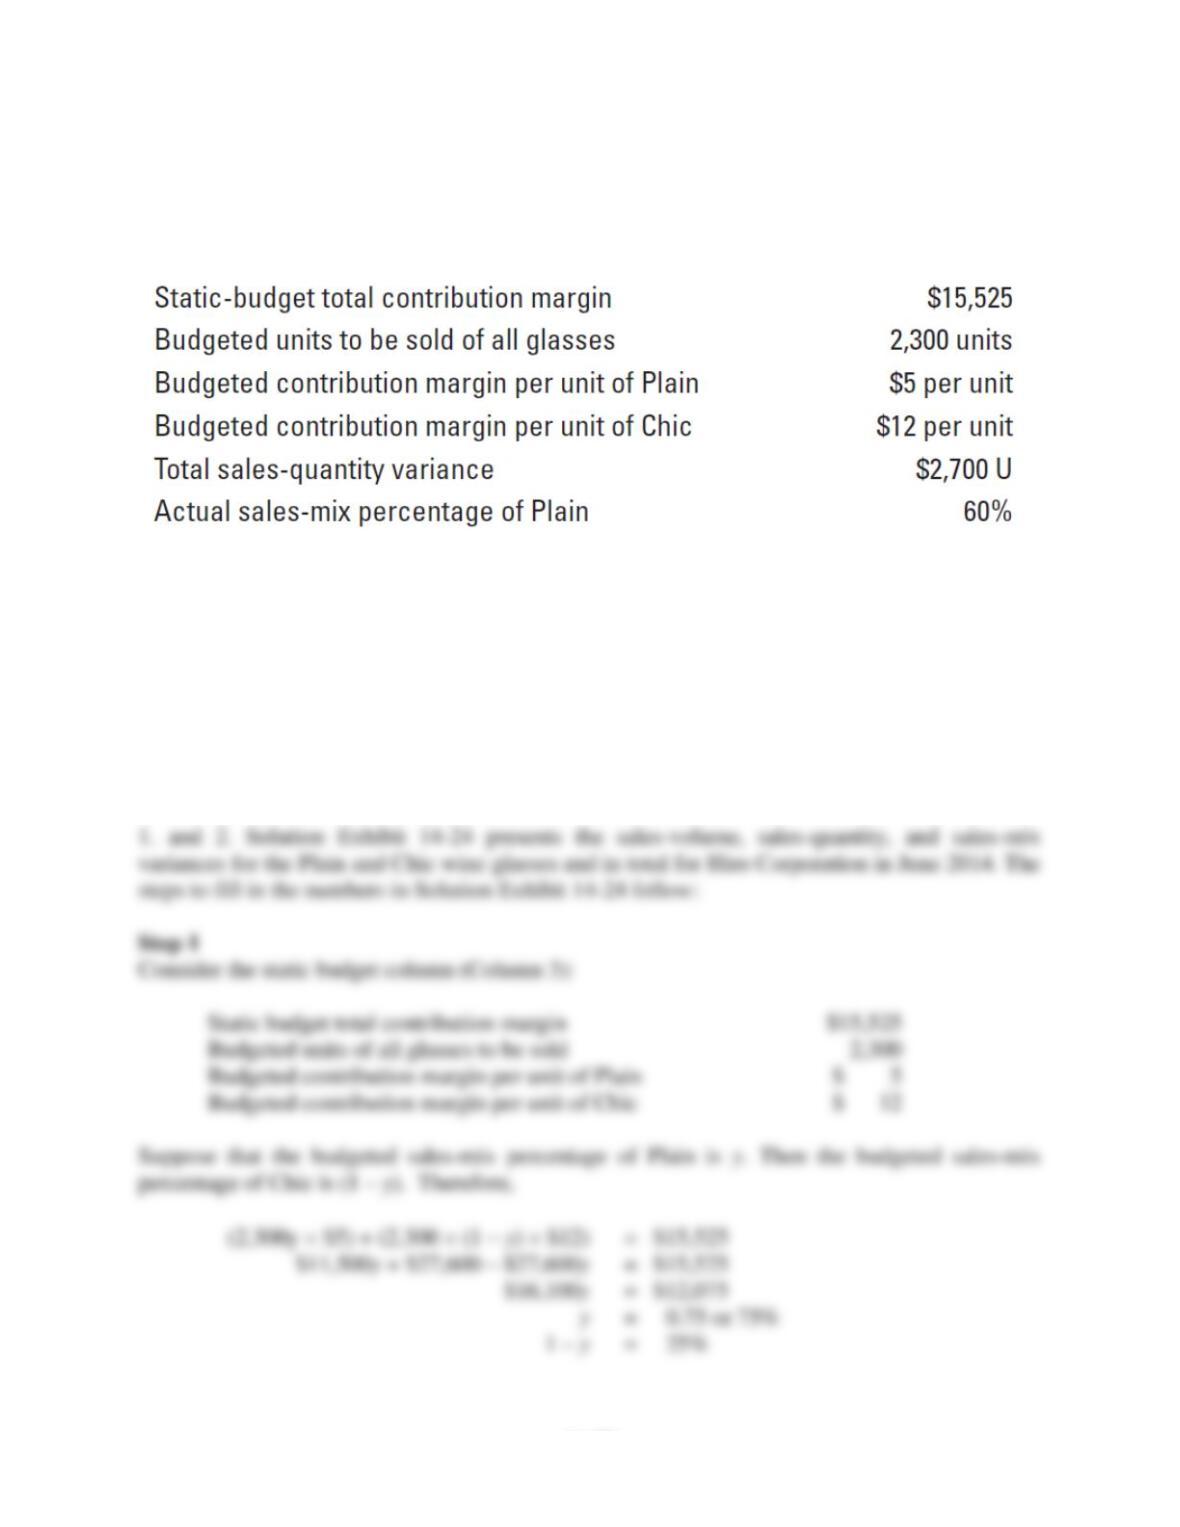
The Hiro Corporation sells two brands of wine glasses: Plain and Chic. Hiro provides the
following information for sales in the month of June 2014:
All variances are to be computed in contribution-margin terms.
Required:
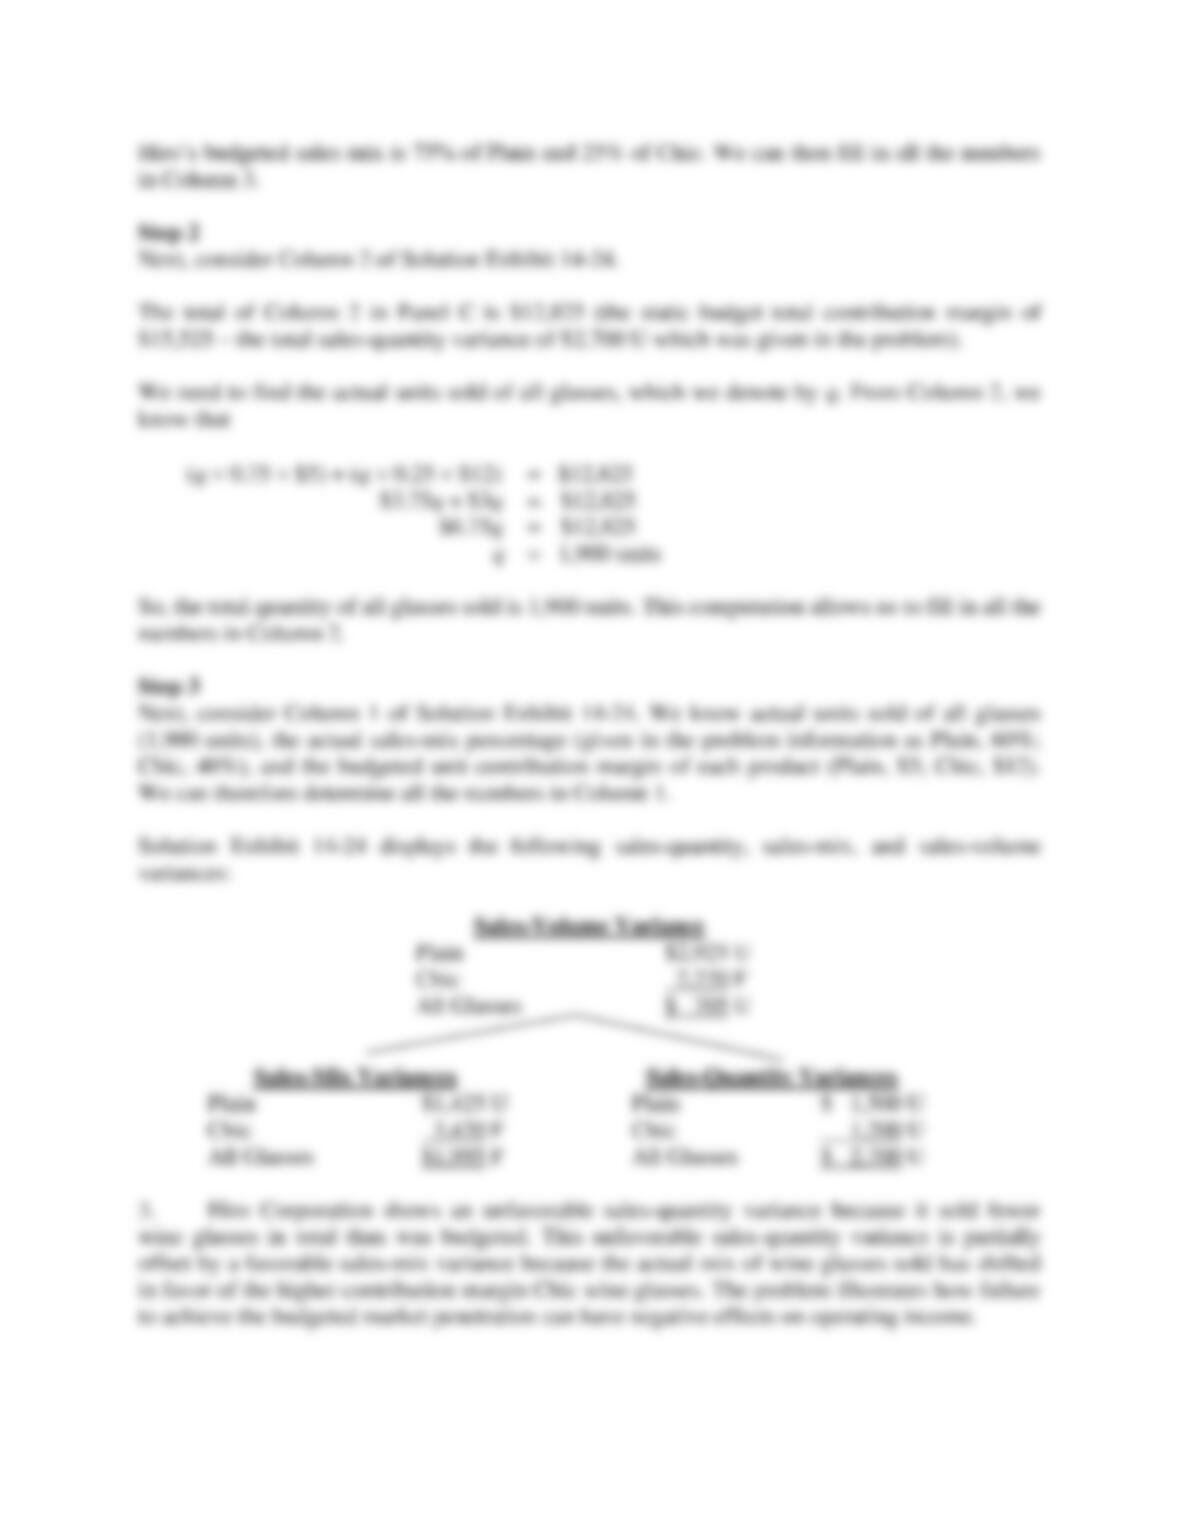
1. Calculate the sales-quantity variances for each product for June 2014.
2. Calculate the individual-product and total sales-mix variances for June 2014. Calculate the
individual-product and total sales-volume variances for June 2014.
3. Briefly describe the conclusions you can draw from the variances.
SOLUTION
14-28
14-29
SOLUTION EXHIBIT 14-24
Columnar Presentation of Sales-Volume, Sales-Quantity and Sales-Mix Variances
for Hiro Corporation
Flexible Budget:
Actual Units
of All Glasses Sold
Actual Sales Mix
Budgeted
Contribution
Margin per Unit
Actual Units
of All Glasses Sold
Budgeted Sales Mix
Budgeted
Contribution
Margin per Unit
Static Budget:
Budgeted Units
of All Glasses Sold
Budgeted Sales Mix
Budgeted
Contribution
Margin per Unit
Panel A:
Plain
(1,900 0.6) $5
1,140 $5
(1,900 0.75) $5
1,425 $5
(2,300 0.75) $5
1,725 $5
$5,700 $7,125 $8,625
$1,425 U $1,500 U
Sales-mix variance Sales-quantity variance
$2,925 U
Sales-volume variance
Panel B:
Chic
(1,900 0.4) $12
760 $12
(1,900 0.25) $12
475 $12
(2,300 0.25) $12
575 $12
$9,120 $5,700 $6,900
$3,420 F $1,200 U
Sales-mix variance Sales-quantity variance
$2,220 F
Sales-volume variance
Panel C:
All Glasses
$14,820 $12,825 $15,525
$1,995 F $2,700 U
Total sales-mix variance Total sales-quantity variance
$705 U
Total sales-volume variance
F = favorable effect on operating income; U = unfavorable effect on operating income.
14-30
14-25 (60 min.) Variance analysis, multiple products.
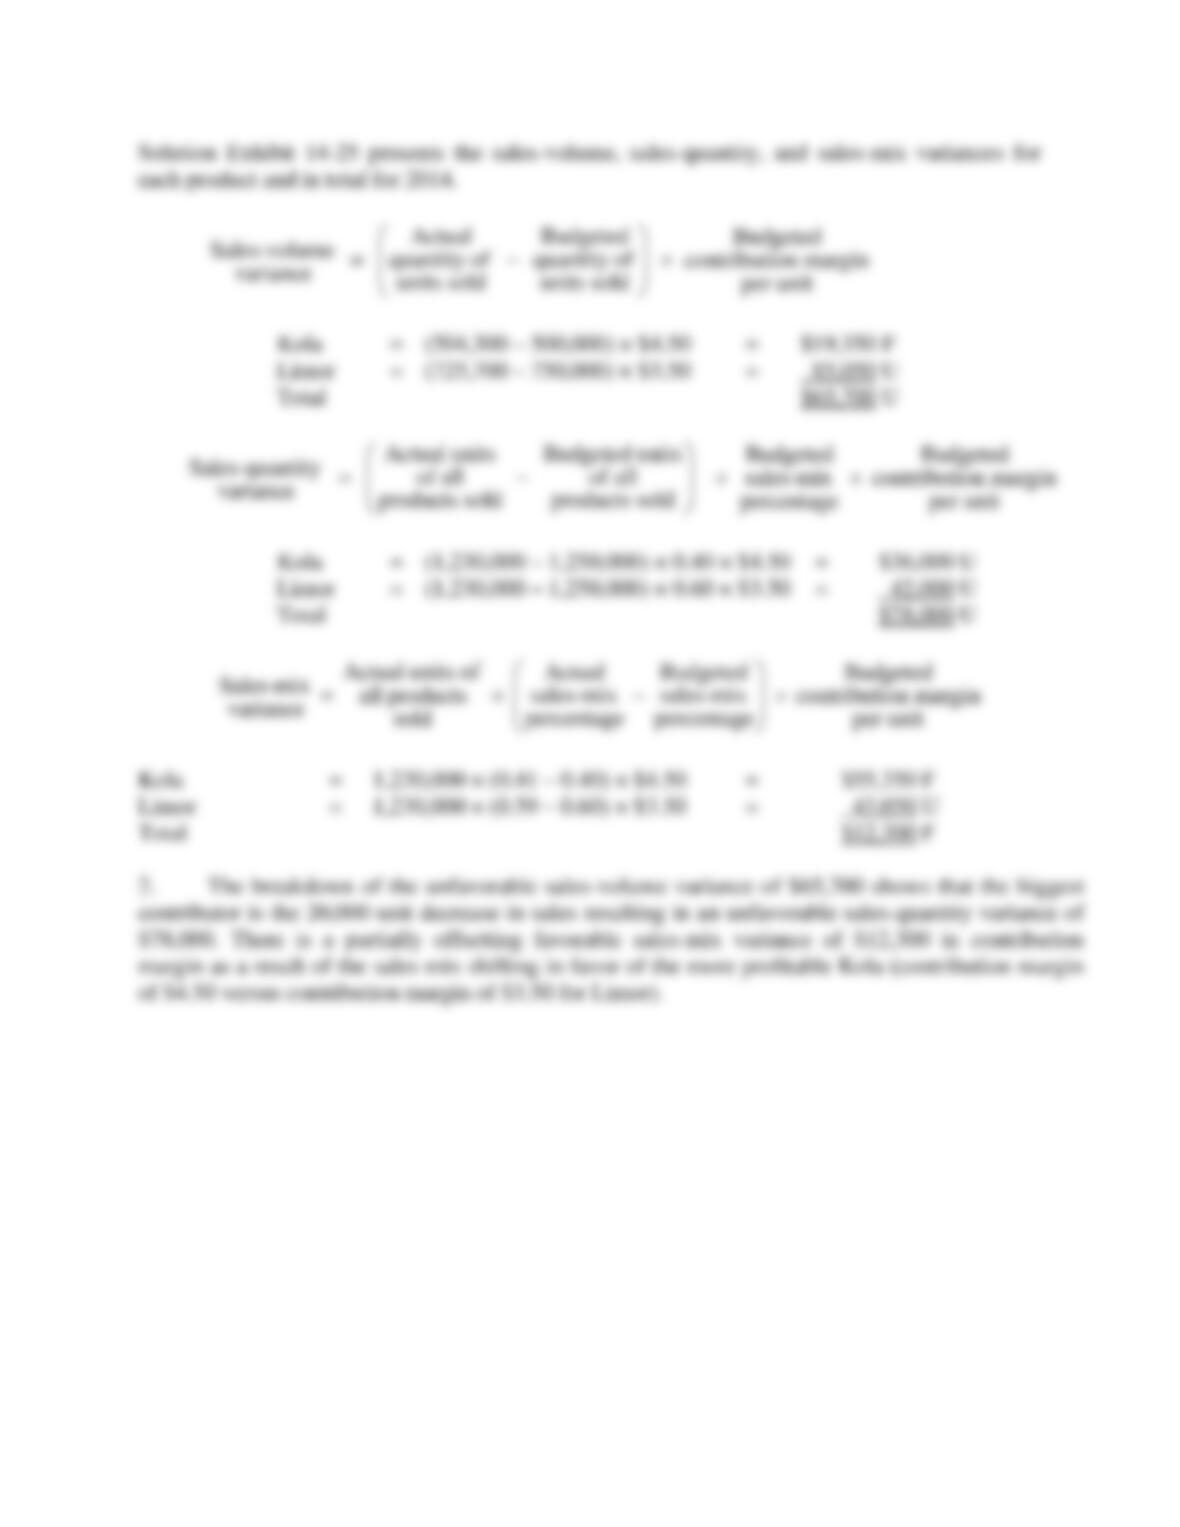
Soda-King manufactures and sells two soft drinks: Kola and Limor. Budgeted and actual results
for 2014 are as follows:
Required:
1. Compute the total sales-volume variance, the total sales-mix variance, and the total sales-
quantity variance. (Calculate all variances in terms of contribution margin.) Show results for
each product in your computations.
2. What inferences can you draw from the variances computed in requirement 1?
SOLUTION
14-31
14-32
SOLUTION EXHIBIT 14-25
Sales-Mix and Sales-Quantity Variance Analysis of Soda King for 2014
Flexible Budget: Static Budget:
Actual Units of Actual Units of Budgeted Units of
All Products Sold All Products Sold All Products Sold
Actual Sales Mix Budgeted Sales Mix Budgeted Sales Mix
Budgeted Contribution Budgeted Contribution Budgeted Contribution
Margin Per Unit Margin Per Unit Margin Per Unit
Kola 1,230,000 0.41 $4.50 = $2,269,350 1,230,000 0.4 $4.50 = $2,214,000 1,250,000 0.4 $4.50 = $2,250,000
Limor 1,230,000 0.59 $3.50 = 2,539,950 1,230,000 0.6 $3.50 = 2,583,000 1,250,000 0.6 $3.50 = 2,625,000
$4,809,300 $4,797,000 $4,875,000
$ 12,300 F $ 78,000 U
Sales-mix variance Sales-quantity variance
$65,700 U
Sales-volume variance
F = favorable effect on operating income; U= unfavorable effect on operating income
14-26 (20 min.) Market-share and market-size variances (continuation of 14-25).
Soda-King prepared the budget for 2014 assuming a 12.5% market share based on total sales in
the western region of the United States. The total soft drinks market was estimated to reach sales
of 10 million cartons in the region. However, actual total sales volume in the western region was
12.3 million cartons.
Required:
Calculate the market-share and market-size variances for Soda-King in 2014. (Calculate all
variances in terms of contribution margin.) Comment on the results.
SOLUTION
14-33
14-34
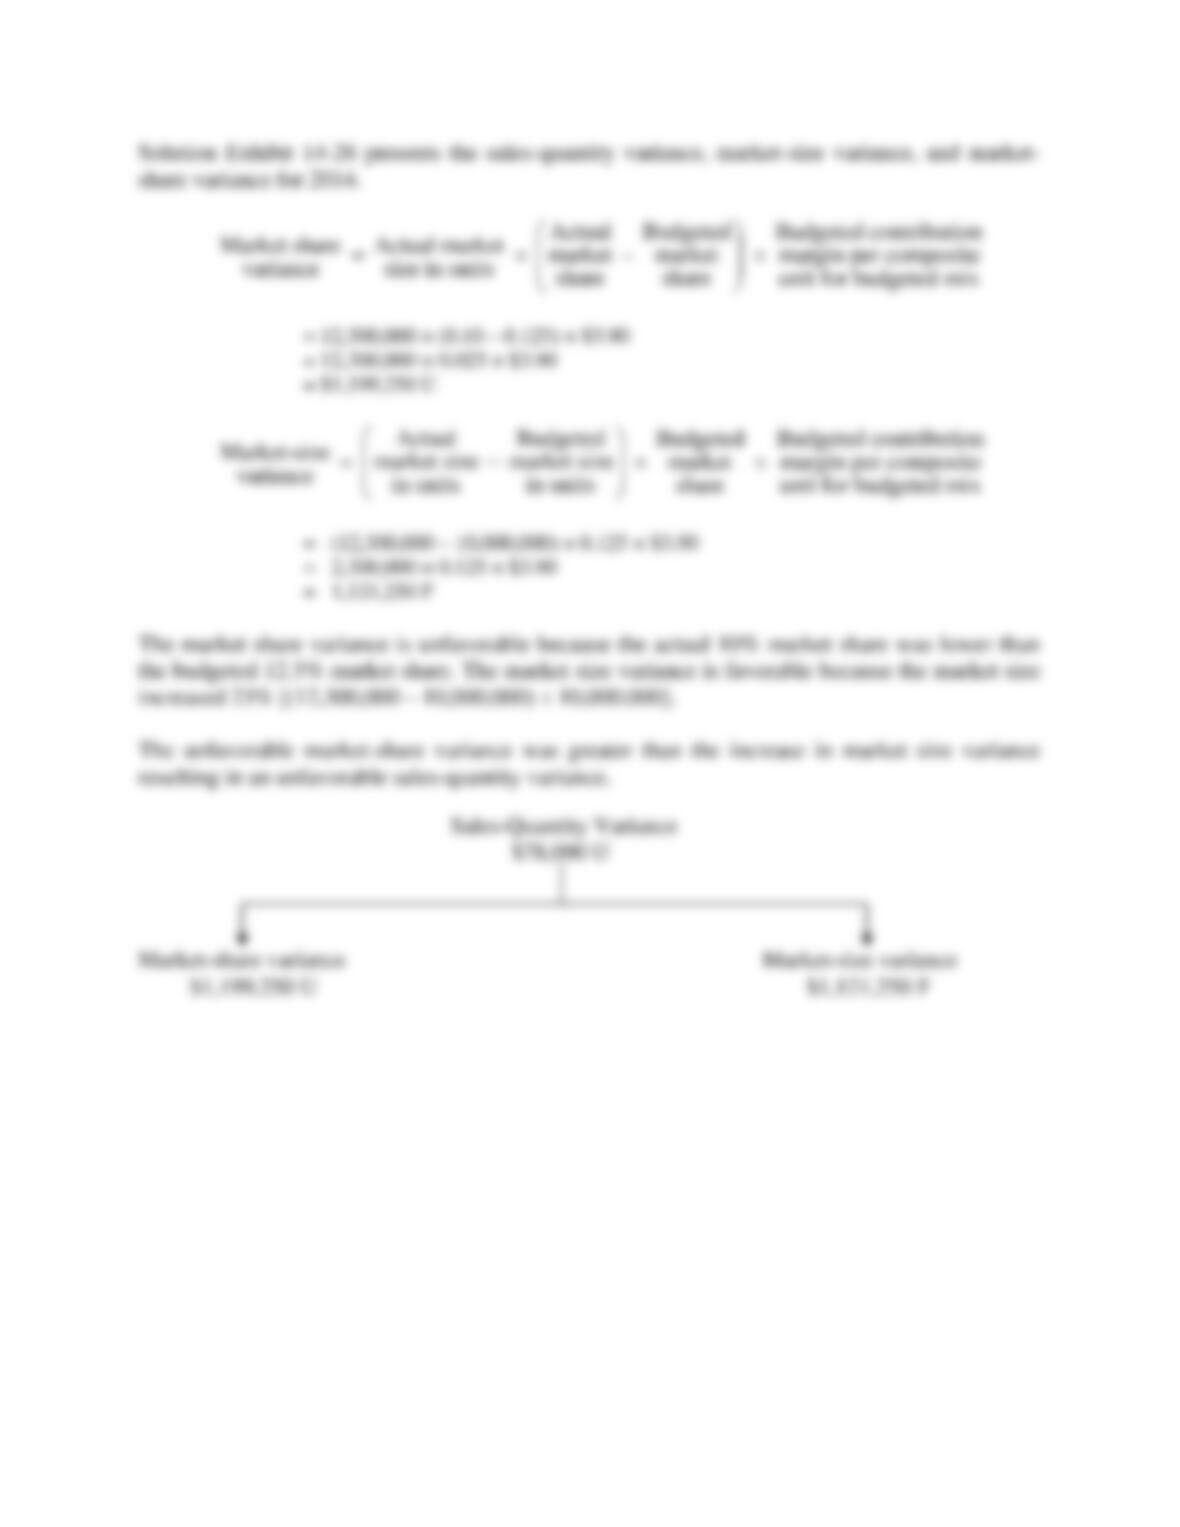
SOLUTION EXHIBIT 14-26
Market-Share and Market-Size Variance Analysis of Soda King for 2014
Static Budget:
Actual Market Size Actual Market Size Budgeted Market Size
Actual Market Share Budgeted Market Share Budgeted Market Share
Budgeted Average Budgeted Average Budgeted Average
Contribution Margin Contribution Margin Contribution Margin
Per Unit Per Unit Per Unit
12,300,000 0.10a $3.90b 12,300,000 0.125c $3.90b 10,000,000 0.125c $3.90b
$4,797,000 $5,996,250 $4,875,000
$1,199,250 U $1,121,250 F
Market-share variance Market-size variance
$78,000 U
Sales-quantity variance
F = favorable effect on operating income; U = unfavorable effect on operating income
aActual market share: 1,230,000 units ÷ 12,300,000 units = 0.10, or 10%
bBudgeted average contribution margin per unit $4,875,000 ÷ 1,250,000 units = $3.90 per unit
cBudgeted market share: 1,250,000 units ÷ 10,000,000 units = 0.125, or 12.5%
14-27 (30 min.) Purposes of cost allocation
Sarah Reynolds recently started a job as an administrative assistant in the cost accounting
department of Mize Manufacturing. New to the area of cost accounting, Sarah is puzzled by the
fact that one of Mize’s manufactured products, SR460, has a different cost depending on who
asks for it. When the marketing department requested the cost of SR460 in order to determine
pricing for the new catalog, Sarah was told to report one amount, but when a request came in the
very next day from the financial reporting department for the cost of SR460, she was told to
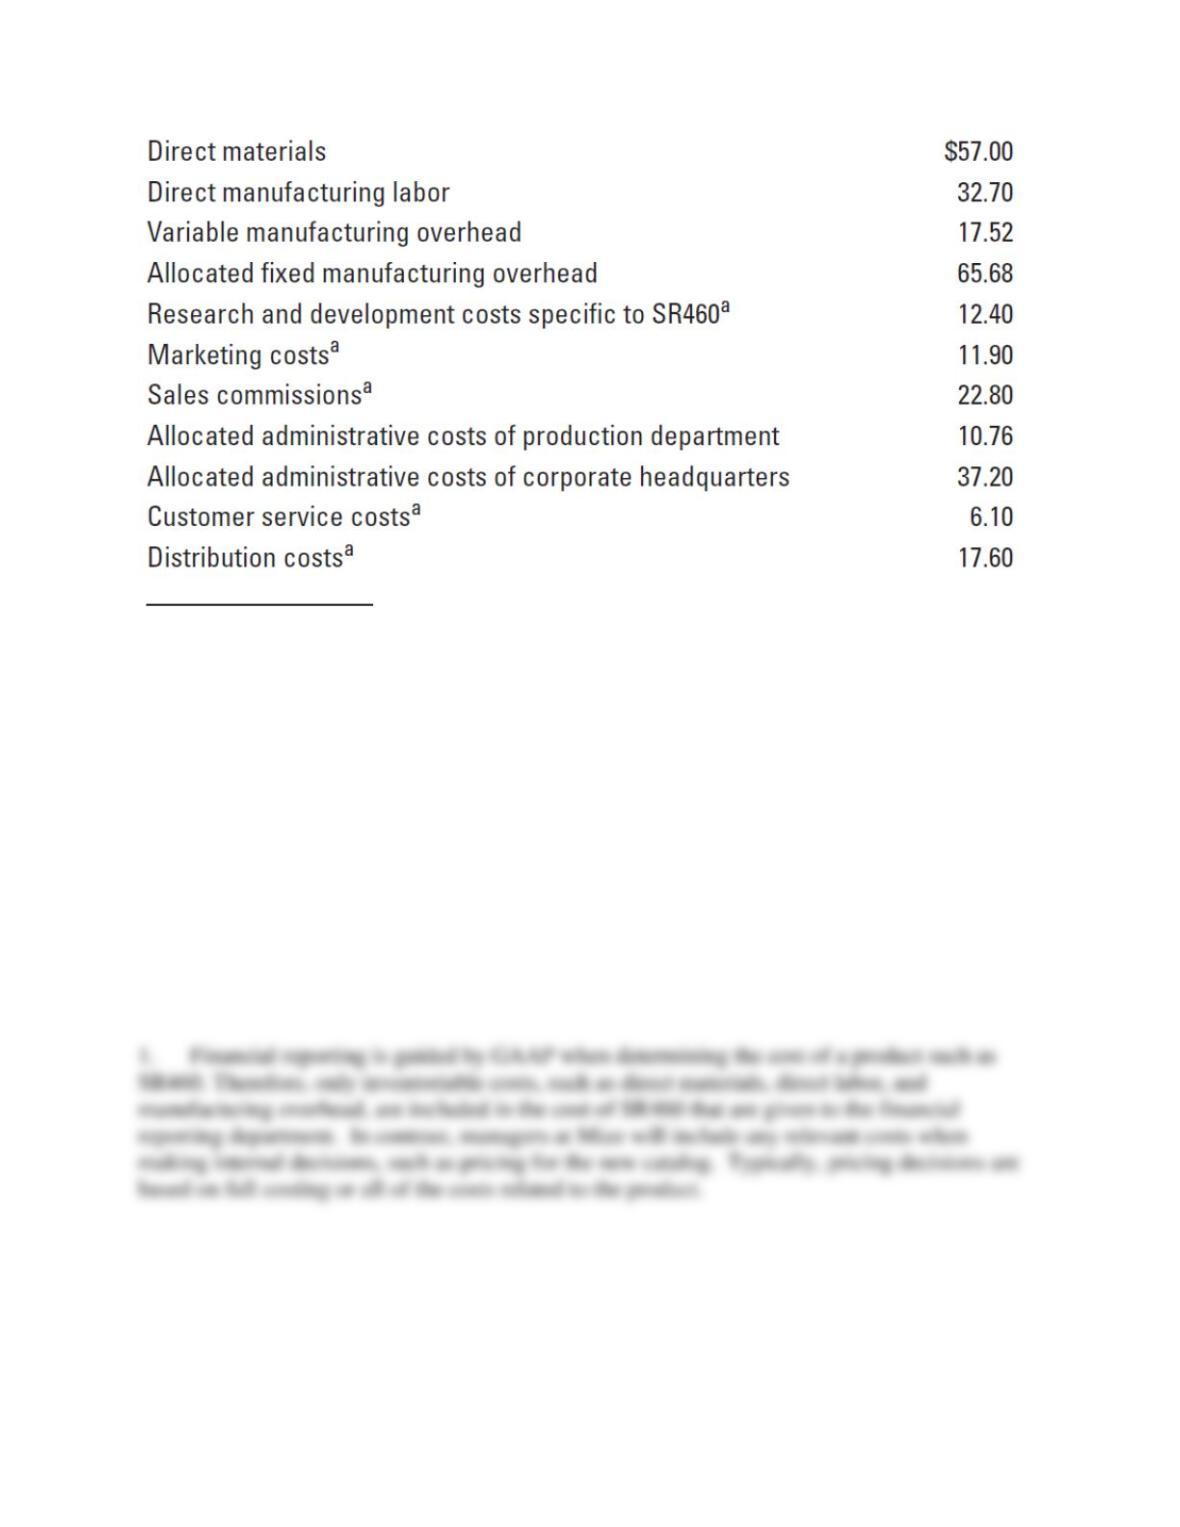
report a very different cost. Sarah runs a report using Mize’s cost accounting system, which
produces the following cost elements for one unit of SR460:
14-35
aThese costs are specific to SR460, but would not be eliminated if SR460 were purchased from
an outside supplier. Allocated costs would be reallocated elsewhere in the company should the
company cease production of SR460.
Required:
1. Explain to Sarah why the cost given to the marketing and financial reporting departments
would be different.
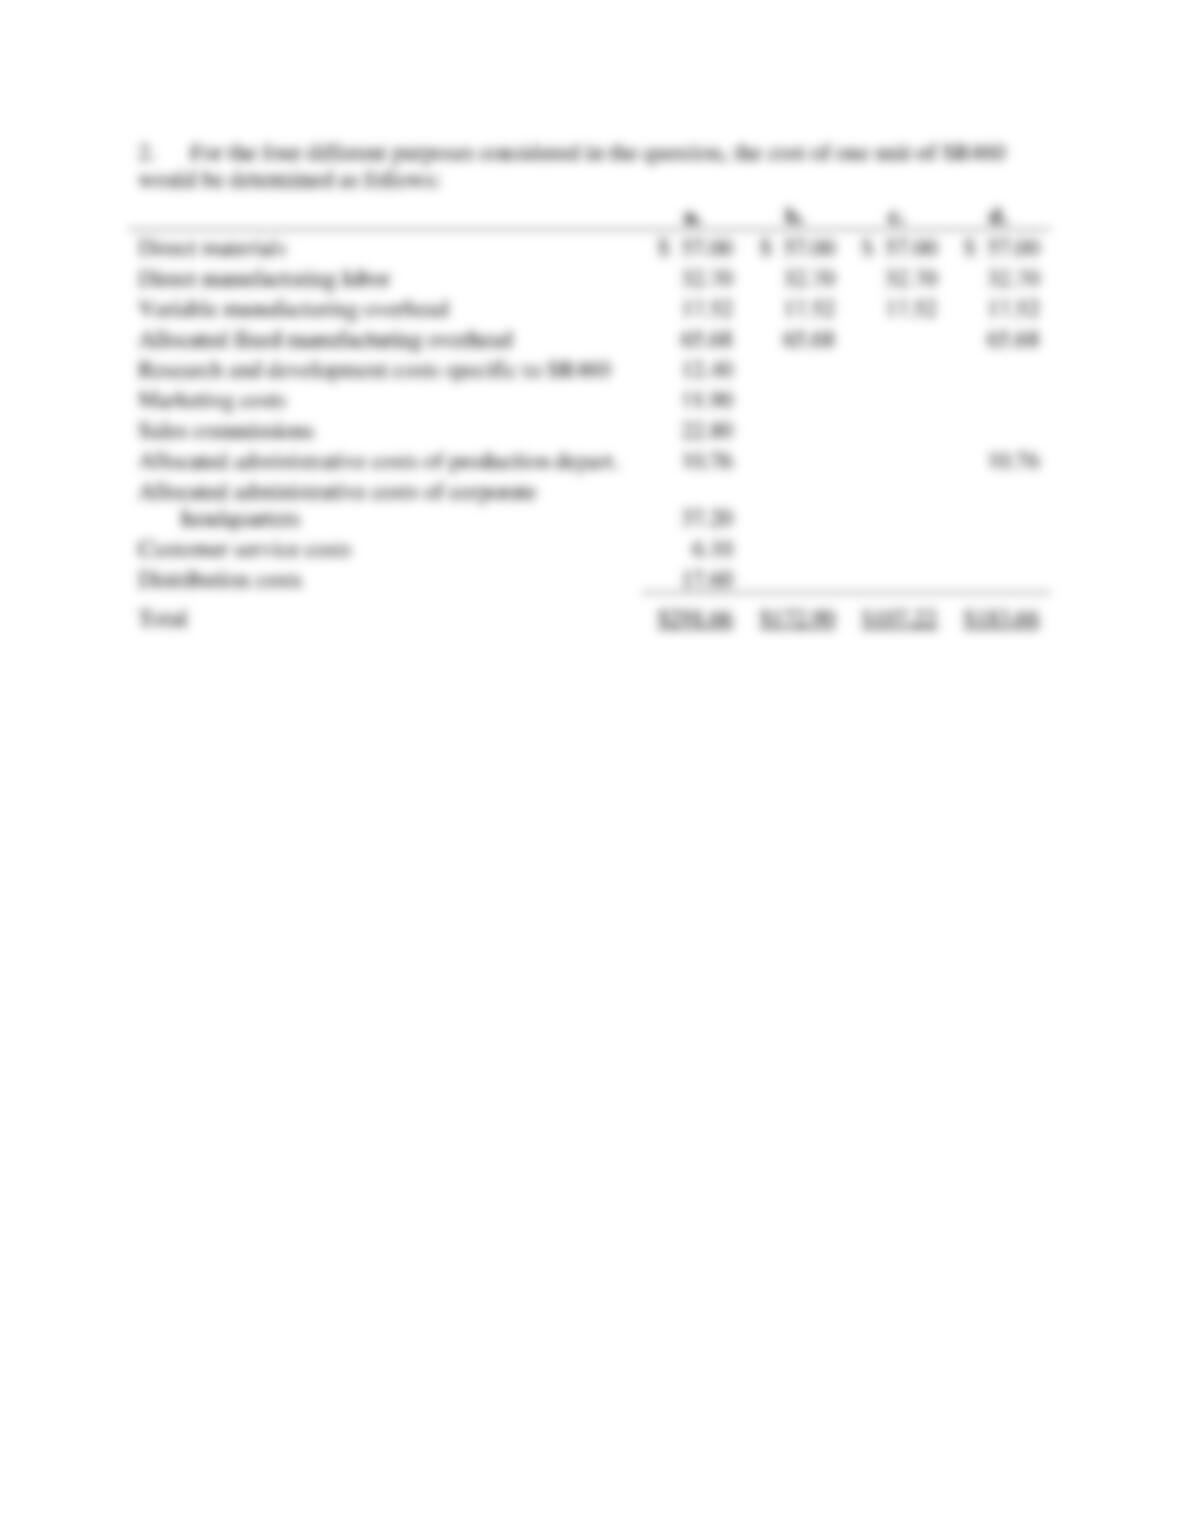
2. Calculate the cost of one unit of SR460 to determine the following:
a. The selling price of SR460
b. The cost of inventory for financial reporting
c. Whether to continue manufacturing SR460 or to purchase it from an outside source
(Assume that SR460 is used as a component in one of Mize’s other products.)
d. The ability of Mize’s production manager to control costs
SOLUTION
14-36
14-28 (25 min.) Customer-profitability.
Bracelet Delights is a new company that manufactures custom jewelry. Bracelet Delights
currently has six customers referenced by customer number: 01, 02, 03, 04, 05, and 06. Besides
the costs of making the jewelry, the company has the following activities:
Required:
1. Customer orders. The salespeople, designers, and jewelry makers spend time with the
customer. The cost driver rate is $42 per hour spent with a customer.
2. Customer fittings. Before the jewelry piece is completed, the customer may come in to make
sure it looks right and fits properly. Cost driver rate is $30 per hour.
3. Rush orders. Some customers want their jewelry quickly. The cost driver rate is $90 per rush
order.
4. Number of customer return visits. Customers may return jewelry up to 30 days after the
pickup of the jewelry to have something refitted or repaired at no charge. The cost driver rate
is $40 per return visit.
Information about the six customers follows. Some customers purchased multiple items. The cost
of the jewelry is 60% of the selling price.
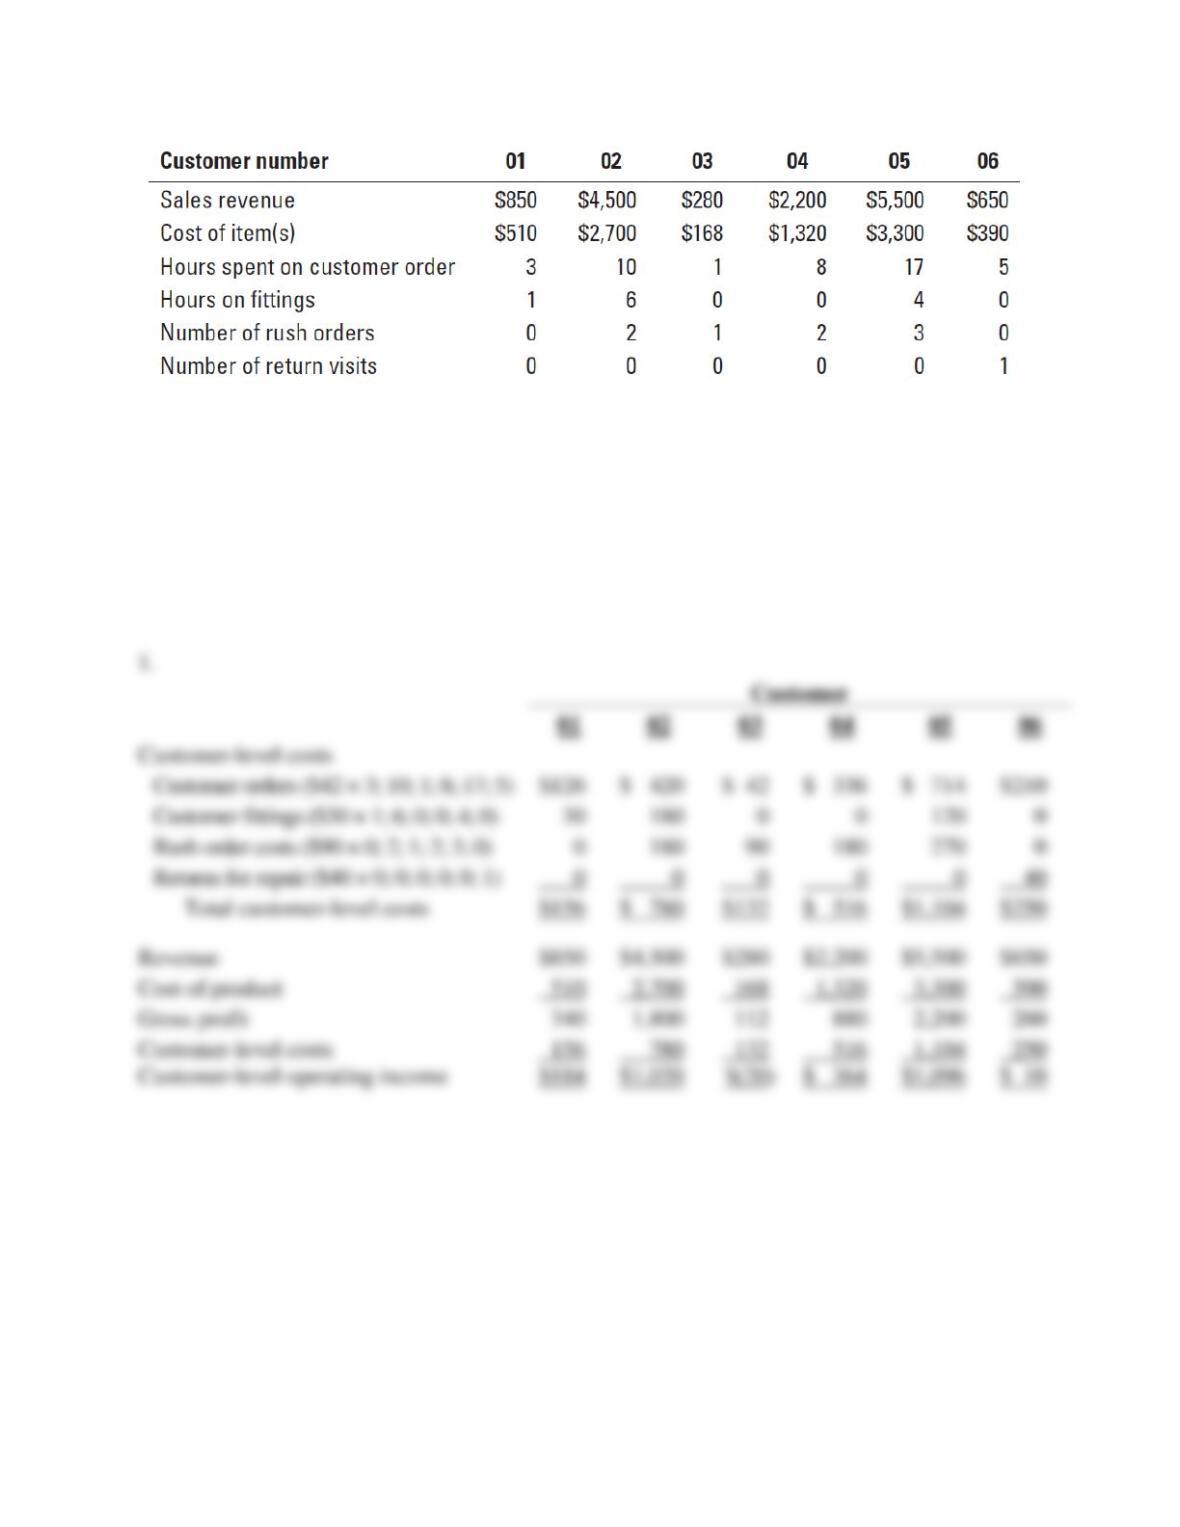
14-37
Required:
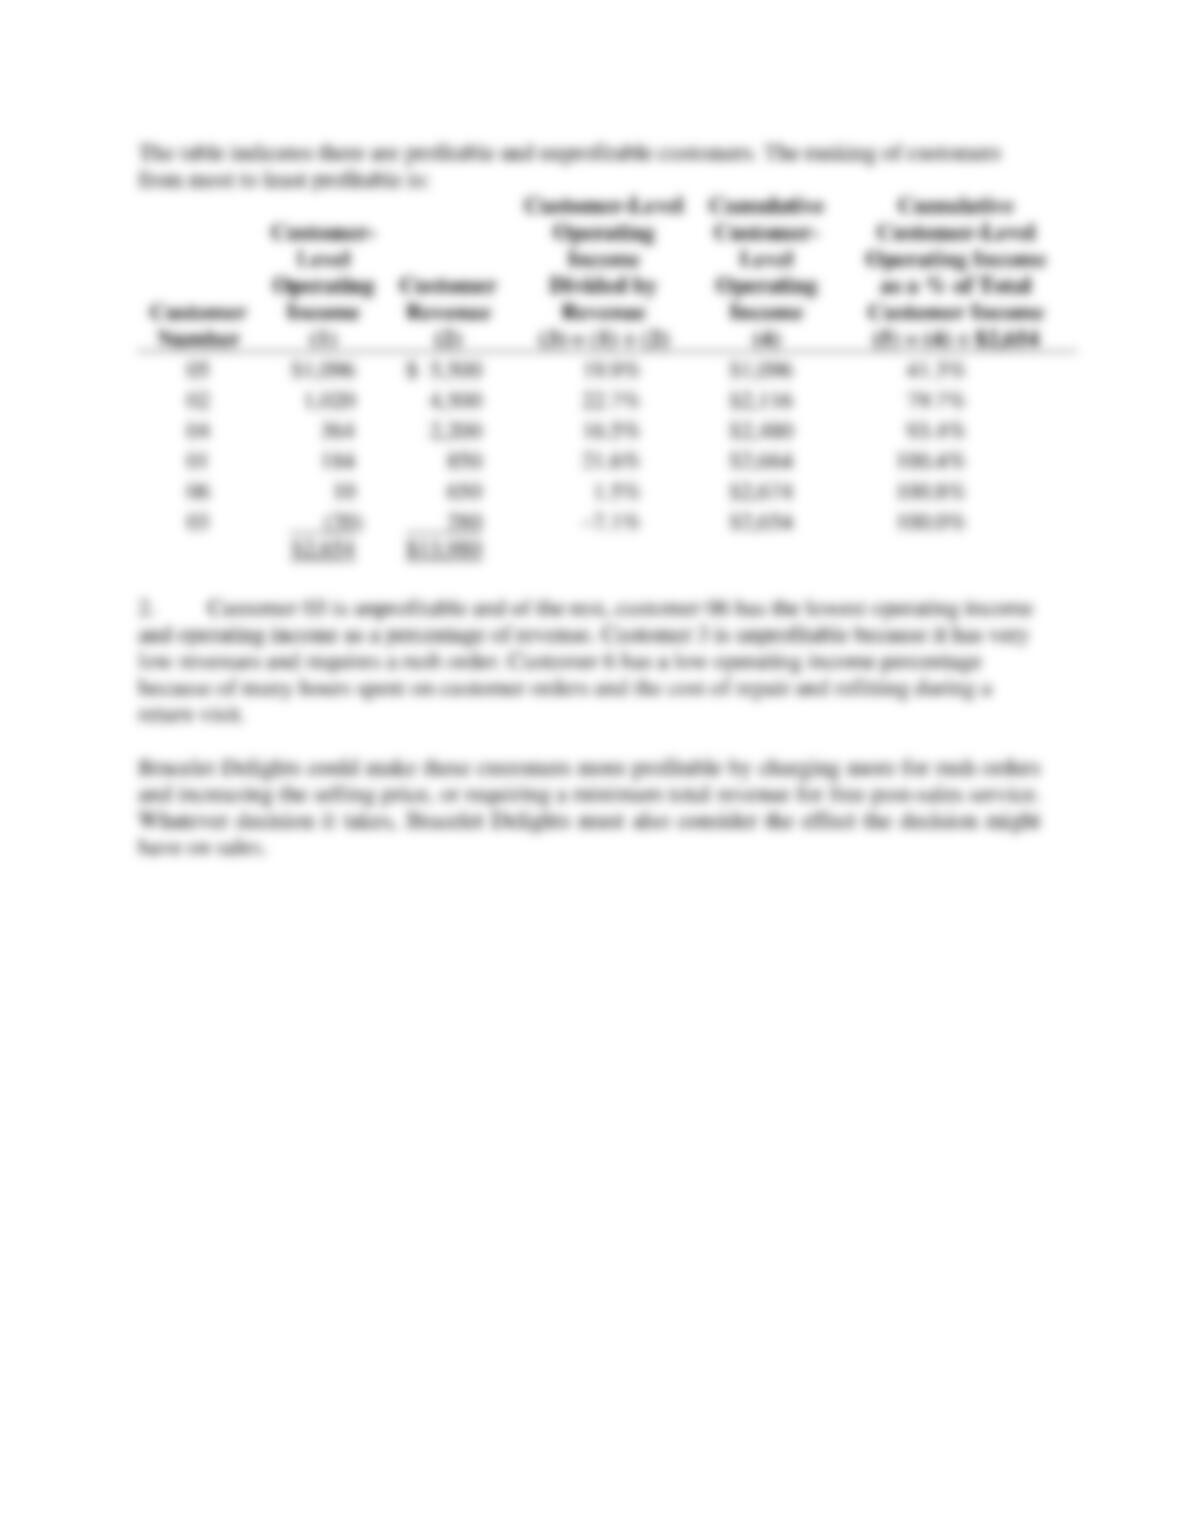
1. Calculate the customer-level operating income for each customer. Rank the customers in
order of most to least profitable and prepare a customer-profitability analysis, as in Exhibits
14-3 and 14-4.
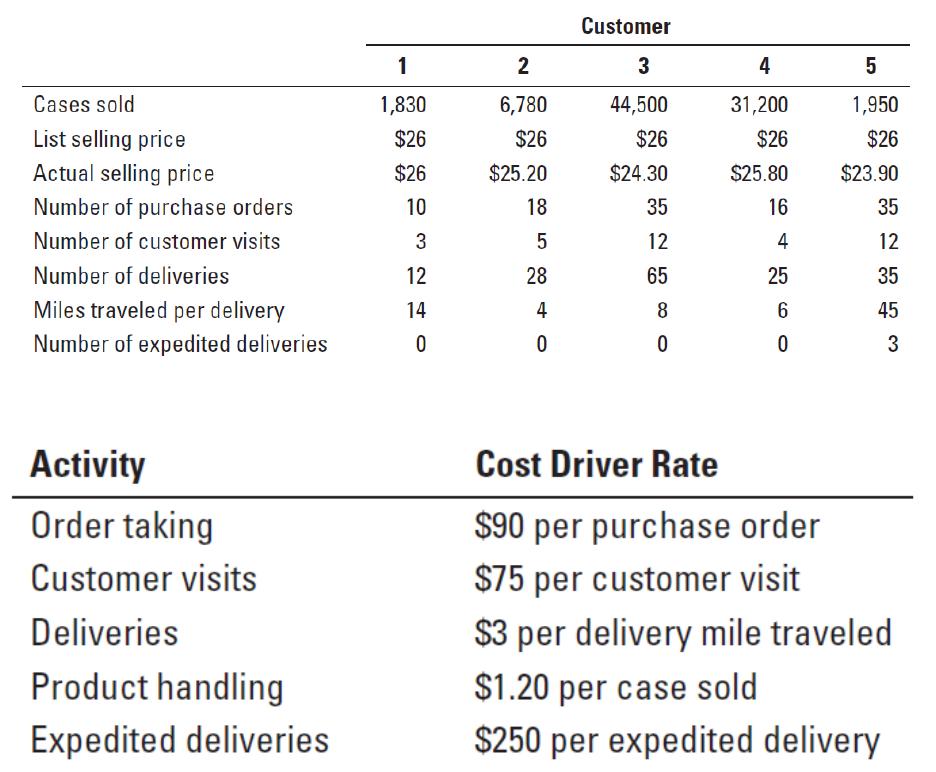
2. Are any customers unprofitable? What is causing this? What should Bracelet Delights do
about these customers?
SOLUTION
14-38
14-39
14-29 (30 min.) Customer profitability, distribution.
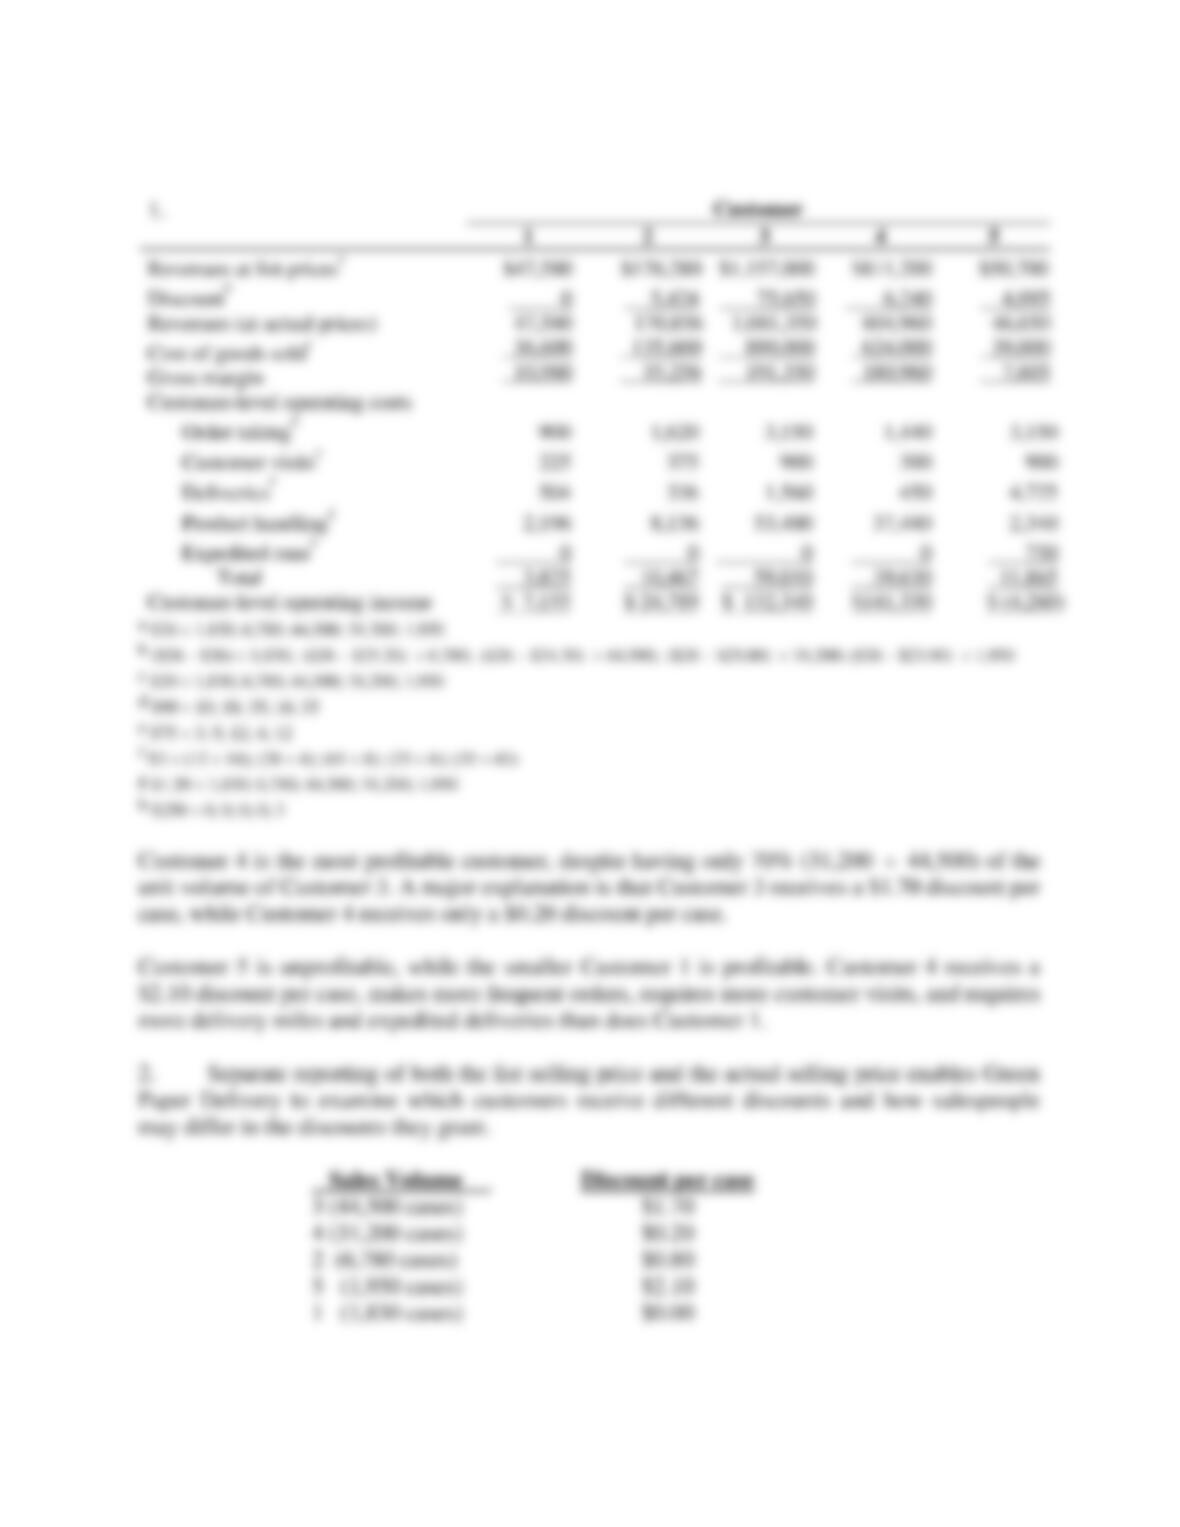
Green Paper Delivery has decided to analyze the profitability of five new customers. It buys
recycled paper at $20 per case and sells to retail customers at a list price of $26 per case. Data
pertaining to the five customers are:
Green Paper Delivery’s five activities and their cost drivers are:
Required:
1. Compute the customer-level operating income of each of the five retail customers now being
examined (1, 2, 3, 4, and 5). Comment on the results.
2. What insights do managers gain by reporting both the list selling price and the actual selling
price for each customer?
3. What factors should managers consider in deciding whether to drop one or more of the five
customers?
14-40
SOLUTION