14–21
Exercise 14.14 (Concluded)
5. Gainsharing provides a strong incentive for managers to improve quality and
reduce quality costs. Gainsharing is a good idea, provided the incentive sys-
tem is carefully designed. The bonus must be truly based on quality im-
Exercise 14.15
1. Only four of the activities should be implemented: quality training, process
control, supplier evaluation, and engineering redesign. Each of these four ac-
the amount spent for product inspection and prototype testing.
Total quality costs:
Current quality control …………. $ 160,000
Quality training ……………………. 160,000
Process control ……………………. 200,000
14–22
Exercise 14.15 (Concluded)
2. a. Total quality costs were reduced by $736,000 ($1,600,000 – $864,000).
Quality training increased costs by $160,000 but reduced failure costs by
$400,000, for a net gain of $240,000. Process control increased costs by
$200,000 but decreased failure costs by $320,000, for a net gain of
$120,000. Supplier evaluation increased costs by $120,000 but decreased
b. Distribution percentage:
Control costs:* $680,000/$864,000 = 79% (rounded)
Failure costs: $184,000/$864,000 = 21% (rounded)
3. All of the same activities would be adopted plus prototype testing. Of the ac-
tivities adopted, quality training, supplier evaluation, engineering redesign,
and prototype testing are all prevention activities and so would not be count-
ed in the cost reduction calculation. Failure costs would now be $104,000
(prototype addition reduces failure costs by an additional $80,000). The initial
14–23
Exercise 14.16
1. Quality costs, 2014 …………….. $110,000
2. Tru-Delite Frozen Desserts, Inc.
Long-Range Performance Report
For the Year Ended December 31, 2015
Actual Costs* Long-Range
2015 Target Costs Variance
Prevention costs:
Training program …………………… $ 6,000 $ 3,750 $ 2,250 U
Supplier evaluation ………………… 13,000 4,688 8,312 U
Internal failure costs:
Scrap …………………………………….. $18,750 $ 2,812** $ 15,938 U
Rework …………………………..……… 12,500 0 12,500 U
Total internal failure costs …. $31,250 $ 2,812 $ 28,438 U
External failure costs:
Consumer complaints ……………. $ 6,250 $ 0 $ 6,250 U
Lost sales, incorrect labeling …. 0 0 0
14–24
Exercise 14.16 (Concluded)
3. Prevention and some appraisal costs can be interpreted as value-added
costs. All failure costs are non-value-added. Thus, the distribution of costs
4. There would be a $77,750 increase in profits in 2019 if total quality costs are
2.5 percent of sales and the targeted distribution is achieved (the $77,750 in-
Exercise 14.17
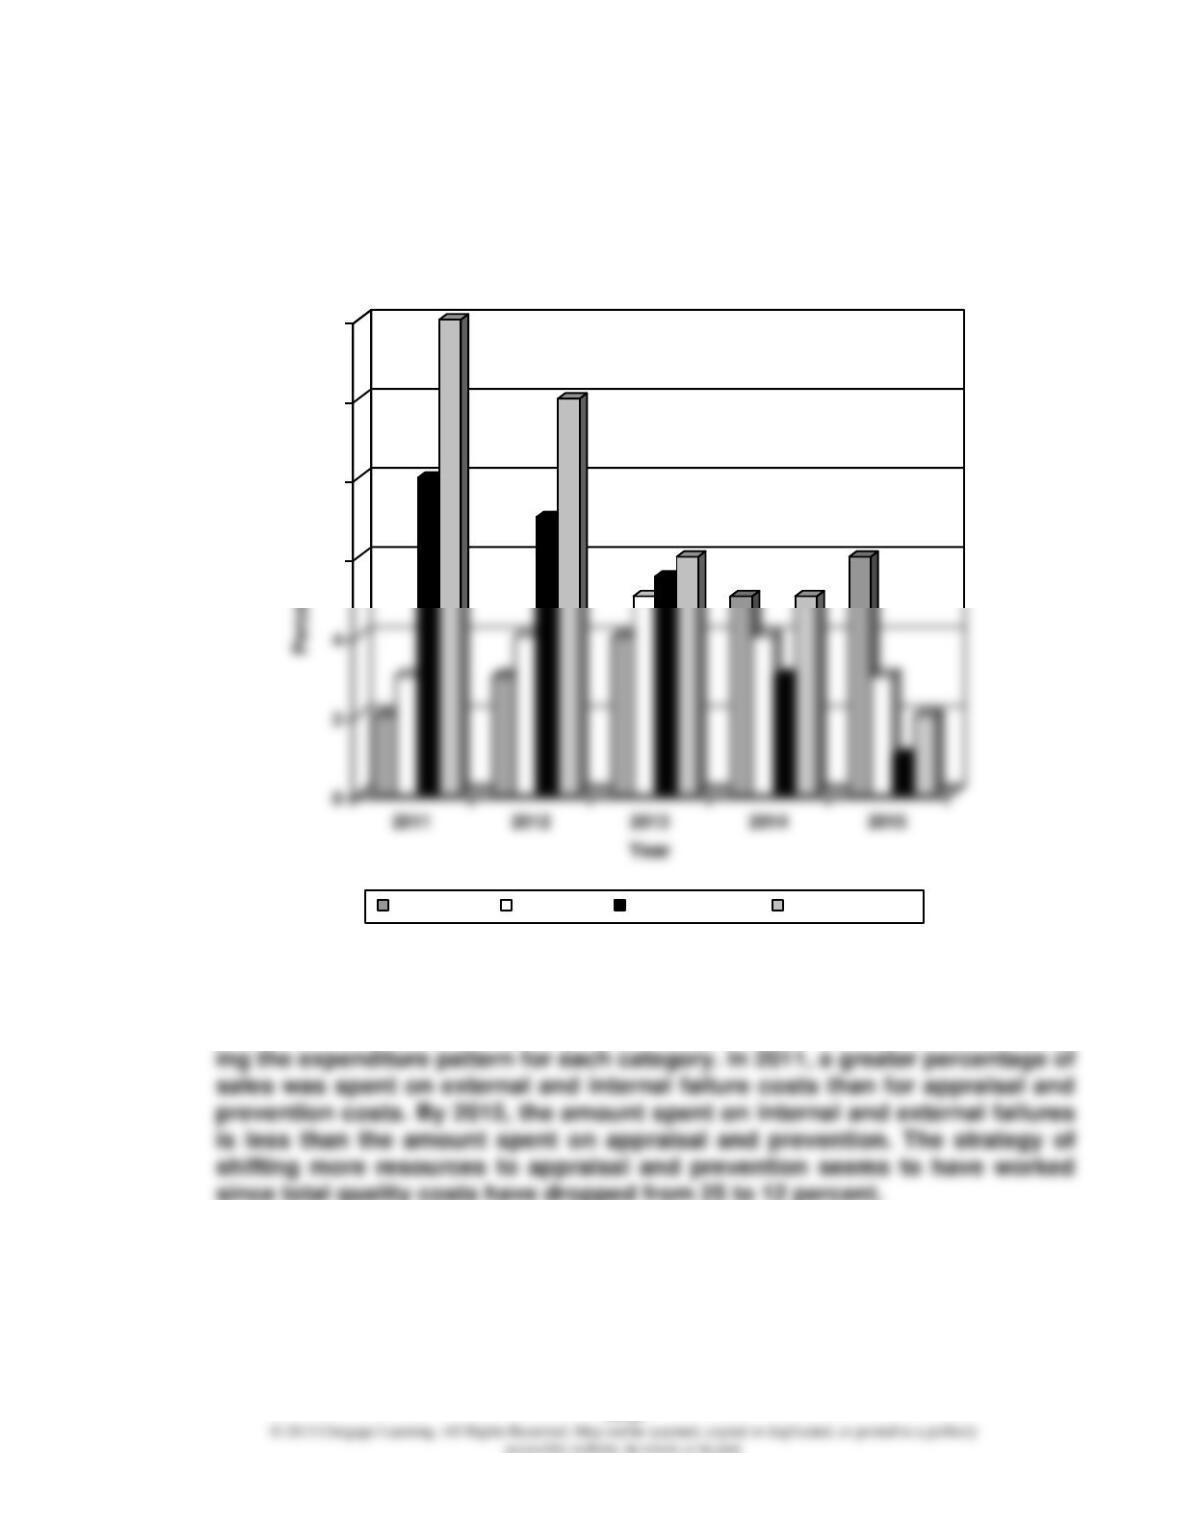
1. Multiple-Period Trend Graph: Total Quality Costs
20.5
17
12
10
15
30
14–25
Exercise 14.17 (Continued)
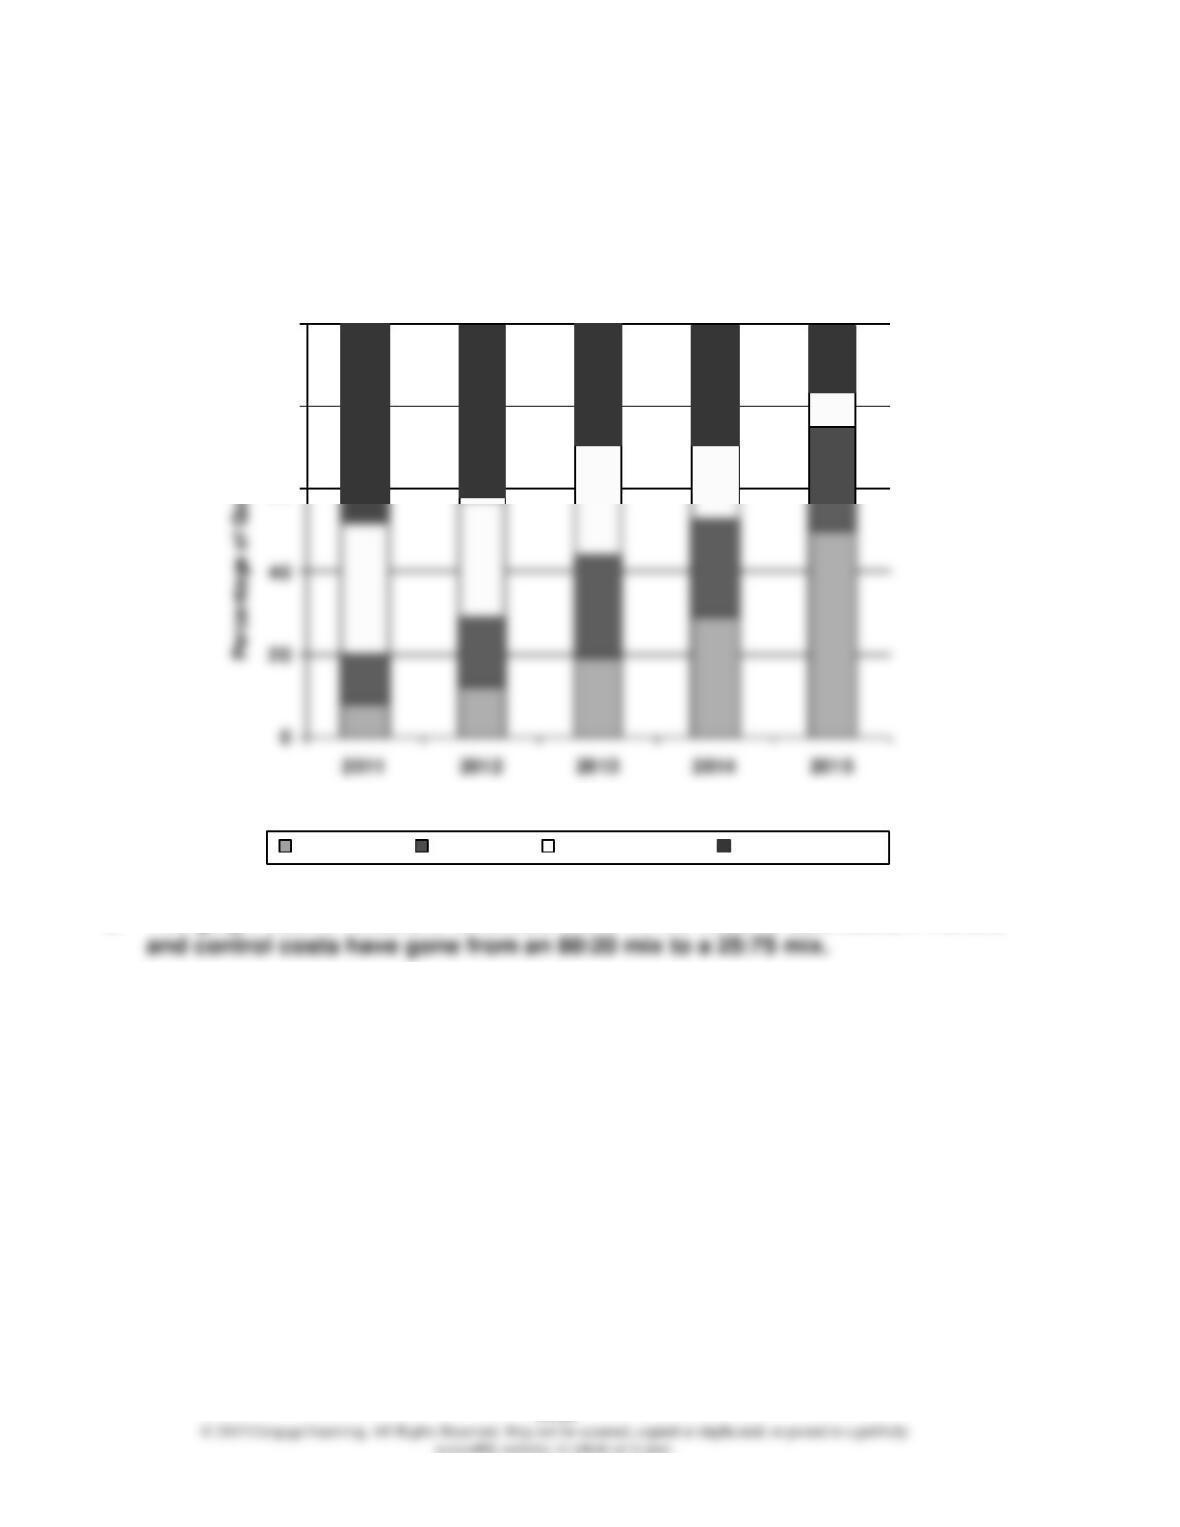
6
8
10
12
Multiple-Period Trend Graph: Individual Quality
Cost Categories
Prevention Appraisal Internal Failure External Failure
2. There have been significant reductions in internal and external failure costs.
Prevention costs increased; appraisal costs remained the same. The graph
reveals the trend for each category of costs and how management is chang-
14–26
Exercise 14.17 (Concluded)
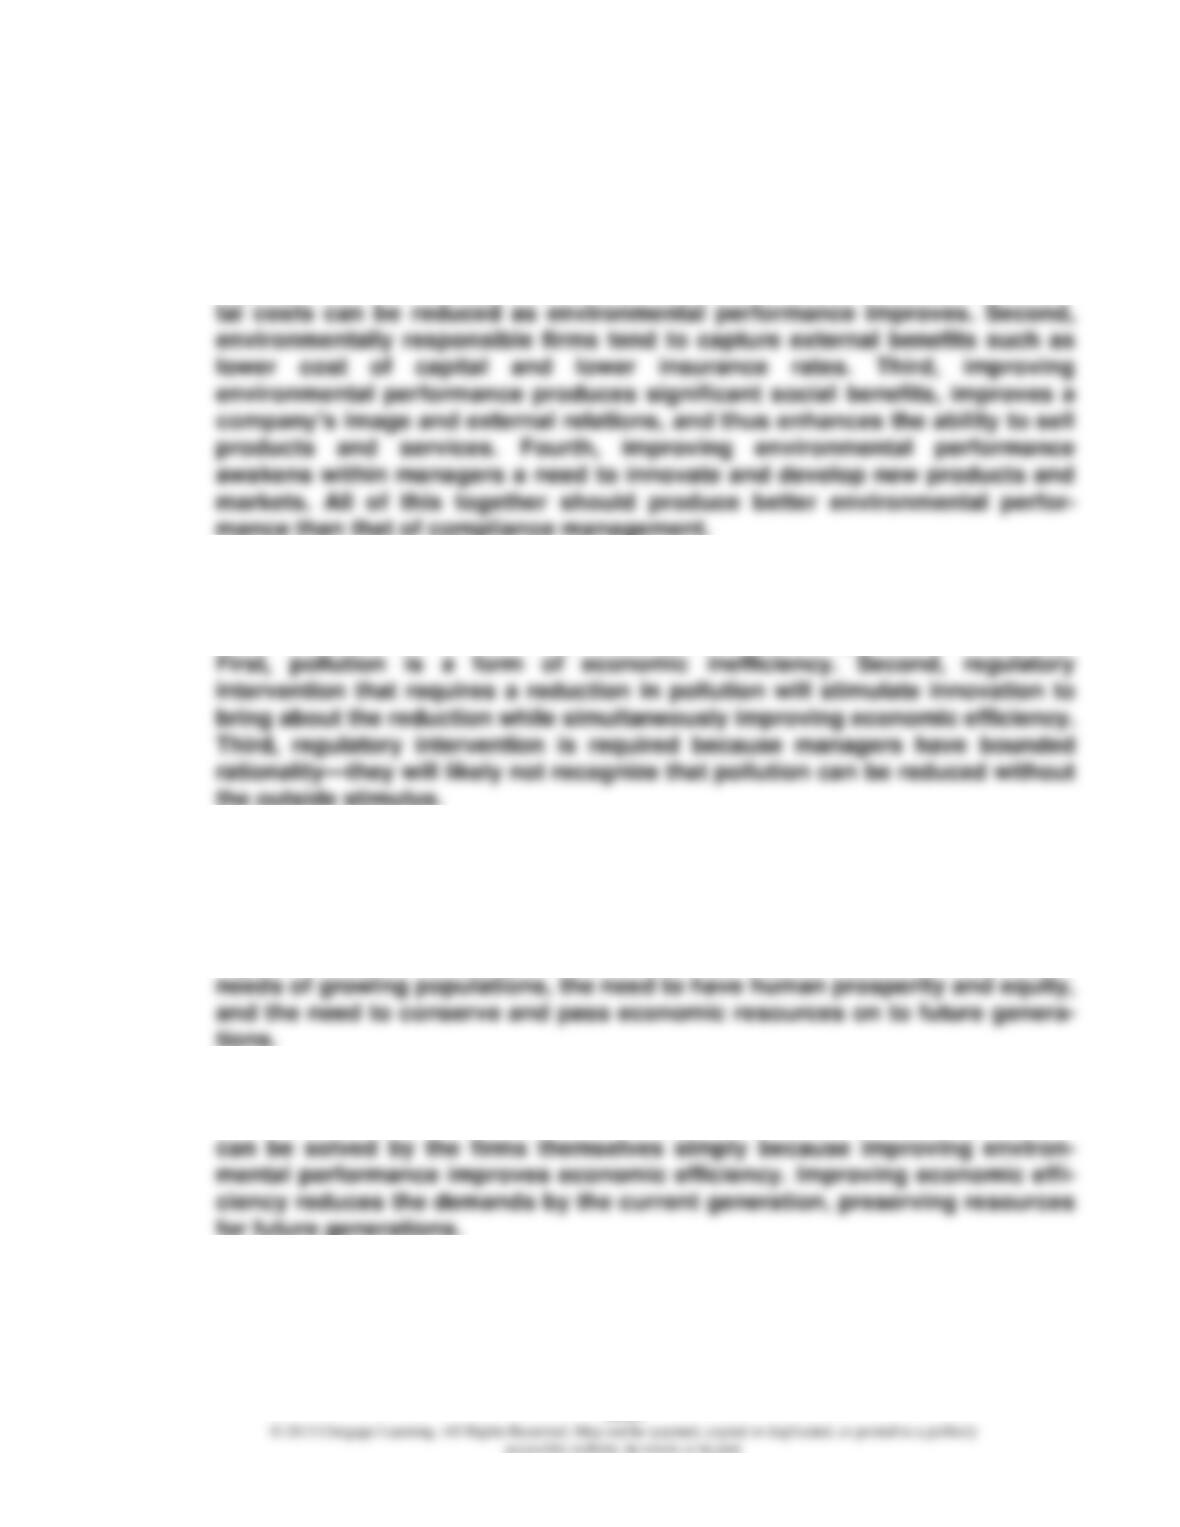
Multiple–Period Trend Graph: Relative Quality
Costs
60
80
100
Year
Prevention Appraisal Internal Failure External Failure
3. The graph above reveals a favorable trend in the relative distribution. Failure
14–27
Exercise 14.18
1. Ecoefficiency means that more competitively priced goods and services can
be produced while simultaneously reducing negative environmental impacts.
Thus, ecological and economic performance can and should be complemen-
tary. Several factors support this view. First, evidence exists that environmen-
2. The guided ecoefficiency view requires that regulatory intervention specify
only the desired pollution reductions without specifying how these reductions
are to be achieved. Several key assumptions underlie guided ecoefficiency.
Exercise 14.19
1. Sustainable development meets the needs of the present without compromis-
ing the ability of future generations to meet their needs. It considers the
2. Ecoefficiency is a critical breakthrough because it establishes a link between
economic activity and environmental impacts. Most environmental problems
Exercise 14.19 (Concluded)
3. Possible reasons include the following: (1) the ecoefficiency paradigm is not
valid; (2) many managers still are holding hard and fast to the traditional view:
improving environmental performance and economic efficiency are
incompatible objectives; (3) the ecoefficiency paradigm is not widely known;
Exercise 14.20
2. Prevention (SD)
4. External failure (societal)
6. Prevention (SD)
8. External failure (societal)
10. External failure (societal)
12. External failure (private)
14. Detection (SD)
16. Detection (SD)
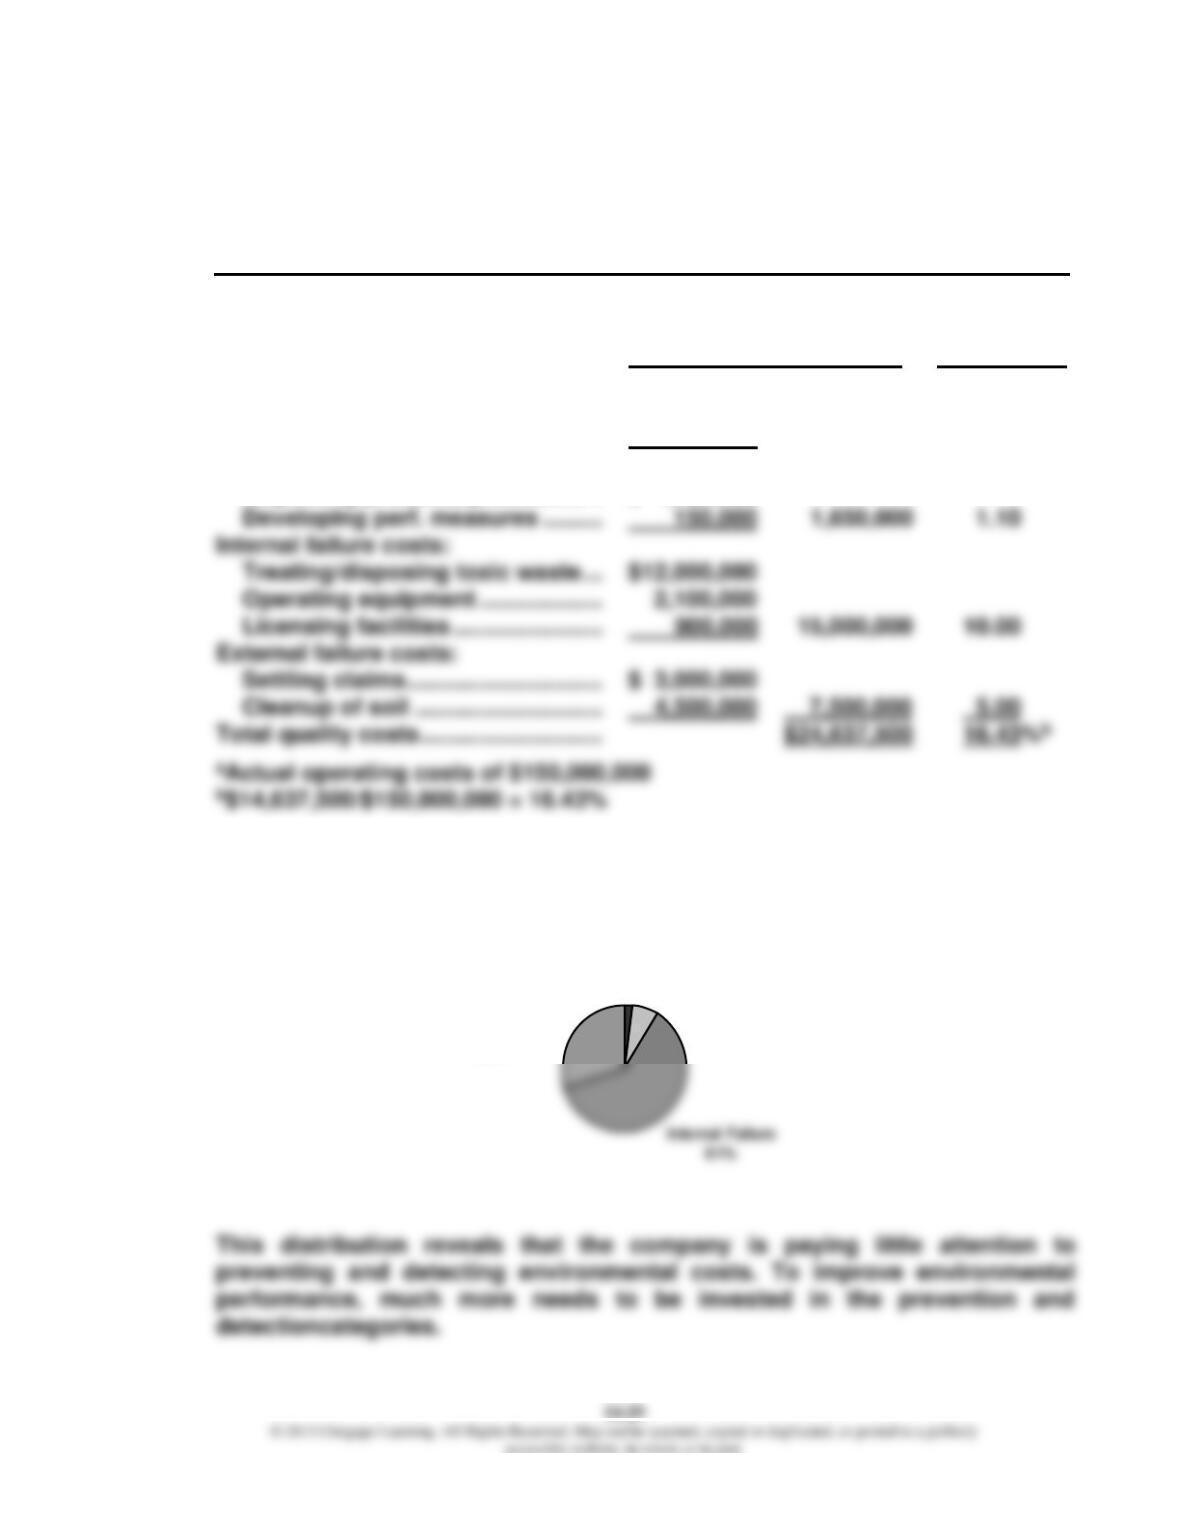
Exercise 14.21
1. Bing Pharmaceuticals
Environmental Cost Report
For the Year Ended December 31, 2015
Percentage
of Operating
Environmental Costs Costsa
Prevention costs:
Evaluating/selecting suppliers …. $ 300,000
Recycling products …………………. 187,500 $ 487,500 0.33%
Detection costs:
Inspecting products/processes .. $ 1,500,000
2.
Relative Distribution: Environmental Costs
Prevention
2%
Detection
7%
External Failure
30%
Exercise 14.22
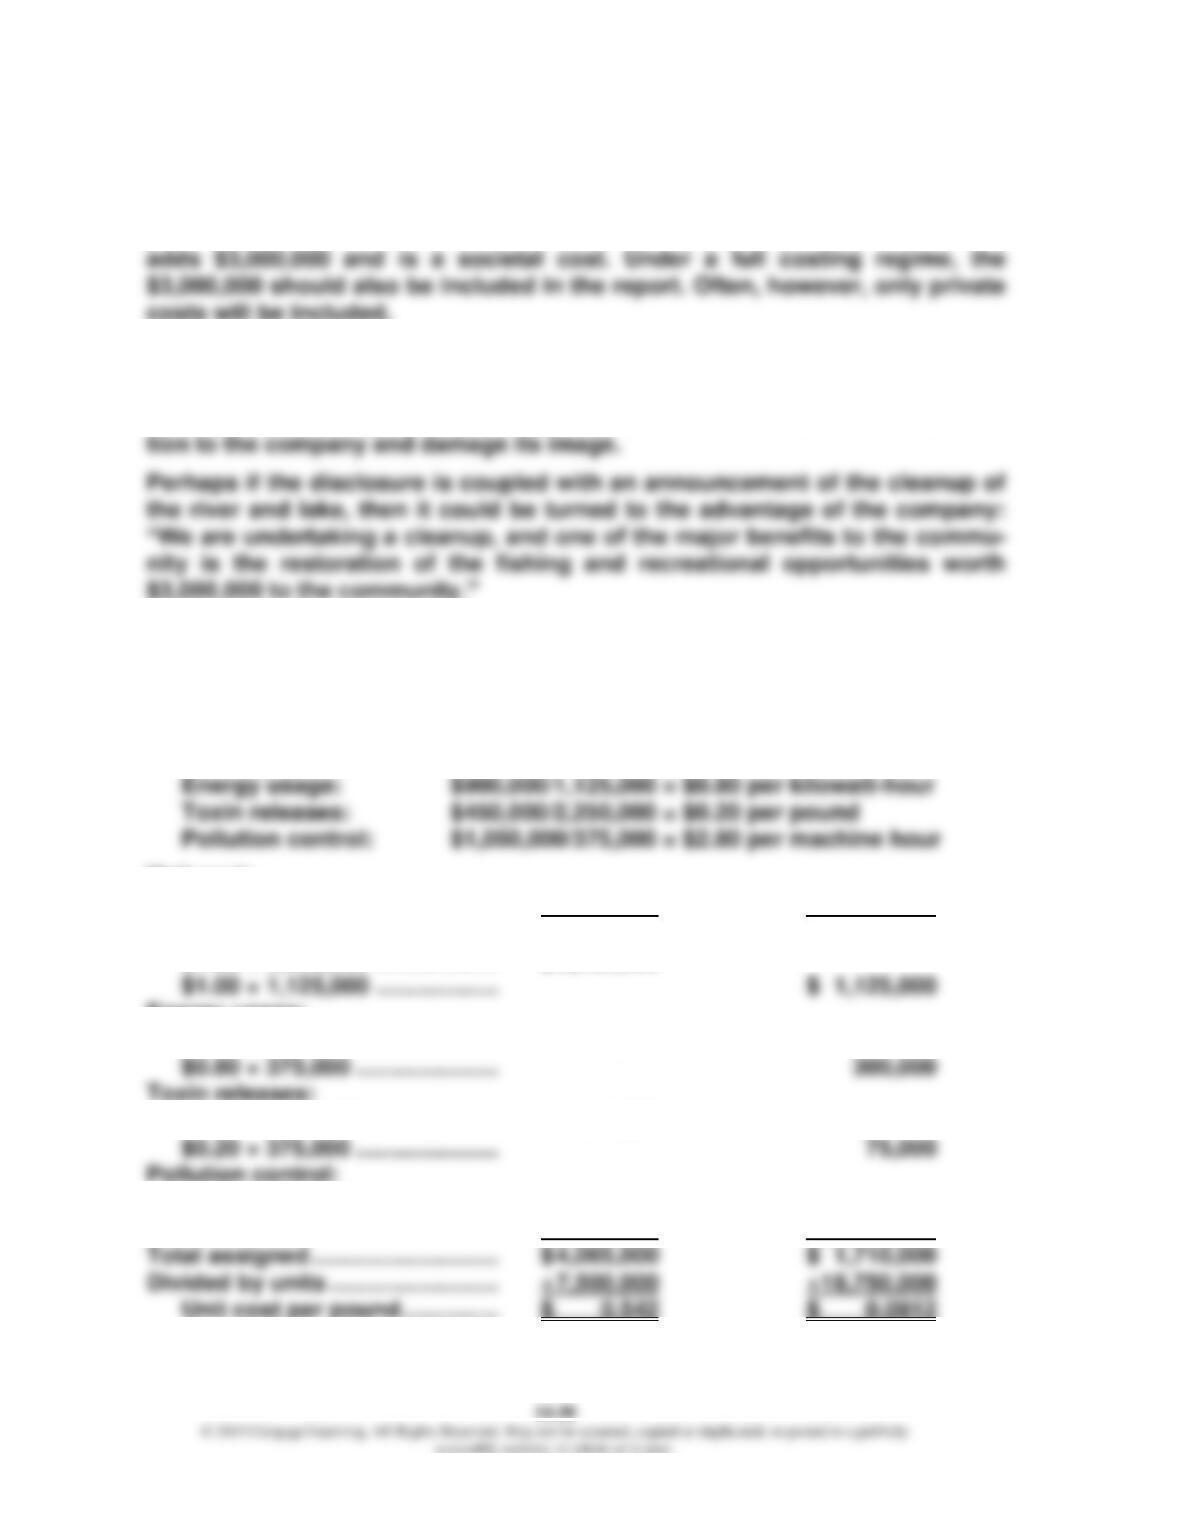
1. Both items should be added to the external failure costs category in the re-
port. The first item would add $1,312,500 and is a private cost. The second
2. Bing caused the opportunity cost, and many would argue that it should be
disclosed. Whether it will voluntarily disclose this cost is questionable. Man-
agement would likely feel that such disclosure would draw unfavorable atten-
Exercise 14.23
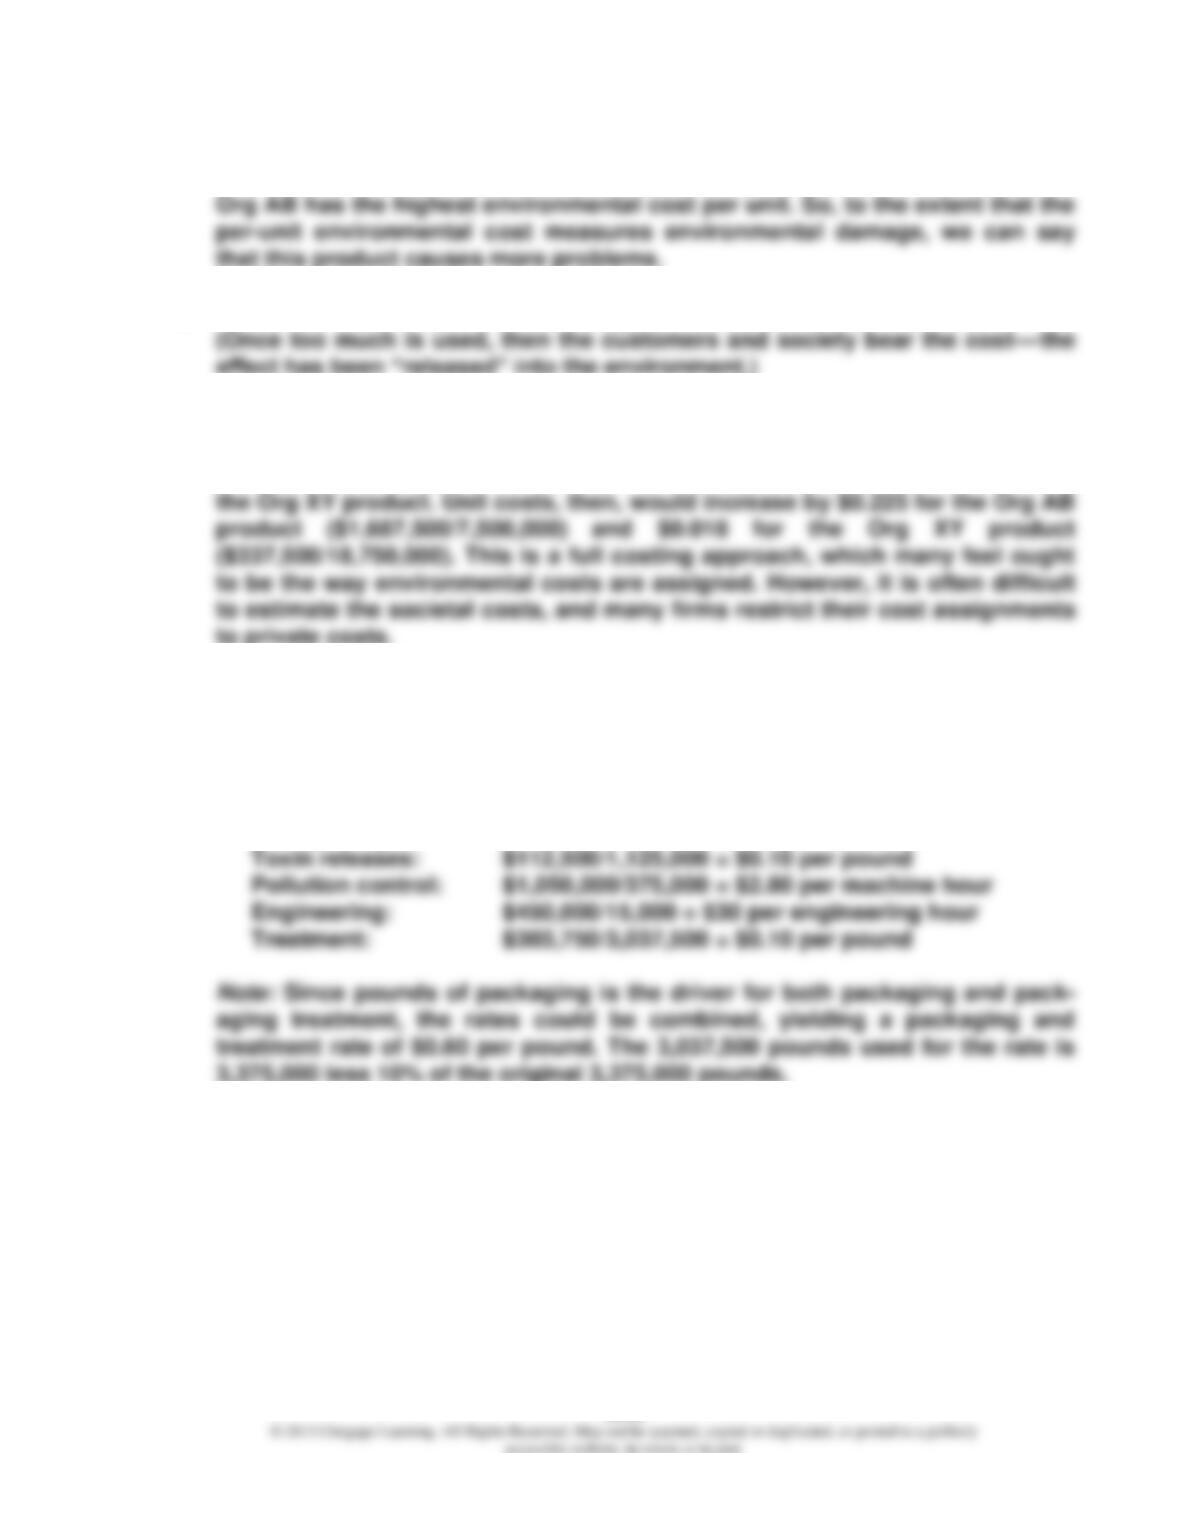
1. Activity rates:
Packaging materials: $3,375,000/3,375,000 = $1.00 per pound
Unit cost:
Org AB Org XY
Packaging materials:
$1.00 × 2,250,000 ………………. $ 2,250,000
Energy usage:
$0.80 × 750,000 …………………. 600,000
$0.20 × 1,875,000 ………………. 375,000
$2.80 × 300,000 …………………. 840,000
$2.80 × 75,000 …………………… 210,000
14–31
Exercise 14.23 (Concluded)
2. Excessive use of materials and energy is classified as an external failure cost.
3. These costs would increase the toxin release rate by $0.90 per pound
($2,025,000/2,250,000). This increase, in turn, would increase the amount
assigned to each product: $1,687,500 to the Org AB product and $337,500 to
Exercise 14.24
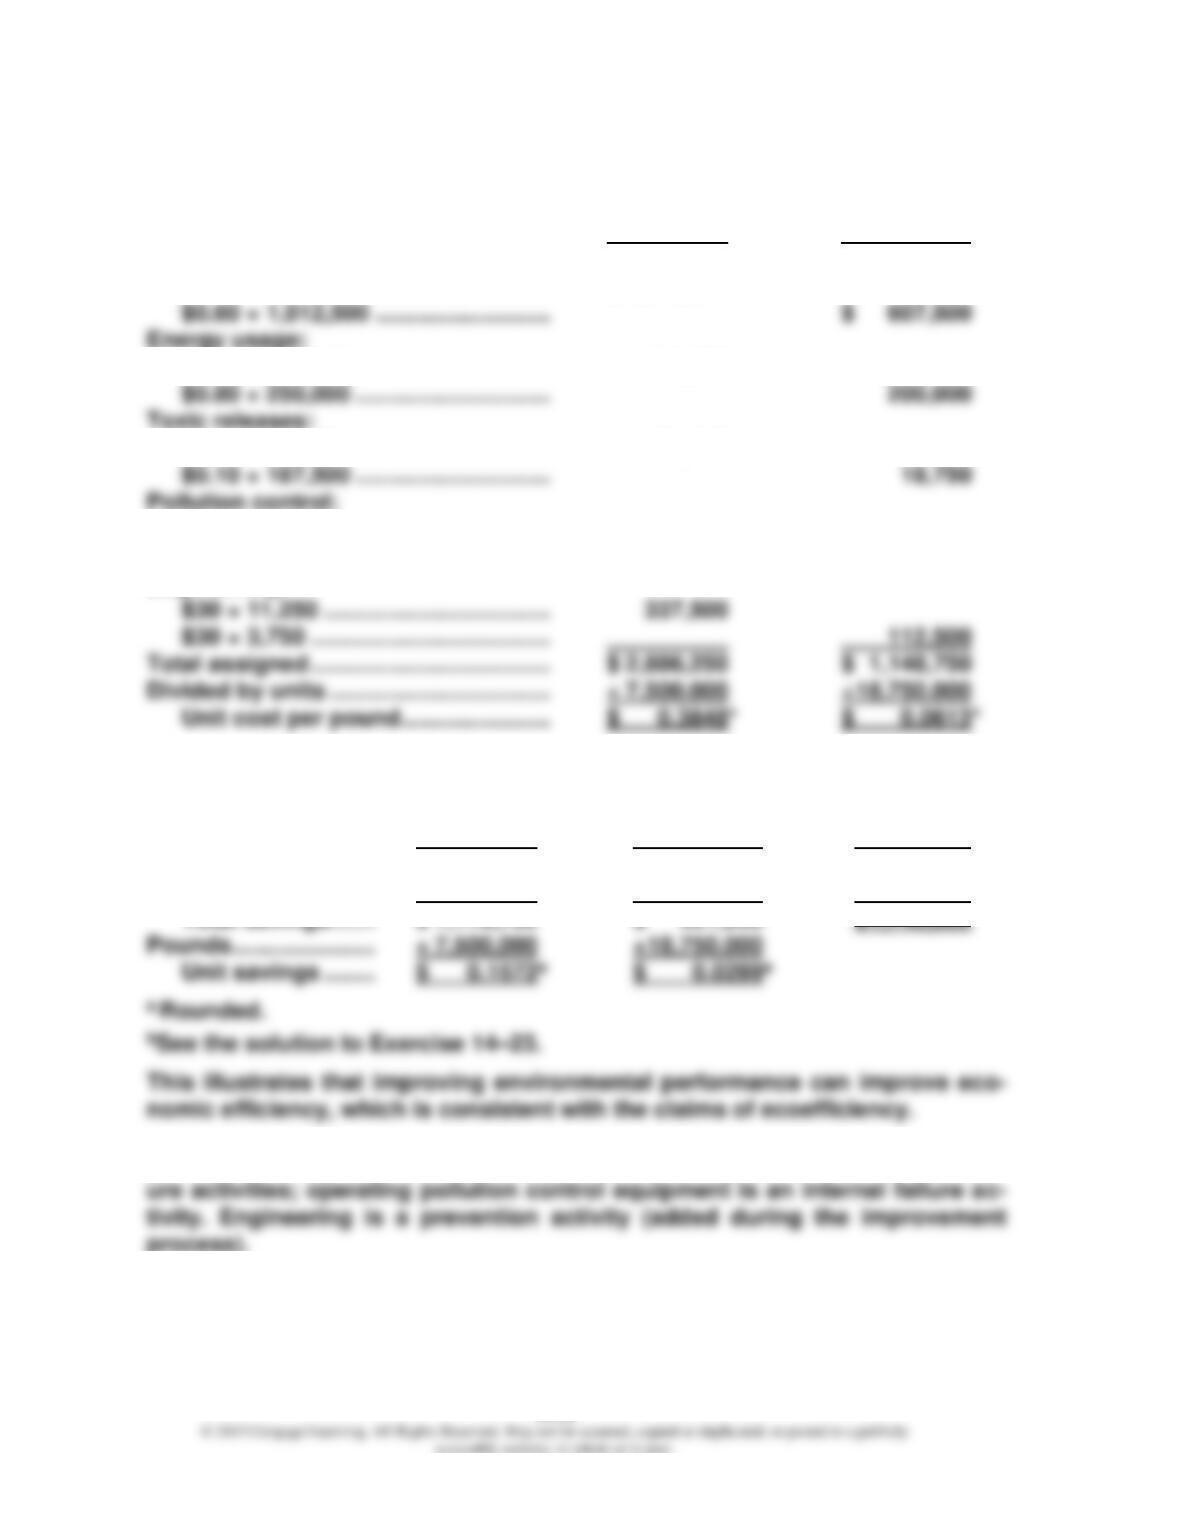
1. New activity rates:
Packaging materials: $1,518,750/3,037,500 = $0.50 per pound
Energy usage: $600,000/750,000 = $0.80 per kilowatt-hour
14–32
Exercise 14.24 (Continued)
Unit cost:
Org AB Org XY
Packaging materials and treatment:
$0.60 × 2,025,000 ……………………… $ 1,215,000
$0.80 × 500,000 ………………………… 400,000
$0.10 × 937,500 ………………………… 93,750
$2.80 × 300,000 ………………………… 840,000
$2.80 × 75,000 ………………………….. 210,000
Engineering:
*Rounded.
2. Savings:
Org AB Org XY Total
Beforeb …………………. $ 4,065,000 $ 1,710,000 $ 5,775,000
After …………………….. 2,886,250 1,148,750 4,035,000
3. Excessive energy and materials usage and releasing toxins are external fail-
14–33
Exercise 14.24 (Concluded)
4. The environmental improvements have reduced total and per-unit operating
costs for each product. This now makes price reductions possible, reducing
14–34
CPA-TYPE EXERCISES
Exercise 14.25
a. Reworking a unit is an internal failure cost and so its subsequent inspection is
Exercise 14.26
Exercise 14.27
b. The Taguchi loss function is used to estimate hidden costs of external failure.
Exercise 14.28
c. External failure costs are incurred when pollution is released into the envi-
Exercise 14.29
d. Product B is the “dirtier” product as it is costing $40 per unit for environmen-
tal costs and Product A is costing only $8 per unit. The consumption ratios for
Product B are 1/3 and 1/5, yielding activity costs assigned to B of $40,000 and
PROBLEMS
Problem 14.30
1. Shorts Company
Quality Cost Report
For the Year Ended December 31, 2015
Percentage
Quality Costs of Sales
Prevention costs:
Vendor certification ………… $ 720,000
Design reviews ……………….. 180,000 $ 900,000 1.5%
Appraisal costs:
2. Relative Percentage
Prevention ………………….. 7.5% (1.5/20)
Appraisal ……………………. 27.5 (5.5/20)
3. Hidden costs = $15 × 600,000 = $9,000,000. External failure costs increase to
$12,600,000 and total quality costs to $21,000,000. Now, external failure costs
14–36
Problem 14.30 (Concluded)
4. There is some validity in the quality manager’s observation. Increasing con-
trol costs will likely decrease hidden failure costs as well as measured costs.
Problem 14.31
1. k = c/d2 = $20/25 = $0.80
Unit No. Actual Weight y – T (y – T)2 k(y – T)2
1 100 0 0 0
2 105 5 25 20
2. Hidden cost = $72 × 100,000 = $7,200,000
3. The consumer would value greater durability; therefore, there is no loss ex-
pected from exceeding the target. This creates a need for an asymmetric loss
function. Using the lower left half of the quadratic loss function is one exam-
ple of an asymmetric loss function. The k value is computed as follows:
Problem 14.32
1. Lost contribution margin = $8 × 100,000 = $800,000, or $200,000 per quarter
Sales revenue/Quarter = $92 × 25,000 = $2,300,000
2. At the end of three years, quality costs will be 4 percent of sales, a reduction
equal to 12 percent of sales.
Savings = 0.12 × ($92 × 100,000) = $1,104,000
Price decreases:
$1.00: Total CM = $12.04 × 110,000 = $1,324,400
Recommended decrease is from $92 to $90.
Increase in contribution margin:
$ 1,324,800
14–38
Problem 14.32 (Concluded)
3. To find the point where the price should first be reduced, we need to find the
point where total contribution margin remains unchanged. Let X = CM/Unit.
Current CM = 100,000X
New CM = 110,000(X – $1)
When the unit CM is greater than $11, the price should be reduced by $1.00.
To find this point in time:
Current CM = $92 – $90 = $2
4. The difference is long-run versus short-run thinking. The marketing manager
had a strategic orientation. We can see the value of cost information,
14–39
Problem 14.33
1. Prevention, fixed
3. External failure, variable
5. Internal failure, variable
7. Prevention, fixed
9. Prevention, fixed
11. External failure, variable
13. Internal failure, variable
15. Prevention, fixed
17. Internal failure, variable
19. Prevention, fixed
Problem 14.34
1. Banshee Company
Quality Cost Report
For the Year Ended 2015
Percentage
Quality Costs of Sales
Prevention costs:
Quality training …………………. $ 30,000 0.2%
Appraisal costs:
Product acceptance …………… $ 240,000 1.6
Internal failure costs:
14–40
Problem 14.34 (Continued)
2. Profits: $1,500,000
Quality costs: $1,396,500
Quality costs/Sales = 9.3%
3. Prevention: $30,000/$1,396,500 = 2.1%
Appraisal: $240,000/$1,396,500 = 17.2%
The pie chart is as follows:
Relative Distribution of Quality Costs
29.1%
17.2%
Internal Failure
Prevention
Too much is spent on failure costs. These costs are non-value-added costs