Current Assets
Cash 41,200$ 53,000$
Accounts receivable 570,000 443,000
Inventory 5,070,000 4,841,000
Prepaid expenses 83,800 78,000
Total current assets 5,765,000 5,415,000
Building and equipment, net 1,097,000 1,095,000
Total assets 6,862,000$ 6,510,000$
Liabilities and Stockholders’ equity
Current liabilities
Accounts payable 604,000$ 624,000$
Bank loan payable 679,000 625,000
Other accrued payables 213,000 313,000
Total current liabilities 1,496,000 1,562,000
Long-term debt 1,729,000 1,797,000
Total liabilities 3,225,000 3,359,000
Stockholders’ equity
Common stock 1,359,000 1,359,000
Retained earnings 2,278,000 1,792,000
Total stockholders’ equity 3,637,000 3,151,000
Total liab. and stockholders’ equity 6,862,000$ 6,510,000$
2018 2017
Net sales 5,568,000$ 5,253,000$
Cost of goods sold 2,840,000 2,627,000
Gross margin 2,728,000 2,626,000
Operating expenses:
Selling expenses 501,000 630,000
General and admin. expenses 835,000 788,000
Total operating expenses 1,336,000 1,418,000
Operating income 1,392,000 1,208,000
Interest expense 139,000 158,000
Income before taxes 1,253,000 1,050,000
Income taxes 439,000 368,000
814,000$ 682,000$
Required
Net income
Statements of Earnings
Exercise 14-6 Horizontal Analysis
The following information for Great Oaks Furniture, a retail furniture and design
firm, relates to exercises 14-6 through 14-11.
Great Oaks Furniture
December 31
Balance Sheets
2018
2017
Assets
Great Oaks Furniture
Year Ended December 31
2018 2017 Change
Current Assets
Cash
Accounts receivable
Inventory
Prepaid expenses
Total current assets
Building and equipment, net
Total assets
Liabilities and Stockholders’ equity
Current liabilities
Accounts payable
Bank loan payable
Other accrued payables
Total current liabilities
Long-term debt
Total liabilities
Stockholders’ equity
Common stock
Retained earnings
Total stockholders’ equity
Total liab. and stkhs’ equity
2018 2017 Change
Net sales
Cost of goods sold
Gross margin
Operating expenses:
Selling expenses
General and admin. exp.
Total operating expenses
Operating income
Interest expense
Income before taxes
Income taxes
Discuss some of the causes that could lead to these changes.
Percent
Change
Statements of Earnings
Net income
Percent
Change
Balance Sheets
Assets
Great Oaks Furniture
Year Ended December 31
Perform a horizontal analysis of the balance sheets and income statements for Great Oaks
Furniture. Highlight changes at are greater than 10%.
Year Ended December 31
Balance sheet:
Income statement:
Current Assets
Cash 41,200$ 53,000$
Accounts receivable 570,000 443,000
Inventory 5,070,000 4,841,000
Prepaid expenses 83,800 78,000
Total current assets 5,765,000 5,415,000
Building and equipment, net 1,097,000 1,095,000
Total assets 6,862,000$ 6,510,000$
Liabilities and Stockholders’ equity
Current liabilities
Accounts payable 604,000$ 624,000$
Bank loan payable 679,000 625,000
Other accrued payables 213,000 313,000
Total current liabilities 1,496,000 1,562,000
Long-term debt 1,729,000 1,797,000
Total liabilities 3,225,000 3,359,000
Stockholders’ equity
Common stock 1,359,000 1,359,000
Retained earnings 2,278,000 1,792,000
Total stockholders’ equity 3,637,000 3,151,000
Total liab. and stockholders’ equity 6,862,000$ 6,510,000$
2018 2017
Net sales 5,568,000$ 5,253,000$
Cost of goods sold 2,840,000 2,627,000
Gross margin 2,728,000 2,626,000
Operating expenses:
Selling expenses 501,000 630,000
General and admin. expenses 835,000 788,000
Total operating expenses 1,336,000 1,418,000
Operating income 1,392,000 1,208,000
Interest expense 139,000 158,000
Income before taxes 1,253,000 1,050,000
Income taxes 439,000 368,000
814,000$ 682,000$
Required
Year Ended December 31
Net income
Great Oaks Furniture
Statements of Earnings
Solution: Exercise 14-6 Horizontal Analysis
The following information for Great Oaks Furniture, a retail furniture and design
firm, relates to exercises 14-6 through 14-11.
Balance Sheets
2018
Assets
2017
December 31
Great Oaks Furniture
2018 2017 Change
Current Assets
Liabilities and Stockholders’ equity
Current liabilities
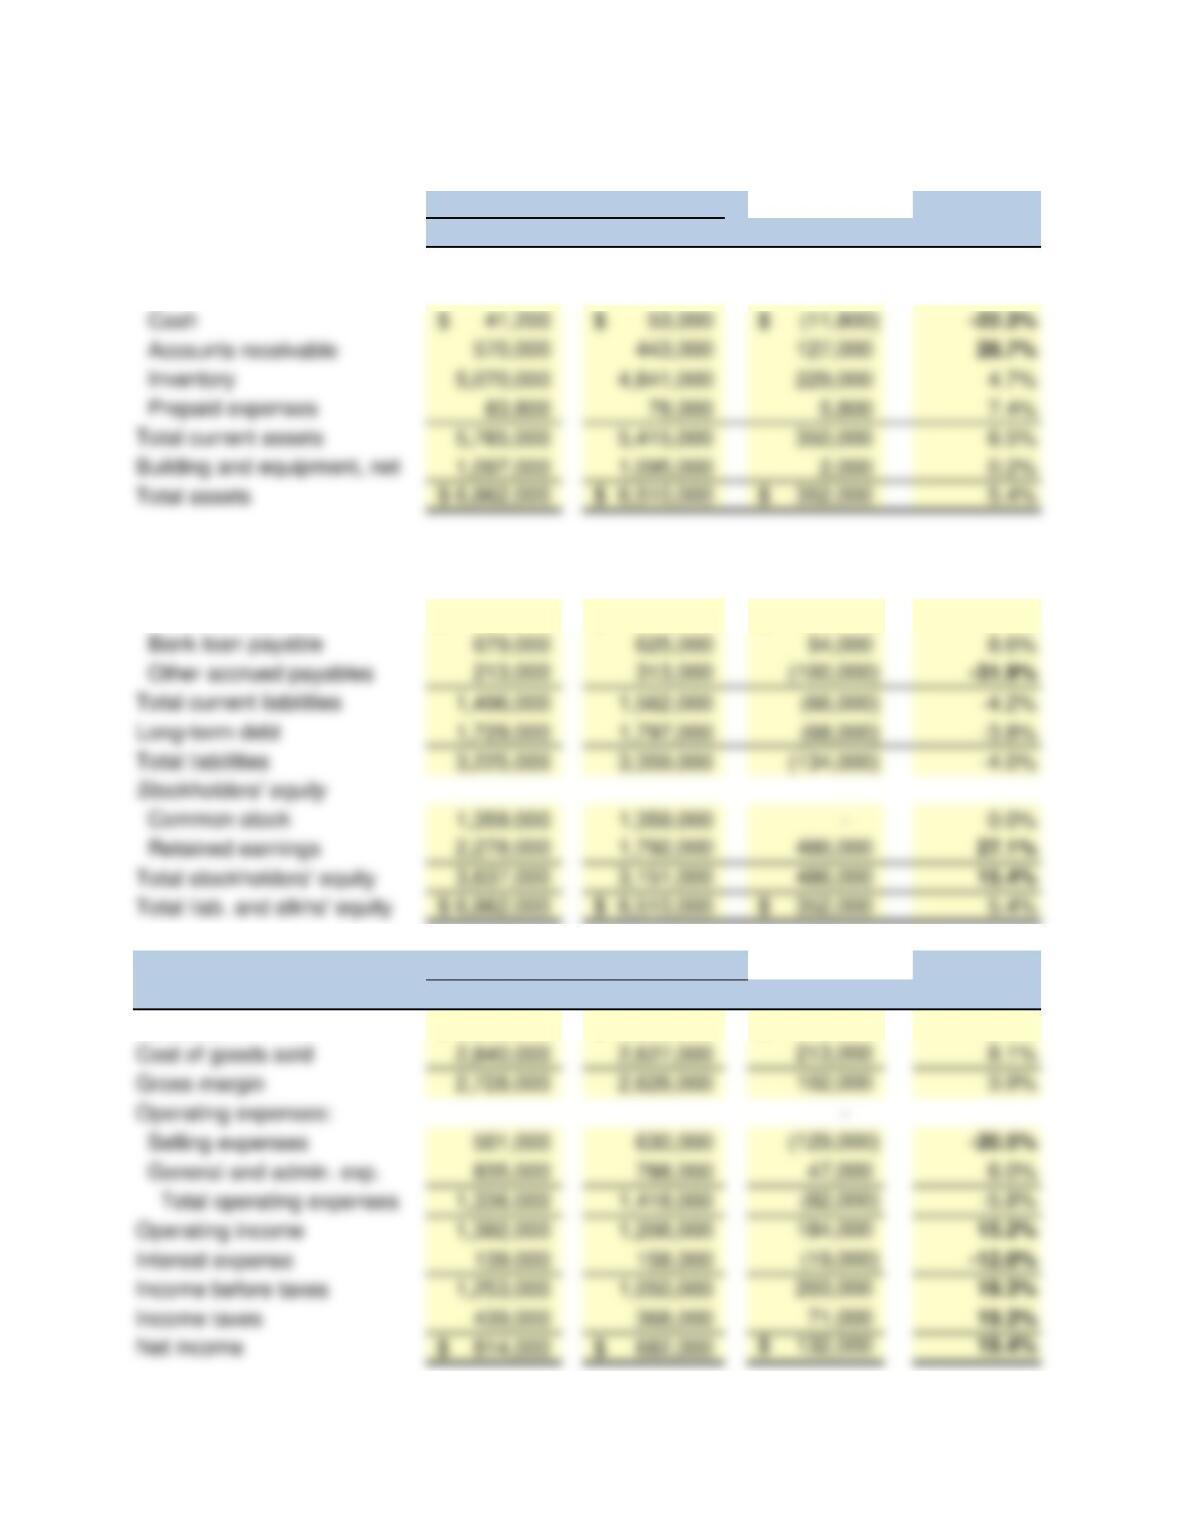
Accounts payable 604,000$ 624,000$ (20,000)$ -3.2%
2018 2017 Change
Net sales 5,568,000$ 5,253,000$ 315,000$ 6.0%
Discuss some of the causes that could lead to these changes.
Great Oaks Furniture
Statements of Earnings
Year Ended December 31
Year Ended December 31
Assets
Perform a horizontal analysis of the balance sheets and income statements for Great Oaks
Furniture. Highlight changes at are greater than 10%.
Balance Sheets
Percent
Change
Percent
Change
Balance sheet:
Income statement:
Current Assets
Cash 41,200$ 53,000$
Accounts receivable 570,000 443,000
Inventory 5,070,000 4,841,000
Prepaid expenses 83,800 78,000
Total current assets 5,765,000 5,415,000
Building and equipment, net 1,097,000 1,095,000
Total assets 6,862,000$ 6,510,000$
Liabilities and Stockholders’ equity
Current liabilities
Accounts payable 604,000$ 624,000$
Bank loan payable 679,000 625,000
Other accrued payables 213,000 313,000
Total current liabilities 1,496,000 1,562,000
Long-term debt 1,729,000 1,797,000
Total liabilities 3,225,000 3,359,000
Stockholders’ equity
Common stock 1,359,000 1,359,000
Retained earnings 2,278,000 1,792,000
Total stockholders’ equity 3,637,000 3,151,000
Total liab. and stockholders’ equity 6,862,000$ 6,510,000$
2018 2017
Net sales 5,568,000$ 5,253,000$
Cost of goods sold 2,840,000 2,627,000
Gross margin 2,728,000 2,626,000
Operating expenses:
Selling expenses 501,000 630,000
General and admin. expenses 835,000 788,000
Total operating expenses 1,336,000 1,418,000
Operating income 1,392,000 1,208,000
Interest expense 139,000 158,000
Income before taxes 1,253,000 1,050,000
Income taxes 439,000 368,000
814,000$ 682,000$
Required
Net income
Statements of Earnings
Exercise 14-7 Vertical Analysis
The following information for Great Oaks Furniture, a retail furniture and design
firm, relates to exercises 14-6 through 14-11.
Great Oaks Furniture
December 31
Balance Sheets
2018
2017
Assets
Great Oaks Furniture
Year Ended December 31
Perform a vertical analysis of the balance sheets and income statements for Great Oaks Furniture.
Current Assets
Cash
Accounts receivable
Inventory
Prepaid expenses
Total current assets
Building and equipment, net
Total assets
Liabilities and Stockholders’ equity
Current liabilities
Accounts payable
Bank loan payable
Other accrued payables
Total current liabilities
Long-term debt
Total liabilities
Stockholders’ equity
Common stock
Retained earnings
Total stockholders’ equity
Total liab. and stkhs’ equity
2017
Net sales
Cost of goods sold
Gross margin
Operating expenses:
Selling expenses
General and admin. expenses
Total operating expenses
Operating income
Interest expense
Income before taxes
Income taxes
Percentage
Statements of Earnings
2018
Net income
Are there any major changes between 2017 and 2018? Indicate what could have led to the changes
Year Ended
Assets
Great Oaks Furniture
Year Ended
Percentage
December 31,
Percentage
December 31,
Percentage
Balance Sheets
2018
2017

Balance sheet:
Income statement:
you noted in this analysis.
Current Assets
Cash 41,200$ 53,000$
Accounts receivable 570,000 443,000
Inventory 5,070,000 4,841,000
Prepaid expenses 83,800 78,000
Total current assets 5,765,000 5,415,000
Building and equipment, net 1,097,000 1,095,000
Total assets 6,862,000$ 6,510,000$
Liabilities and Stockholders’ equity
Current liabilities
Accounts payable 604,000$ 624,000$
Bank loan payable 679,000 625,000
Other accrued payables 213,000 313,000
Total current liabilities 1,496,000 1,562,000
Long-term debt 1,729,000 1,797,000
Total liabilities 3,225,000 3,359,000
Stockholders’ equity
Common stock 1,359,000 1,359,000
Retained earnings 2,278,000 1,792,000
Total stockholders’ equity 3,637,000 3,151,000
Total liab. and stockholders’ equity 6,862,000$ 6,510,000$
2018 2017
Net sales 5,568,000$ 5,253,000$
Cost of goods sold 2,840,000 2,627,000
Gross margin 2,728,000 2,626,000
Operating expenses:
Selling expenses 501,000 630,000
General and admin. expenses 835,000 788,000
Total operating expenses 1,336,000 1,418,000
Operating income 1,392,000 1,208,000
Interest expense 139,000 158,000
Income before taxes 1,253,000 1,050,000
Income taxes 439,000 368,000
814,000$ 682,000$
Required
Net income
Assets
Great Oaks Furniture
Year Ended December 31
Statements of Earnings
Solution: Exercise 14-7 Vertical Analysis
The following information for Great Oaks Furniture, a retail furniture and design
firm, relates to exercises 14-6 through 14-11.
Great Oaks Furniture
December 31
Balance Sheets
2018
2017
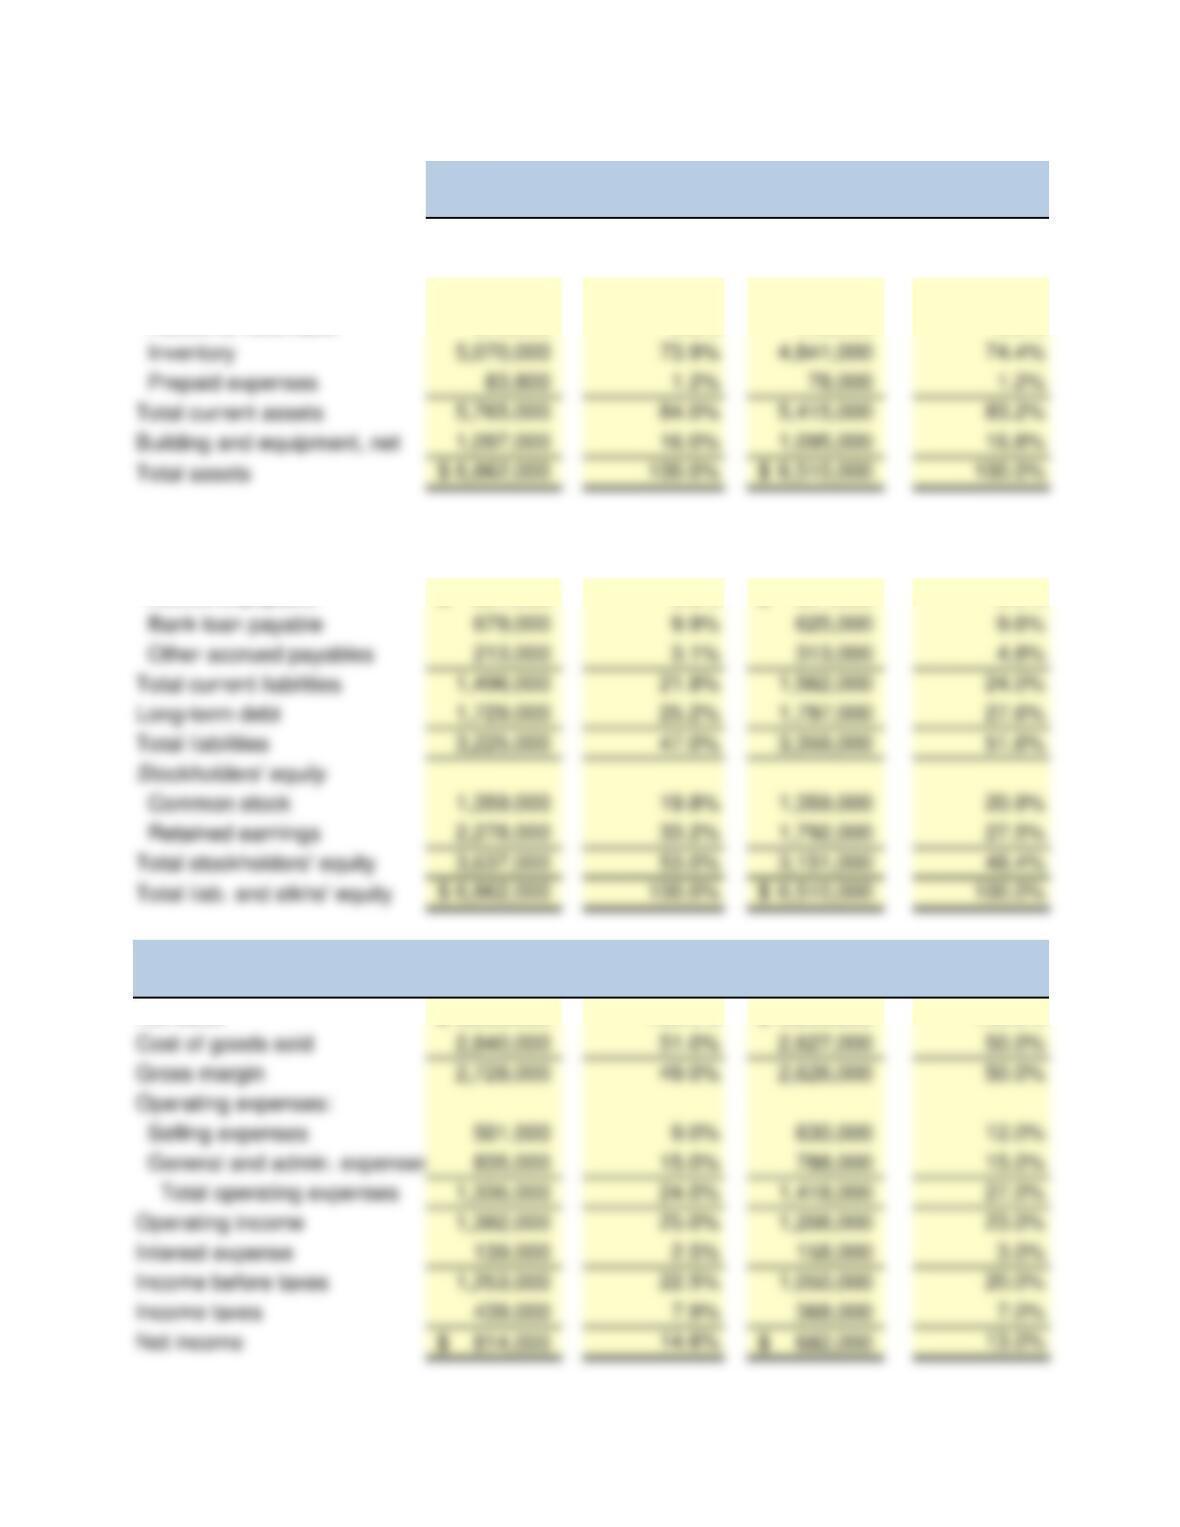
Perform a vertical analysis of the balance sheets and income statements for Great Oaks Furniture.
Current Assets
Cash 41,200$ 0.6% 53,000$ 0.8%
Accounts receivable 570,000 8.3% 443,000 6.8%
Liabilities and Stockholders’ equity
Current liabilities
Accounts payable 604,000$ 8.8% 624,000$ 9.6%
2017
Net sales 5,568,000$ 100.0% 5,253,000$ 100.0%
Percentage
Statements of Earnings
2018
Are there any major changes between 2017 and 2018? Indicate what could have led to the changes
Year Ended
Assets
Great Oaks Furniture
Year Ended
Percentage
December 31,
Percentage
December 31,
Percentage
Balance Sheets
2018
2017
you noted in this analysis.
Current Assets
Cash 41,200$ 53,000$
Accounts receivable 570,000 443,000
Inventory 5,070,000 4,841,000
Prepaid expenses 83,800 78,000
Total current assets 5,765,000 5,415,000
Building and equipment, net 1,097,000 1,095,000
Total assets 6,862,000$ 6,510,000$
Liabilities and Stockholders’ equity
Current liabilities
Accounts payable 604,000$ 624,000$
Bank loan payable 679,000 625,000
Other accrued payables 213,000 313,000
Total current liabilities 1,496,000 1,562,000
Long-term debt 1,729,000 1,797,000
Total liabilities 3,225,000 3,359,000
Stockholders’ equity
Common stock 1,359,000 1,359,000
Retained earnings 2,278,000 1,792,000
Total stockholders’ equity 3,637,000 3,151,000
Total liab. and stockholders’ equity 6,862,000$ 6,510,000$
2018 2017
Net sales 5,568,000$ 5,253,000$
Cost of goods sold 2,840,000 2,627,000
Gross margin 2,728,000 2,626,000
Operating expenses:
Selling expenses 501,000 630,000
General and admin. expenses 835,000 788,000
Total operating expenses 1,336,000 1,418,000
Operating income 1,392,000 1,208,000
Interest expense 139,000 158,000
Income before taxes 1,253,000 1,050,000
Income taxes 439,000 368,000
814,000$ 682,000$
Additional information:
Net income
Statements of Earnings
Exercise 14-8 Profitability Ratios
The following information for Great Oaks Furniture, a retail furniture and design
firm, relates to exercises 14-6 through 14-11.
Great Oaks Furniture
December 31
Balance Sheets
2018
2017
Assets
Great Oaks Furniture
Year Ended December 31

Shares of common stock outstanding at end of both years 100,000
Price per share at end of 2017
110$
Price per share at end of 2018
134$
Required
Earnings per share
2018 ÷ =
2017 ÷ =
Price earnings ratio
2018 ÷ =
2017 ÷ =
Gross margin percentage
2018 ÷ =
2017 ÷ =
Return on total assets
Income tax rate
2018
2017
2018 +
2017 ÷
=
Return on common stockholders’ equity
2018 ÷ =
2017 ÷ =
Can you identify any significant findings or trends when comparing the ratios between
years? What other information would be necessary in order to make a complete
assessment of Great Oaks’ performance?
Calculate earnings per share, the price-earnings ratio, the gross margin percentage,
return on total assets, and return on common stockholders’ for 2017 and 2018.
=

What-if?
Consider the following after you have completed the requirements of E14-8.
Earnings per share
2018 ÷ =
Price-earnings ratio
2018 ÷ =
Suppose the number of common shares outstanding had declined to 80,000 during
2018. What effect would this have on the profitability ratios assuming no other changes
exist? Do the ratios improve or decline? Explain.