
CHAPTER 14
Financial Statement Analysis
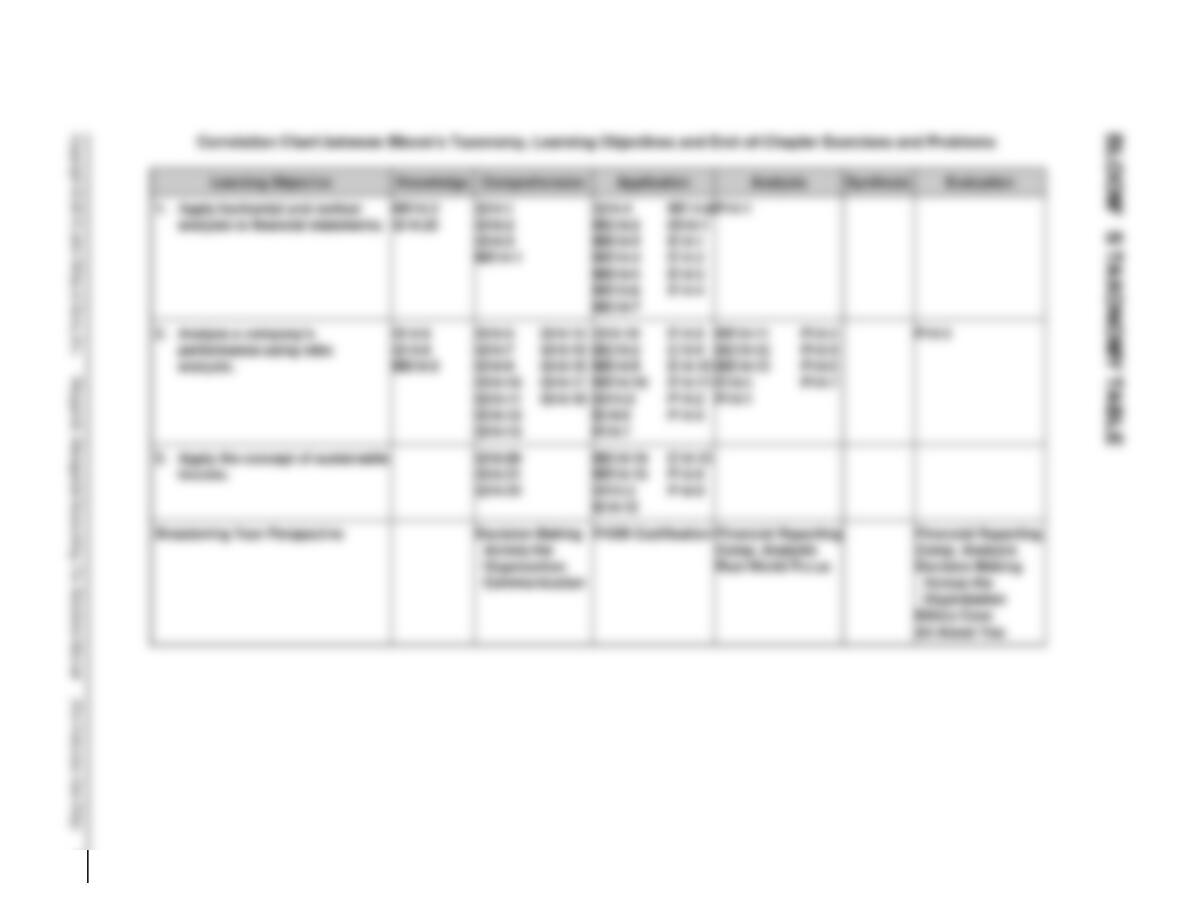
ASSIGNMENT CLASSIFICATION TABLE
Learning Objectives
Questions
Brief
Exercises
Do It!
Exercises
Problems
1. Apply horizontal and vertical analysis
to financial statements.
1, 2, 3, 4, 23
1, 2, 3, 4, 5,
6, 7, 8
1
1, 2, 3, 4
1
2. Analyze a company’s performance
using ratio analysis.
5, 6, 7, 8, 9,
10, 11,12, 13,
14, 15, 16,
17, 18, 19
2, 9, 10, 11,
12, 13
2
5, 6, 7, 8,
9, 10, 11
1, 2, 3, 4,
5, 6, 7
3. Apply the concept of sustainable
income.
20, 21, 22
14, 15
3
12, 13
8, 9

ASSIGNMENT CHARACTERISTICS TABLE
Problem
Number
Description
Difficulty
Level
Time
Allotted (min.)
1
Prepare vertical analysis and comment on profitability.
Simple
20–30
2
Compute ratios from balance sheet and income statement.
Simple
20–30
3
Perform ratio analysis, and evaluate financial position
and operating results.
Simple
20–30
4
Compute ratios, and comment on overall liquidity and
profitability.
Moderate
30–40
5
Compute selected ratios, and compare liquidity, profitability,
and solvency for two companies.
Moderate
50–60
6
Compute numerous ratios.
Simple
30–40
7
Compute missing information given a set of ratios.
Complex
30–40
8
Prepare a statement of comprehensive income.
Moderate
30–40
9
Prepare a statement of comprehensive income.
Moderate
30–40

WEYGANDT MANAGERIAL ACCOUNTING 7E
CHAPTER 14
FINANCIAL STATEMENT ANALYSIS
Number
LO
BT
Difficulty
Time (min.)
BE1
1
C
Moderate
10–12
BE2
1, 2
K, AP
Simple
8–10
BE3
1
AP
Simple
6–8
BE4
1
AP
Simple
6–8
BE5
1
AP
Simple
4–6
BE6
1
AP
Simple
4–6
BE7
1
AP
Simple
4–6
BE8
1
AP
Simple
5–7
BE9
2
AP
Simple
4–6
BE10
2
AP
Simple
3–5
BE11
2
AN
Simple
6–8
BE12
2
AN
Moderate
6–8
BE13
2
AN
Moderate
6–8
BE14
3
AP
Simple
4–6
BE15
3
AP
Simple
3–5
DI1
1
AP
Simple
6–8
DI2
2
AP
Simple
10–12
DI3
3
AP
Simple
6–8
EX1
1
AP
Simple
10–12
EX2
1
AP
Simple
10–12
EX3
1
AP
Simple
12–15
EX4
1
AP
Simple
10–12
EX5
2
AN
Simple
8–10
EX6
2
AP
Simple
8–10
EX7
2
AP
Simple
6–8
EX8
2
AP
Simple
6–8
EX9
2
AP
Simple
6–8
EX10
2
AP
Moderate
8–10

FINANCIAL STATEMENT ANALYSIS (Continued)
Number
LO
BT
Difficulty
Time (min.)
EX11
2
AP
Simple
10–12
EX12
3
AP
Moderate
8–10
EX13
3
AP
Simple
6–8
P1
1, 2
AN
Simple
20–30
P2
2
AP
Simple
20–30
P3
2
E
Simple
20–30
P4
2
AN
Moderate
30–40
P5
2
AN
Moderate
50–60
P6
2
AP
Simple
30–40
P7
2
AN
Complex
30–40
P8
3
AP
Moderate
30–40
P9
3
AP
Moderate
30–40
BYP1
1, 2
AN, E
Moderate
20–25
BYP2
1, 2
AN, E
Simple
15–20
BYP3
1, 2
AN, E
Simple
15–20
BYP4
2
C, E
Moderate
15–20
BYP5
—
AN
Simple
15–20
BYP6
1, 3
C
Simple
15–20
BYP7
2
E
Simple
10–15
BYP8
—
E
Simple
15–20
ANSWERS TO QUESTIONS
1. (a) Jose is not correct. There are three characteristics: liquidity, profitability, and solvency.
2. (a) Comparison of financial information can be made on an intracompany basis, an intercompany
basis, and an industry average basis (or norms).
(1) An intracompany basis compares an item or financial relationship within a company in
the current year with the same item or relationship in one or more prior years.
(2) The industry averages basis compares an item or financial relationship of a company
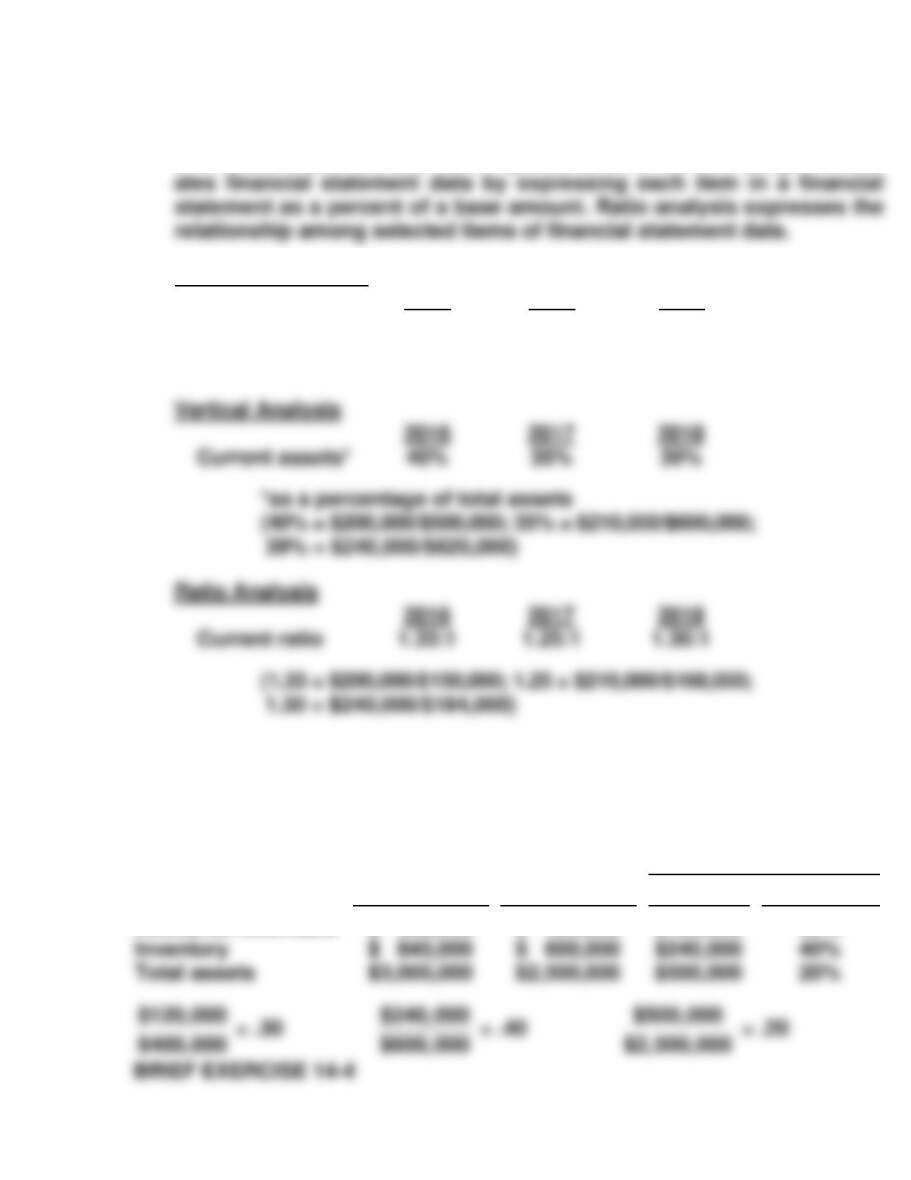
3. Horizontal analysis (also called trend analysis) measures the dollar and percentage increase or
decrease of an item over a period of time. In this approach, the amount of the item on one statement
is compared with the amount of that same item on one or more earlier statements. Vertical analysis
percent of a base amount.
4. (a) $390,000 X 1.245 = $485,550, 2018 net income.
(b) $390,000 ÷ .06 = $6,500,000, 2017 revenue.
5. A ratio expresses the mathematical relationship between one quantity and another. The relationship
is expressed in terms of either a percentage (200%), a rate (2 times), or a simple proportion (2:1).
8. (a) Liquidity ratios measure the short-term ability of the enterprise to pay its maturing obligations
and to meet unexpected needs for cash.
(b) Profitability ratios measure the income or operating success of a company for a given period of time.
(c) Solvency ratios measure the ability of the company to survive over a long period of time.
Questions Chapter 14 (Continued)
9. The current ratio relates current assets to current liabilities. The acid-test ratio relates cash, short-term
investments, and net receivables to current liabilities. The current ratio includes inventory and
10. Hizar Company does not necessarily have a problem. The accounts receivable turnover can be
misleading in that some companies encourage credit and revolving charge sales and slow collections
in order to earn a healthy return on the outstanding receivables in the form of high rates of interest.
11. (a) Asset turnover.
(b) Inventory turnover.
12. The price earnings (P/E) ratio is a reflection of investors’ assessments of a company’s future
earnings. In this question, investors favor Microsoft because it has the higher P/E ratio. The investors
feel that Microsoft will be able to generate even higher future earnings and so the investors are
willing to pay more for the stock.
13. The payout ratio is cash dividends divided by net income. In a growth company, the payout ratio is
often low because the company is reinvesting earnings in the business.
14. (a) The increase in profit margin is good news because it means that a greater percentage of net
sales is going towards income.
(b) The decrease in inventory turnover signals bad news because it is taking the company longer
to sell the inventory and consequently there is a greater chance of inventory obsolescence.
(c) An increase in the current ratio signals good news because the company improved its ability
Questions Chapter 14 (Continued)
15.
Return on assets
=
Net Income
Average Assets
16. (a) The times interest earned, which is an indication of the company’s ability to meet interest
payments, and the debt to assets ratio, which indicates the company’s ability to withstand losses
without impairing the interests of creditors.
17. Earnings per share means earnings per share of common stock. Preferred dividends are
subtracted from net income in computing EPS in order to obtain income available to common
stockholders.
18. (a) Trading on the equity means that the company has borrowed money at a lower rate of interest
than it is able to earn by using the borrowed money. Simply stated, it is using money supplied
indicates the profitability of trading on the equity.
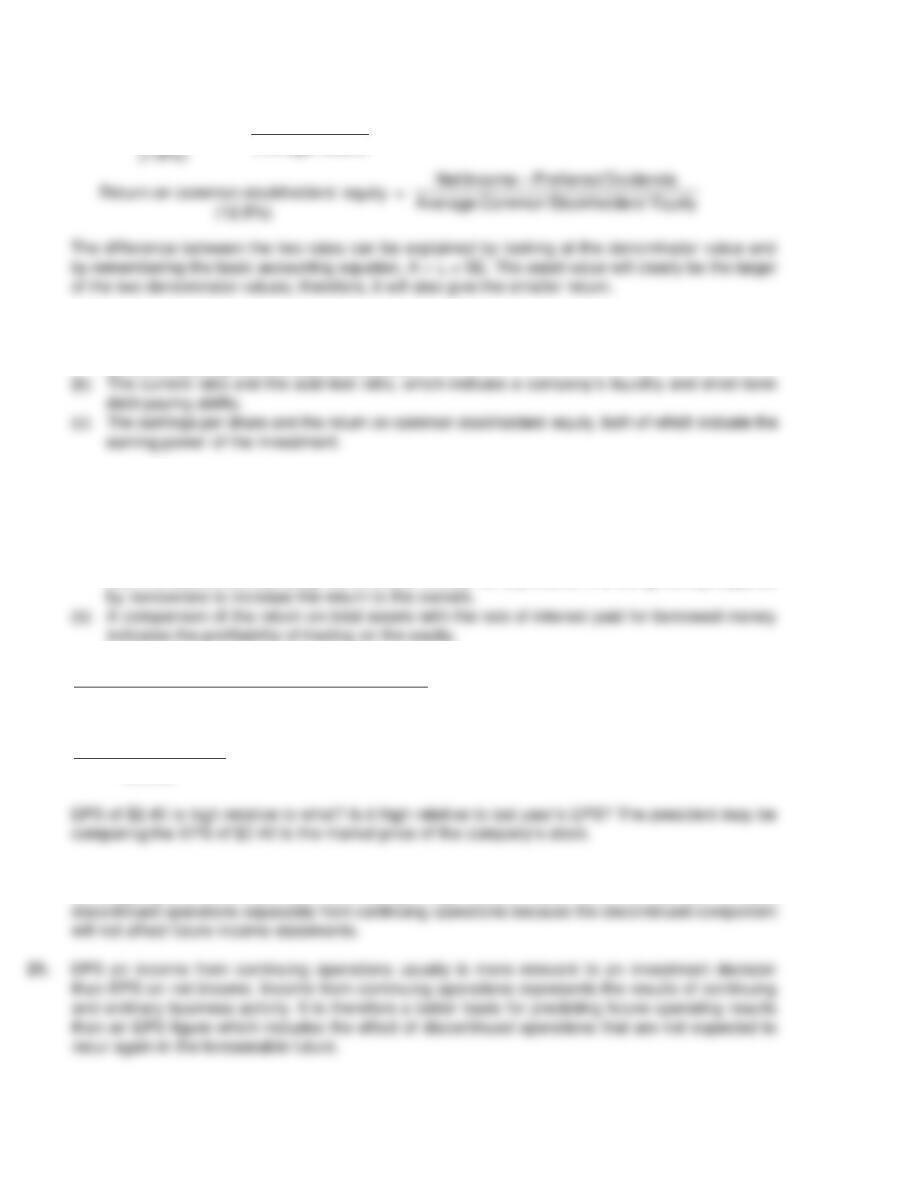
19.
Net income – Preferred dividends
Weighted – average common shares outstanding
= Earnings per share
$160,000 – $40,000
50,000
= $2.40
20. Discontinued operations refers to the disposal of a significant component of the business such as
the stopping of an entire activity or eliminating a major class of customers. It is important to report
Questions Chapter 14 (Continued)
22. When comparing EPS trends, discontinued operations should be omitted since they are not
reflective of normal operations. In this example, the trend is unfavorable because EPS, exclusive of
discontinued operations, has decreased from $3.20 to $2.99.
SOLUTIONS TO BRIEF EXERCISES
BRIEF EXERCISE 14-1
Dear Uncle Sammy,
It was so good to hear from you! I hope you and Aunt Jennie are still enjoying
your new house.
You asked some interesting questions. They relate very well to the material
that we are studying now in my financial accounting class. You said you
heard that different users of financial statements are interested in different
characteristics of companies. This is true. A short–term creditor, such as a bank,
is interested in the company’s liquidity, or ability to pay obligations as they
become due. The liquidity of a borrower is extremely important in evaluating
the safety of a loan. A long-term creditor, such as a bondholder, would be
interested in solvency, the company’s ability to survive over a long period
BRIEF EXERCISE 14-2
(a) The three tools of financial statement analysis are horizontal analysis,
vertical analysis, and ratio analysis. Horizontal analysis evaluates a series
of financial statement data over a period of time. Vertical analysis evalu–
(b) Horizontal Analysis
2016
2017
2018
Current assets
100%
105%
120%
2016
2017
2018
Current assets*
39%
Current ratio
(105% = $210,000/$200,000; 120% = $240,000/$200,000)
BRIEF EXERCISE 14-3
Horizontal analysis:
Increase
or (Decrease)
Dec. 31, 2017
Dec. 31, 2016
Amount
Percentage
Total assets
20%
Accounts receivable
$ 520,000
$ 400,000
$120,000
30%
Vertical analysis:
Dec. 31, 2017
Dec. 31, 2016
Amount
Percentage*
Amount
Percentage**
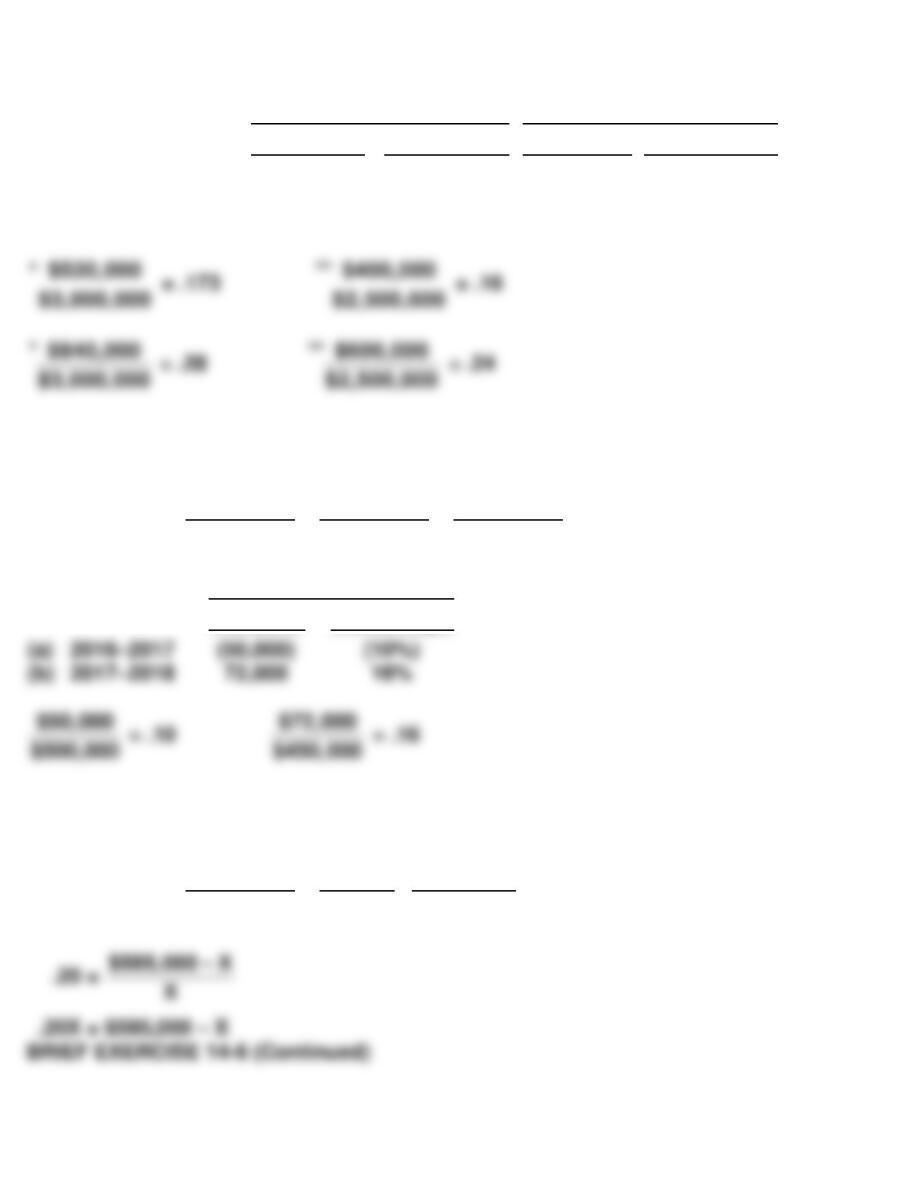
Accounts receivable
Inventory
Total assets
$ 520,000
$ 840,000
$3,000,000
17.3%
28.0%
100%
$ 400,000
$ 600,000
$2,500,000
16.0%
24.0%
100%
BRIEF EXERCISE 14-5
2018
2017
2016
Net income
$522,000
$450,000
$500,000
Increase or (Decrease)
Amount
Percentage
(a)
(b)
BRIEF EXERCISE 14-6
2017
2016
Increase
Net income
$585,000
X
20%
1.20X = $585,000
BRIEF EXERCISE 14-7
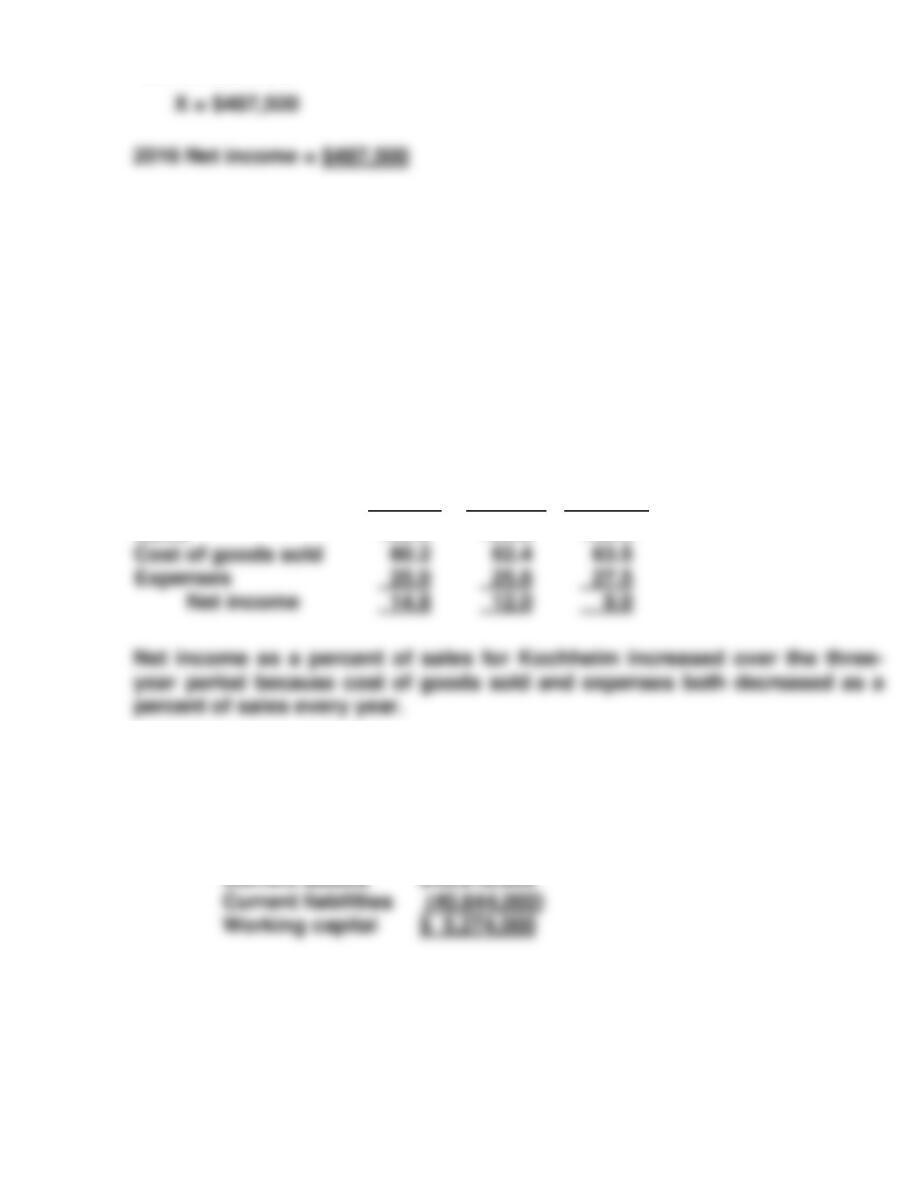
Comparing the percentages presented results in the following conclusions:
The net income for Dody increased in 2017 because of the combination of
an increase in sales and a decrease in both cost of goods sold and expenses.
However, the reverse was true in 2018 as sales decreased while both cost of
goods sold and expenses increased. This resulted in a decrease in net income.
BRIEF EXERCISE 14-8
2018
2017
2016
Sales
100.0
100.0
100.0
BRIEF EXERCISE 14-9
(a) Working capital = Current assets – Current liabilities
BRIEF EXERCISE 14-9 (Continued)
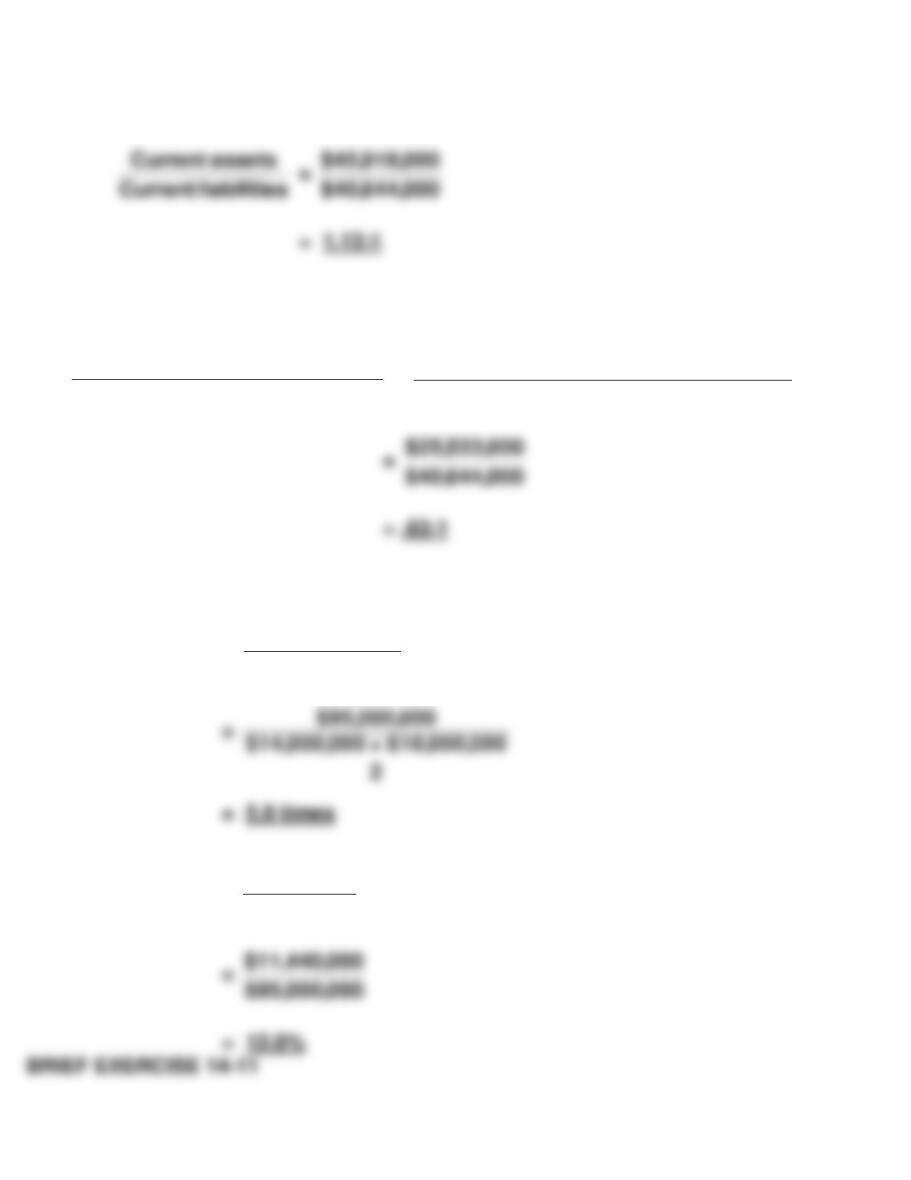
(b) Current ratio:
(c) Acid-test ratio:
Cash+ Short–terminvestments
+Receivables(net)
Currentliabilities
=
$8,041,000+ $4,947,000+ $12,545,000
$40,644,000
BRIEF EXERCISE 14–10
(a) Asset turnover =
Net sales
Average assets
(b) Profit margin =
Net income
Net sales
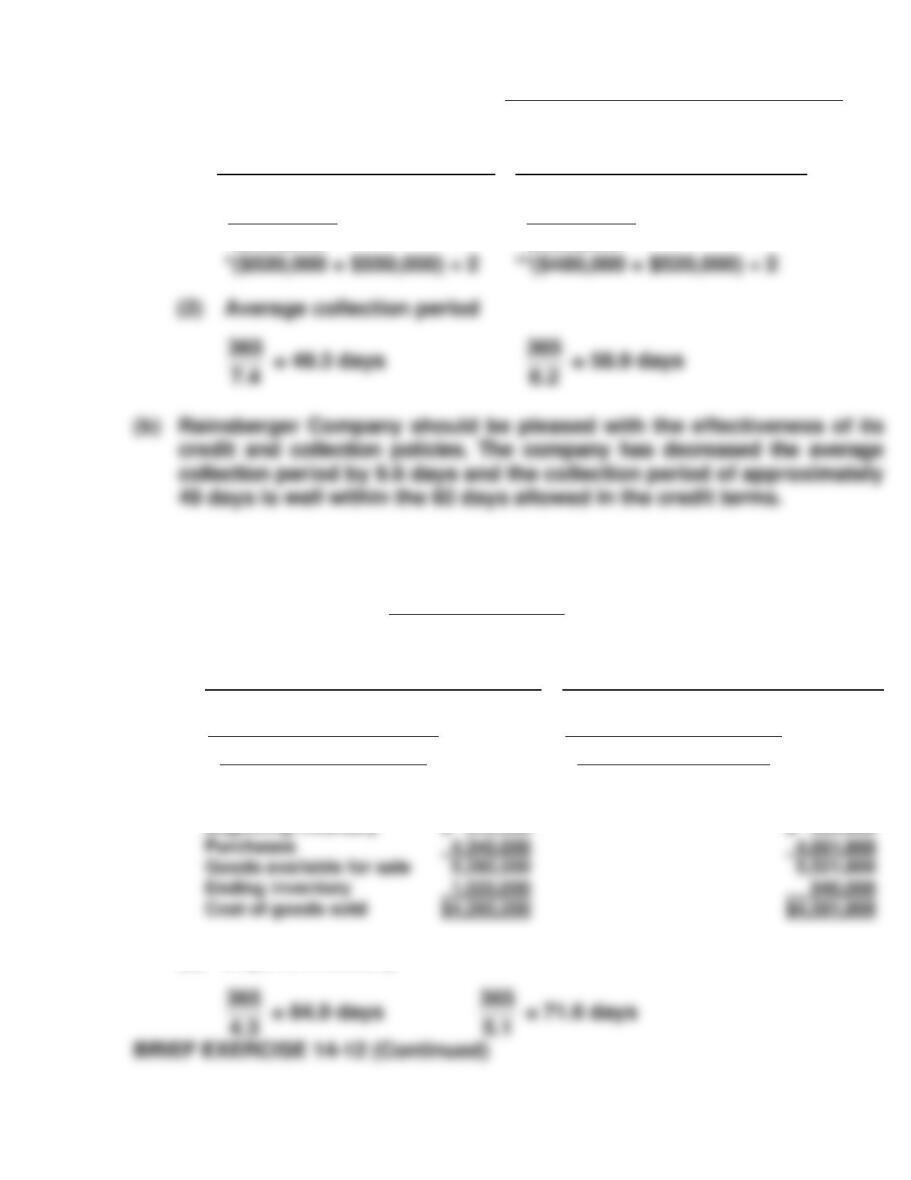
(a) Accounts Receivable turnover =
Net credit sales
Average net accounts receivable
2016
2015
(1)
$3,960,000
$535,000*
= 7.4 times
$3,100,000
$500,000**
= 6.2 times
BRIEF EXERCISE 14–12
(a) Inventory turnover =
Cost of goods sold
Average inventory
(1)
2017
2016
$4,260,000
$940,000 + $1,020,000
2
= 4.3 times
$4,581,000
$860,000 + $940,000
2
= 5.1 times
Cost of goods sold $4,260,000
Beginning inventory $ 940,000
$ 860,000
(2) Days in inventory
*($520,000 + $550,000) ÷ 2
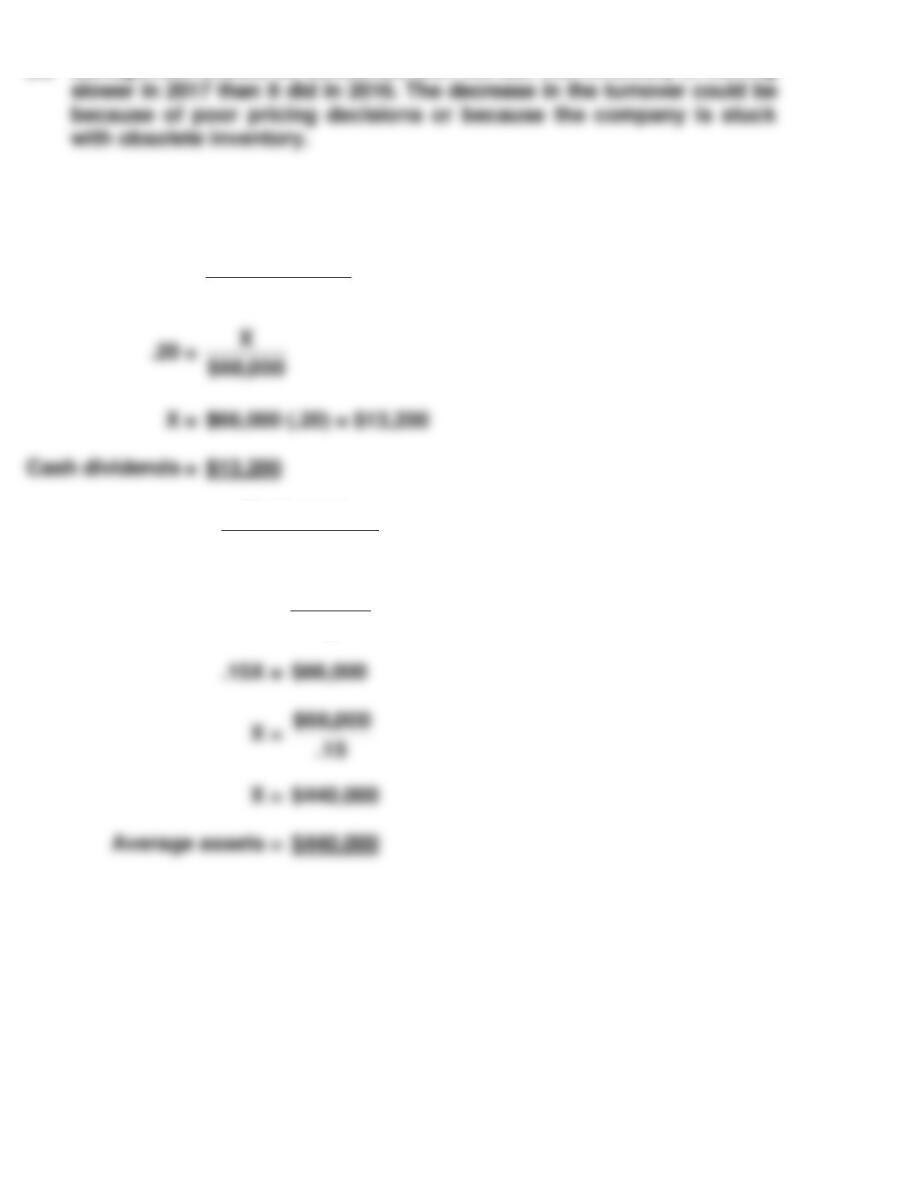
(b) Management should be concerned with the fact that inventory is moving
BRIEF EXERCISE 14–13
Payout ratio =
Cash dividends
Net income
Return on assets =
Net income
Average assets
.15 =
$66,000
X
BRIEF EXERCISE 14–14
SILVA CORPORATION
Partial Statement of Comprehensive Income
BRIEF EXERCISE 14–15
HOLLOWAY CORPORATION
Partial Statement of Comprehensive Income
SOLUTIONS FOR DO IT! REVIEW EXERCISES
DO IT! 14-1
Increase (Decrease) in 2017
Amount
Percent
DO IT! 14-2
2017 2016
(a) Current ratio:
$1,380 ÷ $900 = 1.53:1
$1,310 ÷ $790 = 1.66:1
(b) Inventory turnover:
$955/[($460 + $390) ÷ 2)] = 2.25 times
$890/[($390 + $340) ÷ 2)]= 2.44 times
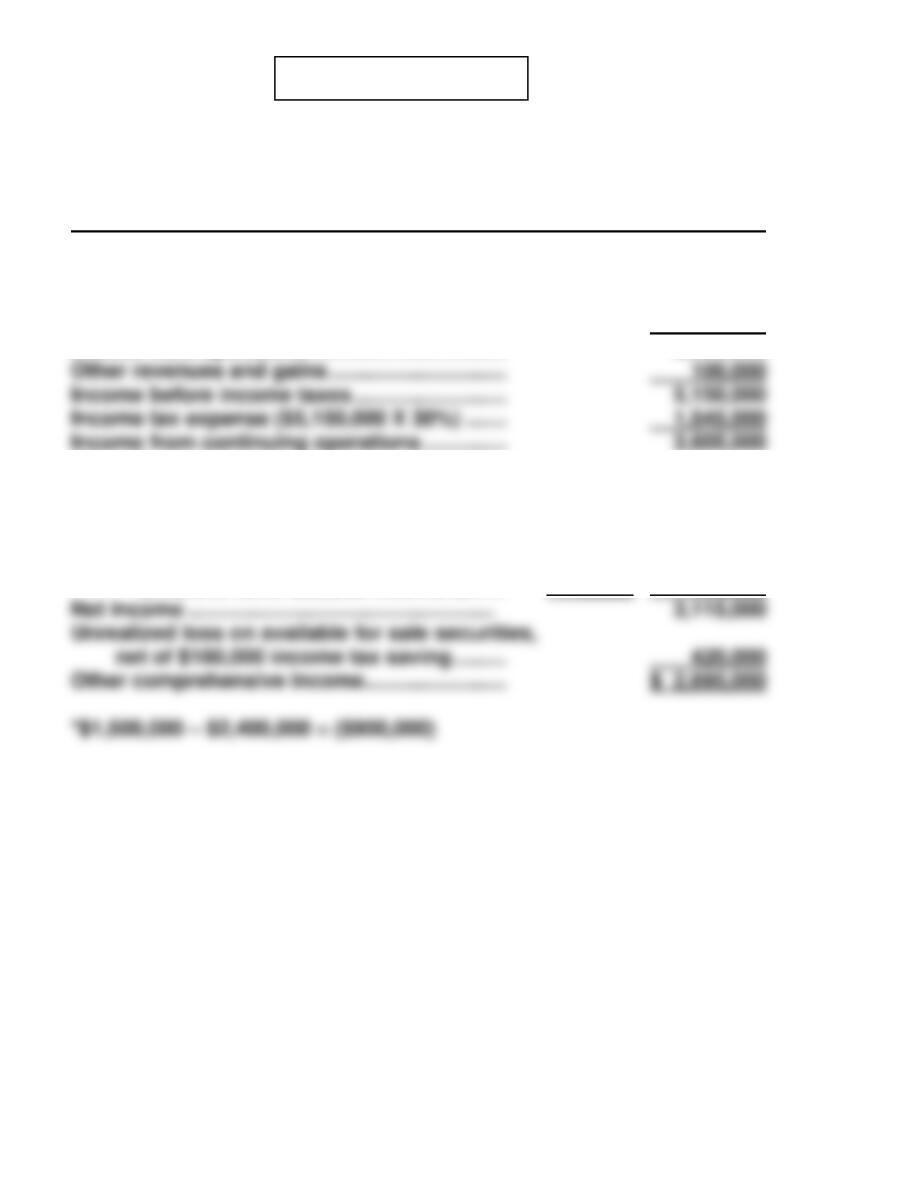
DO IT! 14-3
HRABIK CORPORATION
Statement of Comprehensive Income (Partial)
Income before income taxes …………………………………. $500,000
Income tax expense ……………………………………………… 100,000
Income from continuing operations ………………………. 400,000
Discontinued operations
SOLUTIONS TO EXERCISES
EXERCISE 14-1
KURZEN INC.
Condensed Balance Sheets
December 31
Increase or (Decrease)
2017
2016
Amount
Percentage
Assets
Current assets
Plant assets (net)
Total assets
$125,000
396,000
$521,000
$100,000
330,000
$430,000
($25,000
( 66,000
91,000
(25.0%)
(20.0%)
(21.2%)
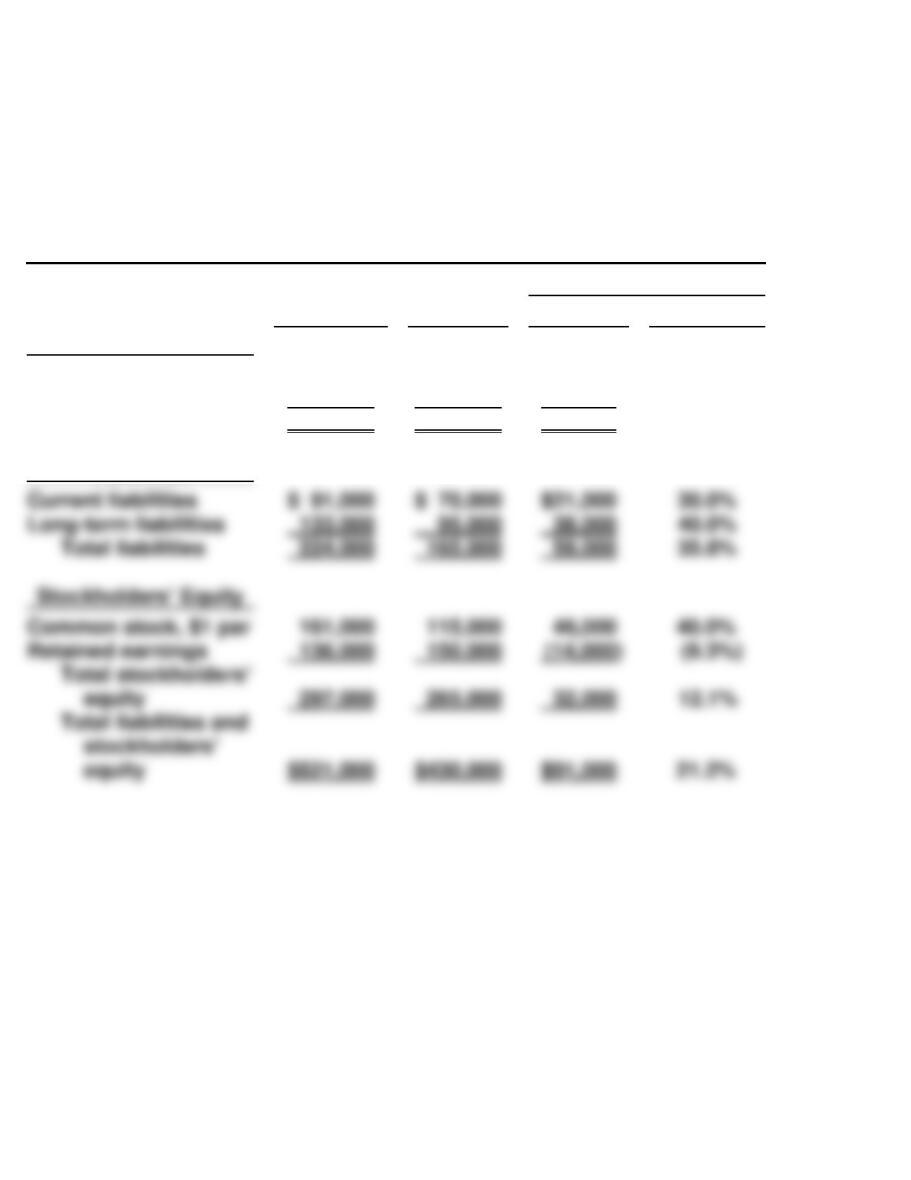
Liabilities
Current liabilities
Total liabilities
$ 91,000
224,000
$ 70,000
165,000
(30.0%)
(35.8%)
Total liabilities and
equity
$521,000
$430,000
EXERCISE 14-2
NAVARRO CORPORATION
Condensed Income Statements
For the Years Ended December 31
2017
2016
Amount
Percent
Amount
Percent
Net sales
Cost of goods sold
Gross profit
$750,000
465,000
285,000
100.0%
62.0%
38.0%
$600,000
390,000
210,000
100.0%
65.0%
35.0%
EXERCISE 14-3
(a) GURLEY CORPORATION
Condensed Balance Sheets
December 31
2017
2016
Increase
(Decrease)
Percentage
Change
from 2016
Assets
Current assets
$ 74,000
$ 80,000
$ (6,000)
(7.5%)
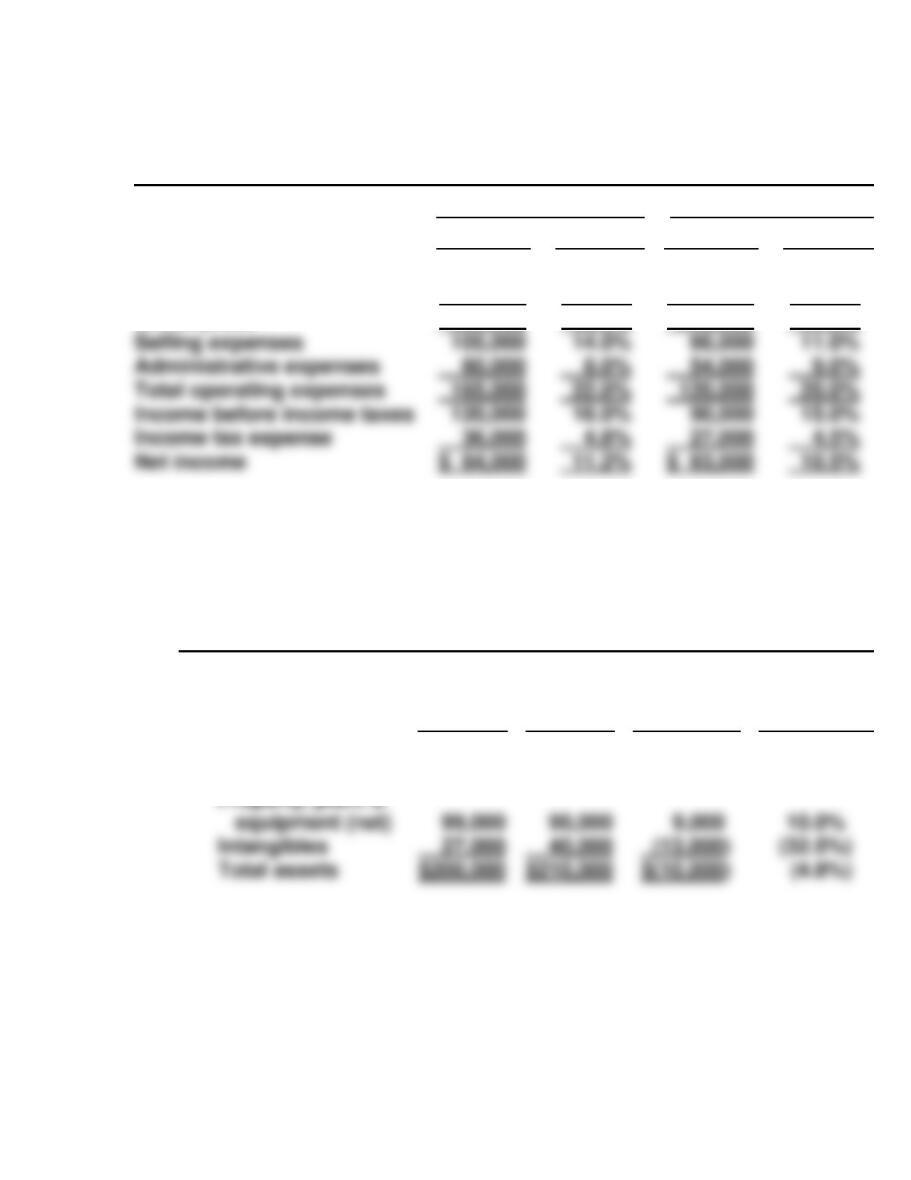
Selling expenses
Income before income taxes
EXERCISE 14-3 (Continued)
GURLEY CORPORATION
Condensed Balance Sheets (Continued)
December 31
2017
2016
Increase
(Decrease)
Percentage
Change
from 2016
Liabilities and stock-
holders’ equity
Current liabilities
$ 42,000
$ 48,000
$ (6,000)
(12.5%)
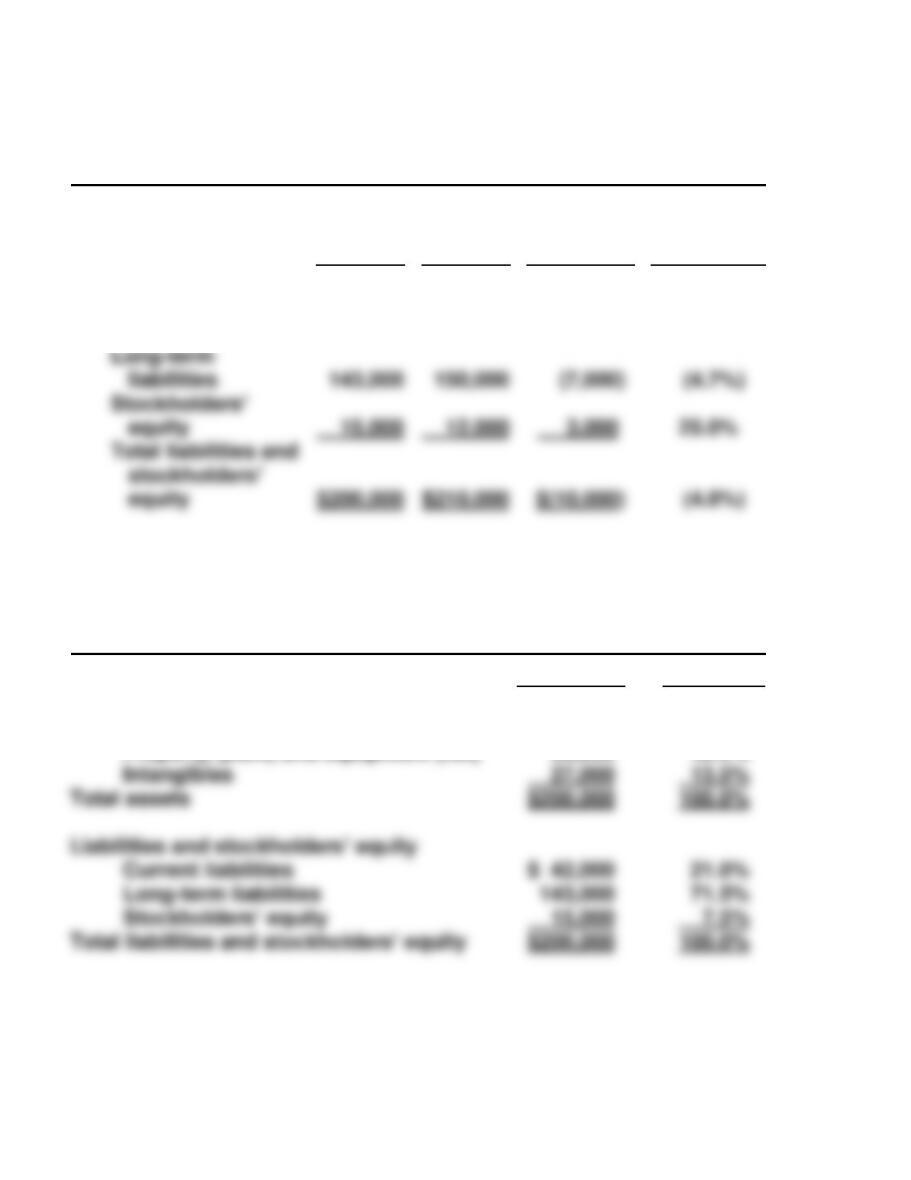
(b) GURLEY CORPORATION
Condensed Balance Sheet
December 31, 2017
Amount
Percent
Intangibles
Long-term liabilities
Assets
Current assets
Property, plant, and equipment (net)
$ 74,000
99,000
37.0%
49.5%
Total liabilities and
EXERCISE 14-4
(a) EMLEY CORPORATION
Condensed Income Statements
For the Years Ended December 31
Increase or (Decrease)
During 2017
2017
2016
Amount
Percentage
Net sales
$660,000
$600,000
$60,000
10.0%
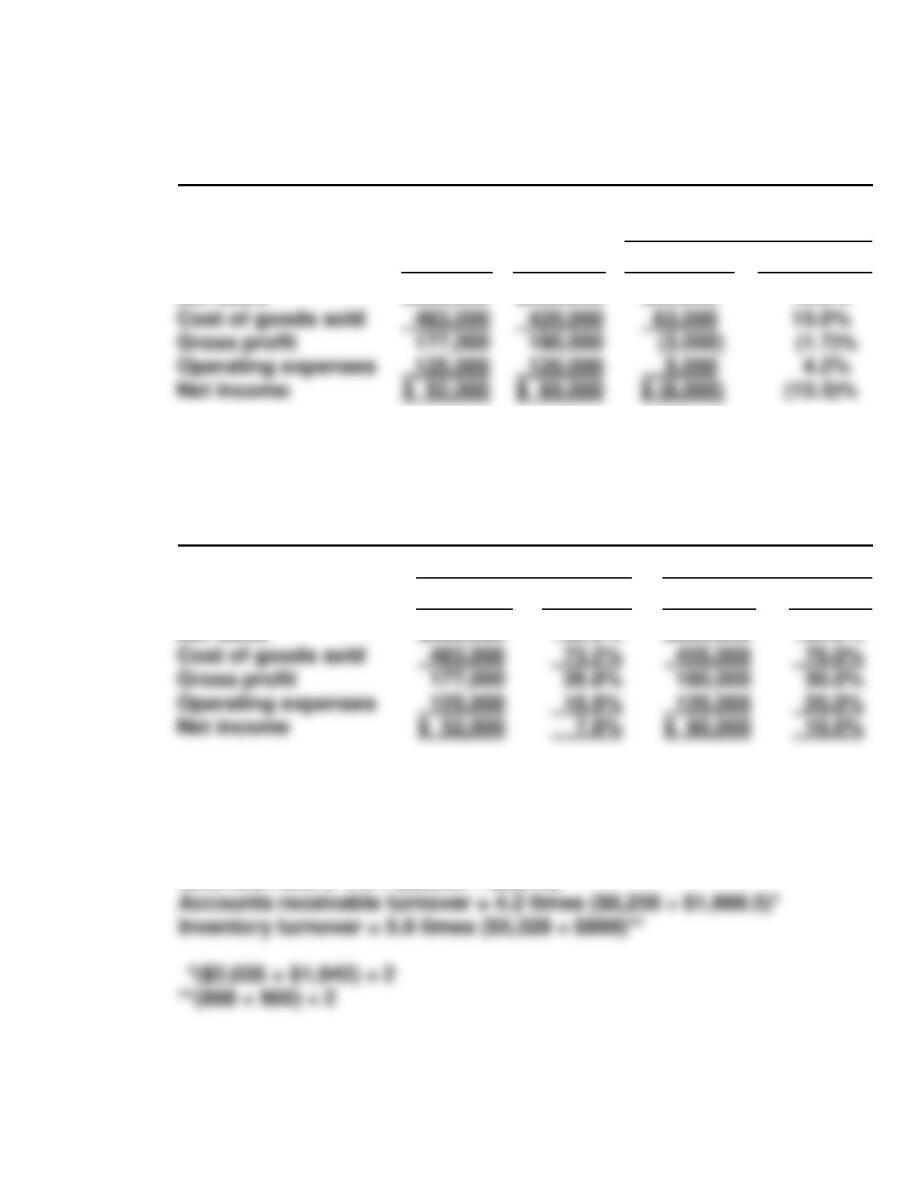
(b) EMLEY CORPORATION
Condensed Income Statements
For the Years Ended December 31
2017
2016
Amount
Percent
Amount
Percent
Net income
$ 60,000
Net sales
$660,000
100.0%
$600,000
100.0%
EXERCISE 14-5
(a) Current ratio = 2.0:1 ($4,054 ÷ $2,014)
Acid-test ratio = 1.4:1 ($2,830 ÷ $2,014)
Net income
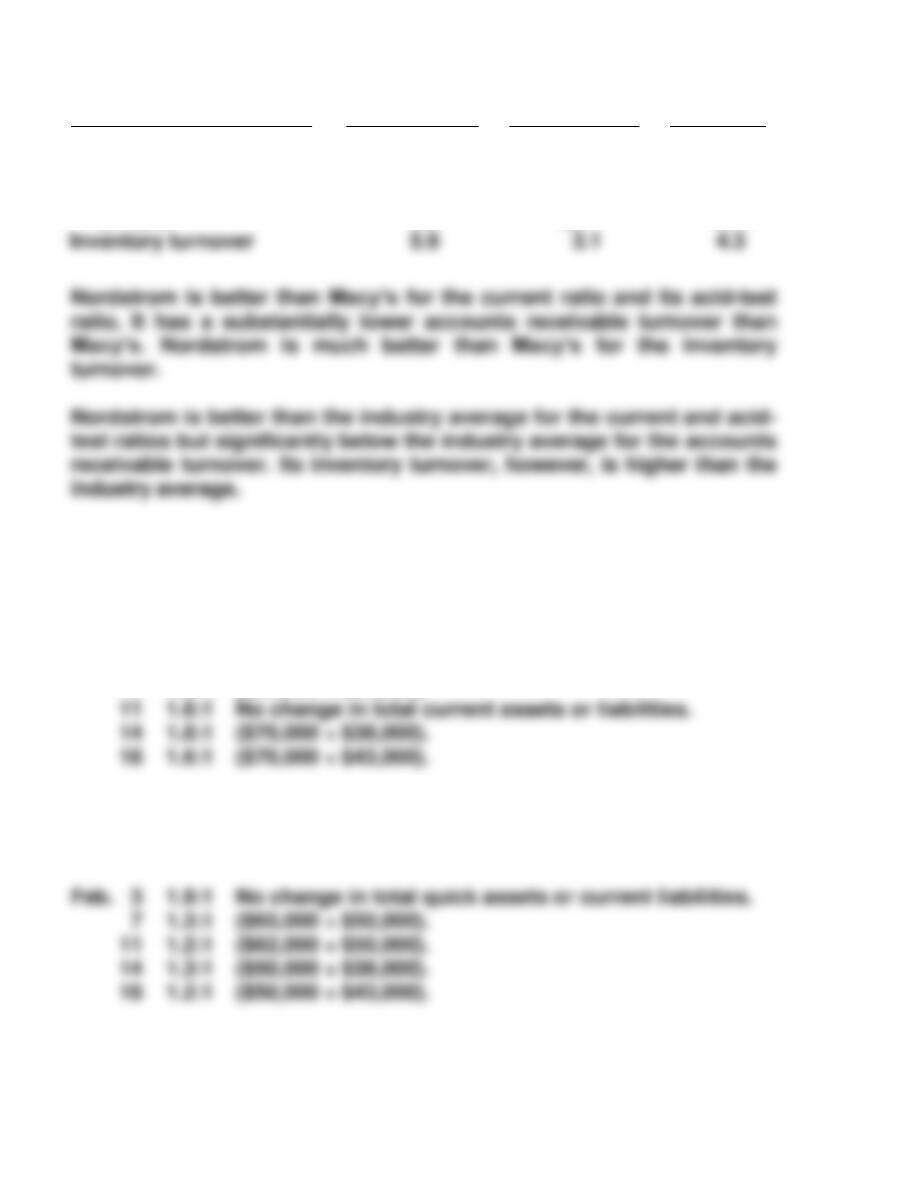
EXERCISE 14-5 (Continued)
(b)
Ratio
Nordstrom
Macy’s
Industry
Current
Acid-test
Accounts receivable
Turnover
2.0:1
1.4:1
4.2
1.52:1
0.47:1
69.1
1.70:1
.70:1
46.4
EXERCISE 14-6
(a) Current ratio as of February 1, 2017 = 2.2:1 ($110,000 ÷ $50,000).
Feb. 3 2.2:1 No change in total current assets or liabilities.
7 1.6:1 ($82,000 ÷ $50,000).
(b) Acid-test ratio as of February 1, 2017 = 1.9:1 ($93,000* ÷ $50,000).
*$110,000 – $15,000 – $2,000
EXERCISE 14-7
(a)
$145,000
$50,000
= 2.9:1.
(b)
$85,000
$50,000
= 1.7:1.
EXERCISE 14-8
(a) Profit margin
$45,000
$750,000
$45,000
$540,000
= 6.0%.
EXERCISE 14-9
(a)
$65,000 – $5,000
30,000 shares
= $2.00.
EXERCISE 14–10
(a) Inventory turnover = 4.5 =
Cost of goods sold
$200,000 + $180,000
2
(b) Accounts Receivable turnover = 8.8 =
Net sales (credit)
$72,500 + $126,000
2
EXERCISE 14-10 (Continued)
(d) Return on assets = 12.5% =
$81,160 [see (c) above]
Average assets
EXERCISE 14–11
(a) ($4,300 + $21,200+ $10,000)/$12,370 = 2.87:1
(b) ($4,300 + $21,200)/$12,370 = 2.06:1
EXERCISE 14–12
(a) HAAS CORPORATION
Partial Statement of Comprehensive Income
For the Year Ended October 31, 2017
Income before income taxes ………………………………………….. $540,000
Income tax expense ($540,000 X 30%) ……………………………. 162,000
Income from continuing operations ……………………………….. 378,000
(b) To: Chief Accountant
From: Your name, Independent Auditor
After reviewing your income statement for the year ended 10/31/17, we
believe it is misleading for the following reasons:
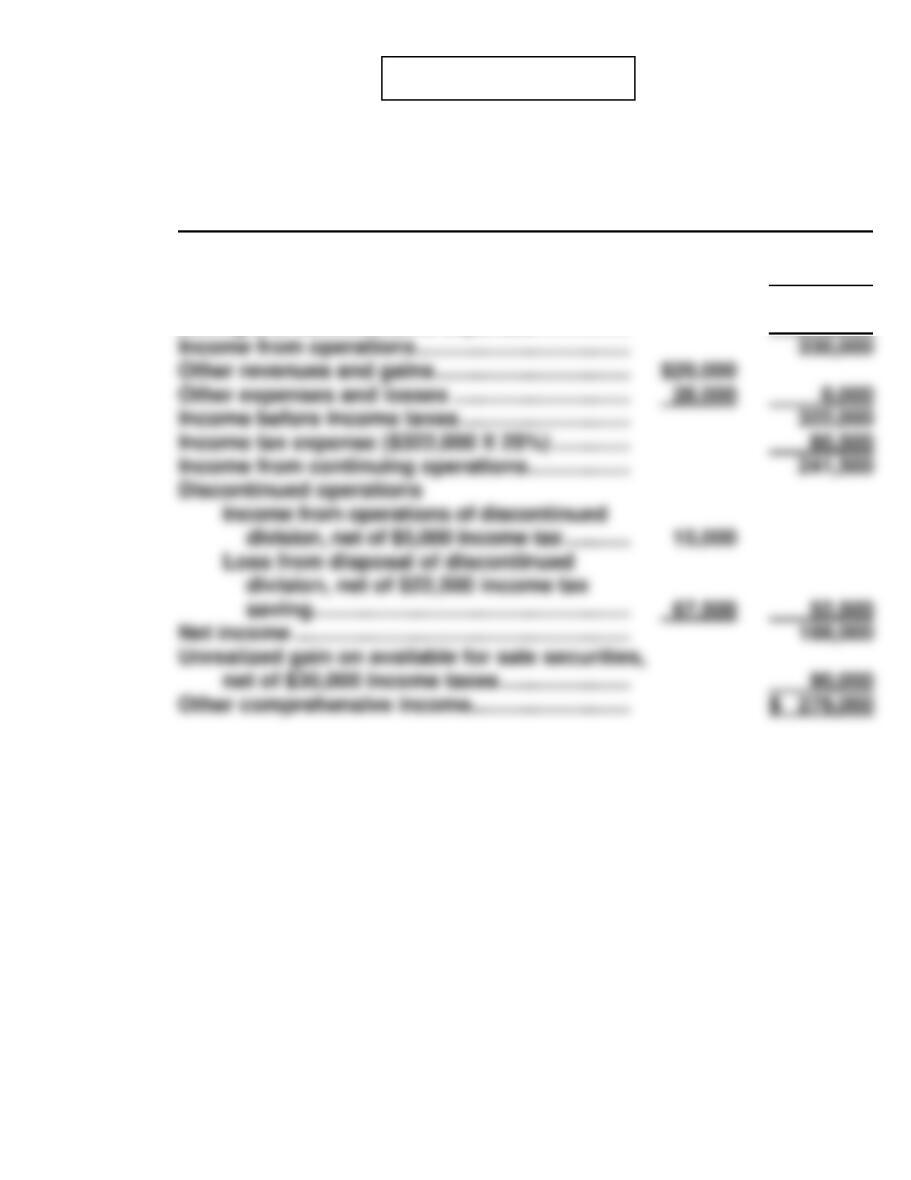
EXERCISE 14–13
TRAYER CORPORATION
Partial Statement of Comprehensive Income
For the Year Ended December 31, 2017
Income from continuing operations ……………………………….. $290,000
Discontinued operations
SOLUTIONS TO PROBLEMS
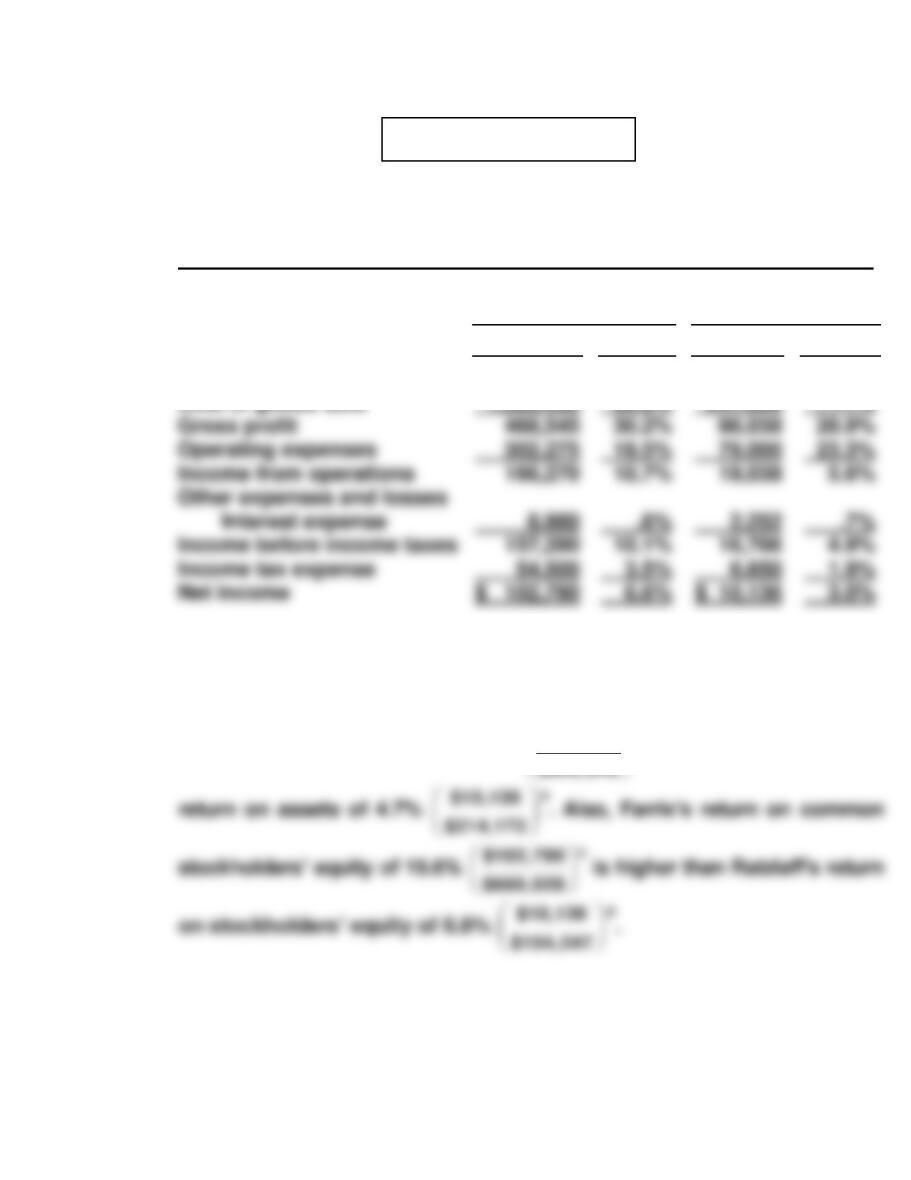
PROBLEM 14-1
(a) Condensed Income Statement
For the Year Ended December 31, 2017
Farris Company
Ratzlaff
Company
Dollars
Percent
Dollars
Percent
Net sales
$1,549,035
100.0%
$339,038
100.0%
(b) Farris Company appears to be more profitable. It has higher relative
gross profit, income from operations, income before taxes, and net income.
Farris’s return on assets of 12.4%
$102,790
$102,790
a is higher than Ratzlaff’s
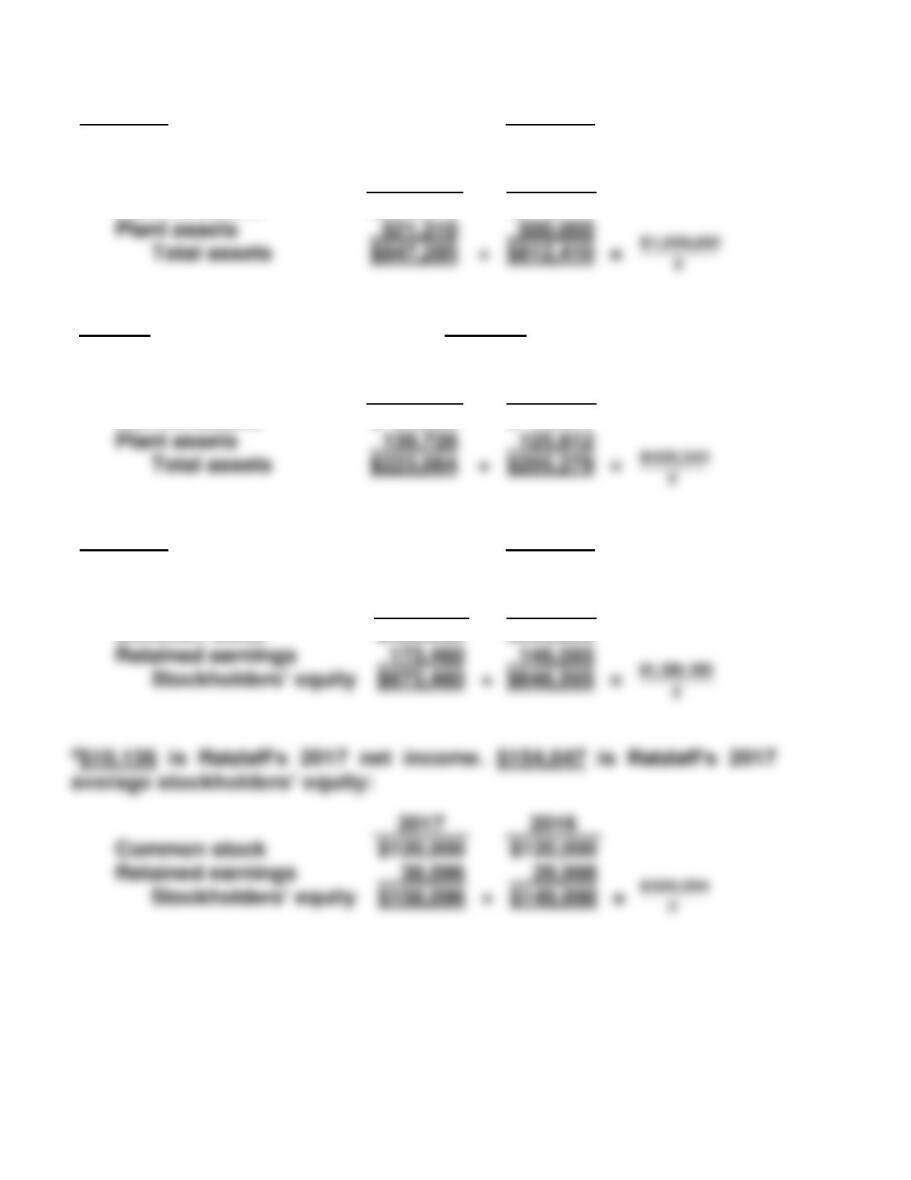
PROBLEM 14-1 (Continued)
a$102,790 is Farris’s 2017 net income. $829,848 is Farris’s 2017
average assets:
2017
2016
Current assets
$325,975
$312,410
b$10,136 is Ratzlaff’s 2017 net income. $214,172 is Ratzlaff’s 2017 average
assets:
2017
2016
Current assets
$ 83,336
$ 79,467
c$102,790 is Farris’s 2017 net income. $660,028 is Farris’s 2017
average stockholders’ equity:
2017
2016
2017
2016
Common stock
$500,000
$500,000
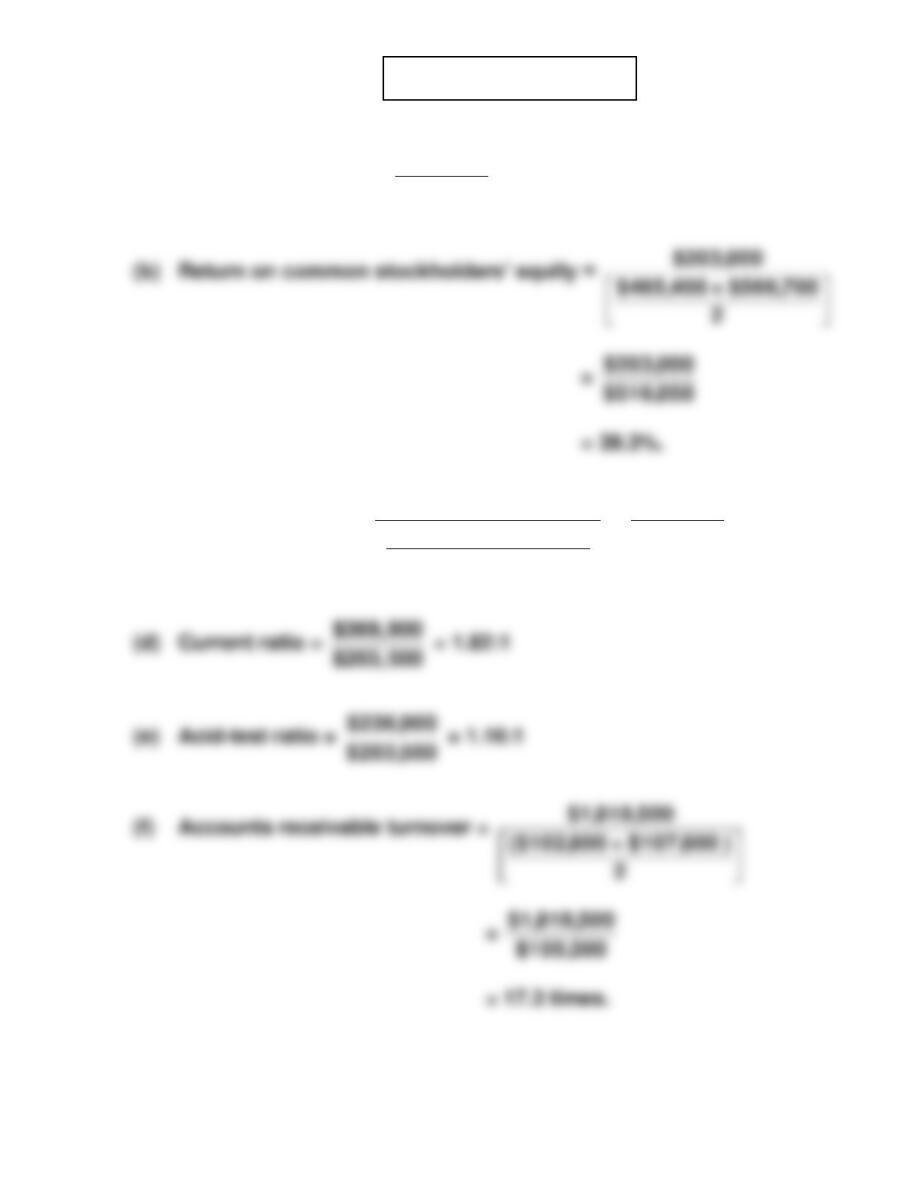
PROBLEM 14-2
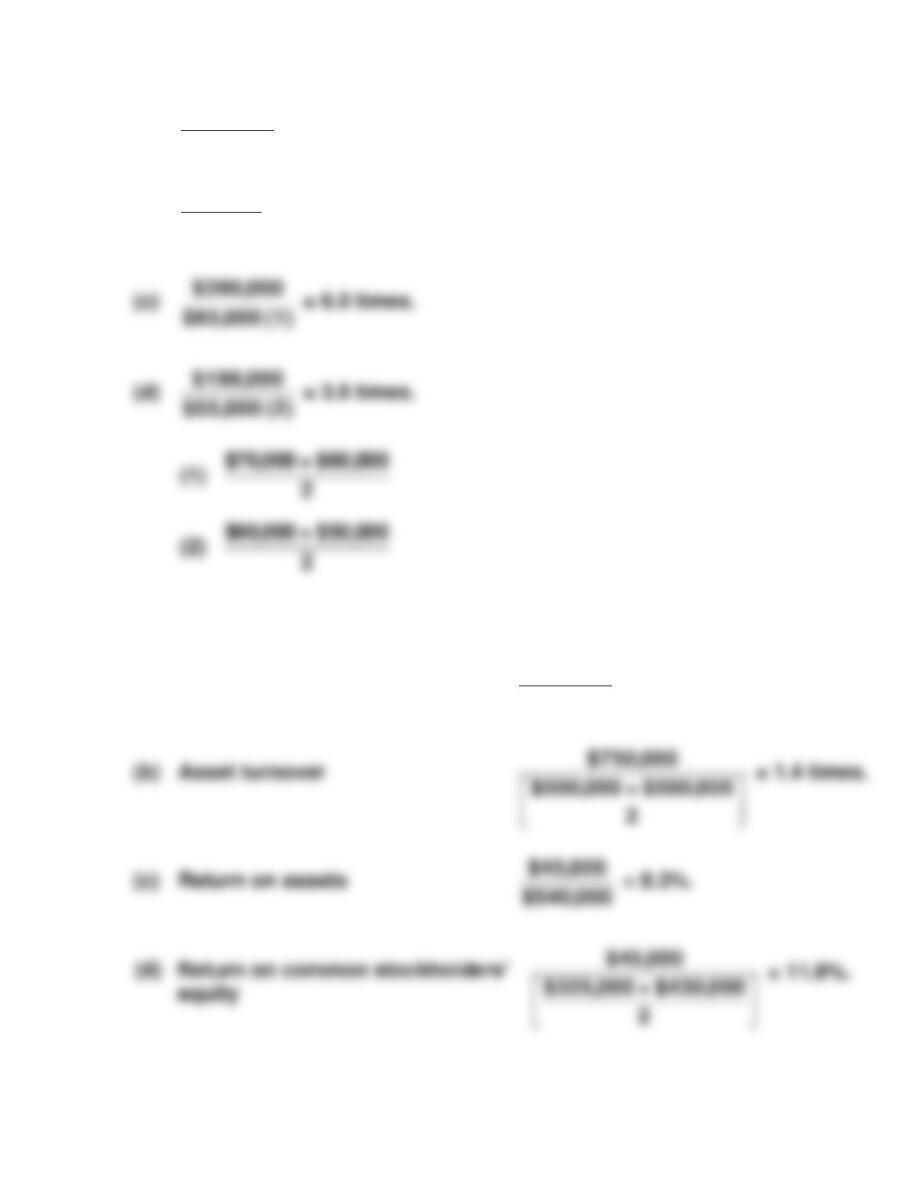
(a) Earnings per share =
$203,000
57,000
= $3.56.
(c) Return on assets =
$203,000
$852,800 + $970,200
2
=
$203,000
$911,500
$236,900
$203,500
= 22.3%.
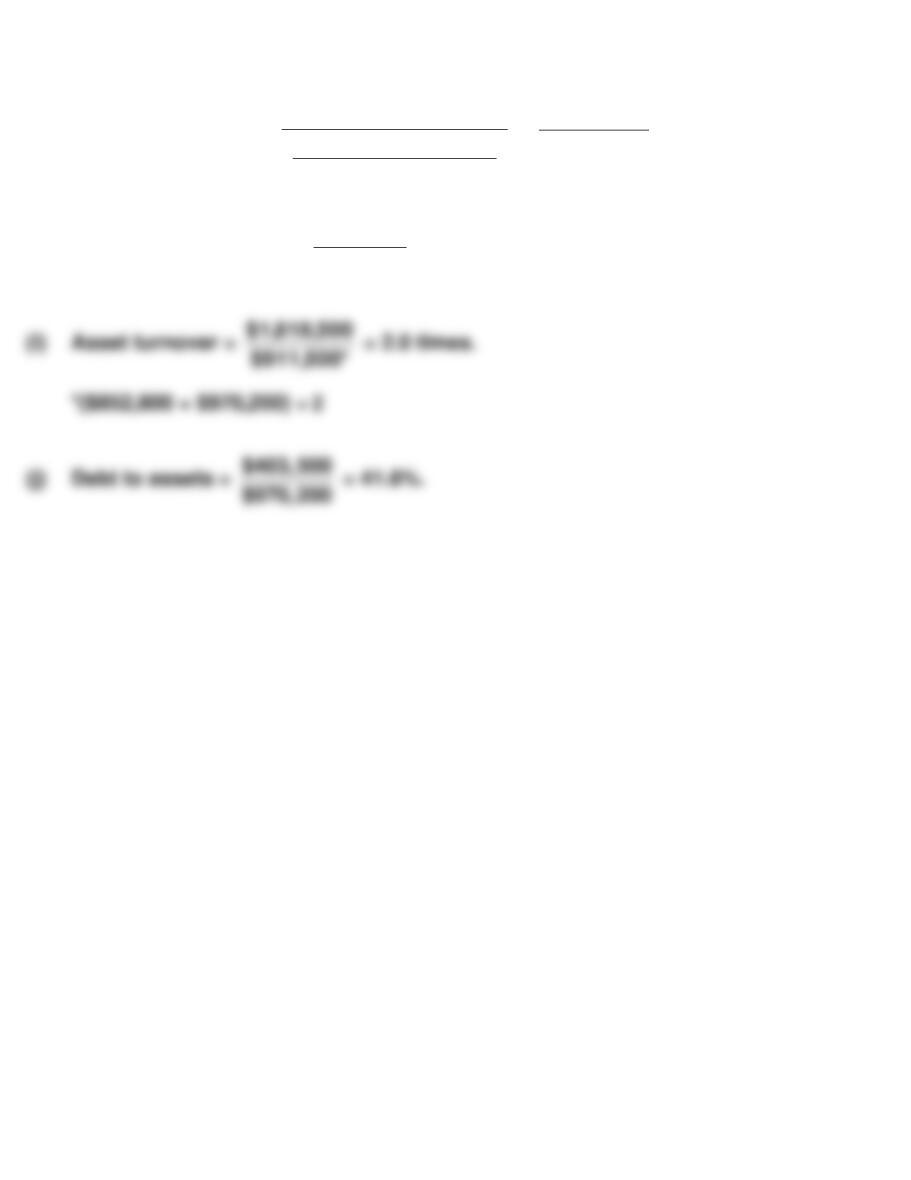
PROBLEM 14-2 (Continued)
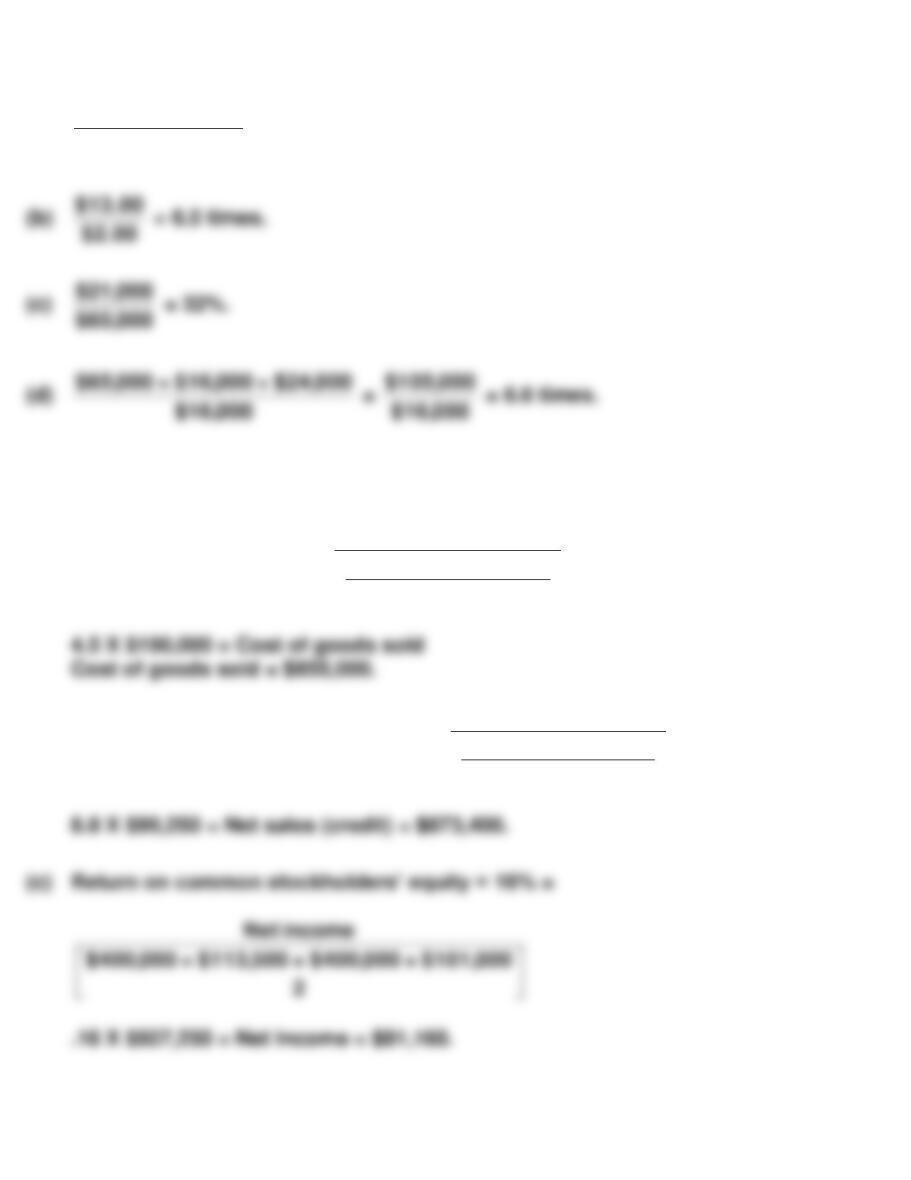
(g) Inventory turnover =
$1,011,500
$115,500 + $133,000
2
=
$1,011,500
$124,250
= 8.1 times.
(h) Times interest earned =
$308,000
$18,000
= 17.1 times.
$1,818,500
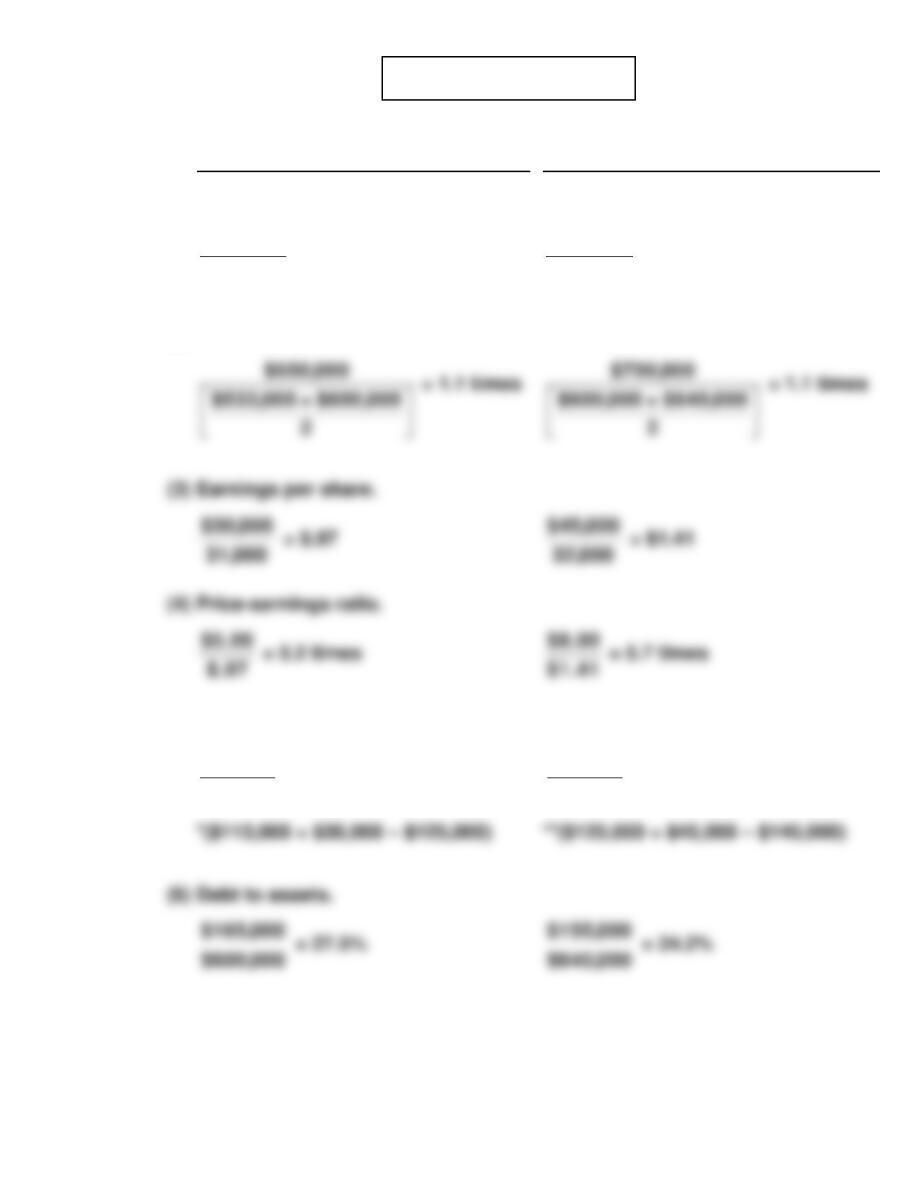
PROBLEM 14-3
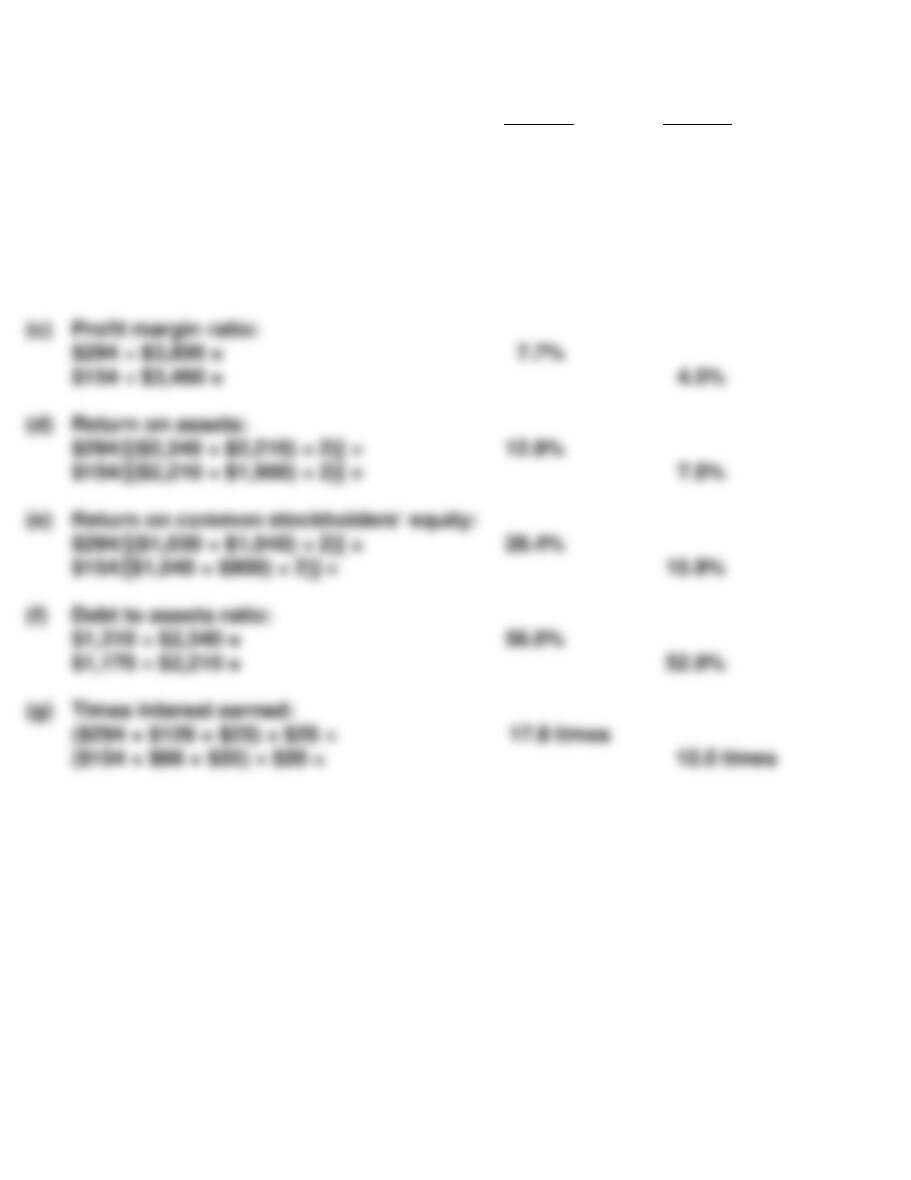
(a)
2017
2018
(1)
Profit margin.
$30,000
$650,000
= 4.6%
$45,000
$700,000
= 6.4%
(2)
Asset turnover.
(5)
Payout ratio.
$18,000*
$30,000
**($125,000 + $45,000 – $145,000)
(6)
$600,000
= 27.5%
$640,000
= 24.2%
= 60.0%
$25,000**
$45,000
= 55.6%

PROBLEM 14-3 (Continued)
(b) The underlying profitability of the corporation appears to have improved.
For example, profit margin and earnings per share have both increased.
In addition, the corporation’s price-earnings ratio has increased, which
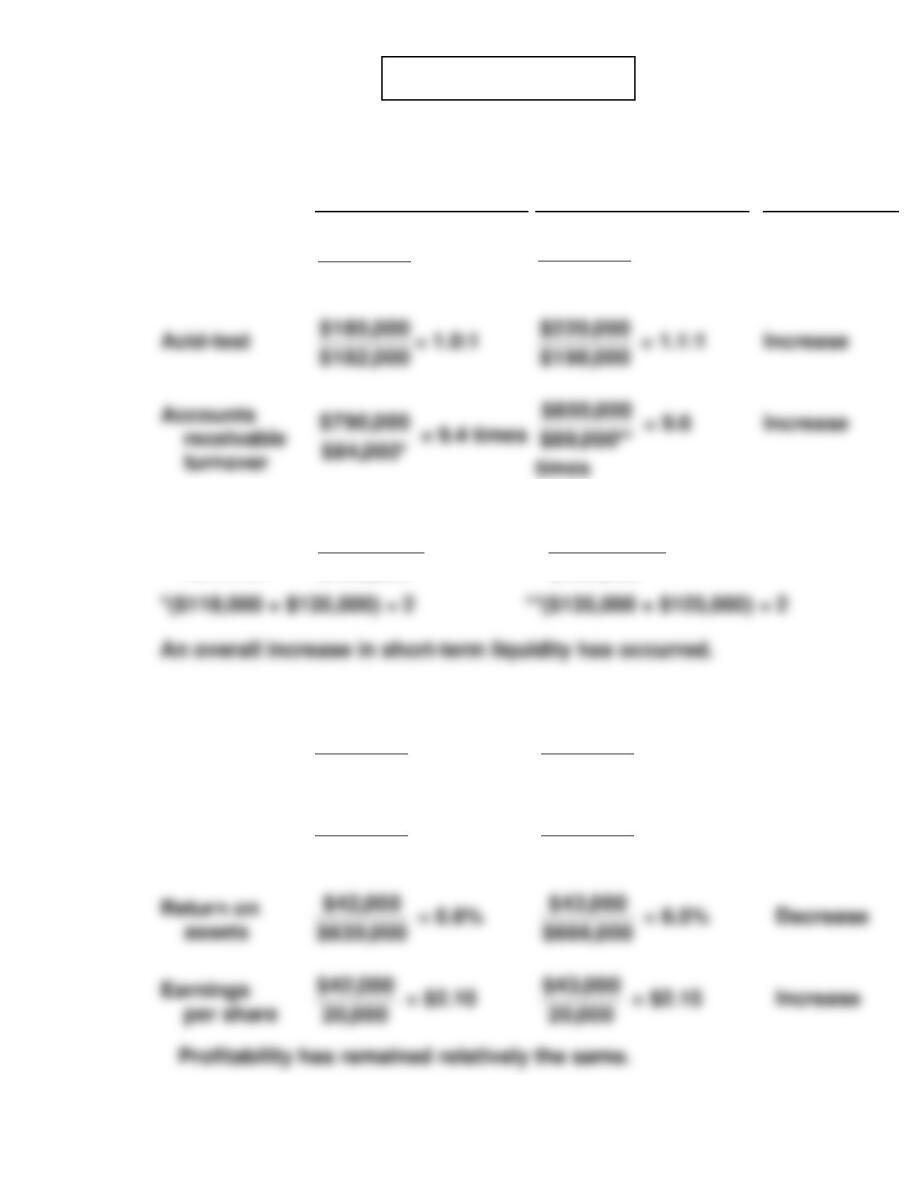
PROBLEM 14-4
(a) LIQUIDITY
2016
2017
Change
Current
$343,000
$182,000
= 1.9:1
$374,000
$198,000
=1.9:1
No change
*($88,000 + $80,000) ÷ 2 **($80,000 + $98,000) ÷ 2
Inventory
turnover
$575,000
$126,500*
= 4.5 times
$620,000
$130,000**
= 4.8 times
Increase
PROFITABILITY
Profit
margin
$42,000
$790,000
= 5.3%
$43,000
$850,000
= 5.1%
Decrease
Asset
turnover
$790,000
$639,000
= 1.2 times
$850,000
$666,000
= 1.3 times
Increase
Return on
assets
$42,000
$639,000
= 6.6%
$43,000
$666,000
= 6.5%
Decrease
Acid-test
$185,000
$182,000
= 1.0:1
$220,000
$198,000
= 1.1:1
Increase
receivable
turnover
$790,000
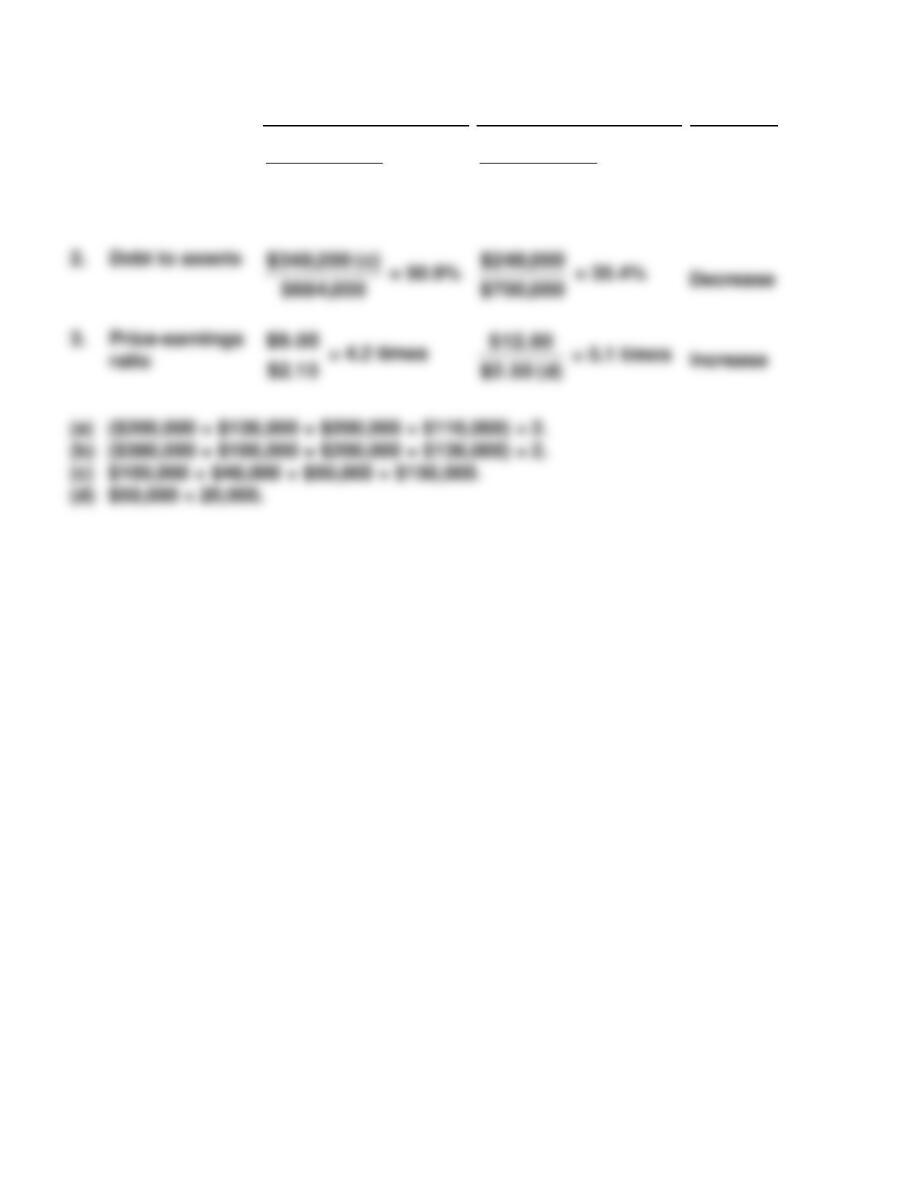
PROBLEM 14-4 (Continued)
(b)
2017
2018
Change
1.
Return on
common
stockholders’
equity
$43,000
$326,000 (a)
= 13.2%
$50,000
$451,000 (b)
= 11.1%
Decrease
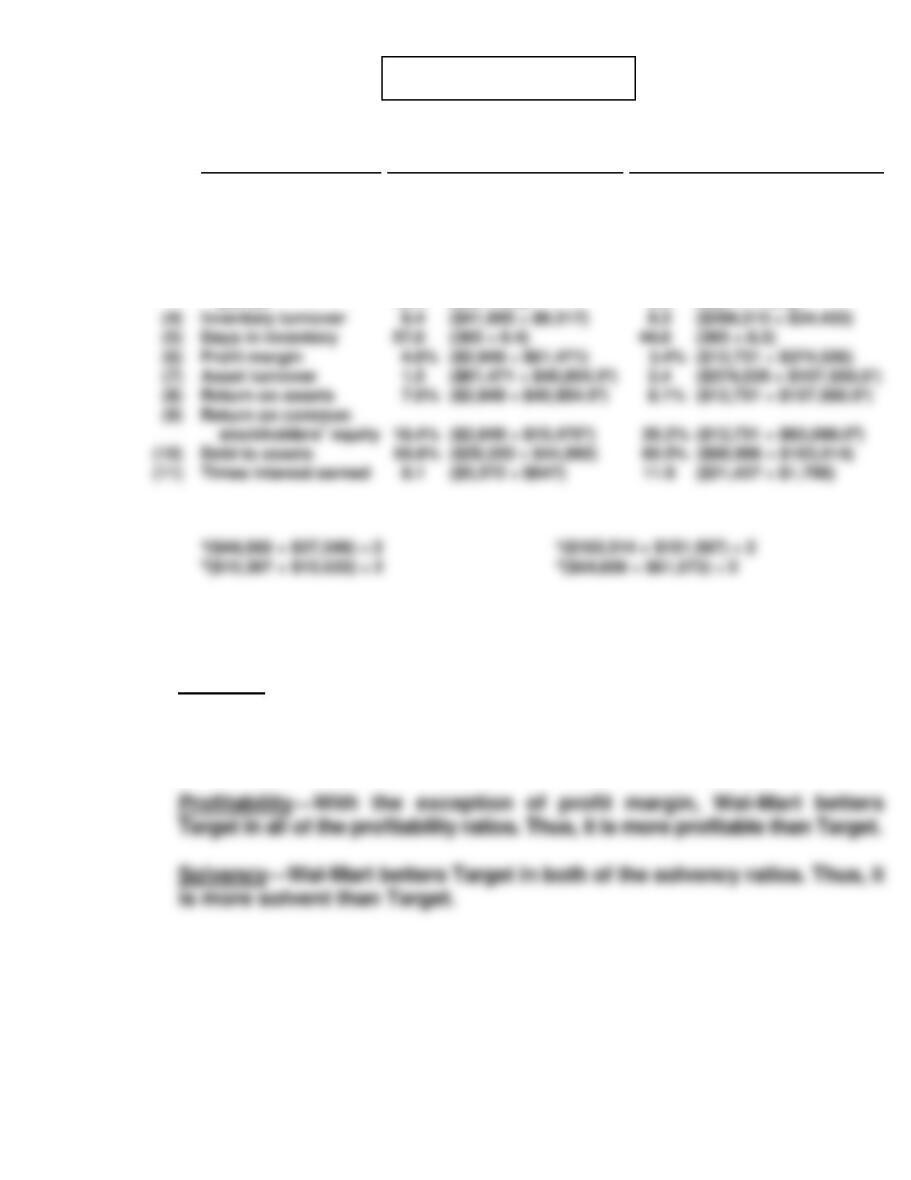
PROBLEM 14-5
(a)
Ratio
Target
Wal-Mart
(All Dollars Are in Millions)
(1)
(2)
(3)
Current
Accounts receivable
turnover
Average collection
period
1.6:1 ($18,906 ÷ $11,782)
8.6 ($61,471 ÷ $7,124)
42.4 (365 ÷ 8.6)
.8:1 ($47,585 ÷ $58,454)
115.3 ($374,526 ÷ $3,247)
3.2 (365 ÷ 115.3)
(b) The comparison of the two companies shows the following:
Liquidity—Target’s current ratio of 1.6:1 is significantly better than
Wal-Mart’s .8:1. However, Wal–Mart has a better inventory turnover ratio
than Target and its accounts receivable turnover is substantially better than
Target’s.
Times interest earned
8.1 ($5,272 ÷ $647)
11.9 ($21,437 ÷ $1,798)
PROBLEM 14-6
(a) Current ratio =
$215,000
$145,000
= 1.5:1.
(b) Acid-test ratio =
$21,000 + $18,000 + $91,000
$145,000
$595,000
= 0.90:1.
(g) Return on assets =
$36,400
$638,000 + $560,000
2
= 6.1%.
$36,400
$373,000 + $350,000
2
PROBLEM 14-6 (Continued)
(i) Earnings per share =
$36,400
30,000 (1)
= $1.21.
(1) $150,000 ÷ $5.00
(j) Price-earnings ratio =
$19.50
$1.21
= 16.1 times.
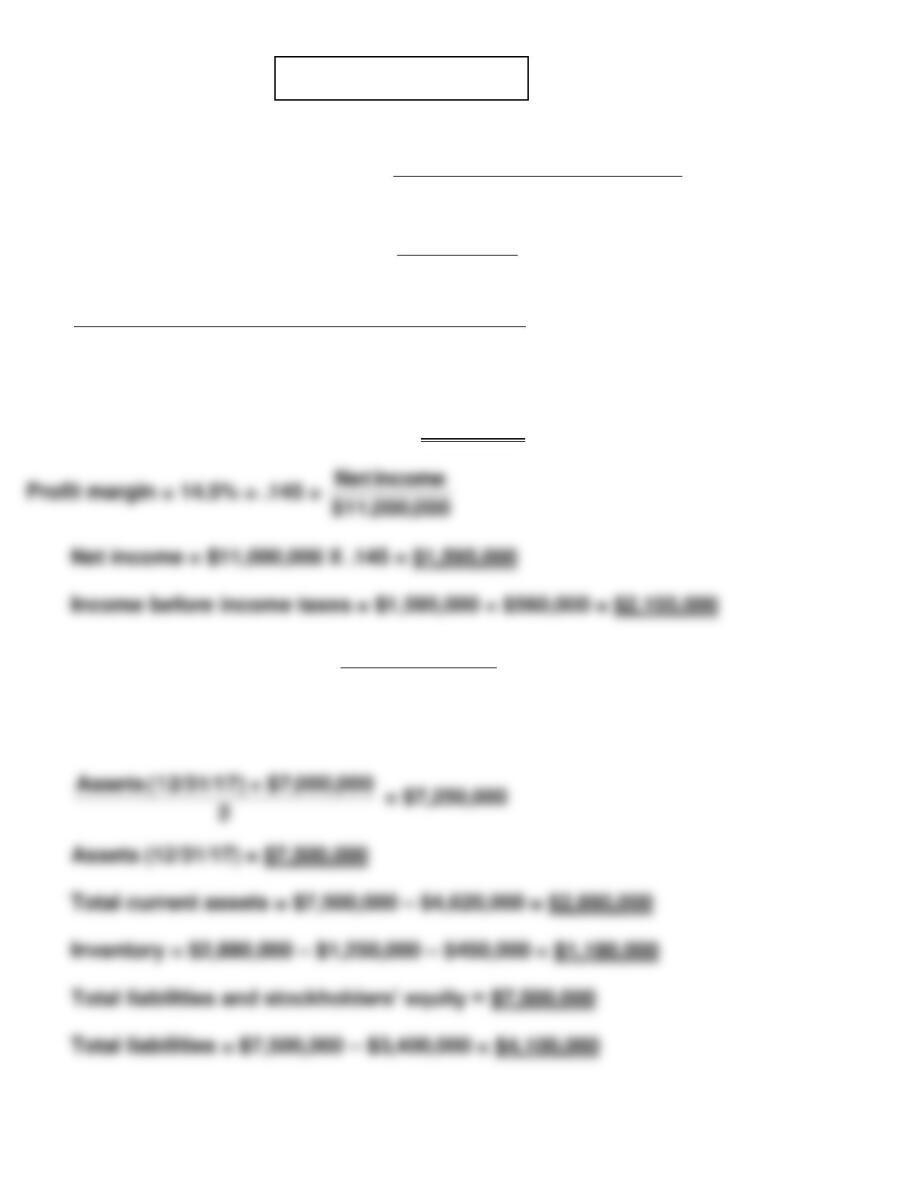
PROBLEM 14-7
Accounts receivable turnover = 10 =
$11,000,000
Average accounts receivable
Averages accounts receivable =
$11,000,000
10
= $1,100,000
Net accounts receivables12/31/17 + $950,000
2
= $1,100,000
Net accounts receivable 12/31/17 + $950,000 = $2,200,000
Net accounts receivable 12/31/17 = $1,250,000
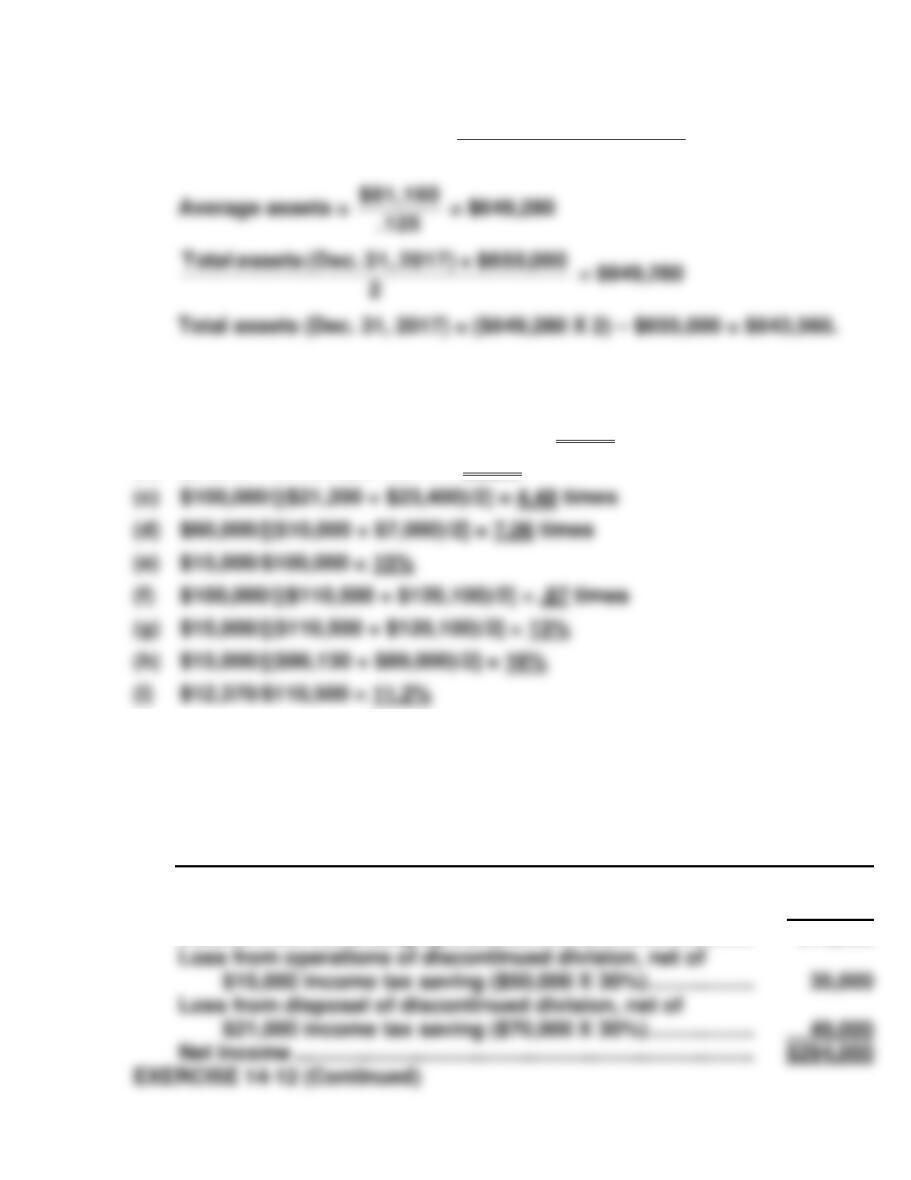
Return on assets = 22% = .22 =
$1,595,000
Average assets
Average assets = $1,595,000 ÷ .22 = $7,250,000
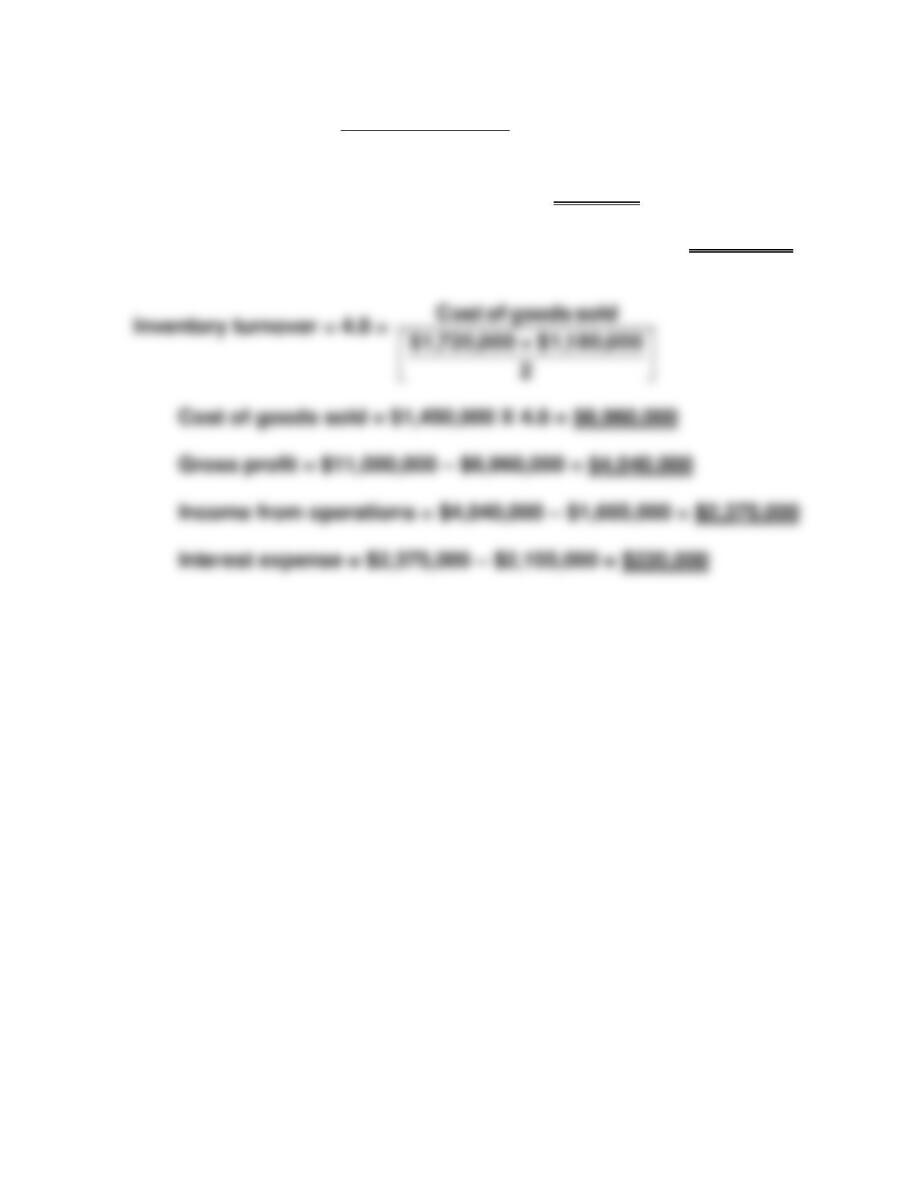
PROBLEM 14-7 (Continued)
Current ratio = 3.0 =
$2,880,000
Currentliabilities
Current liabilities = $2,880,000 ÷ 3.0 = $960,000
Long-term notes payable = $4,100,000 – $960,000 = $3,140,000
PROBLEM 14-8
TERWILLIGER CORPORATION
Statement of Comprehensive Income
For the Year Ended December 31, 2017
Operating revenues
($12,850,000 – $1,500,000) …………………….. $11,350,000
Operating expenses
($8,700,000 – $2,400,000) ………………………. 6,300,000
Income from operations …………………………... 5,050,000
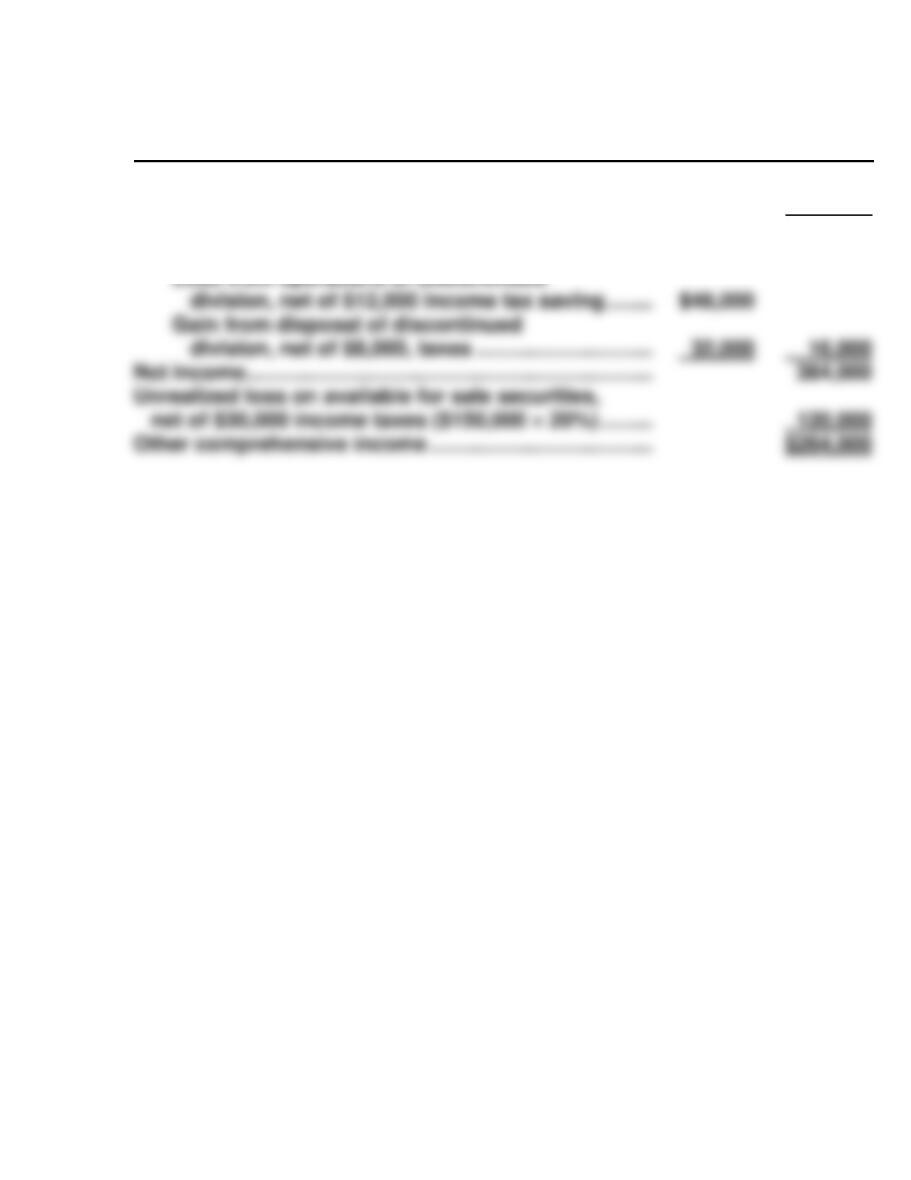
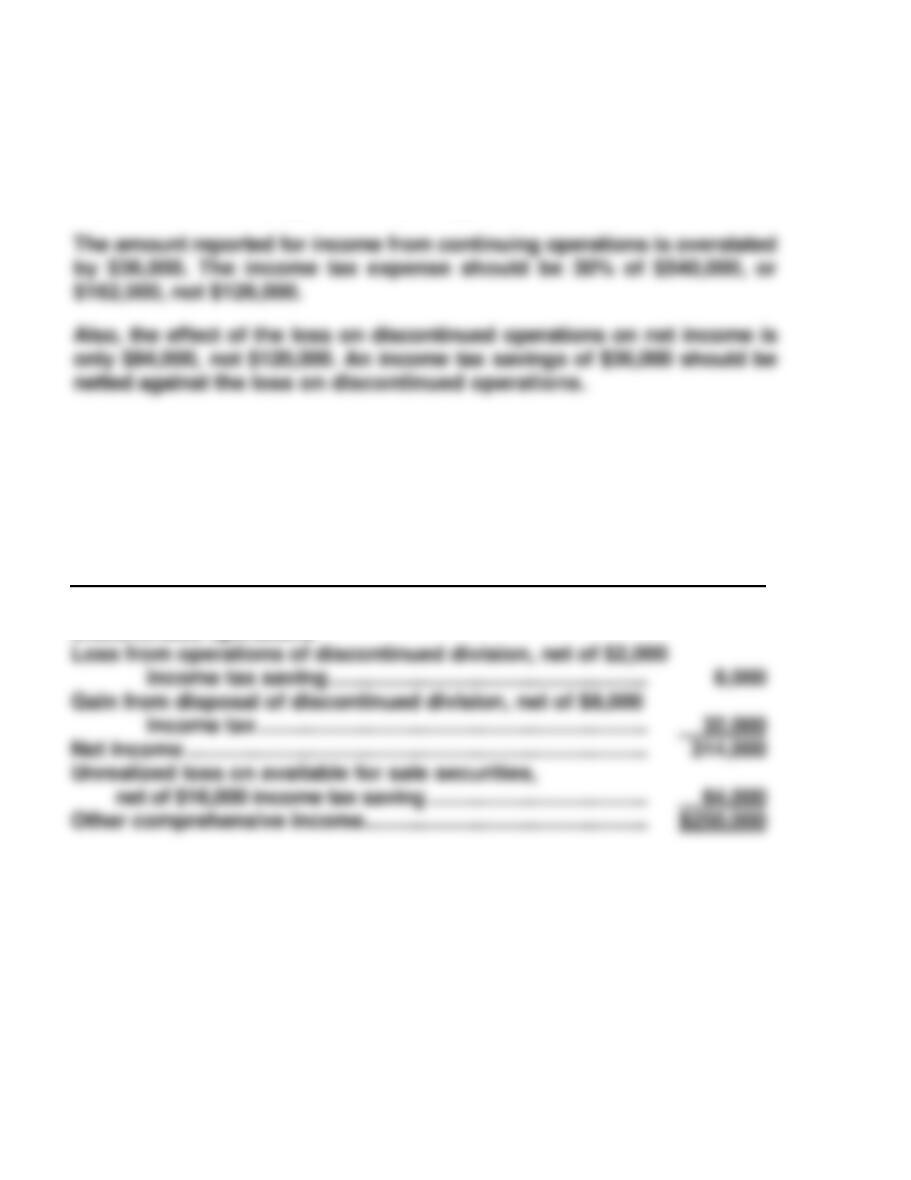
Discontinued operations
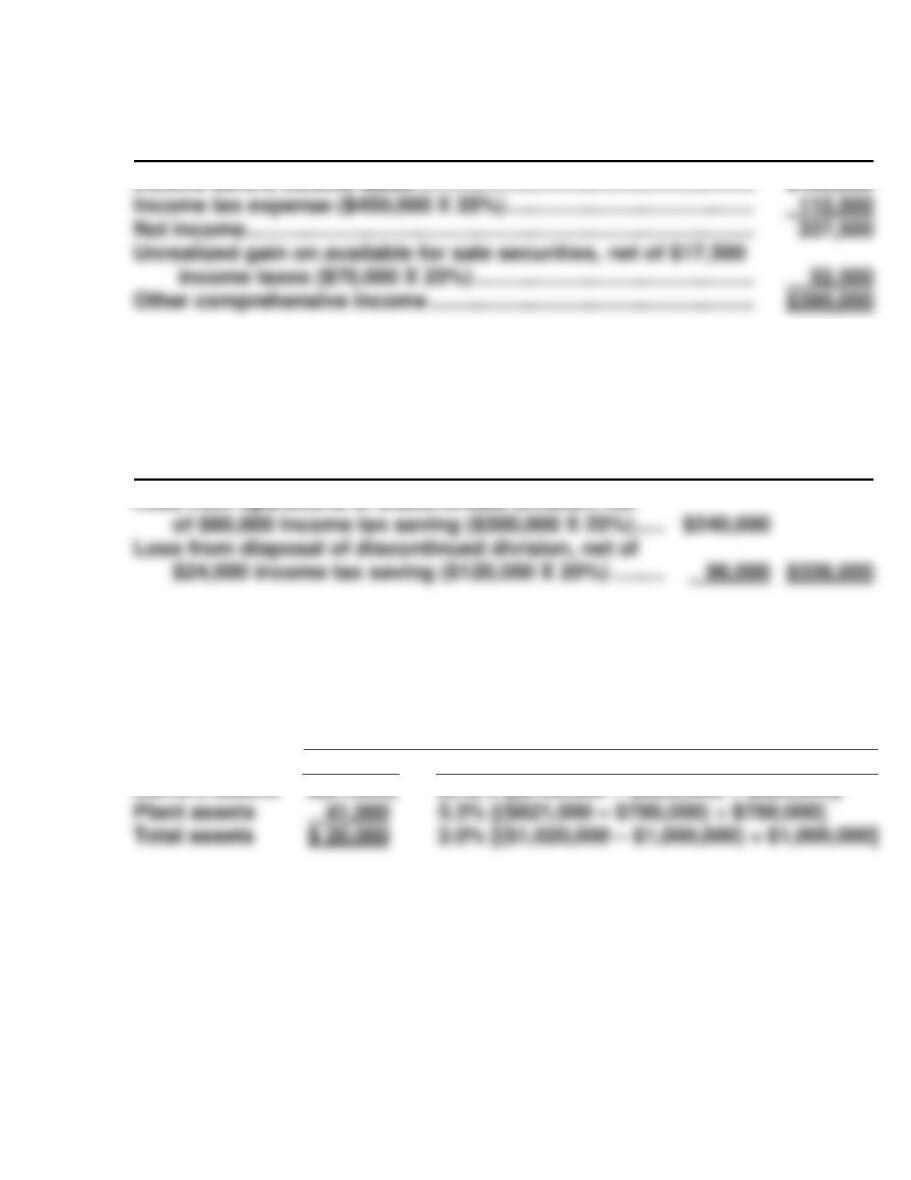
Loss from operations of discontinued division*,
net of $270,000 income
tax saving ……………………………………… $630,000
Gain from disposal of discontinued
division, net of $60,000 income tax …. 140,000 490,000
PROBLEM 14-9
JAIME CORPORATION
Statement of Comprehensive Income
For the Year Ended December 31, 2017
Net sales ……………………………………………………. $1,700,000
Cost of goods sold …………………………………….. 1,100,000
Gross profit ……………………………………………….. 600,000
Selling and administrative expenses …………… 270,000
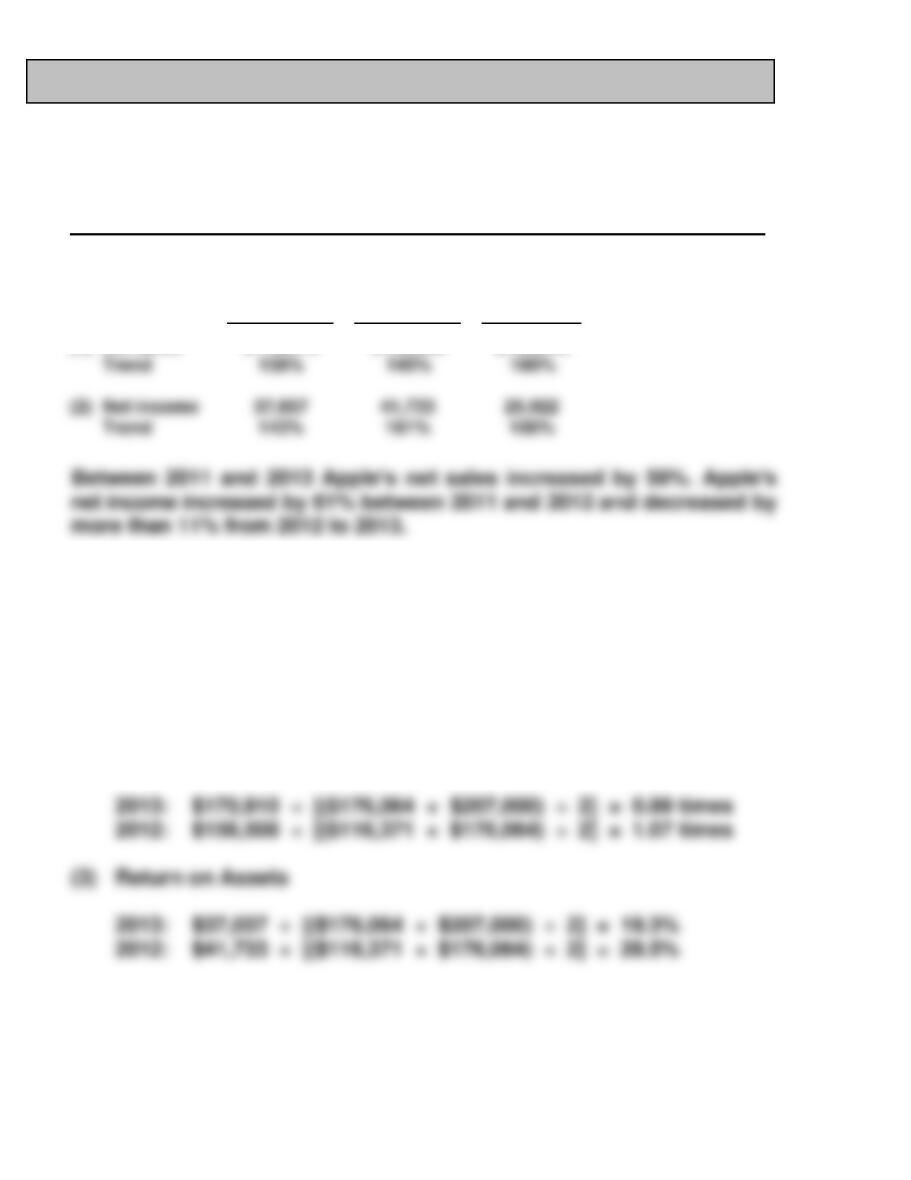
BYP 14-1 FINANCIAL REPORTING PROBLEM
(a) APPLE, INC.
Trend Analysis of Net Sales and Net Income
For the Three Years Ended 2013
Base Period 2011—(in millions)
2013
2012
2011
(1)
Net sales
$170,910
$156,508
$108,249
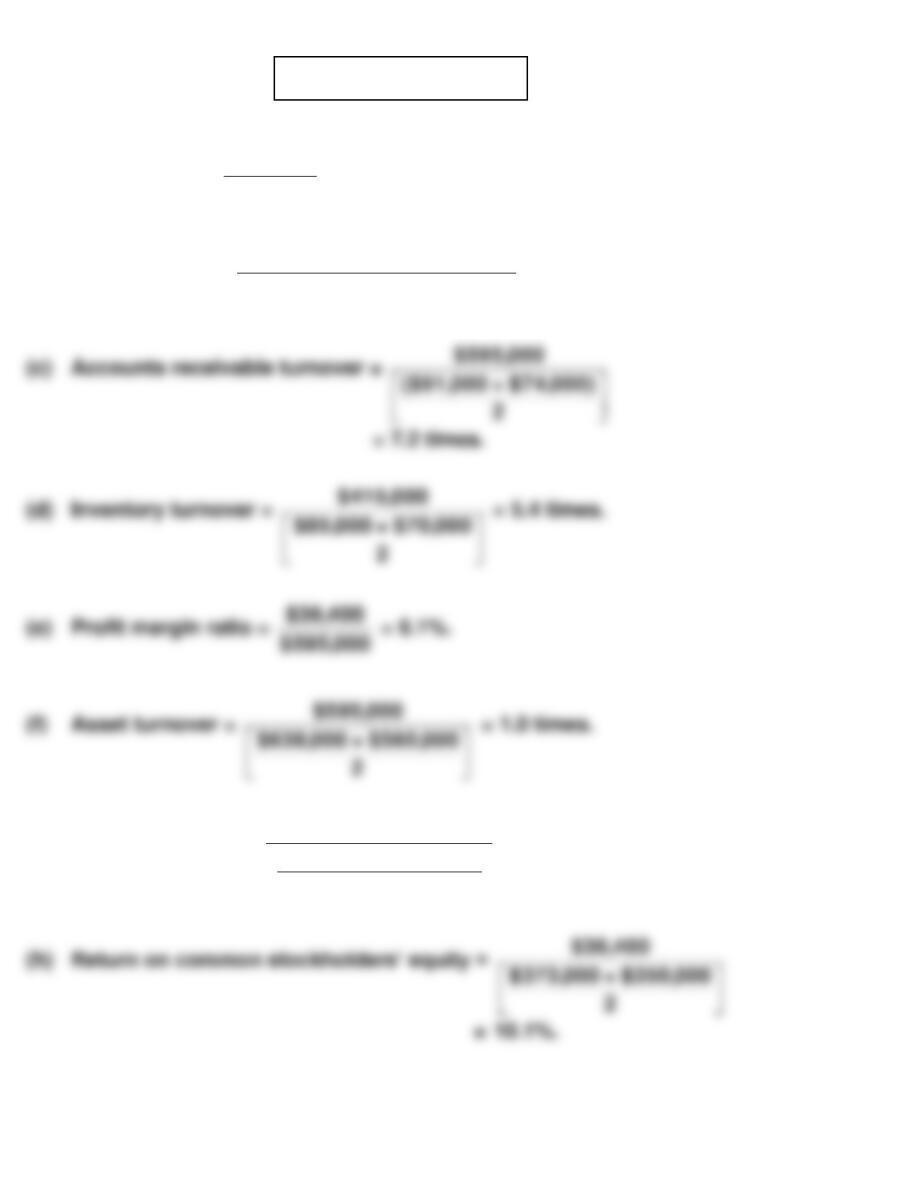
(b) (dollar amounts in millions)
(1) Profit Margin
2013: $37,037 ÷ $170,910 = 21.7%
2012: $41,733 ÷ $156,508 = 26.7%
(2) Asset Turnover
(2)
Net income
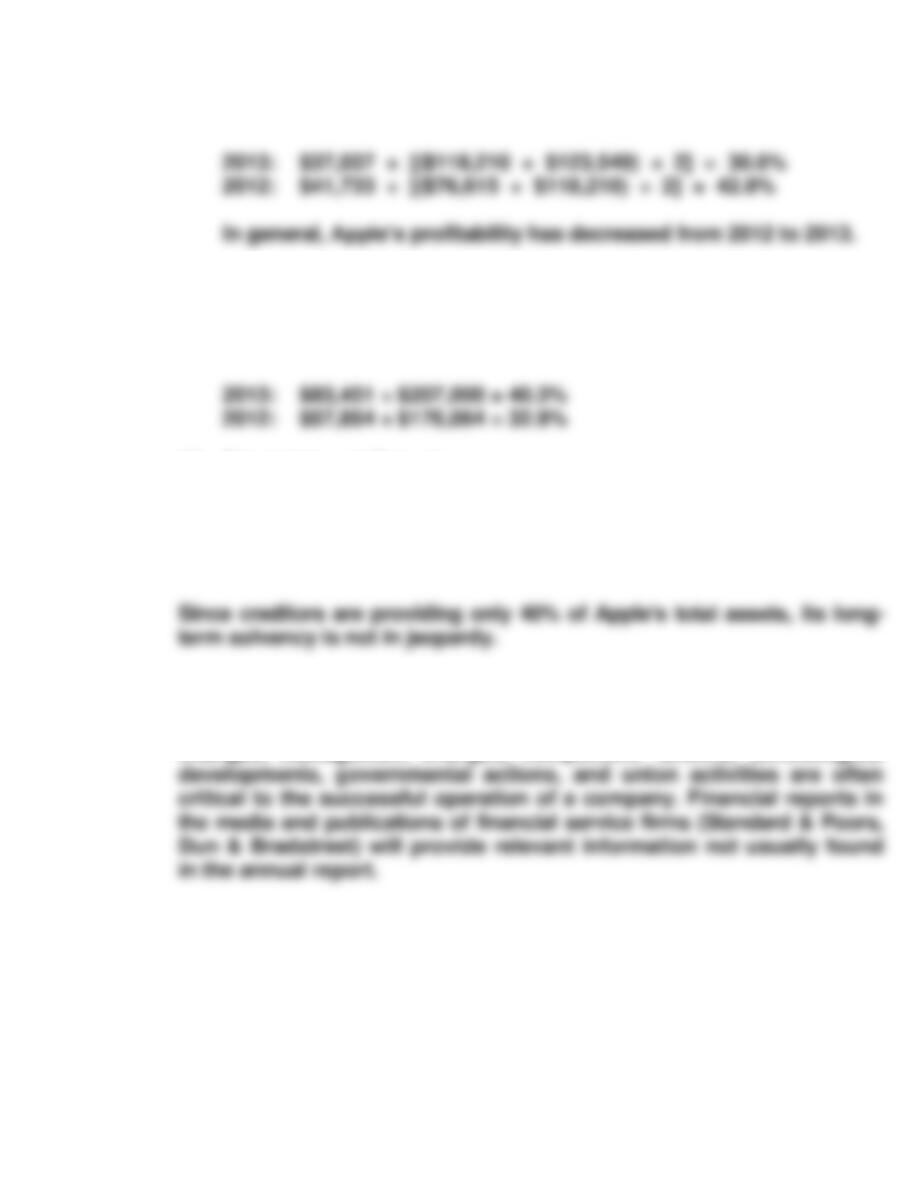
BYP 14-1 (Continued)
(4) Return on Common Stockholders’ Equity
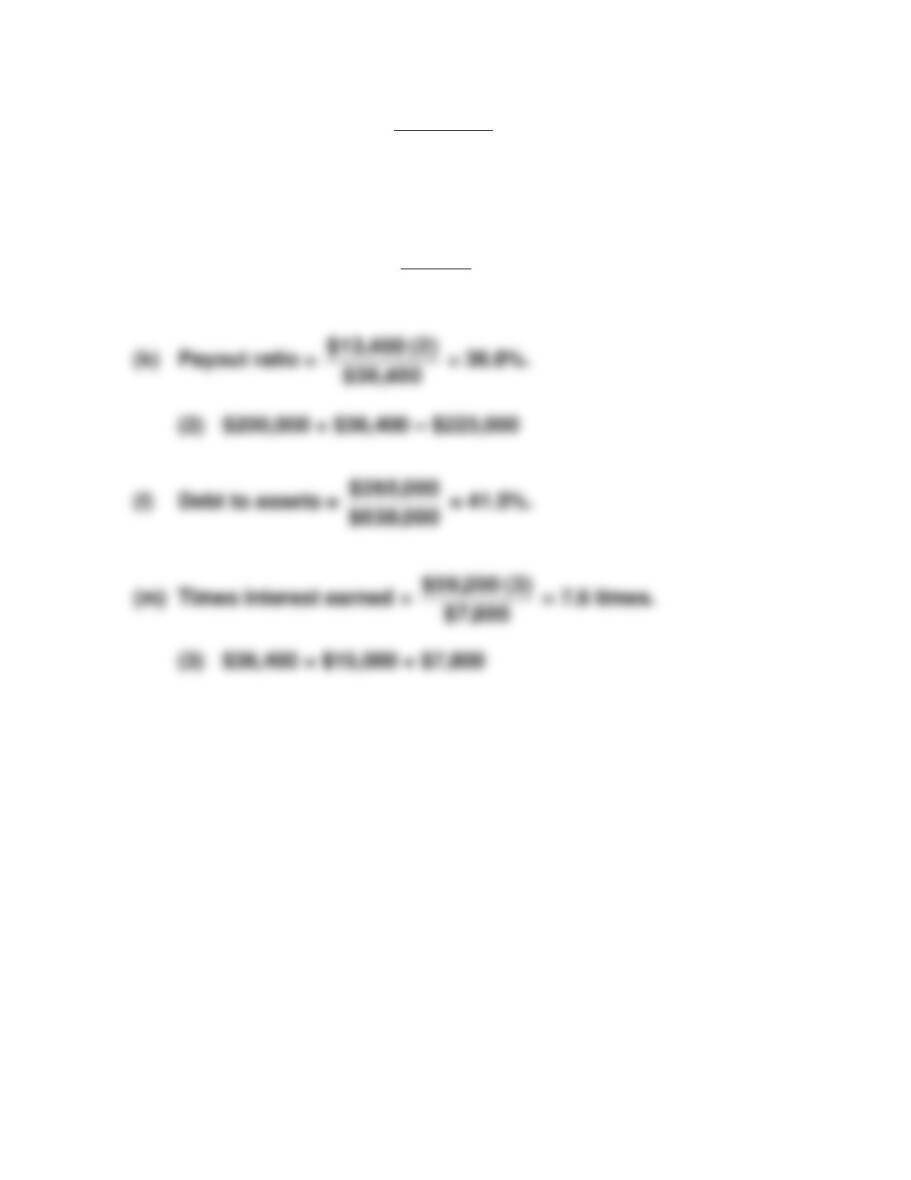
(c) (dollar amounts in millions)
(1) Debt to Assets
(2) Times Interest Earned
2013: ($50,125 + $136) ÷ $136 = 369.8 times
2012: Apple reported no interest expense so this ratio cannot be
computed for 2012.
(d) Substantial amounts of important information about a company are not
in its financial statements. Events involving such things as industry
changes, management changes, competitors’ actions, technological
BYP 14-2 COMPARATIVE ANALYSIS PROBLEM
(a)
PepsiCo
Coca-Cola Company
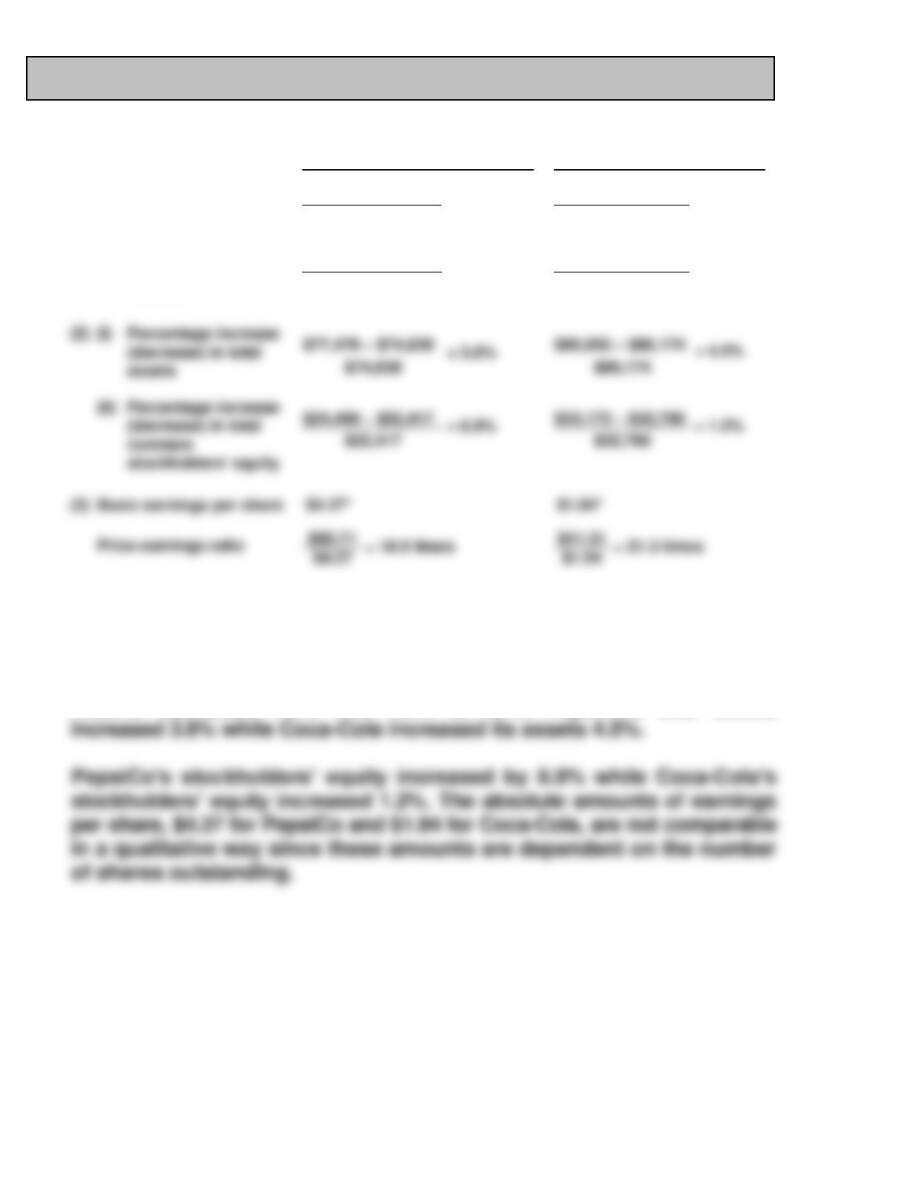
(1)
(i)
Percentage increase
in net sales
$66,415 − $65,492
= 1.4%
$46,854 − $48,017
= (2.4)%
$65,492
$48,017
(ii)
Percentage increase
(decrease) in net
income
$6,740 − $6,178
= 9.1%
$8,584 − $9,019
= (4.8)%
$6,178
$9,019
*Given on income statement
(b) PepsiCo’s net sales increased 1.4% while Coca–Cola’s decreased over
2.4%. PepsiCo’s net income increased 9.1% while Coca-Cola’s net
income decreased 4.8% from 2012 to 2013. PepsiCo’s total assets
assets
$77,478 − $74,638
$90,055 − $86,174
$33,173 − $32,790
BYP 14-3 COMPARATIVE ANALYSIS PROBLEM
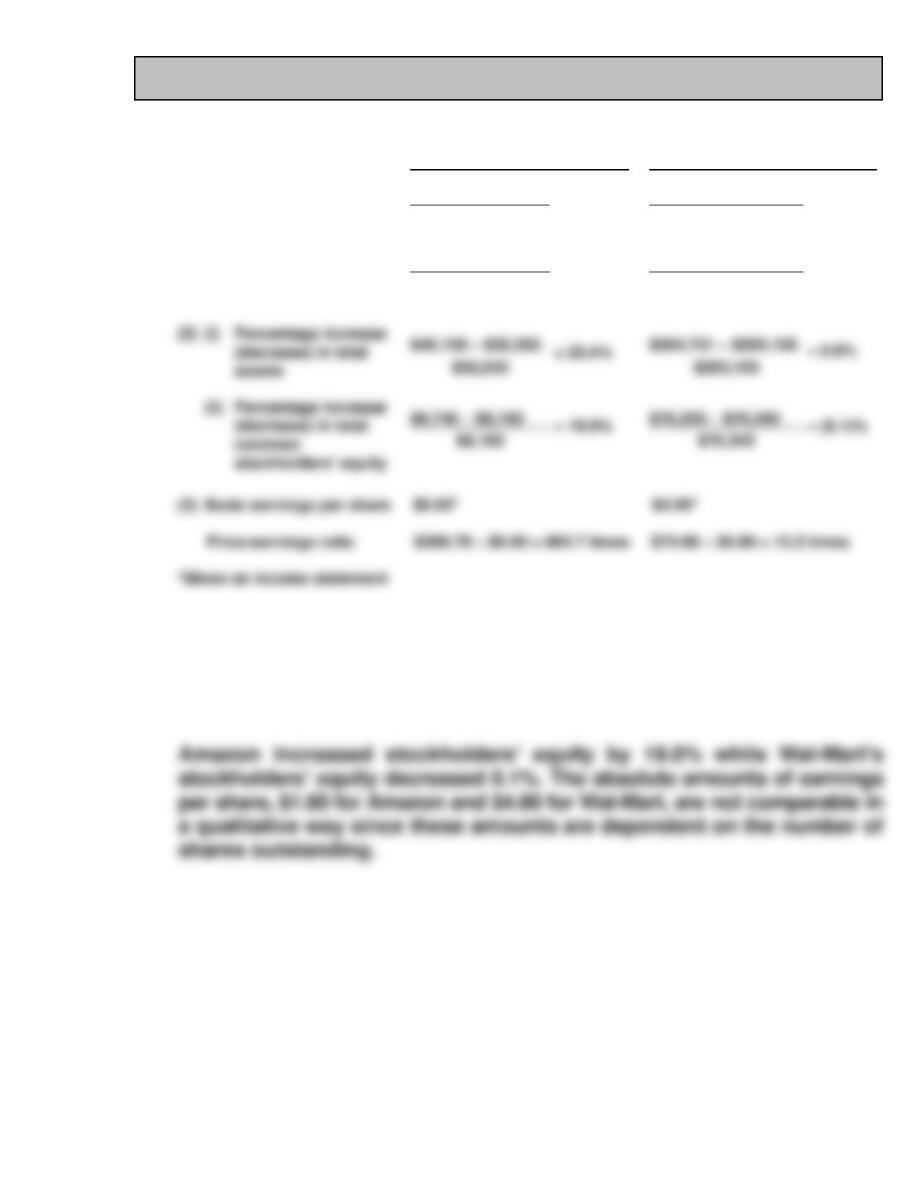
(a)
Amazon
Wal-Mart
(1)
(i)
Percentage increase
in net sales
$60,903 − $51,733
= 17.7%
$473,076 − $465,604
= 1.6%
$51,733
$465,604
(ii)
Percentage increase
(decrease) in net
income
$274 − (39)
= 802.6%
$16,022 − $16,999
= (5.7)%
(39)
$16,999
(b) Amazon’s net sales increased 17.7% while Wal-Mart’s increased 1.6%.
Amazon’s net income increased 802.6% while Wal-Mart’s net income
decreased 5.7% from 2012 to 2013. Amazon’s total assets increased 23.4%
while Wal-Mart increased its assets 0.8%.
assets
$40,159 − $32,555
$204,751 − $203,105
$76,255 − $76,343
BYP 14-4 DECISION MAKING ACROSS THE ORGANIZATION
The current ratio increase is a favorable indication as to liquidity, but
alone tells little about the going-concern prospects of the client. From
this ratio change alone, it is impossible to know the amount and direction
of the changes in individual accounts, total current assets, and total
current liabilities. Also unknown are the reasons for the changes.
The acid-test ratio decrease is an unfavorable indication as to liquidity,
The increase in net income is a favorable indicator for both solvency
and going-concern prospects, although much depends on the quality of
receivables generated from sales and how quickly they can be converted
into cash. If there has been a decline in sales, a significant factor is that
BYP 14–4 (Continued)
The collective implications of these data alone are that the client entity
is about as solvent and as viable a going concern at the end of the current
year as it was at the beginning although there may be a need for short-term
operating cash.
BYP 14-5 REAL-WORLD FOCUS
(a) Optional elements include:
Financial highlights
Letter to stockholders
Corporate message
Report of management
Board of directors and management
Stockholder information
(b) SEC-required elements include:
Auditors’ report
Management discussion
Financial statements and notes
Selected financial data
(c) Management discussion. This series of short, detailed reports discusses and
(e) Selected financial data. This information summarizes a company’s financial
condition and performance over five years or longer. Data for making
comparisons over time may include revenue (sales), gross profit, net
BYP 14-6 COMMUNICATION ACTIVITY
To: Abby Landis
From: Accounting Major
Subject: Financial Statement Analysis
The bases for comparison in analyzing financial statement are:
a. Intracompany—This basis compares an item or financial relationship
within a company in the current year with the same item or relation–
ship in one or more prior years.
BYP 14-7 ETHICS CASE
(a) The stakeholders in this case are:
Dave Schonhardt, president of Schonhardt Industries.
Steven Verlin, public relations director.
You, as controller of Schonhardt Industries.
(b) The president’s press release is deceptive and incomplete and to that
extent his actions are unethical.
(c) As controller you should at least inform Steven, the public relations
director, about the biased content of the release. He should be aware

BYP 14-8 ALL ABOUT YOU
Student responses will vary. We suggest that in class you ask for a few stu–
dents to share their responses in order to increase students understanding
of the various reasons why different people will choose different investment
vehicles.