462
P14–3
1.
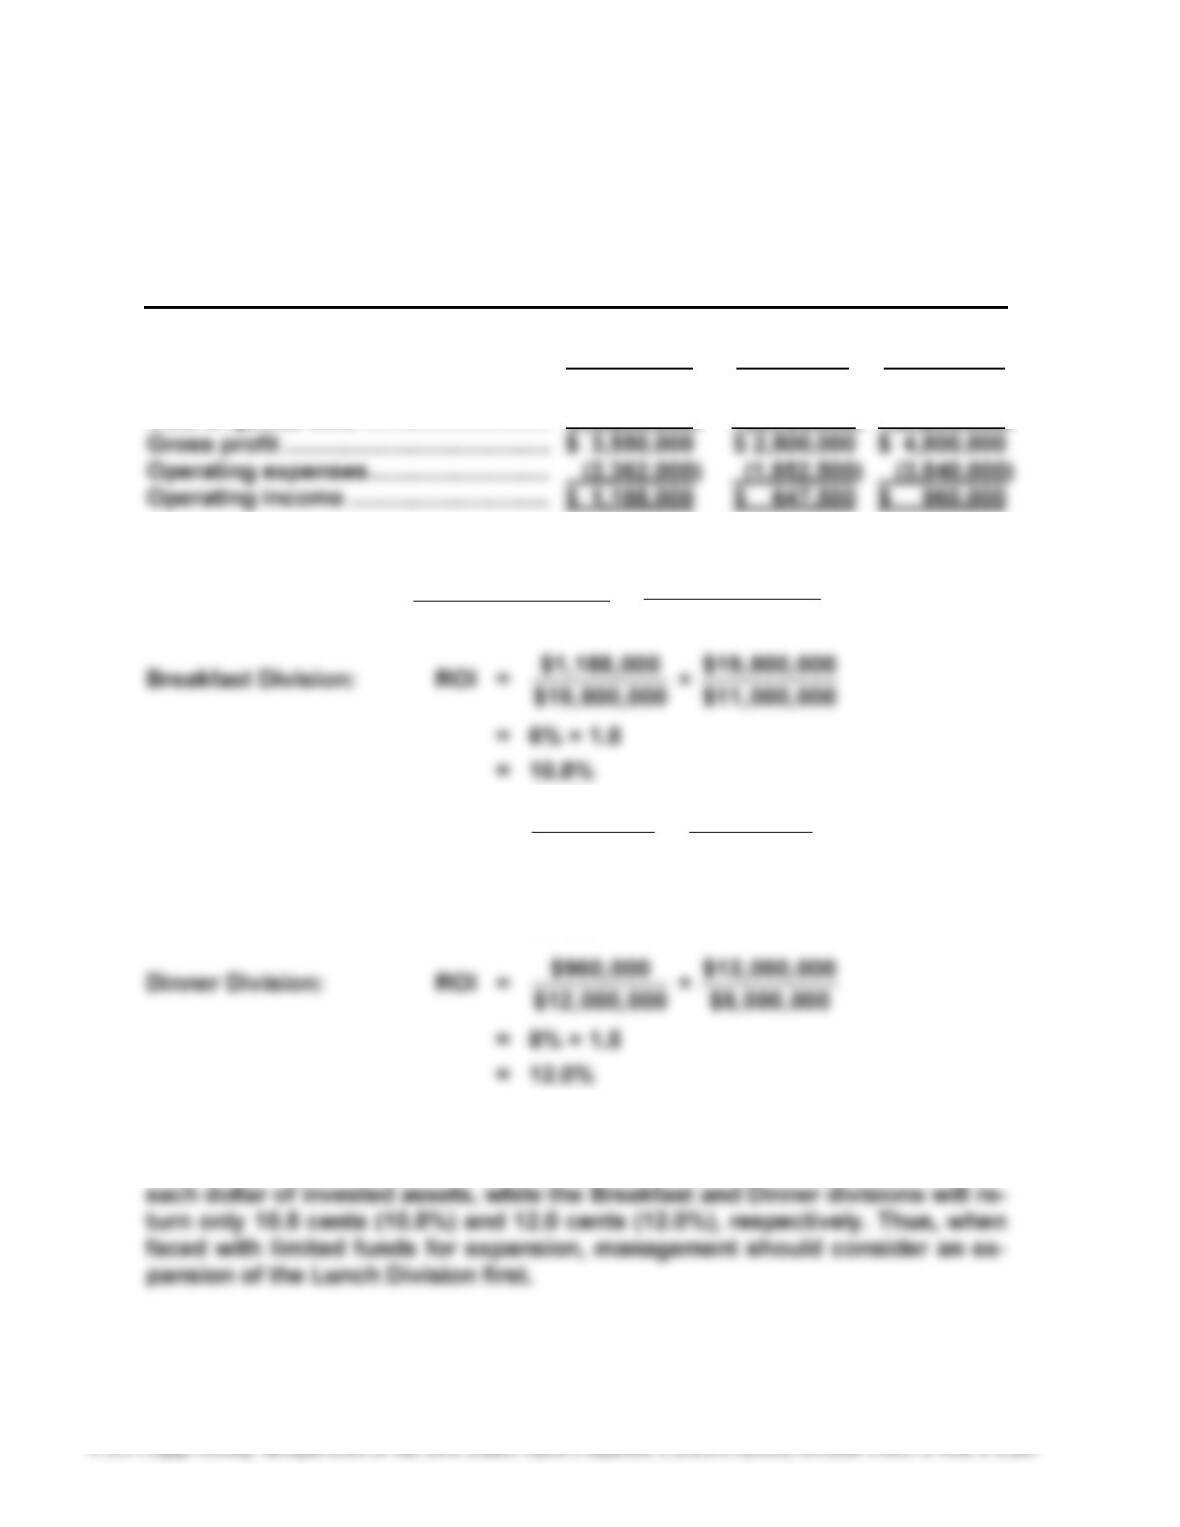
HORIZON FOODS INC.
Divisional Income Statements
For the Year Ended June 30, 20Y7
Breakfast Lunch Dinner
Division Division Division
Sales ……………………………………………. $19,800,000 $ 9,250,000 $12,000,000
2. Return on Investment = Profit Margin × Investment Turnover
Return on Investment = Operating Income
Sales × AssetsInvested
Sales
Lunch Division: ROI =
$647,500
$9,250,000 × $9,250,000
$4,625,000
= 7% × 2.0
= 14.0%
3. Per dollar of invested assets, the Lunch Division is the most profitable of the
three divisions. Assuming that the returns on investment do not change in the
future, an expansion of the Lunch Division will return 14.0 cents (14.0%) on
463
P14–4
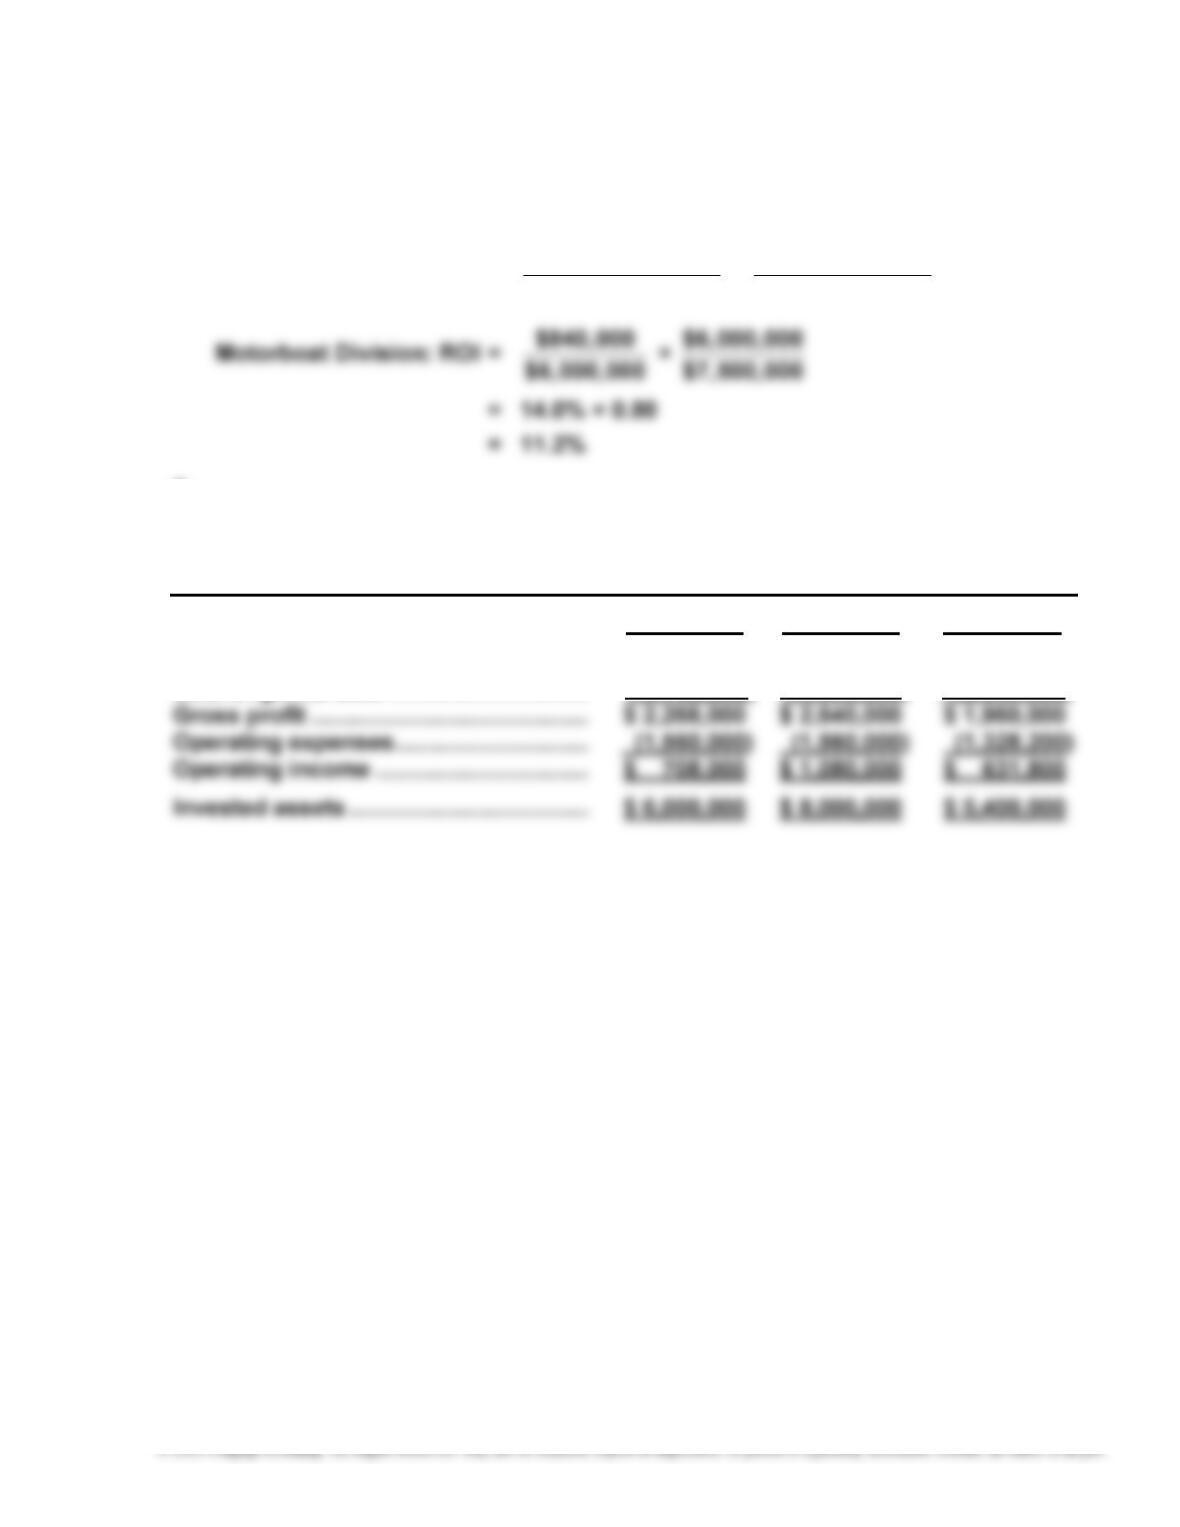
1. Return on Investment = Profit Margin × Investment Turnover
Return on Investment = Operating Income
Sales × AssetsInvested
Sales
2.
RIDE OF YOUR LIFE INC.— MOTORBOAT DIVISION
Estimated Income Statements
For the Year Ended December 31, 20Y2
Proposal 1 Proposal 2 Proposal 3
Sales ……………………………………………… $ 6,000,000 $ 6,000,000 $ 4,860,000
Cost of goods sold …………………………. (3,732,000) (3,360,000) (2,900,000)
464
P14–4, Concluded
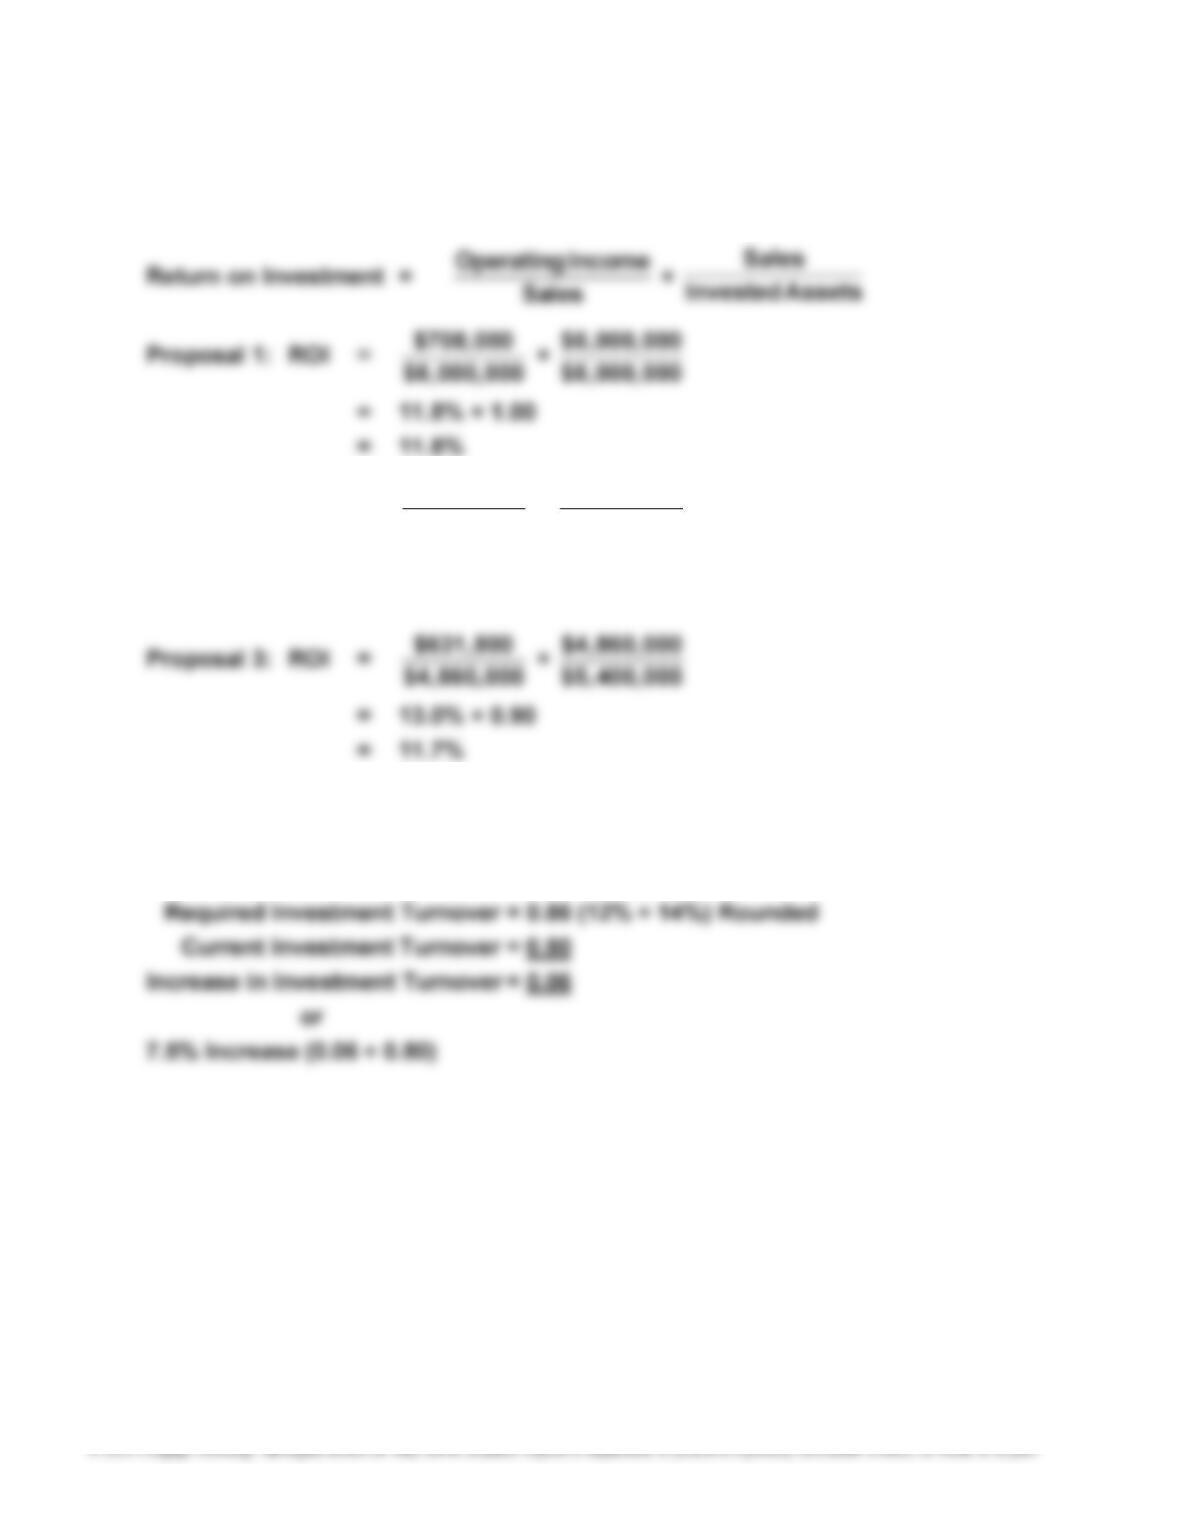
3. Return on Investment = Profit Margin × Investment Turnover
Proposal 2: ROI =
$1,080,000
$6,000,000 × $6,000,000
$8,000,000
= 18.0% × 0.75
= 13.5%
4. Proposal 2 would yield a return on investment of 13.5%.
5. Return on Investment = Profit Margin × Required Investment Turnover
12% = 14% × Required Investment Turnover
465
P14–5
1.
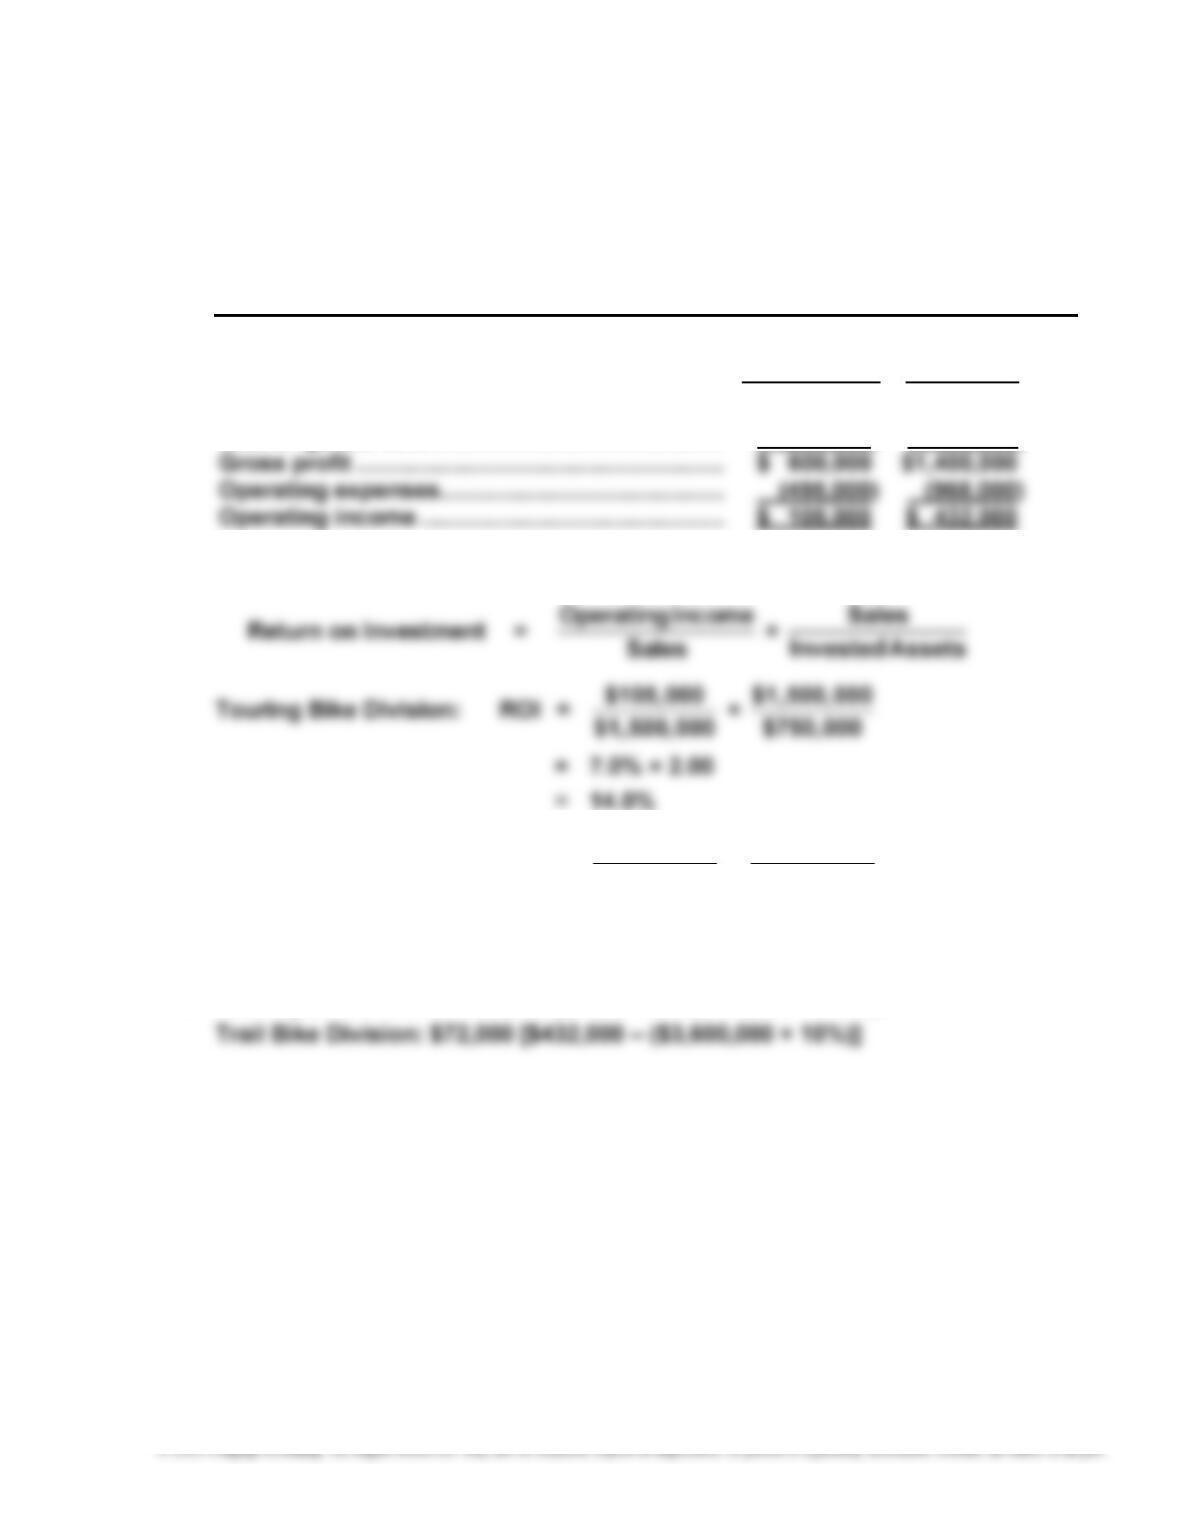
MOAB BIKE COMPANY
Divisional Income Statements
For the Year Ended October 31, 20Y9
Touring Bike Trail Bike
Division Division
Sales ………………………………………………………….. $1,500,000 $5,400,000
Cost of goods sold ……………………………………… (900,000) (4,000,000)
2. Return on Investment = Profit Margin × Investment Turnover
Trail Bike Division: ROI =
$432,000
$5,400,000 × $5,400,000
$3,600,000
= 8.0% × 1.50
= 12.0%
3. Touring Bike Division: $30,000 [$105,000 – ($750,000 × 10%)]
466
P14–5, Concluded
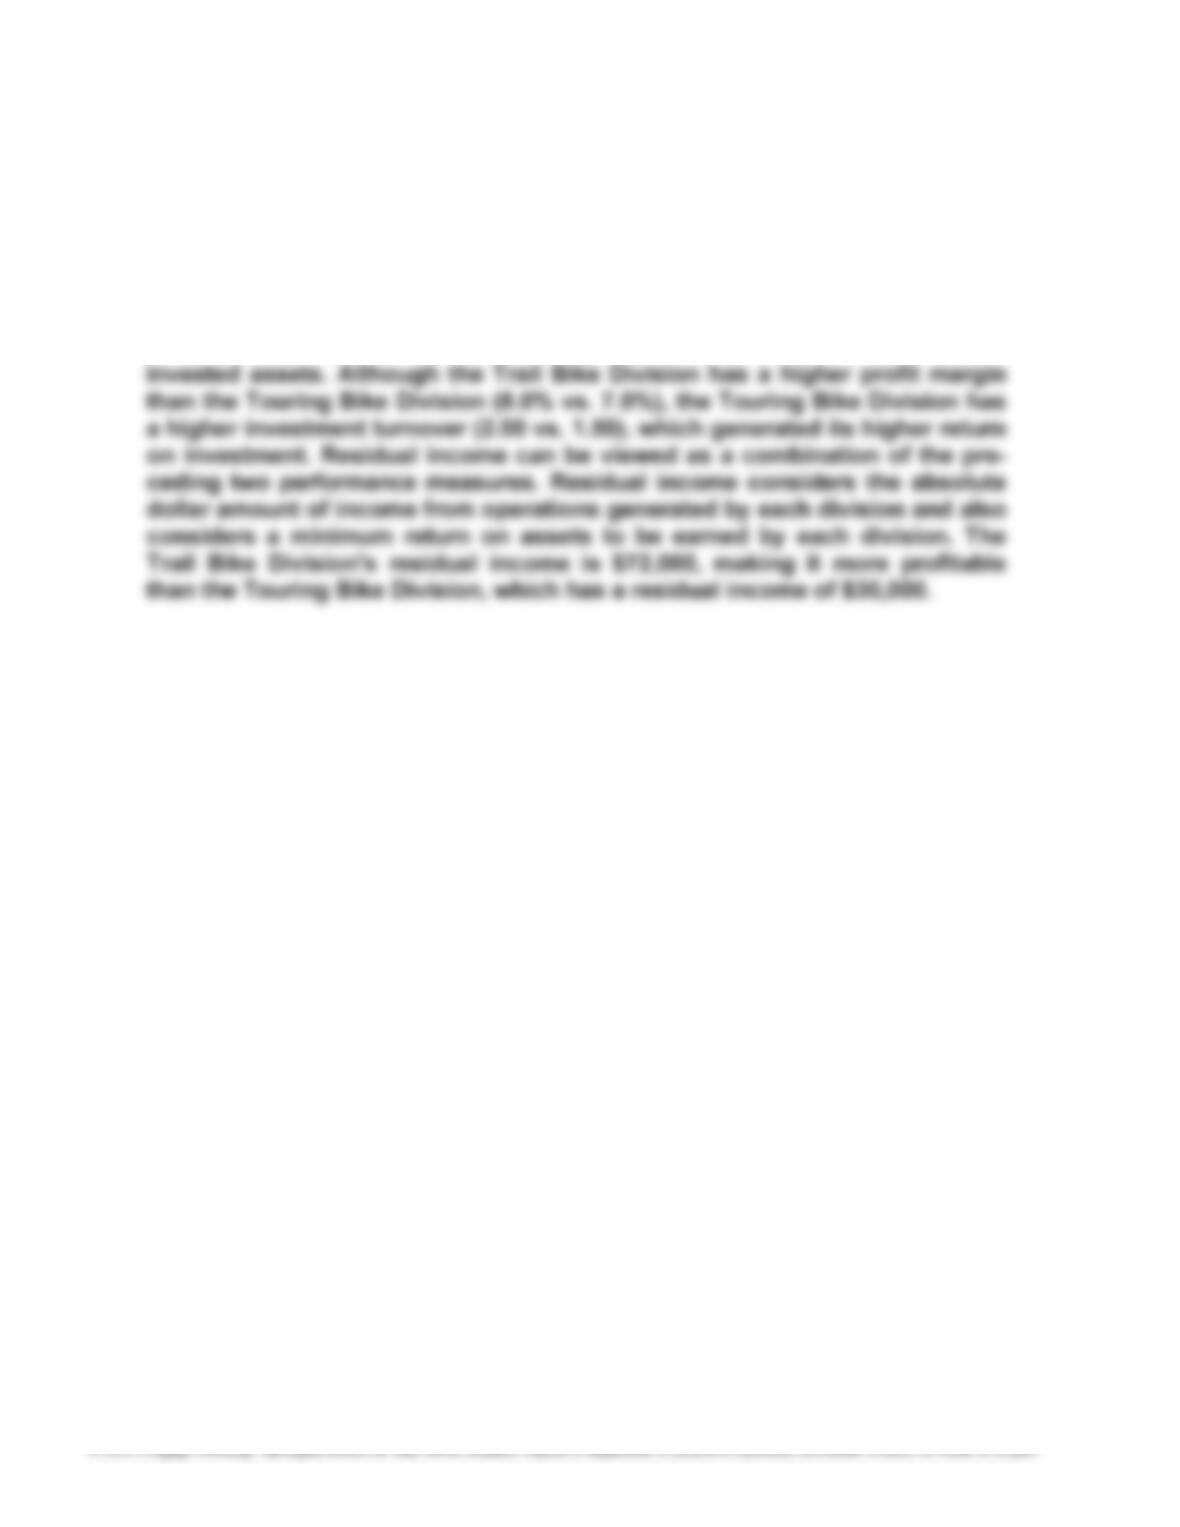
4. On the basis of operating income, the Trail Bike Division generated $327,000
($432,000 – $105,000) more operating income than did the Touring Bike Divi-
sion. However, operating income does not consider the amount of invested
assets in each division. On the basis of the return on investment, the Touring
Bike Division earned 14.0 cents (14.0%) on each dollar of invested assets,
while the Trail Bike Division earned only 12.0 cents (12.0%) on each dollar of
467
P14–6
1. No. When unused capacity exists in the supplying division (the Commercial
Division), the use of the market price approach may not lead to the maximiza-
tion of total company income.
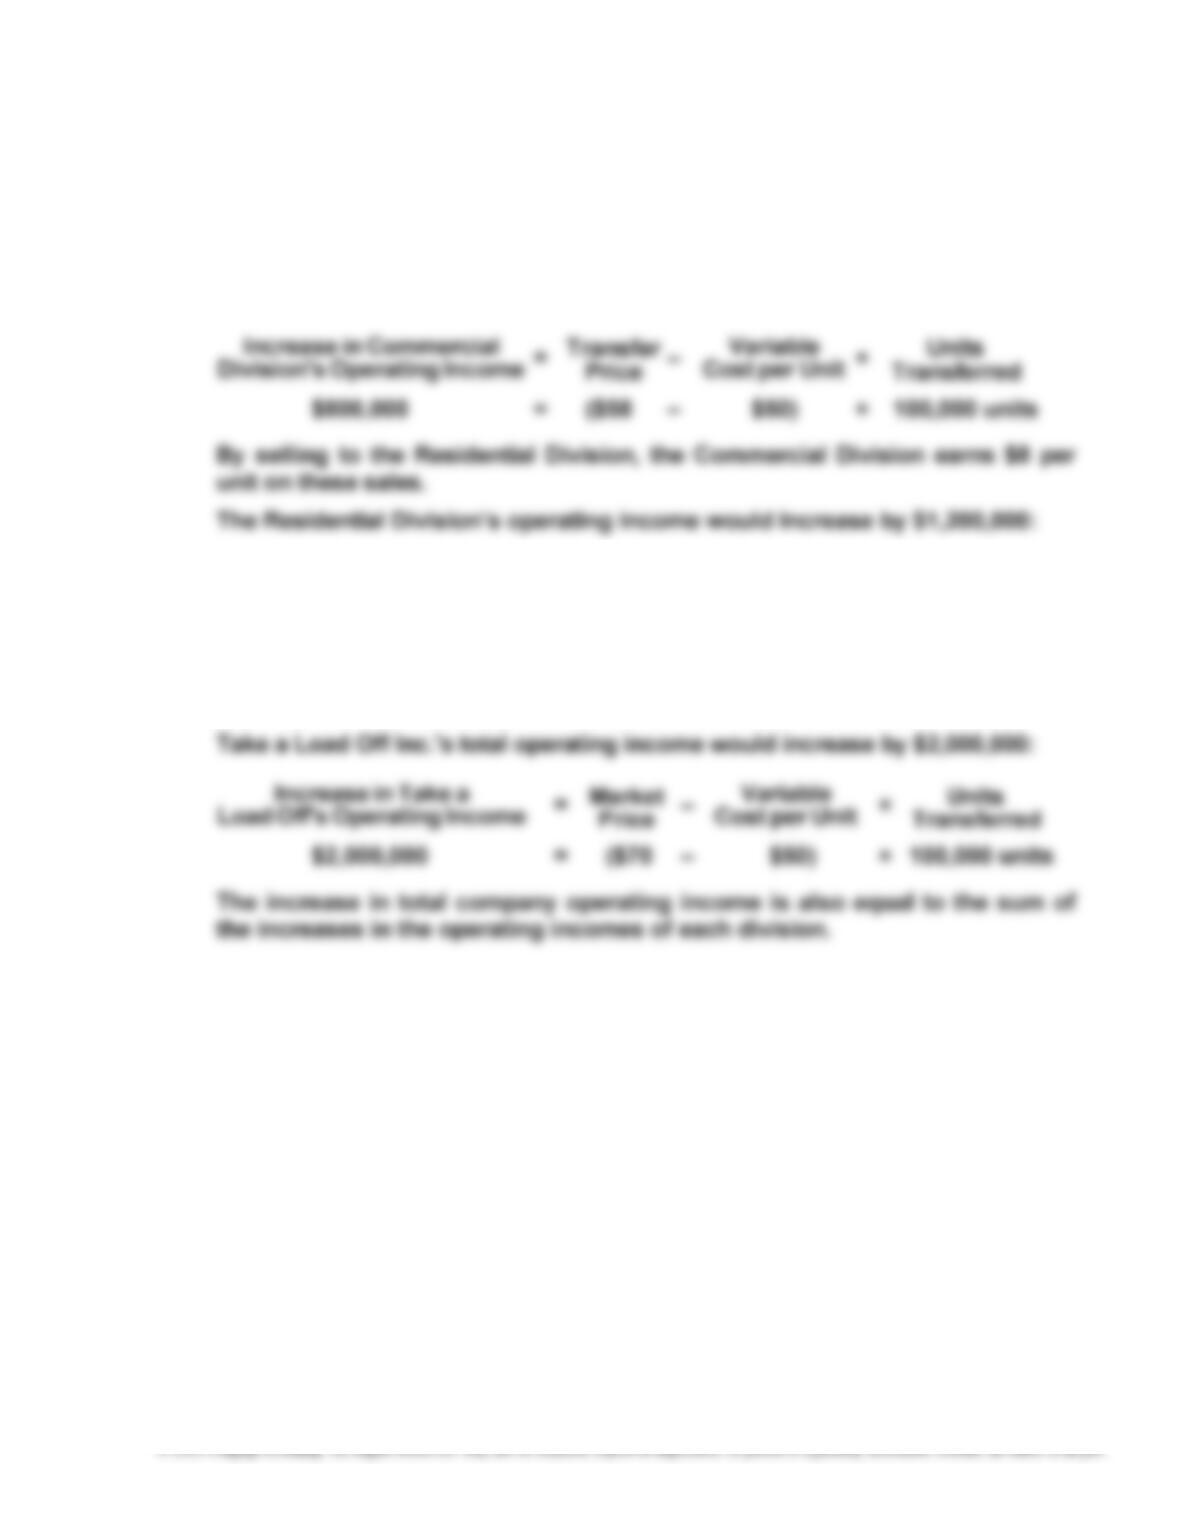
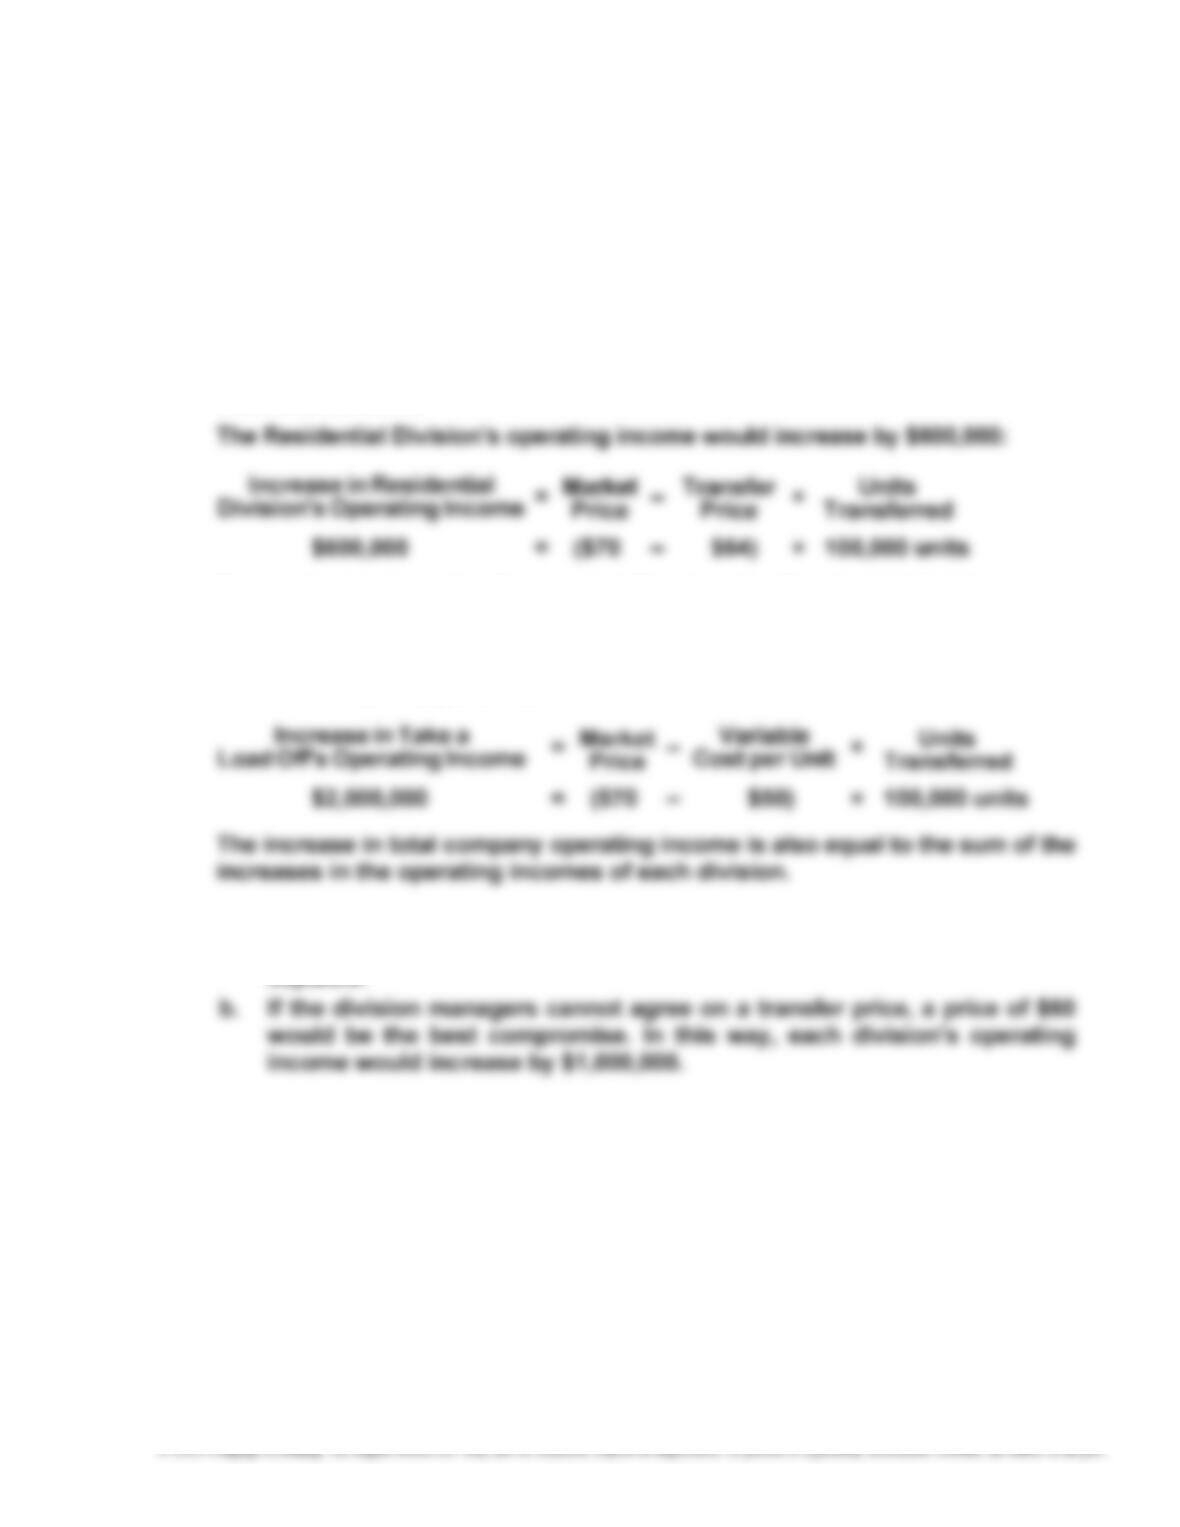
2. The Commercial Division’s operating income would increase by $800,000:
Increase in Residential
Division’s Operating Income = Market
Price – Transfer
Price × Units
Transferred
$1,200,000 = ($70 – $58) × 100,000 units
By purchasing from the Commercial Division, the Residential Division saves
$12 per unit on its purchases.
468
P14–6, Continued
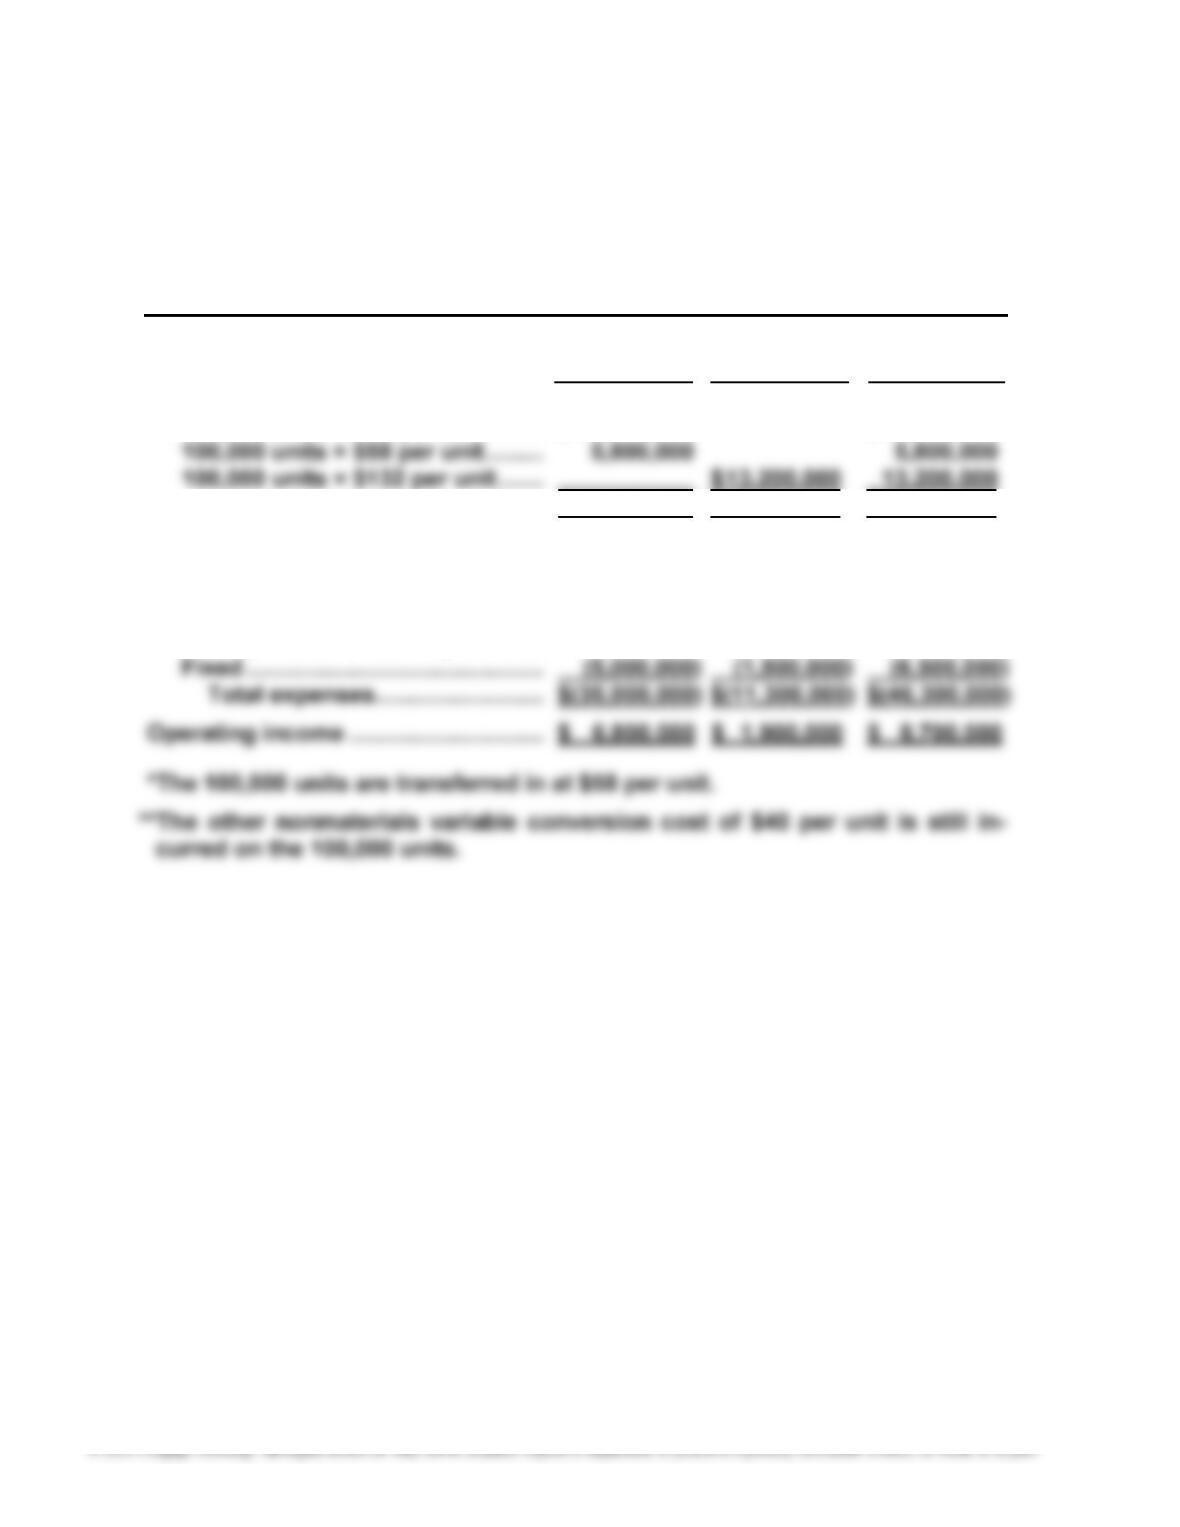
3.
TAKE A LOAD OFF INC.
Divisional Income Statements
For the Year Ended October 31, 20Y5
Commercial Residential
Division Division Total
Sales:
500,000 units × $72 per unit ……… $ 36,000,000 $ 36,000,000
$ 41,800,000 $ 13,200,000 $ 55,000,000
Expenses:
Variable:
600,000 units × $50 per unit ….. $(30,000,000) $(30,000,000)
100,000 units × $58* per unit … $ (5,800,000) (5,800,000)
100,000 units × $40** per unit .. (4,000,000) (4,000,000)
469
P14–6, Concluded
4. The Commercial Division’s operating income would increase by $1,400,000:
Increase in Commercial
Division’s Operating Income = Transfer
Price –
V
ariable
Cost per Unit × Units
Transferred
$1,400,000 = ($64 – $50) × 100,000 units
By selling to the Residential Division, the Commercial Division earns $14 per
unit on these sales.
By purchasing from the Commercial Division, the Residential Division saves
$6 per unit on its purchases.
Take a Load Off Inc.’s total operating income would increase by the same
amount as in part (2), $2,000,000:
V
5. a. Any transfer price greater than the Commercial Division’s variable ex-
penses per unit of $50 but less than the market price of $70 would be ac-
470
METRIC-BASED ANALYSIS
MBA 14–1
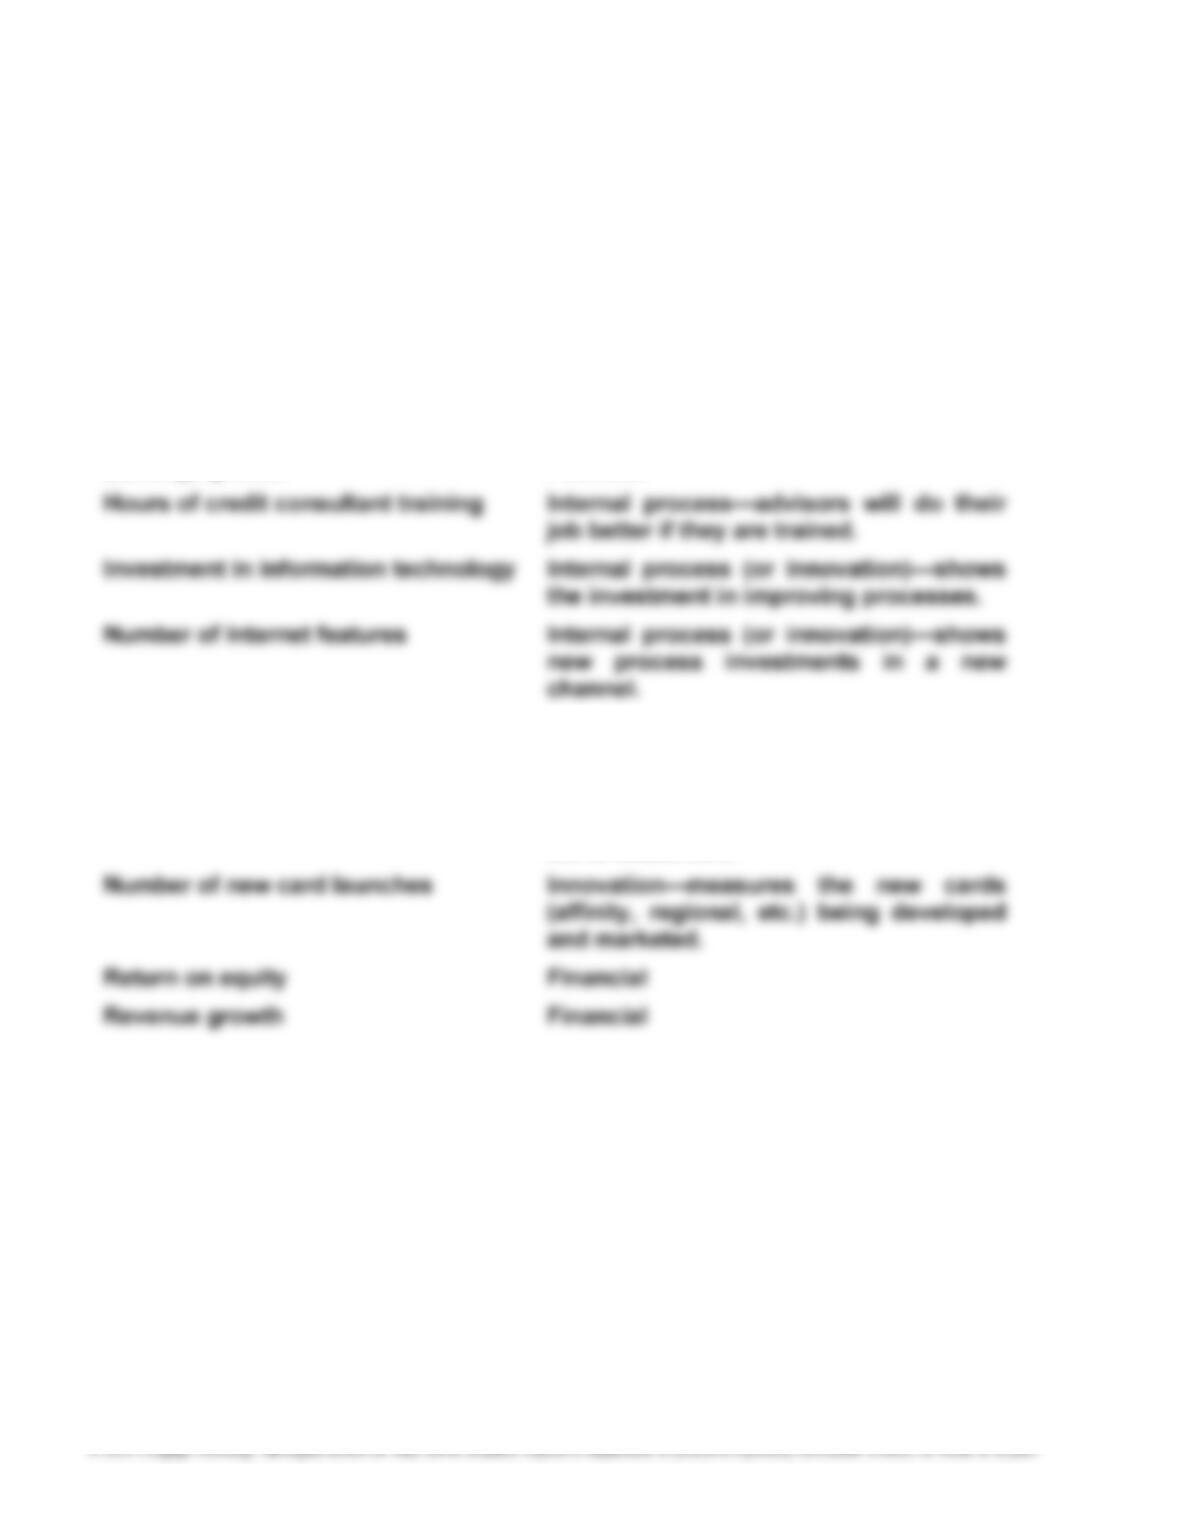
Although there is some judgment in classifying each of these measures, the fol-
lowing represents our assessment with explanations:
Average cardmember spending Customer—demonstrates the usefulness
of the card to the customer.
Cards in force Customer—if customers did not value the
card, they would not have one.
Earnings growth Financial
Number of merchant signings Customer—the larger the number of
merchants that honor the card, the more
valuable it is to cardholders.
Number of card choices Customer—more choices are more valua-
ble to customers.

471
MBA 14–2
a. UPS wanted a performance measurement system that would focus more on
the underlying drivers, or levers, of financial success. It believed that focusing
on the financial numbers by themselves would not reveal how financial objec-
tives were to be achieved, especially with new demands coming from cus-
b. The employee sentiment number is common in service businesses. The em-
ployees are the face of the company to the customer. If employees feel poorly
about the organization, or if they feel that they don’t make a difference, then
472
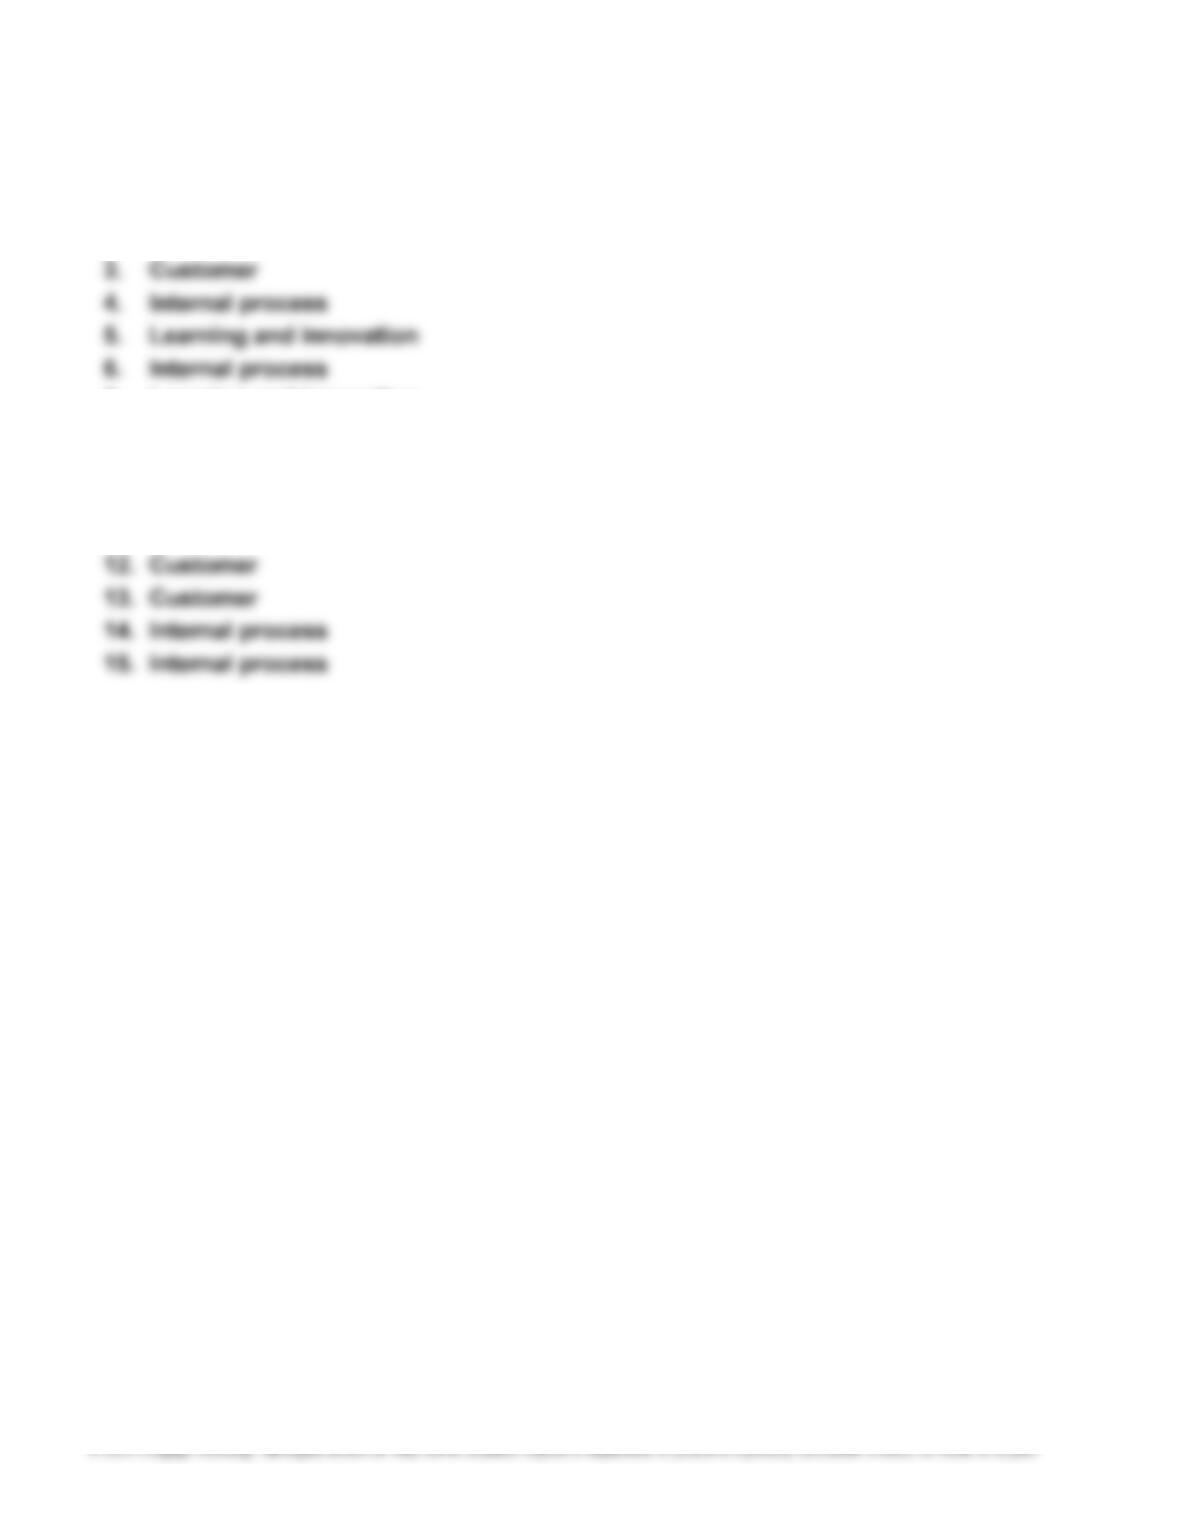
MBA 14–3
1. Customer
2. Internal process
7. Learning and innovation
8. Learning and innovation
9. Learning and innovation
10. Financial
11. Customer
Note to Instructor: There is judgment in classifying the metrics and initiatives.
The preceding classifications are our best assessment.
473
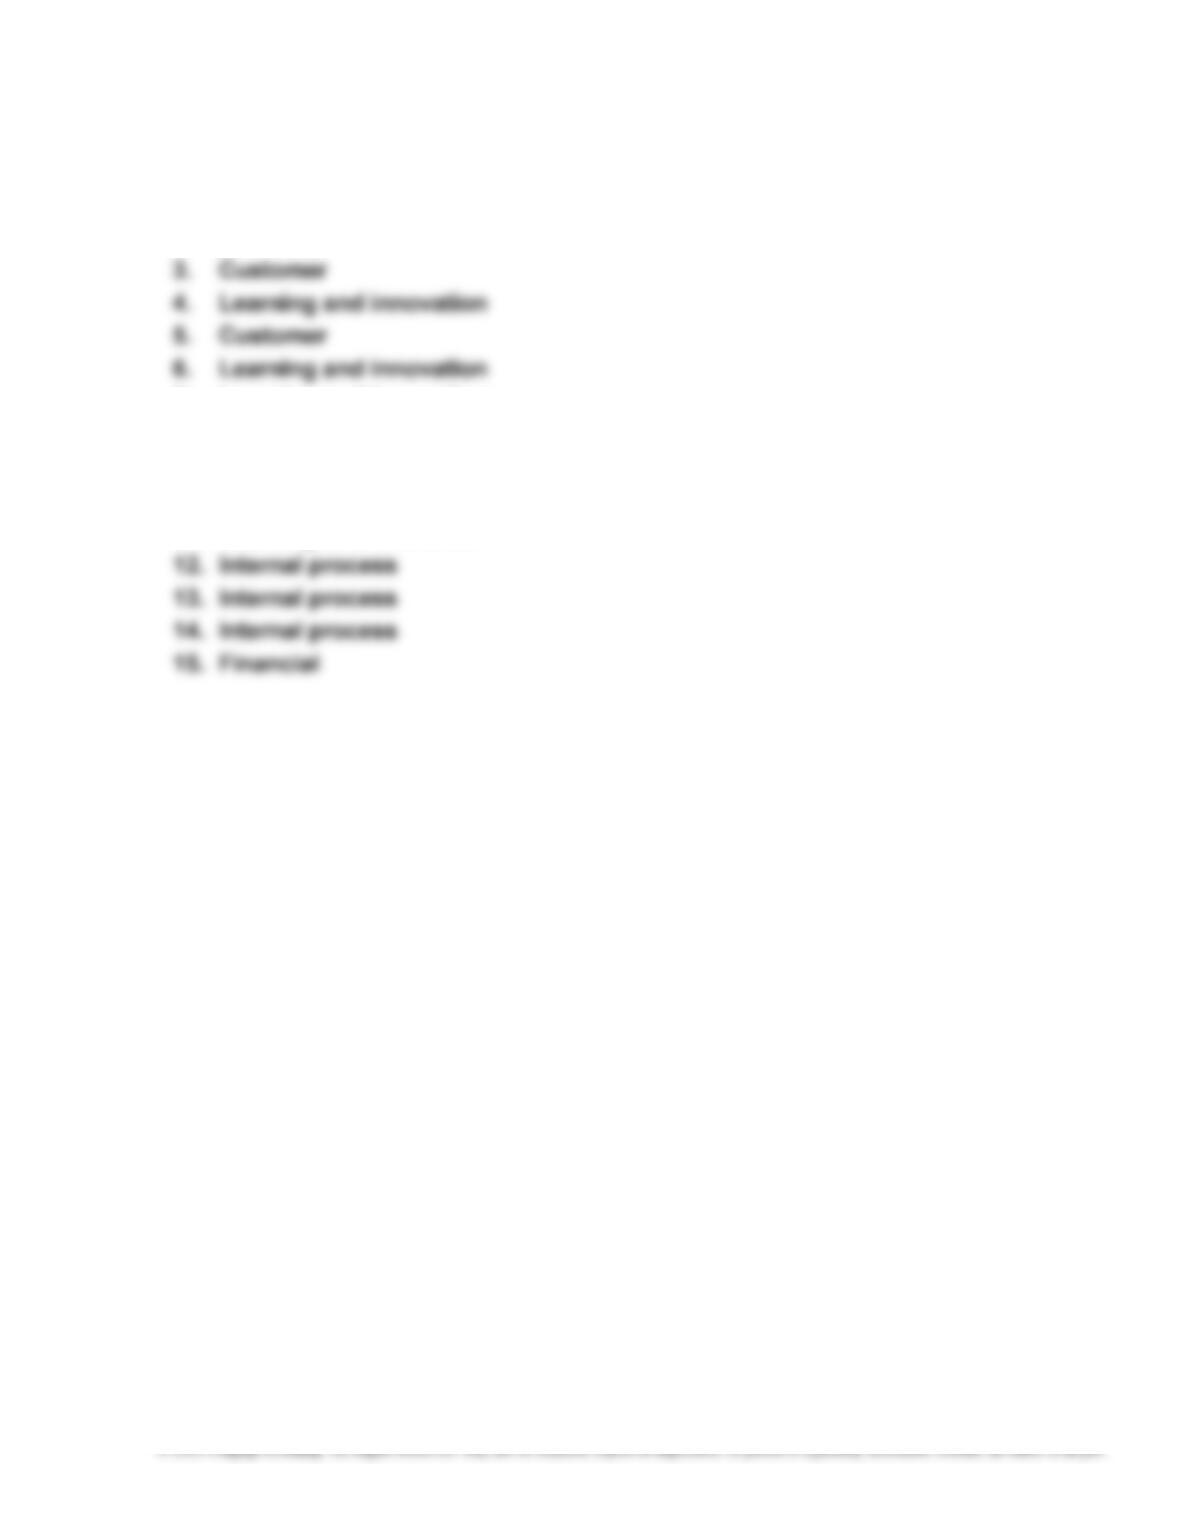
MBA 14–4
1. Financial
2. Internal process
7. Learning and innovation
8. Customer
9. Financial
10. Learning and innovation
11. Learning and innovation
Note to Instructor: There is judgment in classifying the metrics and initiatives.
The preceding classifications are our best assessment.
474
MBA 14–5
This activity is designed to introduce students to two very popular divisional per-
formance measurement approaches, the balanced scorecard and economic value
added (EVA). Both methods are getting very strong support in corporate America.
The two consulting firms’ home pages provided in this activity have links to brief
strongly oriented to maximizing wealth to the shareholder. Hopefully, the stu-
dents will recognize EVA as a specific application of the residual income concept.
EVA’s strength is in its simplicity and its apparent association with wealth maxi-
mization (share values). It is interesting to note that the two methods flow from
two different philosophies. The balanced scorecard takes a multiple stakeholder
475
CASES
Case 14–1
This scenario is a negotiation between two divisions. Newt is not behaving unethically
by attempting to get a good price from the Optic Lens Division. Also, he is not behav-
ing unethically because he refuses market price. This may not seem “fair,” but price
negotiation is a typical business activity and is part of Newt’s job. It would be unethi-
cal only if the Camera Division refused to deal with the Optic Lens Division to pur-
posefully hurt the Optic Lens Division’s performance, so Camera could look good in
The Camera Division has overall profit responsibility and authority. This means the
Camera Division has the choice of purchasing from the inside or the outside. The
Camera Division should have incentives to purchase from the inside to maximize
overall corporate income. This means the transfer price should be set below market
Case 14–2
The department head is responsible for the quantity of service but not the source of
the service (i.e., not the price). Most accountants would hold the department head re-
sponsible for the cost by transferring the cost of the brochures to the Customer Ser-
vice Department even though the price is 15% higher than could be obtained from the
outside. This may not seem fair, but it does control the use of internal services to
some degree. If there were no internal transfer price, departments would view the Pub-
476
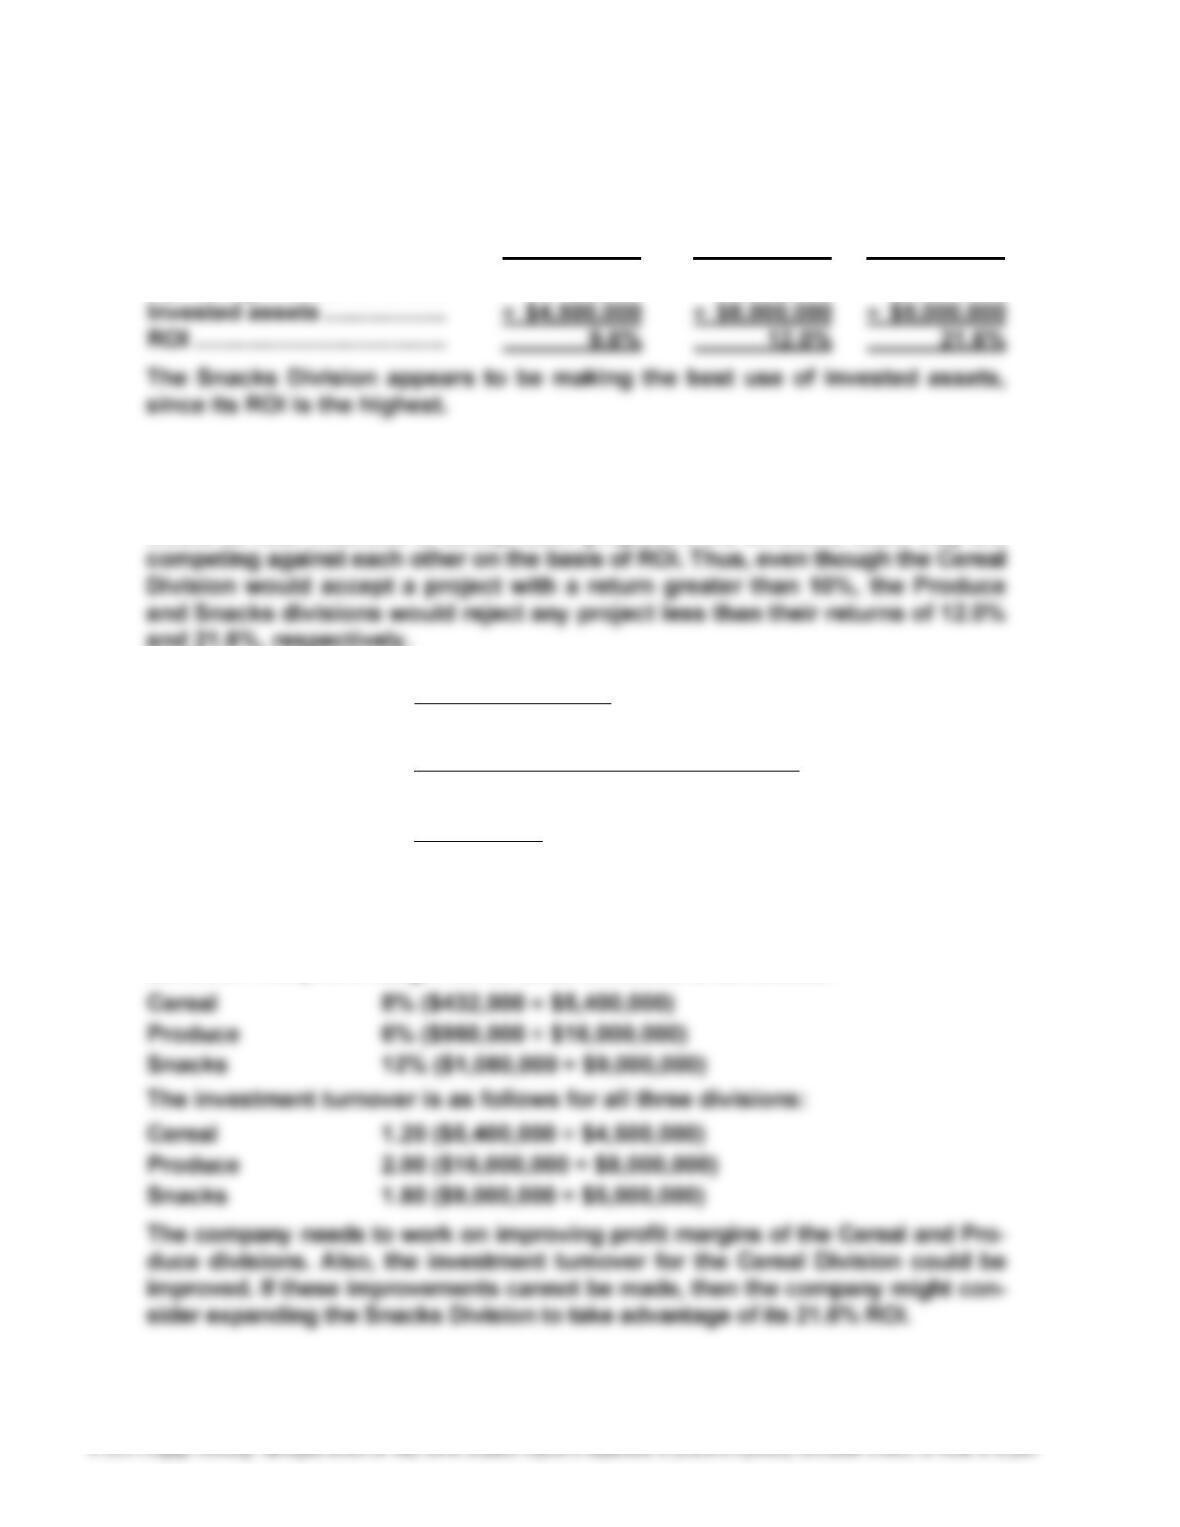
Case 14–3
1. The return on invested assets is computed as follows:
Cereal Produce Snacks
Operating income …………… $432,000 $960,000 $1,080,000
2. Not all projects that have greater than a 10% return would be accepted. This
is because any project accepted between the 10% minimum and their existing
ROI would cause their ROI to drop. This is true because of averaging. There
would be little incentive to accept such projects if the divisions know they are
and 21.6%, respectively.
3. Return on Investment = Operating Income
Invested Assets
= 000,000,5$ + 000,000,8$ + 000,500,4$
000,080,1$ + 000,960$ + 000,432$
= 000,500,17$
000,472,2$ = 14.1%
4. There are two approaches to improving Dixie Foods’ overall return on invest-
ment of 14.1%: (1) improving the profit margin or (2) improving the investment
turnover. The profit margin for all three divisions is as follows:
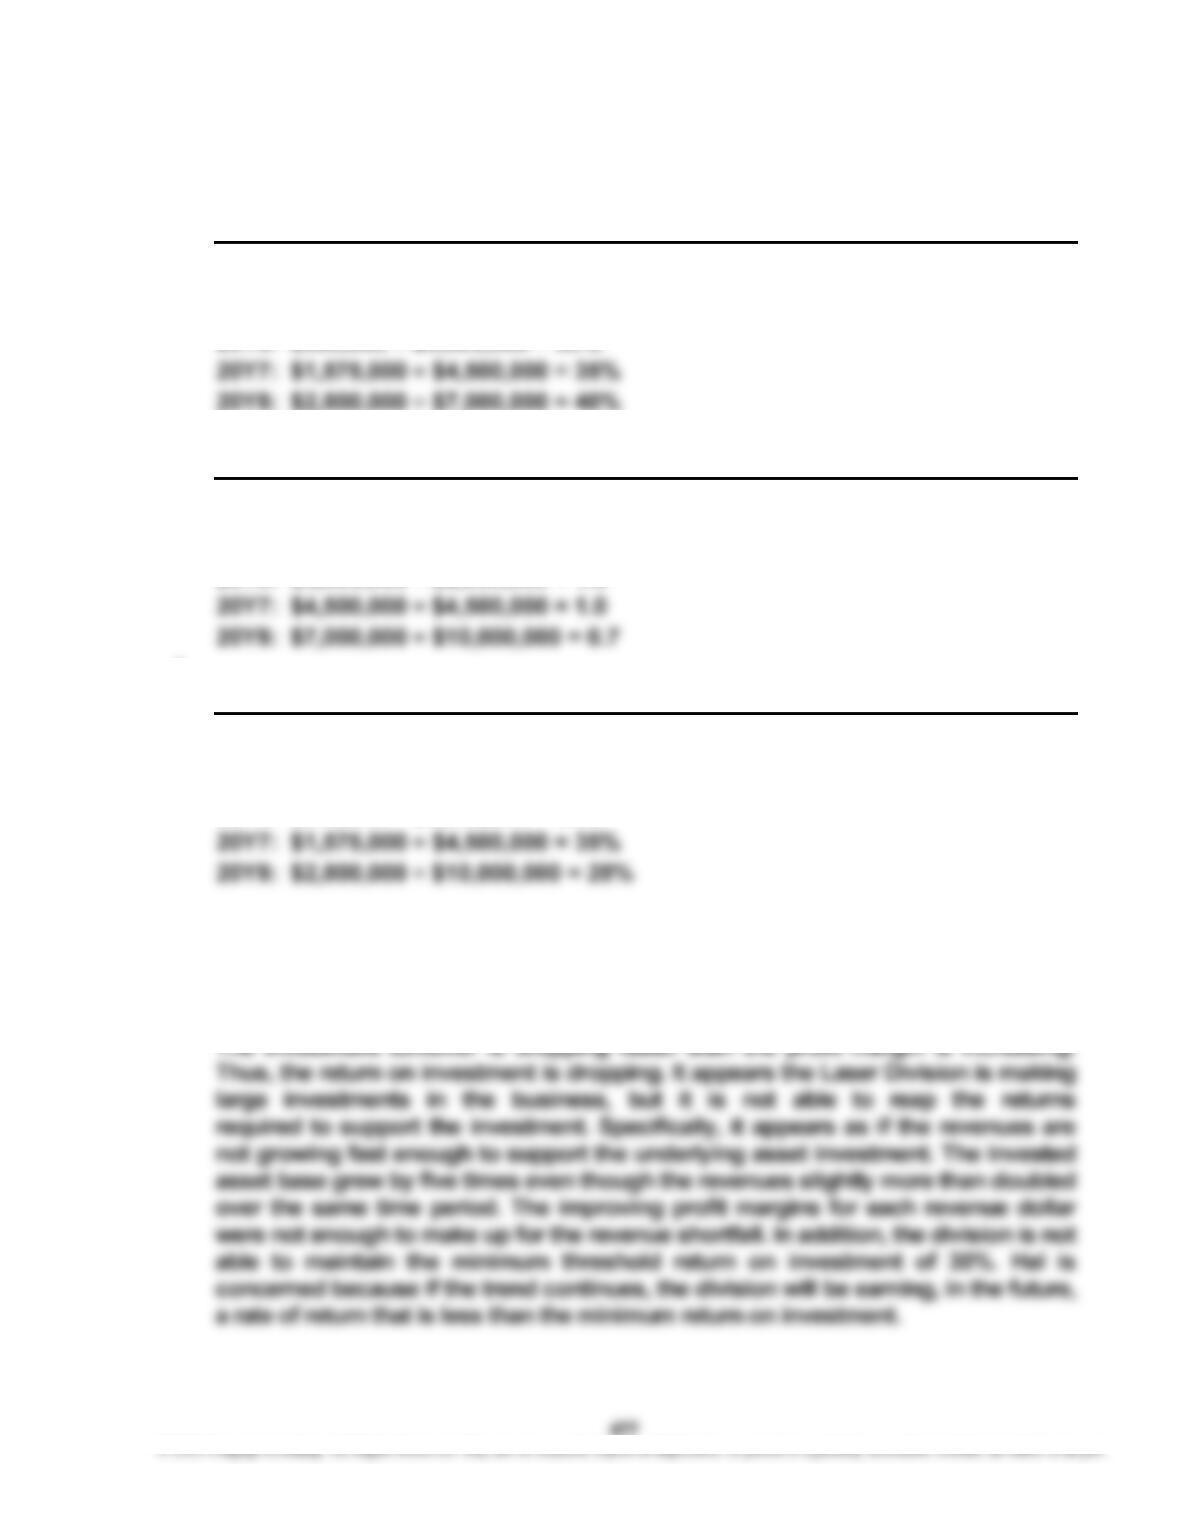
Case 14–4
1.
20Y6 20Y7 20Y8
Profit margin …………………………………….. 30% 35% 40%
Computations:
2.
20Y6 20Y7 20Y8
Investment turnover ………………………….. 1.5 1.0 0.7
Computations:
3.
20Y6 20Y7 20Y8
Return on investment ……………………….. 45% 35% 28%
Computations:
20Y6: $900,000 ÷ $2,000,000 = 45%
4. Hal is concerned about the Laser Division because the return on investment ap-
pears to be deteriorating over the 20Y6–20Y8 operating period. This is happening
even though the profit margin is increasing over this time period. For this to occur,
the investment turnover must be dropping, which is shown in part (2).
478
Case 14–5
1. Return on Investment = Operating Income
Invested Assets
2. $100,000 (10 × $10,000 = $100,000, where 10 = 24% – 14%)
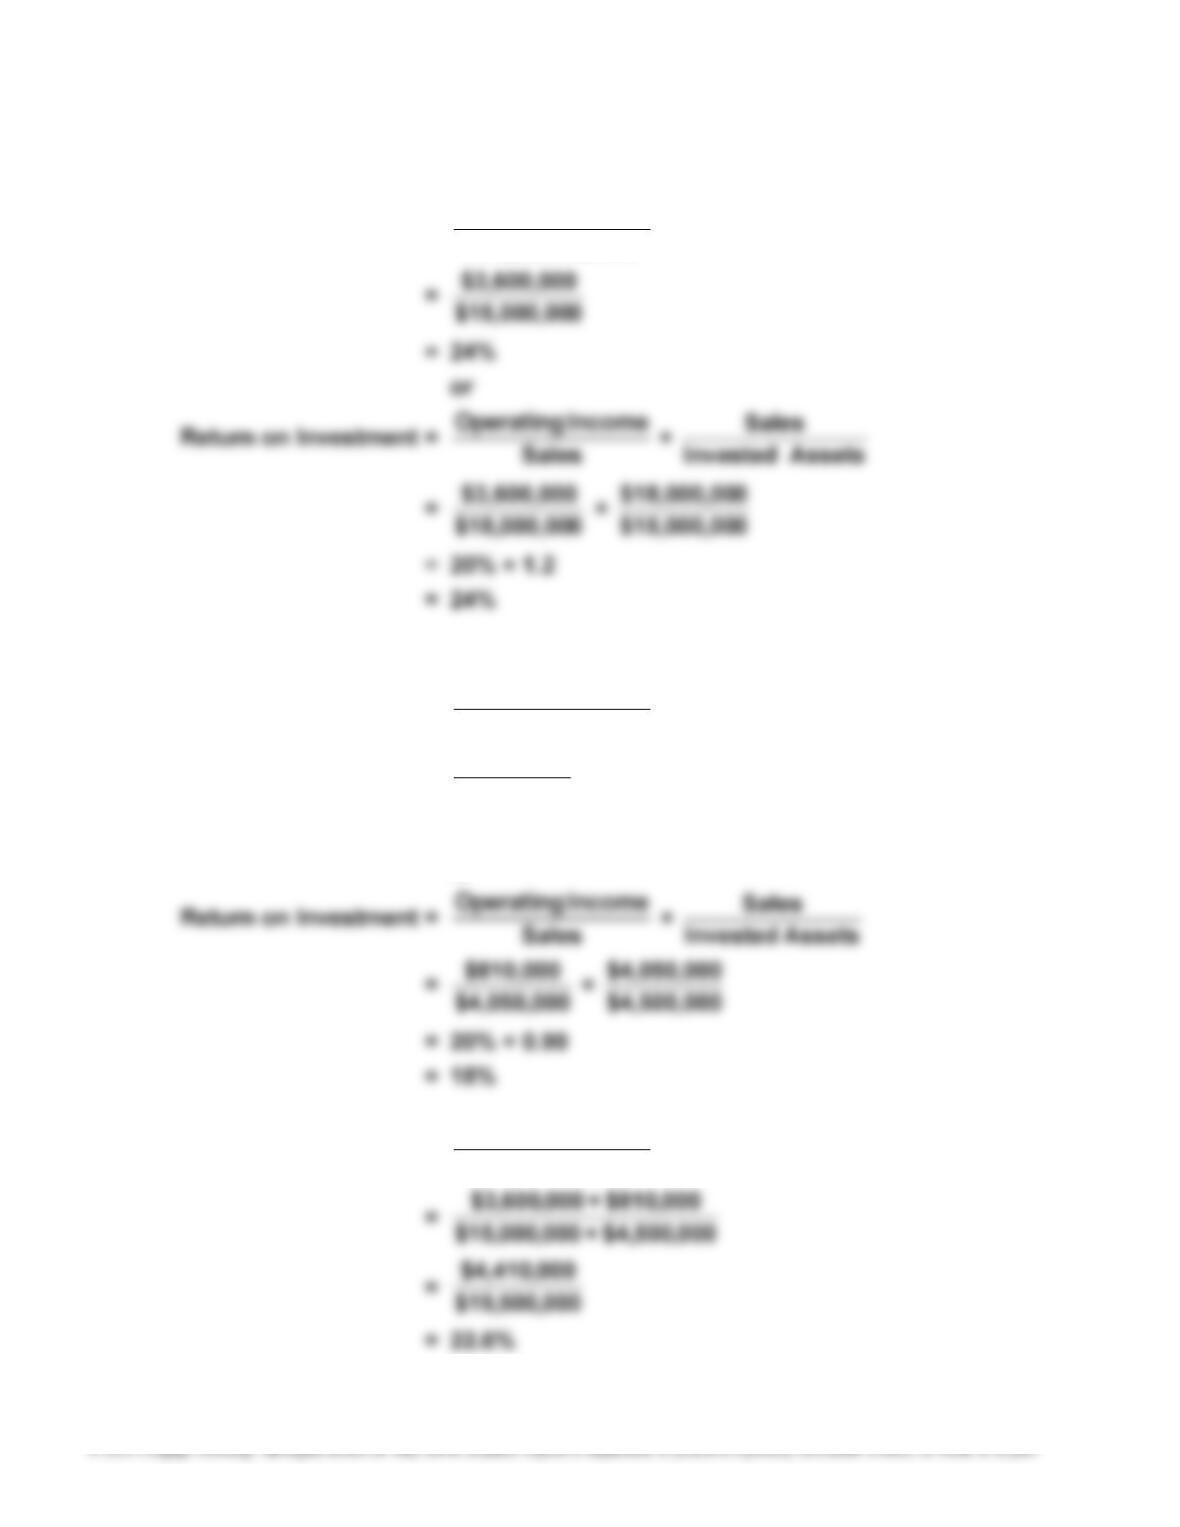
3. Return on Investment = Operating Income
Invested Assets
= $4,500,000
$810,000
= 18%
or
4. Return on Investment = Operating Income
Invested Assets
479
Case 14–5, Concluded
5. Even though the addition of the new product line would increase the overall
return on investment, its addition would decrease the Patio Division’s return
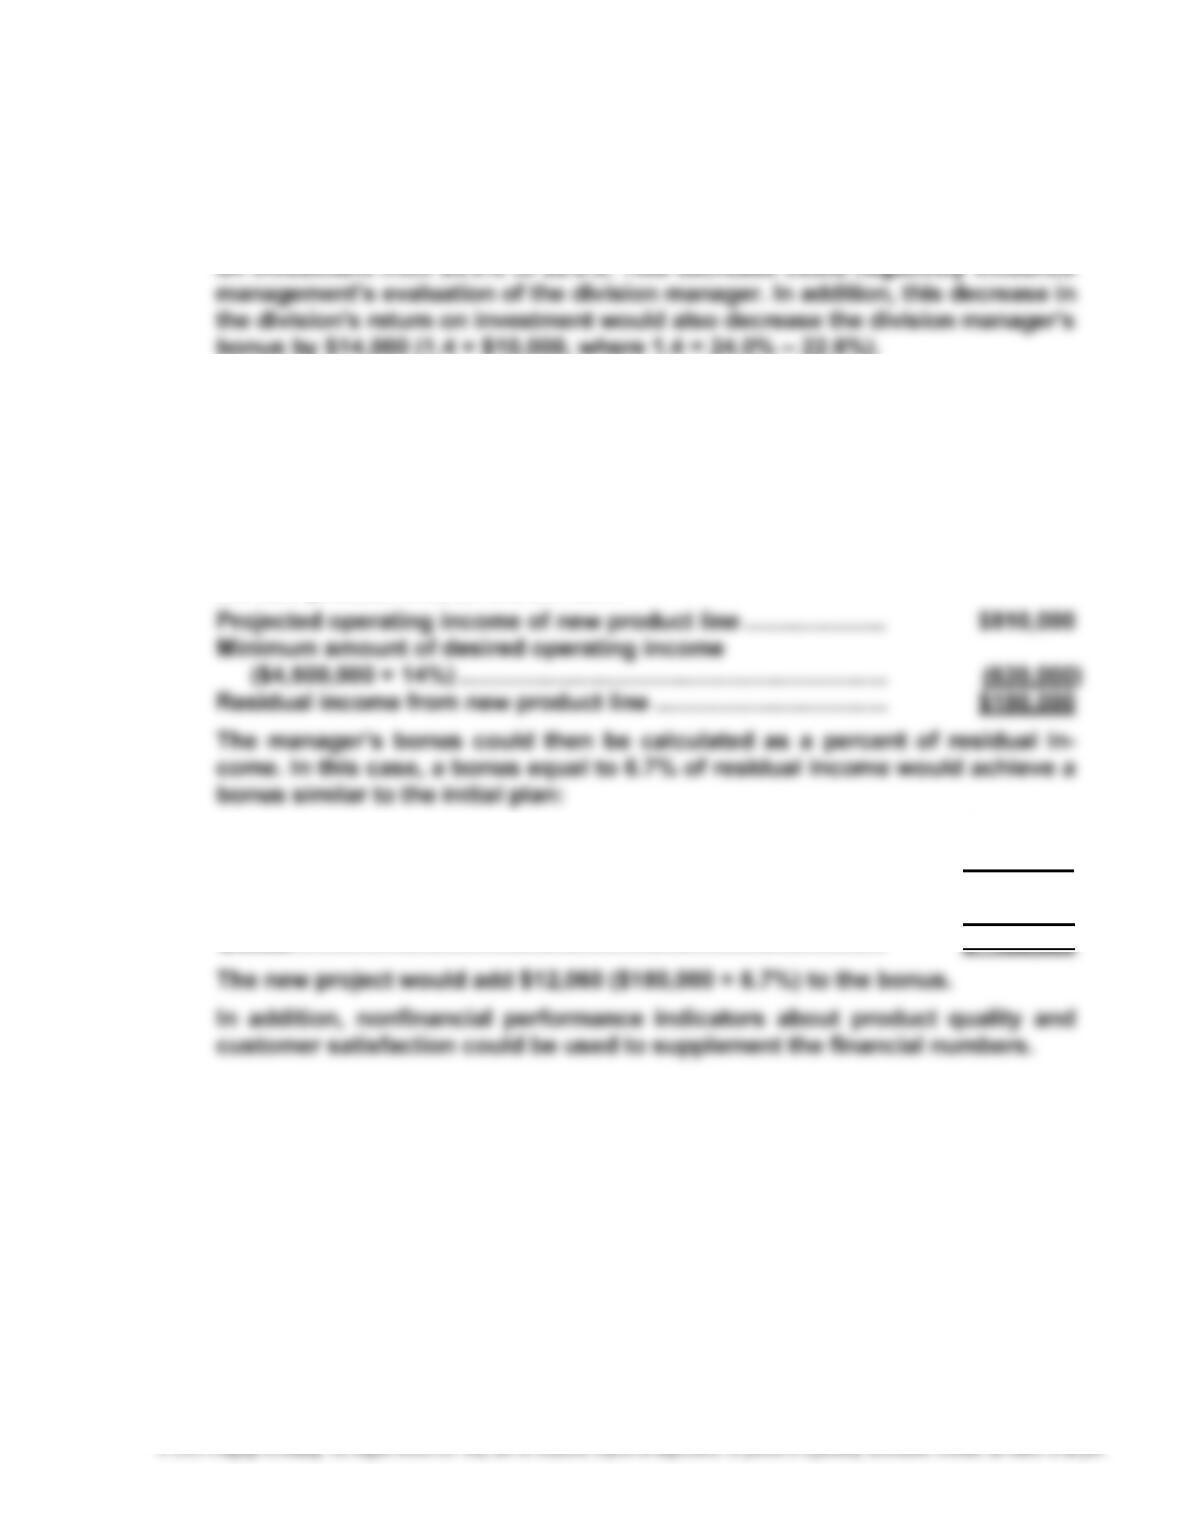
6. Use of residual income as a performance measure and as the basis for grant-
ing bonuses would motivate division managers to accept investment oppor-
tunities that exceed a minimum rate of return. If the minimum rate of return
was set at 14%, the overall company average rate of return, any investment
opportunity whose rate exceeded 14% would be viewed as acceptable. If this
performance measure had been used, the Patio Division manager would have
increased the division’s residual income by $180,000 through the addition of
the new product line, as shown next.
Operating income ……………………………………………………………… $3,600,000
Minimum desired income (14% × $15,000,000) ……………………. (2,100,000)
Residual income ……………………………………………………………….. $1,500,000
× Bonus percentage ………………………………………………………….. × 6.7%