CHAPTER 28 (FIN MAN); CHAPTER 14 (MAN)
THE BALANCED SCORECARD AND
CORPORATE SOCIAL RESPONSIBILITY
DISCUSSION QUESTIONS
1. A strategic performance measurement system defines and links strategic objectives to the
performance metrics that a company uses. This system helps a company to align metrics with
overall goals and objectives (both financial and nonfinancial) and thereby measure
performance relating to company strategy. The balanced scorecard is the most well-known
4. Strategic objectives define the purpose of an action taken within the company. They are
essentially subcomponents of the organization’s overall mission statement or strategy. Strategic
initiatives are action plans that management implements to achieve the strategic objectives. In
other words, strategic objectives are different goals a company wants to achieve, and strategic
initiatives are the plans a company makes to achieve those goals.
5. Strategy maps show the expected cause-and-effect relationships amoung strategic objectives.
For example, a strategy map may illustrate that fulfilling the strategic objective to reduce
delivery times will cause customers to be more satisfied, contributing to a separate strategic
objective to please the customer. Strategy maps add value to the balanced scorecard by
illustrating how each strategic objective contributes to the overall mission or strategy of the
company.
7. People subject to motivated reasoning tend to ignore bad news, rely too heavily on good news,
stop gathering information when results look good, continue searching for good news when
things look bad, and interpret ambiguous news as good news.
8. A company using scorecard cascading will have unique scorecards for each division or
department of the company and for each level of management. This makes it difficult for

CHAPTER 28 (FIN MAN); CHAPTER 14 (MAN) The Balanced Scorecard and Corporate Social Responsibility
DISCUSSION QUESTIONS (Concluded)
9. Corporate social responsibility is the general term for the efforts of companies to take
responsibility for the impact their operations have on society and to improve social well-being
within and outside the firm. Sustainability efforts are corporate social responsibility activities
that involve ensuring the ability to meet current needs without compromising the ability of future
generations to meet their needs (e.g., efforts to protect the environment).
10. Companies can use the balanced scorecard to address CSR objectives in a variety of ways. One
CHAPTER 28 (FIN MAN); CHAPTER 14 (MAN) The Balanced Scorecard and Corporate Social Responsibility
BASIC EXERCISES
BE 28–1 (FIN MAN); BE 14–1 (MAN)
Leading indicators:
Employee turnover
Number of shipping errors
Median training hours per employee
Lagging indicators:
BE 28–2 (FIN MAN); BE 14–2 (MAN)
Strategic Objective
Performance
Perspective
Possible Performance Metrics
(Not an exhaustive list)
Increase profits
Financial
•
Market share
•
Operating profit
•
Gross profit
Obtain new
Customer
•
Number of new customers
customers
•
Percentage of sales from new customers
•
Number of leads
Improve production
Internal
•
Average production time per product
•
Total costs of production
•
Average cost of production per product
Recruit top
Learning
•
Percentage of entry-level hires with
master’s degree
•
Percentage of entry-level hires from top
10 colleges
•
Percentage of interns from top 10 colleges
who become full-time hires
BE 28–3 (FIN MAN); BE 14–3 (MAN)
Sales
$ 230,000
Cost of goods sold
(150,000)
CHAPTER 28 (FIN MAN); CHAPTER 14 (MAN) The Balanced Scorecard and Corporate Social Responsibility
BE 28–4 (FIN MAN); BE 14–4 (MAN)
a. The owner made her decision entirely based on the number of orders of the gumbo
dish at each location. She mistakenly ignored the number of customer complaints
about the dish. Some simple data analysis reveals that while the number of orders
b. The cognitive bias at play in this situation was motivated reasoning. Because the
owner developed the new recipe herself and wanted it to succeed, she overvalued
the positive feedback about it and ignored the negative feedback.
BE 28–5 (FIN MAN); BE 14–5 (MAN)
a. Minimizing emissions by switching to an all-electric fleet is an internal operations
change and, therefore, falls under the internal processes performance perspective.
CHAPTER 28 (FIN MAN); CHAPTER 14 (MAN) The Balanced Scorecard and Corporate Social Responsibility
EXERCISES
Ex. 28–1 (FIN MAN); Ex. 14–1 (MAN)
a. Internal processes
b. All of the following are performance metrics that could be used to measure the
strategic objective to efficiently produce meals:
c.
Performance Metric
Type of Indicator
Minutes from ordered to delivered
Leading
Labor hours per meal
Leading
Number of erroneous meals prepared per hour
Leading
Cost of ingredients per meal
Leading
Number of meals produced per hour
Leading
Ex. 28–2 (FIN MAN); Ex. 14–2 (MAN)
Performance Measure
Performance Perspective
Average card member spending
Customer
Number of Internet features
Internal processes
Cards in force
Internal processes
Number of merchant signings
Earnings growth
Hours of credit consultant training
Learning and growth
Return on equity
Investment in information technology
Learning and growth
CHAPTER 28 (FIN MAN); CHAPTER 14 (MAN) The Balanced Scorecard and Corporate Social Responsibility
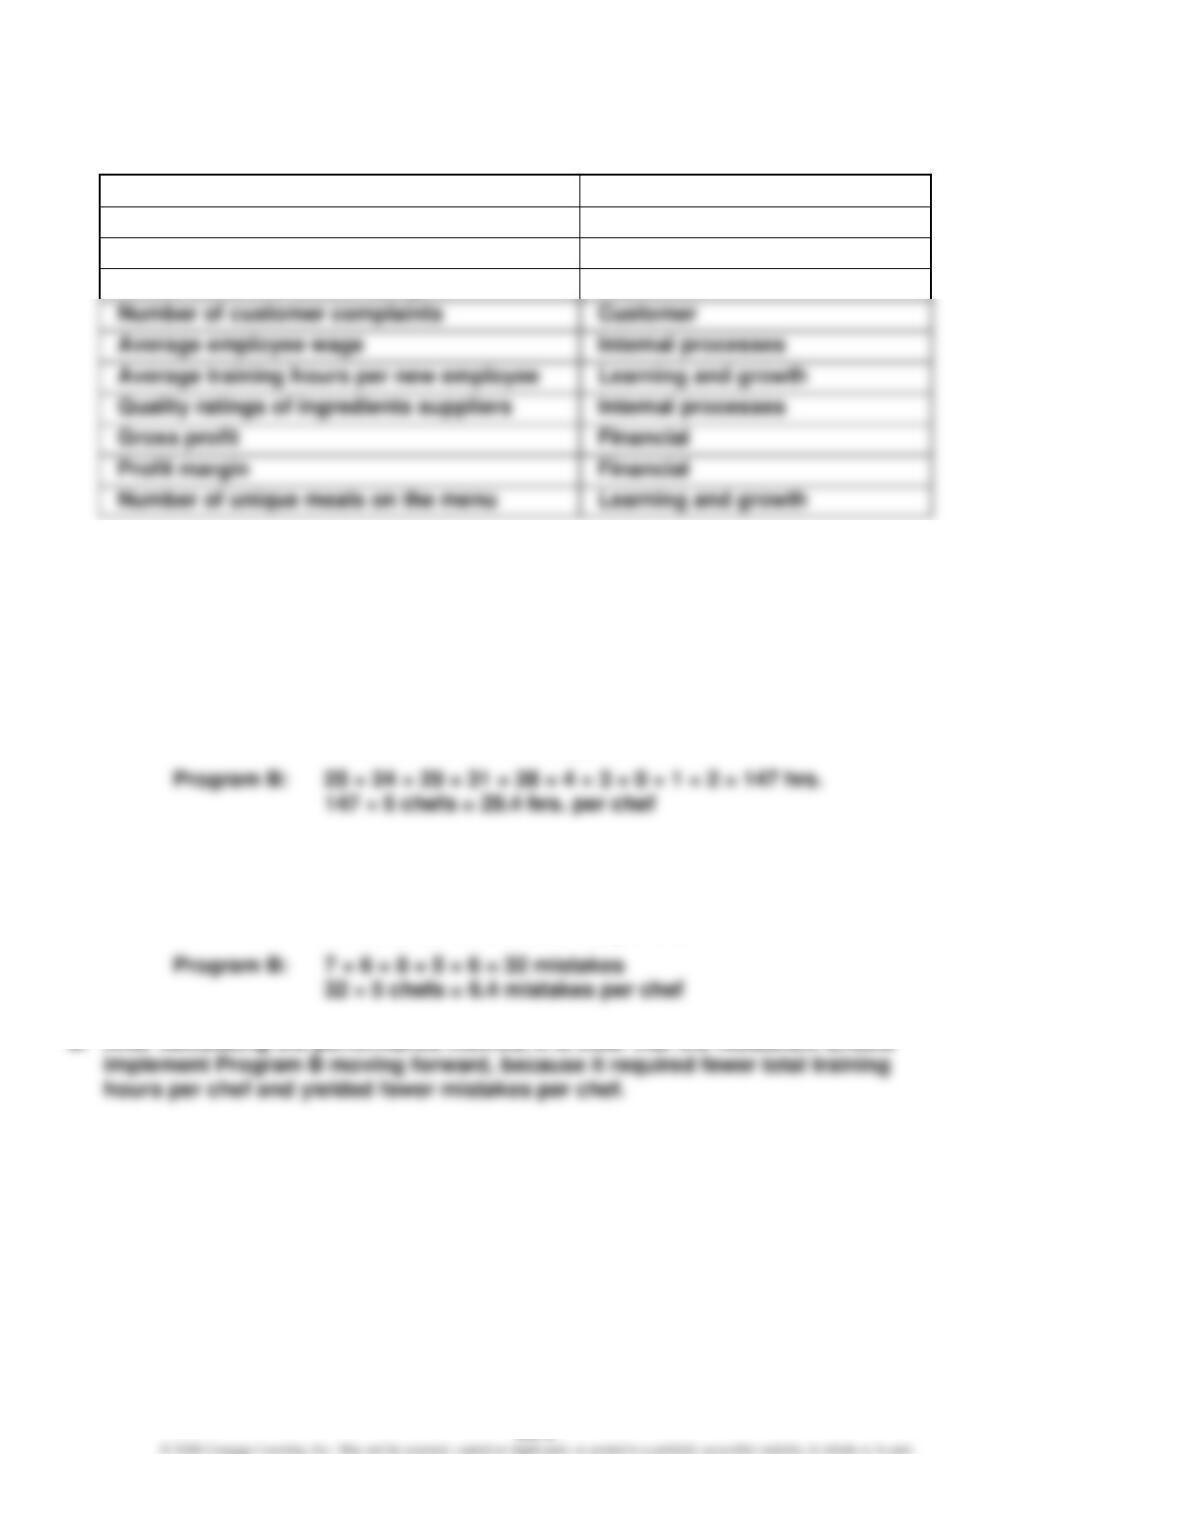
Ex. 28–3 (FIN MAN); Ex. 14–3 (MAN)
Possible Balanced Scorecard Measures
Performance Perspective
Average meal price
Financial
Number of meals purchased
Customer
Online customer review ratings
Customer
Number of customer complaints
Customer
Average employee wage
Internal processes
Average training hours per new employee
Learning and growth
Quality ratings of ingredients suppliers
Internal processes
Gross profit
Financial
Profit margin
Financial
Note to Instructor: This list contains several possible answers, but is not an
exhaustive list of all possible answers students may give.
Ex. 28–4 (FIN MAN); Ex. 14–4 (MAN)
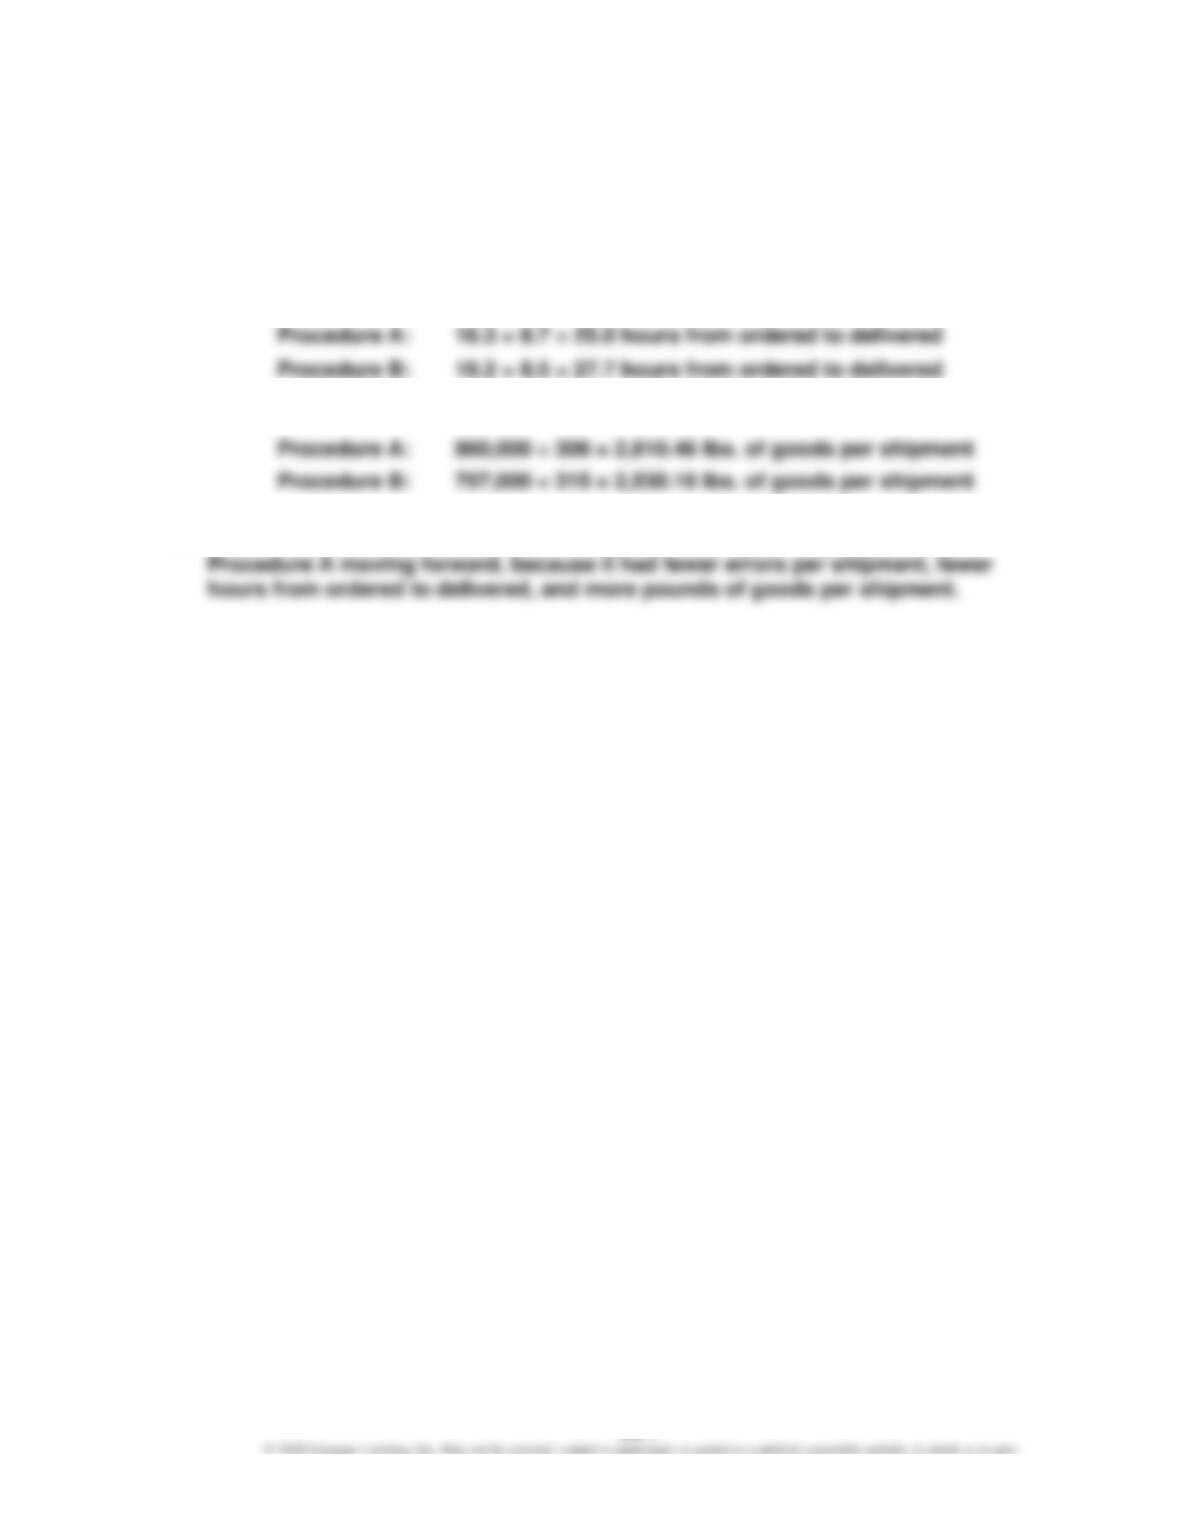
a. (1) Average hours of employee training:
Program A:
22 + 24 + 28 + 21 + 23 + 8 + 7 + 8 + 10 + 11 = 162 hrs.
162 ÷ 5 chefs = 32.4 hrs. per chef
(2) Average number of chef mistakes:
Program A:
12 + 13 + 15 + 14 + 14 = 68 mistakes
68 ÷ 5 chefs = 13.6 mistakes per chef
CHAPTER 28 (FIN MAN); CHAPTER 14 (MAN) The Balanced Scorecard and Corporate Social Responsibility
Ex. 28–5 (FIN MAN); Ex. 14–5 (MAN)
a. (1) Average number of shipping errors per shipment:
Procedure A:
105 ÷ 306 = 0.343 error per shipment
Procedure B:
132 ÷ 315 = 0.419 error per shipment
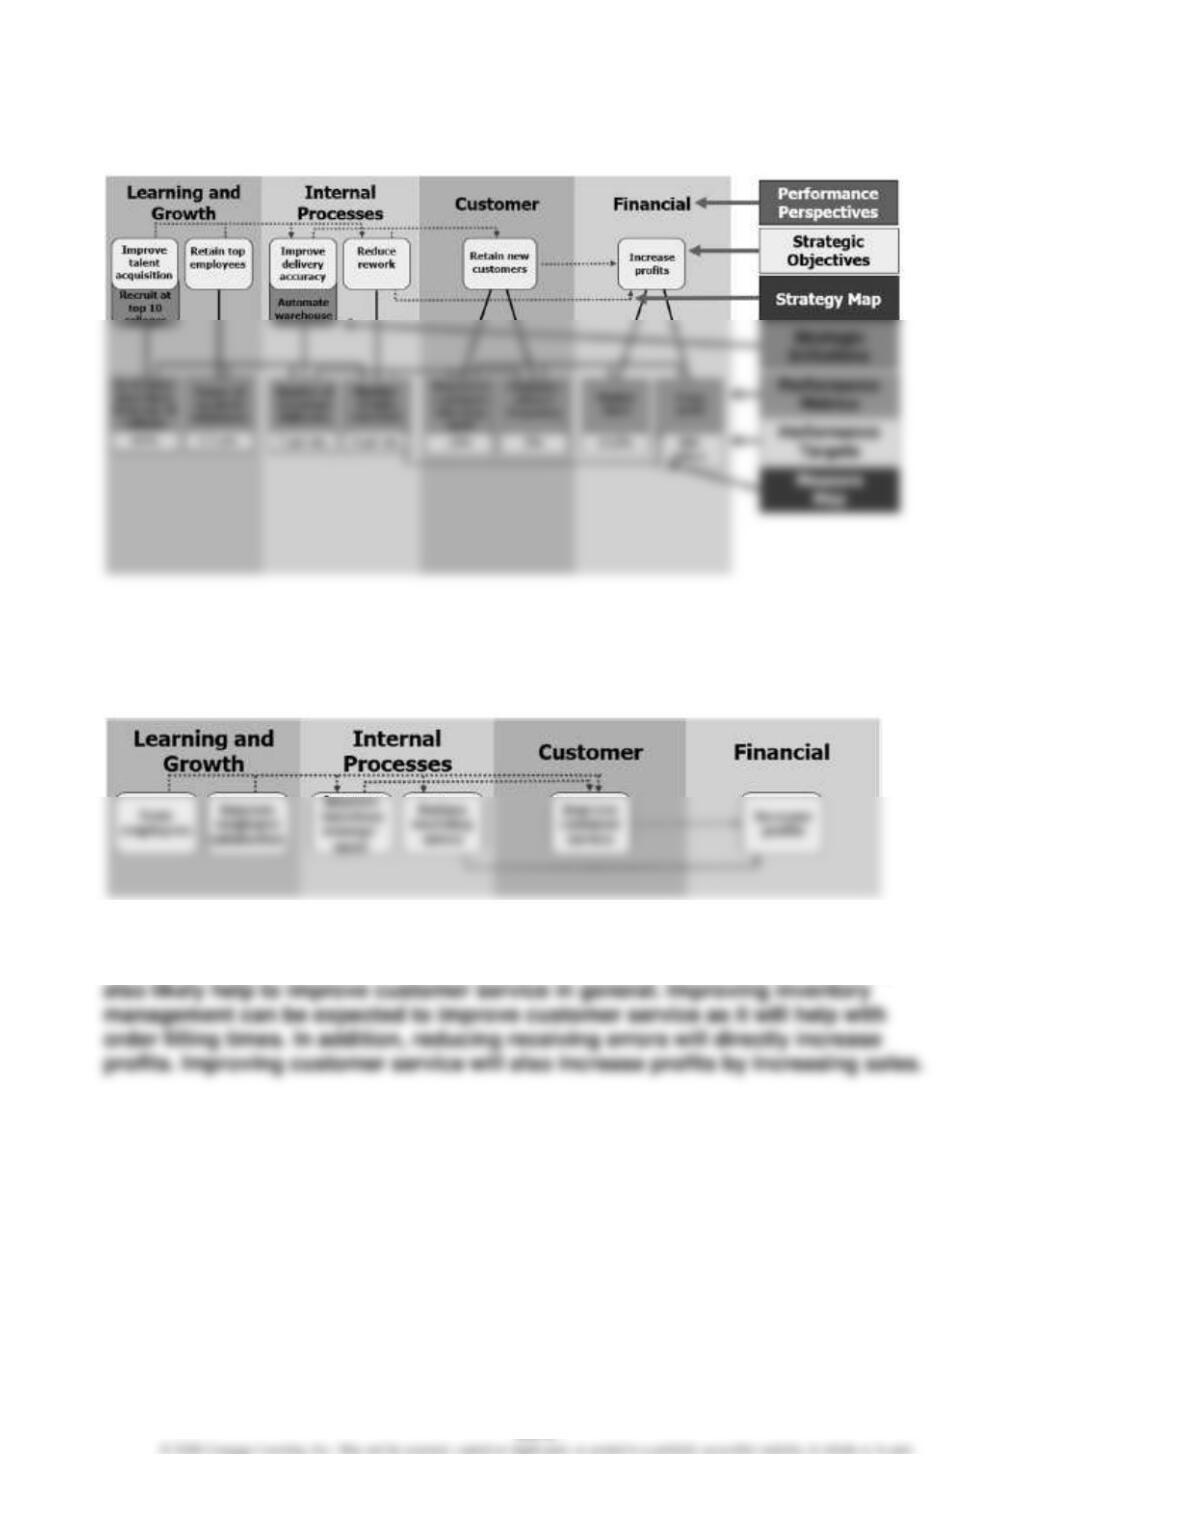
(2) Hours from ordered to delivered:
(3) Average pounds of goods per shipment:
b. Given the performance metrics, the company should probably implement
CHAPTER 28 (FIN MAN); CHAPTER 14 (MAN) The Balanced Scorecard and Corporate Social Responsibility
Ex. 28–6 (FIN MAN); Ex. 14–6 (MAN)
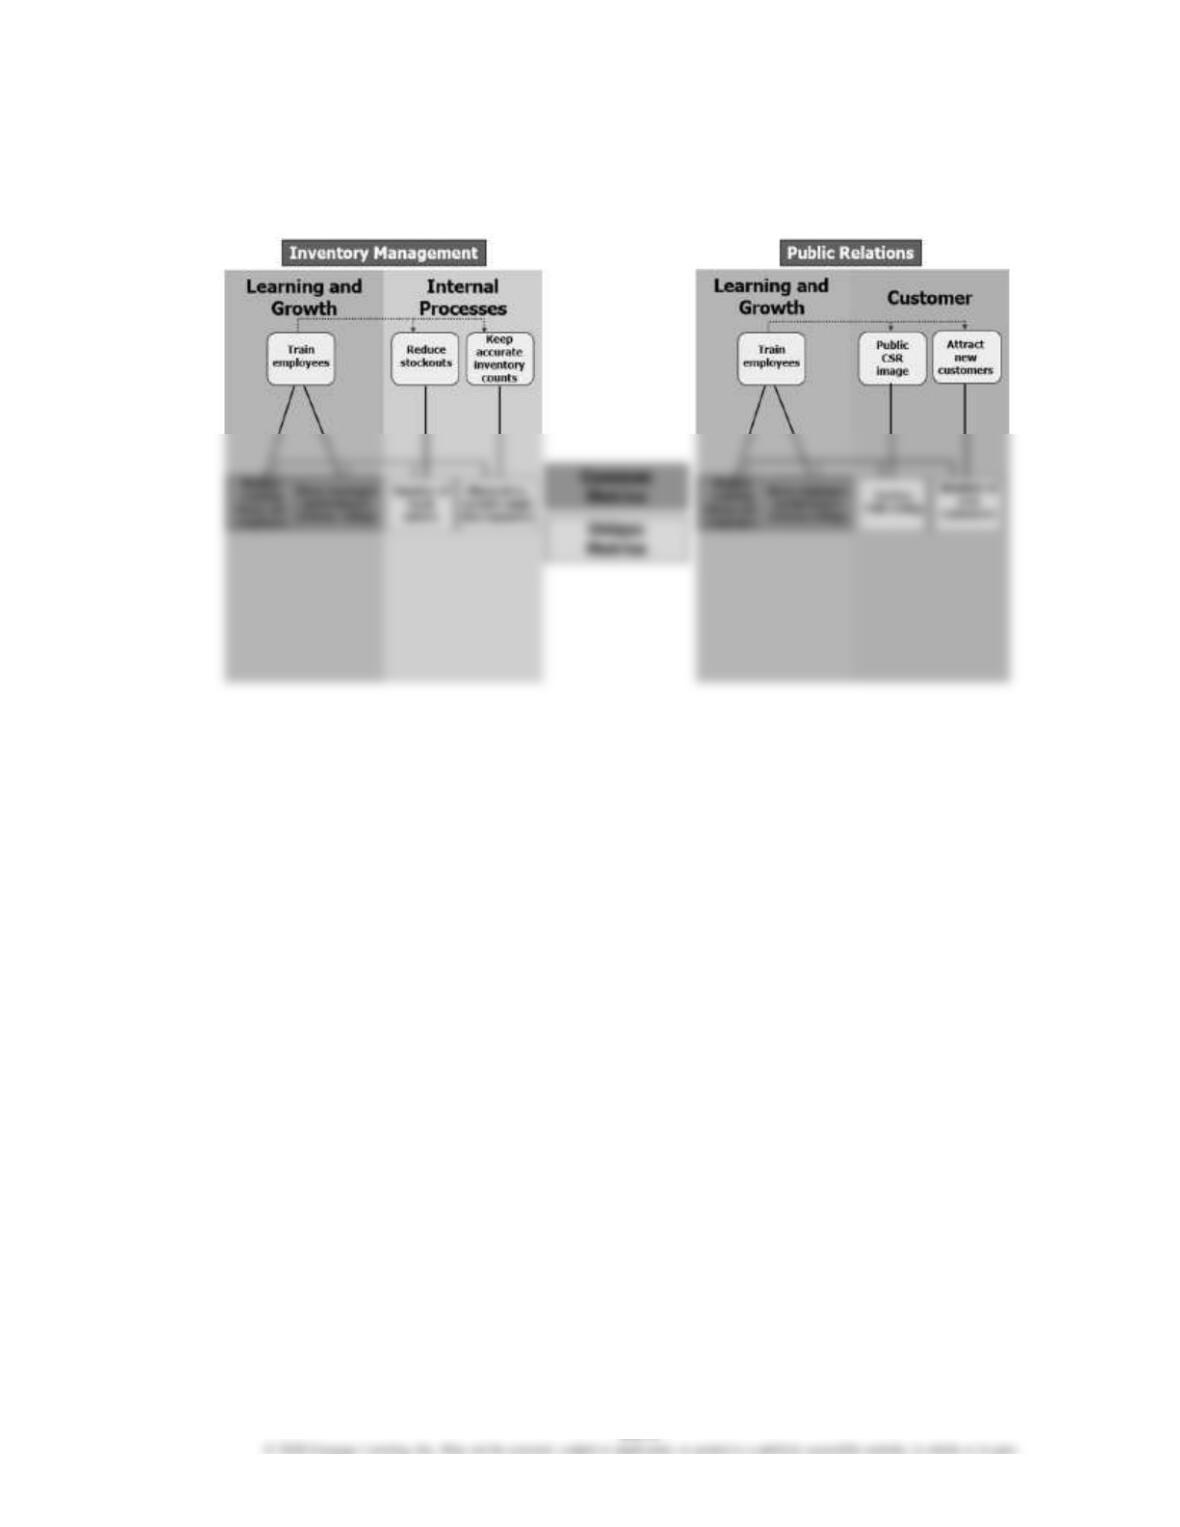
a.
b. Increase profits
Ex. 28–7 (FIN MAN); Ex. 14–7 (MAN)
a.
b. Training employees better and improving employee satisfaction can both be
expected to improve inventory management and reduce receiving errors. They will
CHAPTER 28 (FIN MAN); CHAPTER 14 (MAN) The Balanced Scorecard and Corporate Social Responsibility
Ex. 28–8 (FIN MAN); Ex. 14–8 (MAN)
a. Scorecard cascading
b.
CHAPTER 28 (FIN MAN); CHAPTER 14 (MAN) The Balanced Scorecard and Corporate Social Responsibility
Ex. 28–9 (FIN MAN); Ex. 14–9 (MAN)
a. Days from ordered to delivered:
3.5 – 3 = 0.5 day above 3 days from order to delivery
0.5 × 1.0% = 0.5% decrease in customer retention rate
b. New market share:
60% – 55% = 5% total decrease in customer retention rate
Ex. 28–10 (FIN MAN); Ex. 14–10 (MAN)
Decrease in percentage of customers who shop again:
27.5
average hours from ordered to shipped
43.8 – 40.0 = 3.8 hours above target average
3.8 × 0.5% = 1.9% decrease in percentage of customers who shop again
Effects of erroneous shipments above target:
80 – 65 = 15 errors above target
1.9% × 0.3% = 0.57% decrease in future market share
Effects of the decrease in overall online customer satisfaction rating:
0.75 × $3,000 = $2,250 decrease in future profit
0.75 × 0.6% = 0.45% decrease in future market share
Total decrease in future profit:
Total decrease in future market share:
$ 7,500
CHAPTER 28 (FIN MAN); CHAPTER 14 (MAN) The Balanced Scorecard and Corporate Social Responsibility
Ex. 28–11 (FIN MAN); Ex. 14–11 (MAN)
a. The cognitive bias at play in this situation is the common measures bias. The
common measures bias occurs when management underweights performance
metrics unique to individual departments or divisions and focuses primarily on
common performance metrics for all departments or divisions.
b. If management had avoided the common measures bias by focusing on all
performance metrics for each division, the larger bonus would have most likely
been assigned to the Sales Department. This is because the Sales Department
c. One advantage of unique balanced scorecards is that they allow companies to
evaluate different divisions based on objectives and metrics that are most relevant
to each individual division. This enables companies to more accurately measure
CHAPTER 28 (FIN MAN); CHAPTER 14 (MAN) The Balanced Scorecard and Corporate Social Responsibility
Ex. 28–12 (FIN MAN); Ex. 14–12 (MAN)
a. While switching to a greener fuel source is an internal processes change,
b. Measuring the percentage of power from solar energy would help management
know if the company is completely independent from the city power grid.
However, inasmuch as the objective is to improve CSR perceptions, another
appropriate measure would be a CSR perception survey.
CHAPTER 28 (FIN MAN); CHAPTER 14 (MAN) The Balanced Scorecard and Corporate Social Responsibility
PROBLEMS
Prob. 28–1A (FIN MAN); Prob. 14–1A (MAN)
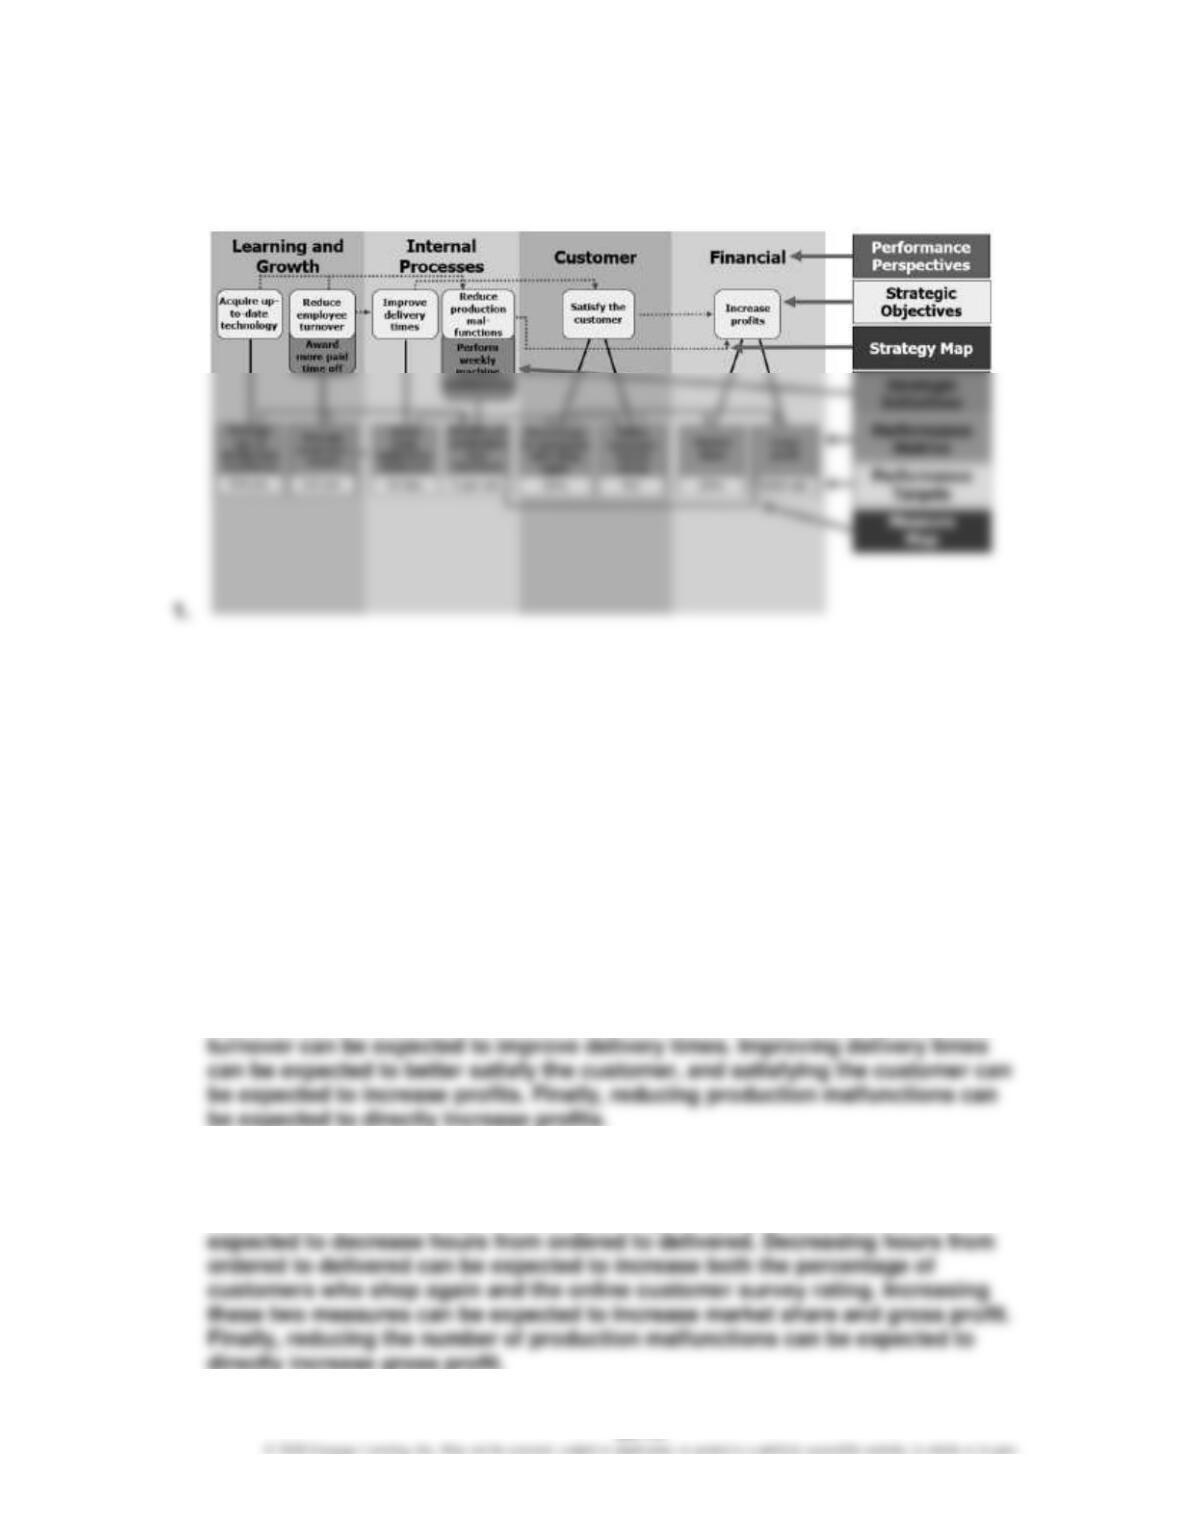
2. Acquiring up-to–date technology and reducing employee turnover can both be
expected to reduce production malfunctions. Additionally, reducing employee
3. Reducing the average age of production machinery and increasing average
employee tenure can both be expected to reduce the number of production
malfunctions. Additionally, increasing average employee tenure can be
CHAPTER 28 (FIN MAN); CHAPTER 14 (MAN) The Balanced Scorecard and Corporate Social Responsibility
Prob. 28–2A (FIN MAN); Prob. 14–2A (MAN)
1.
Target gross profit percentage ……………………….
40% of sales
Total cost of production percentage ……………….
60% of sales
Total sales ……………………………………………………..
$1,500,000
Total cost of production percentage ………………..
× 60%
Target cost of production………………………………..
$ 900,000
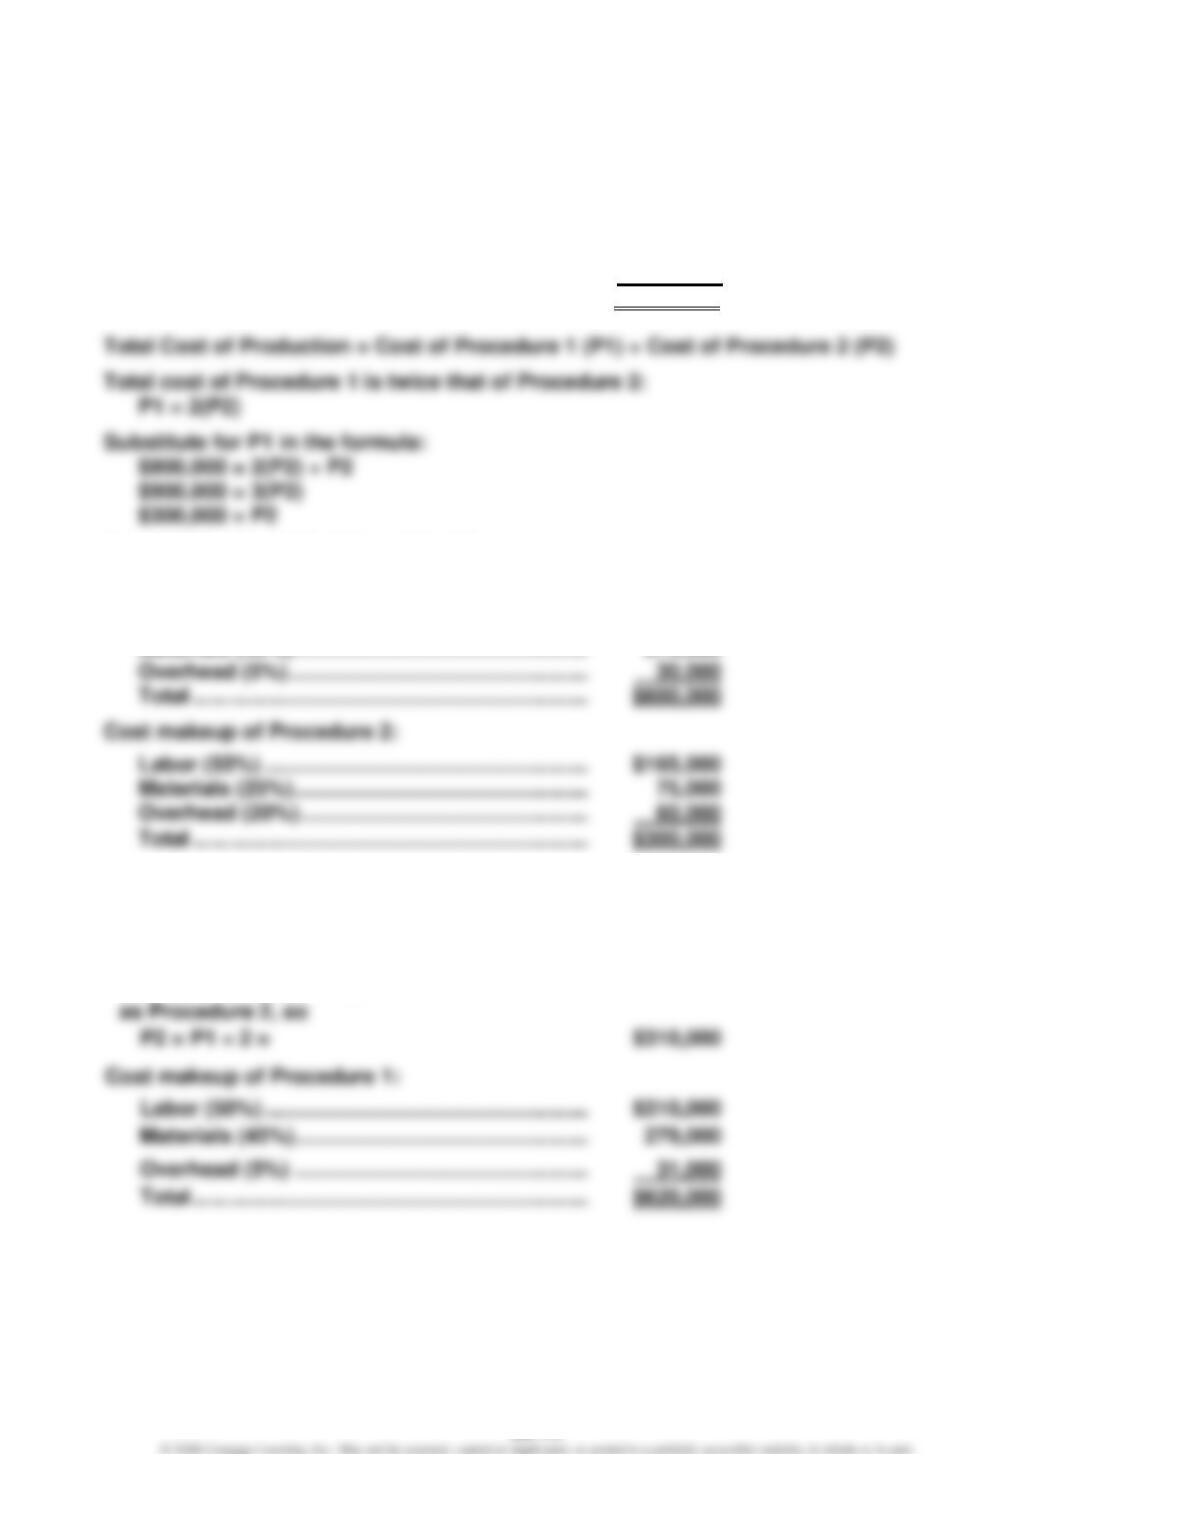
P1 = 2(P2) = (2 × $300,000) = $600,000
Cost makeup of Procedure 1:
Labor (50%) ………………………………………………
$300,000
Cost makeup of Procedure 2:
$165,000
$300,000
2.
Materials cost of Procedure 1 ………………………….
$279,000
Materials cost = 45% of P1, so
P1 = $279,000 ÷ 45% =
$620,000
Procedure 1 cost twice as much
P2 = P1 ÷ 2 =
$310,000
Cost makeup of Procedure 1: