453
CHAPTER 14
PERFORMANCE EVALUATION FOR
DECENTRALIZED OPERATIONS
CLASS DISCUSSION QUESTIONS
1. In a cost center, the department manager is
responsible for and has authority over costs
only. In a profit center, the manager’s re-
sponsibility and authority extend to costs
and revenues.
3. The difference in budget performance re-
ports prepared for department supervisors
and plant managers is the amount of detail
provided to each. The departmental supervi-
sors require considerable detail to control
costs. The report for the plant managers
would contain more summarized cost data
for the various departments.
4. A cost center manager is not responsible for
making decisions concerning sales or the
amount of fixed assets invested in the cen-
ter.
6. The major shortcoming of using income from
operations as a measure of investment cen-
ter performance is that it ignores the amount
of investment committed to each center.
Since investment center managers also con-
8. A division of a decentralized company could
be considered the least profitable, even
though it earned the largest amount of in-
come from operations, when its rate of re-
turn on investment is the lowest. In this situ-
from operations per dollar invested.
10. North Division. The North Division will return
38 cents (38%) on each dollar of invested
assets, while the South and Midwest divi-
sions will return only 30 cents (30%) and 22
cents (22%), respectively. Thus, in expand-
ing operations, the North Division should be
given priority over the South and Midwest
divisions.
11. A balanced scorecard can indicate the un-
derlying causes of financial performance
from innovation and learning, customer, in-
courage each division manager to work in
the best interests of the company. Thus,
transfer prices should encourage managers
to transfer goods between divisions if the
overall company income can be increased.
454
EXERCISES
E14–1
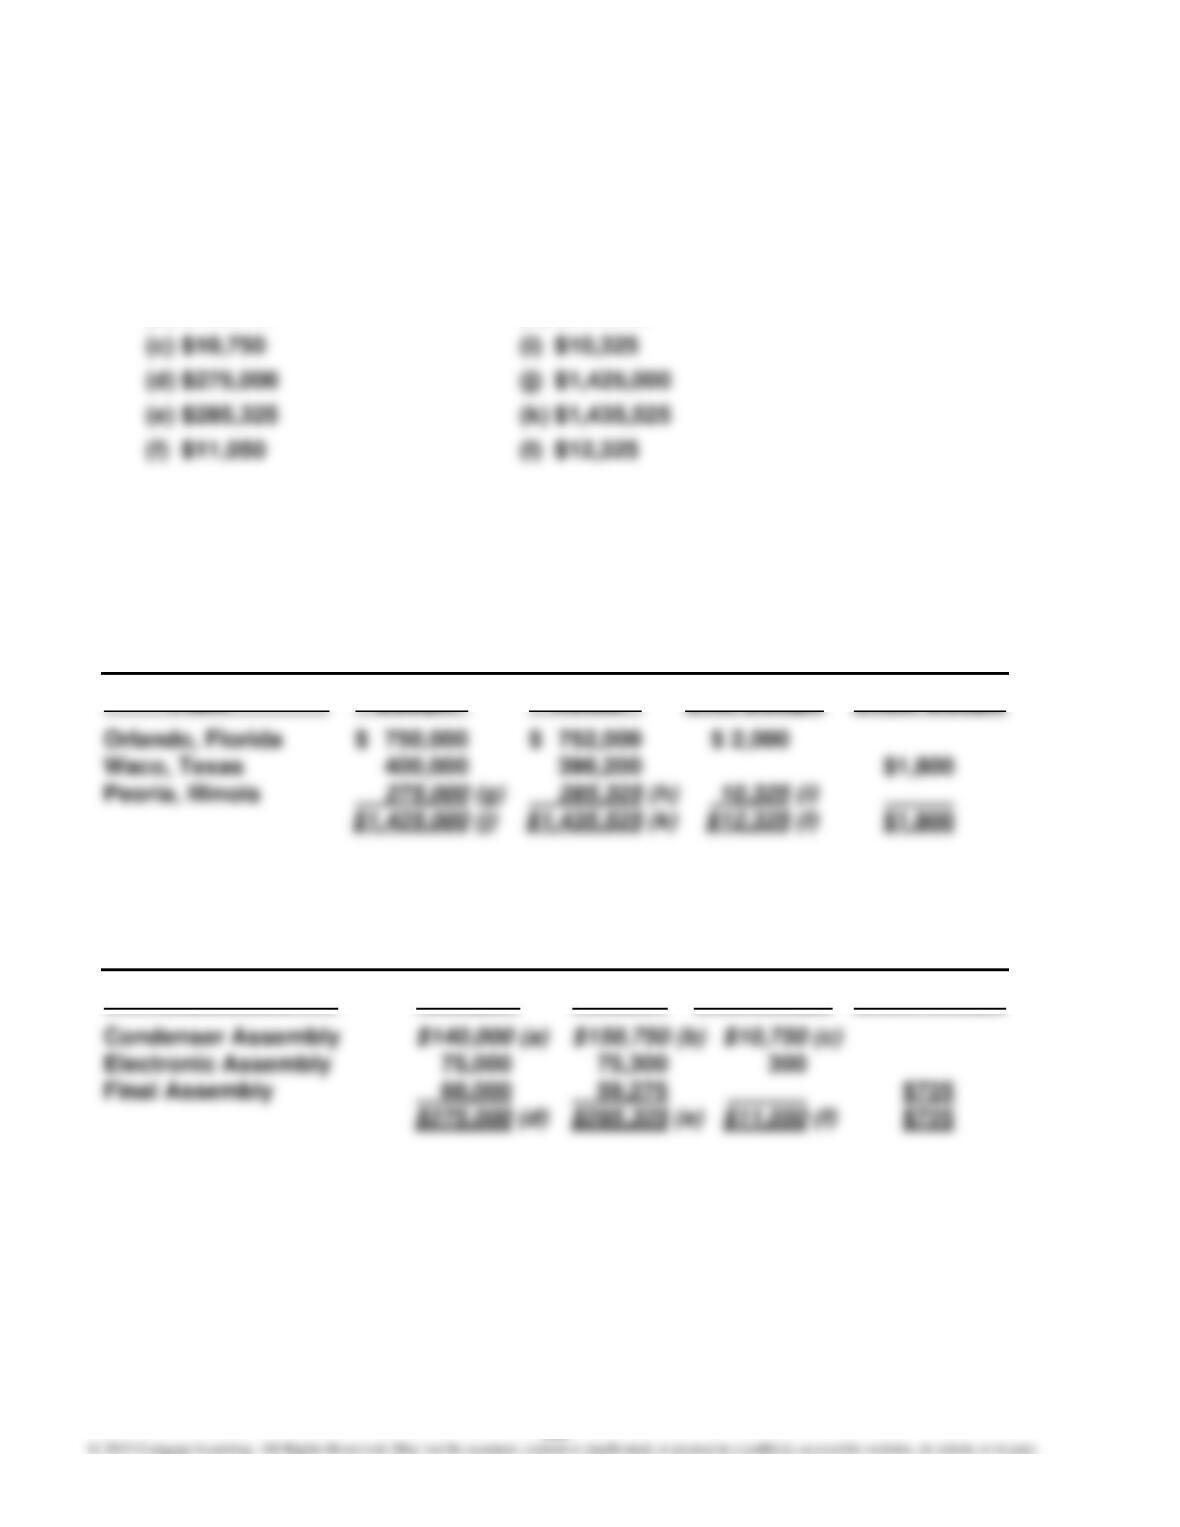
a. (a) $140,000 (g) $275,000
(b) $150,750 (h) $285,325
Schedules of supporting calculations (answers in italics; the solution requires
working from the department level, up to the plant level, then to the vice president
of production level):
MERIDIAN COMPANY
Budget Performance Report—Vice President, Production
For the Month Ended June 30, 20Y4
Plant Budget Actual Over Budget Under Budget
MERIDIAN COMPANY
Budget Performance Report—Plant Manager, Peoria, Illinois
For the Month Ended June 30, 20Y4
Department Budget Actual Over Budget Under Budget
455
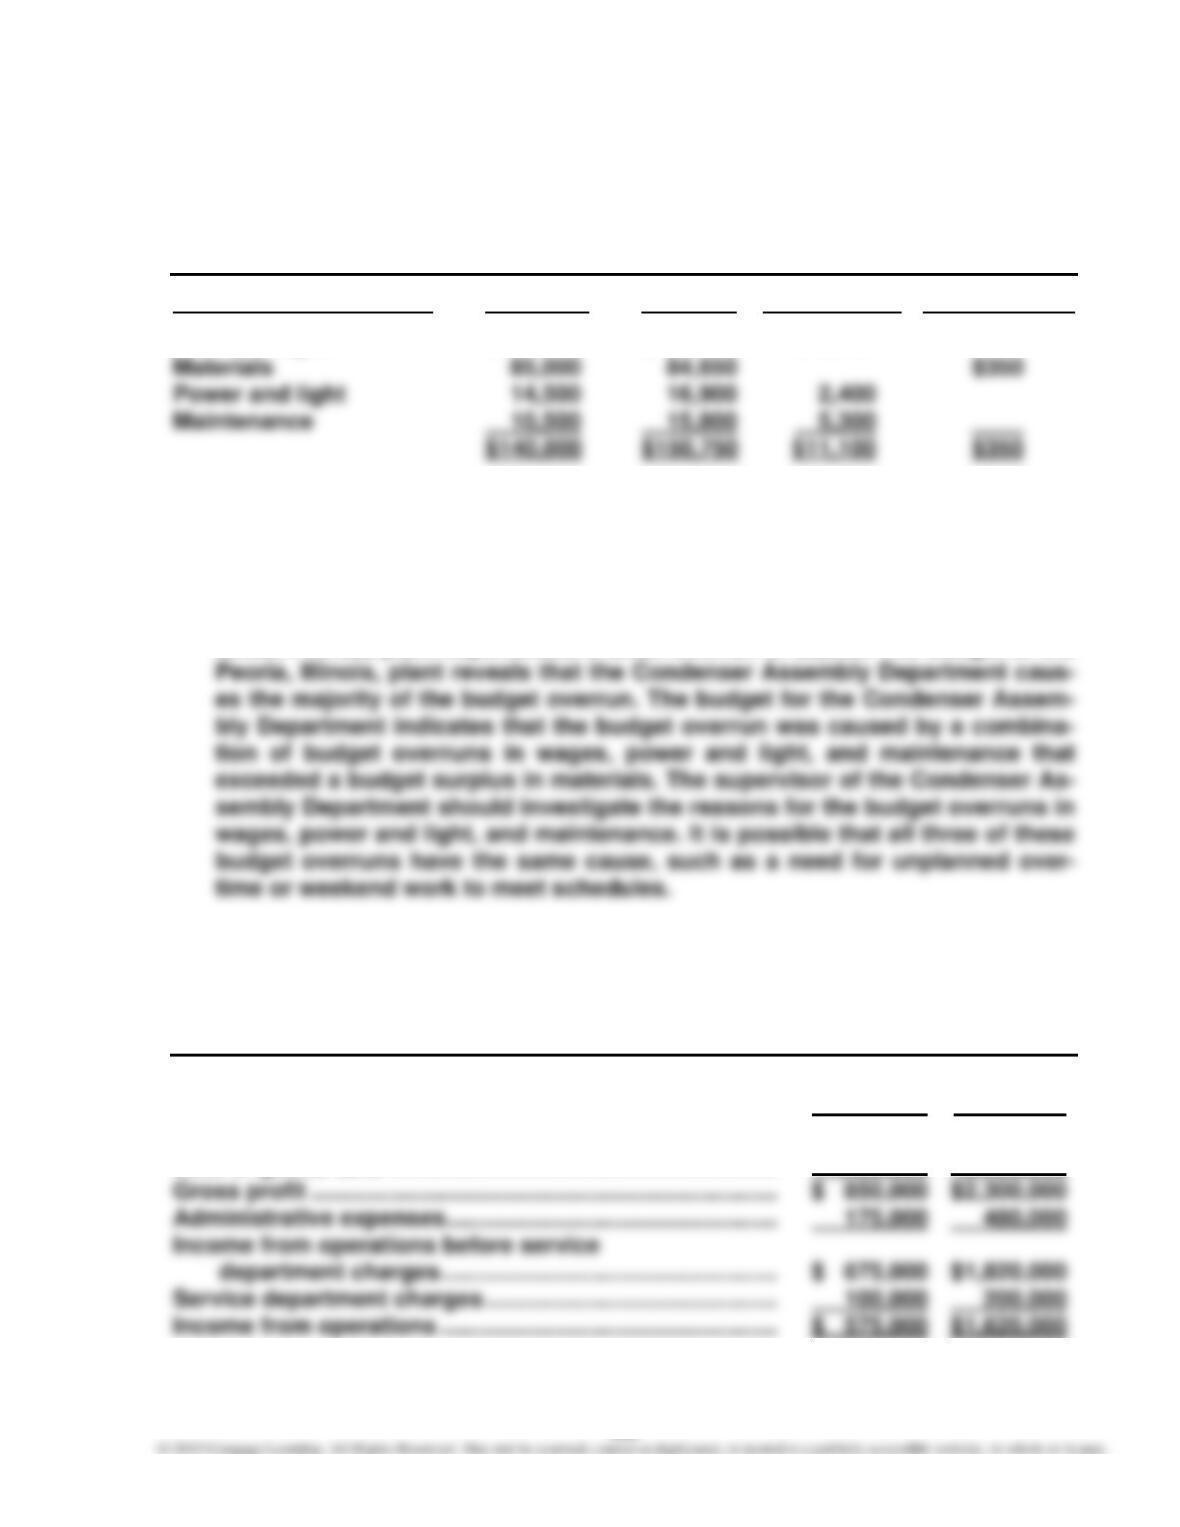
E14–1, Concluded
MERIDIAN COMPANY
Budget Performance Report—Supervisor, Condenser Assembly
For the Month Ended June 30, 20Y4
Department Budget Actual Over Budget Under Budget
Factory wages $ 30,000 $ 33,400 $ 3,400
b. MEMO
To: Darla Pennington, President of Meridian Company
The Peoria, Illinois, plant has experienced a $10,325 budget overrun, while the
Waco, Texas, plant has experienced a budget surplus of $1,800 and the Or-
lando, Florida, plant experienced a small overrun of $2,000. The budget of the
E14–2
STATHAM CONSTRUCTION COMPANY
Divisional Income Statements
For the Year Ended November 30, 20Y3
Residential Industrial
Division Division
Net sales ………………………………………………………………….. $ 2,300,000 $ 5,750,000
Cost of goods sold …………………………………………………… 1,450,000 3,450,000
E14–3
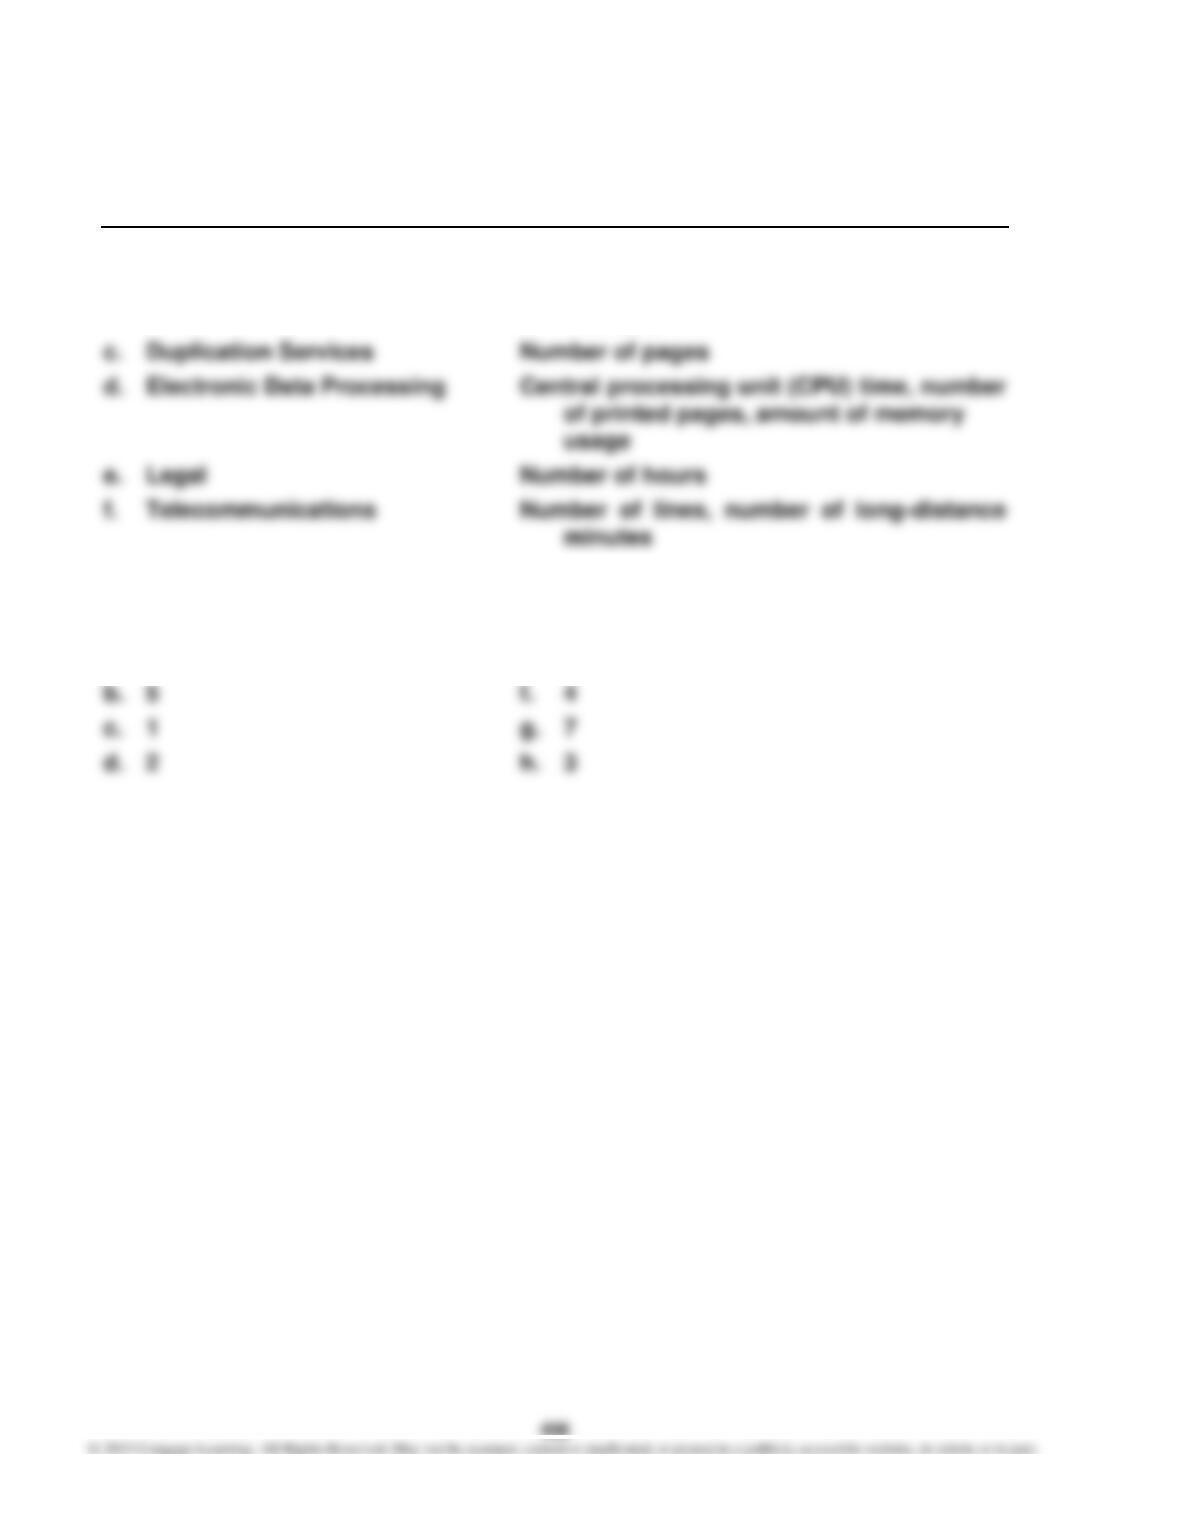
Expense Activity Bases
a. Accounts Receivable Number of invoices, number of customers
b. Central Purchasing Number of requisitions, number of purchase
orders
E14–4
a. 6 e. 8
E14–5
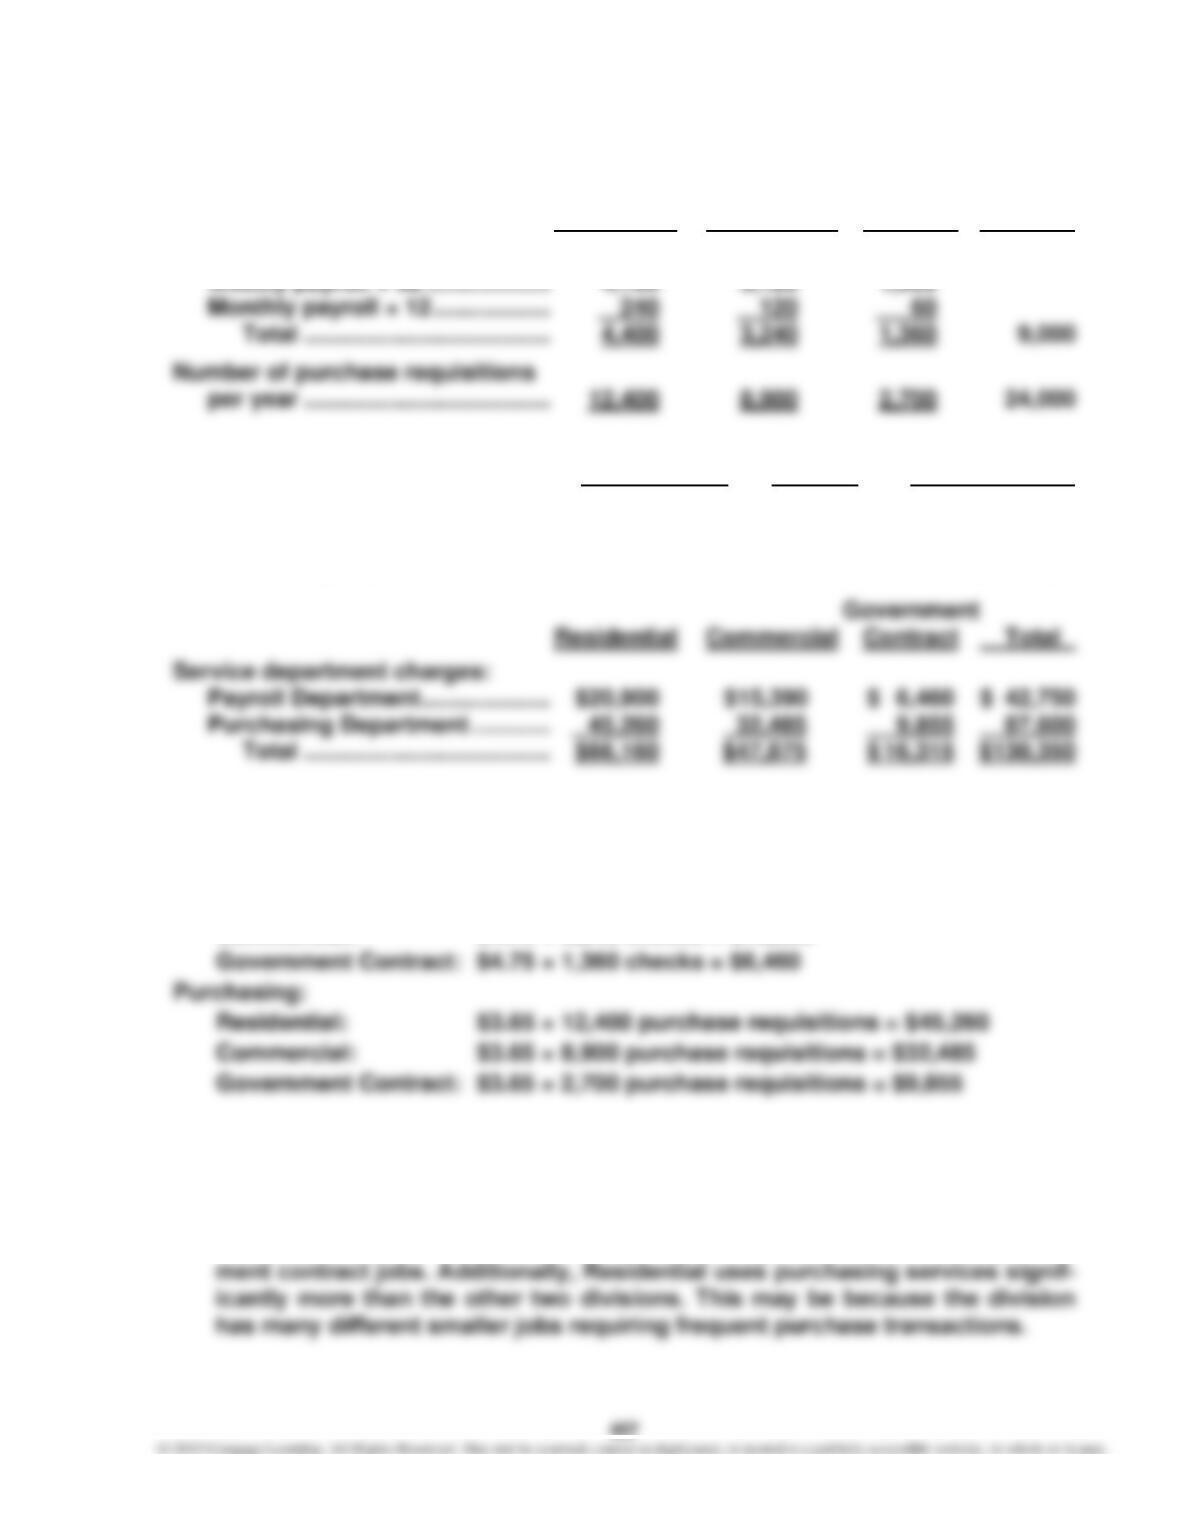
a. Government
Residential Commercial Contract Total
Number of payroll checks:
b. Service Dept. Activity Charge
Cost ÷ Base = Rate
Service department charge rates:
Payroll Department ……………….. $42,750 ÷ 9,000 = $4.75 per check
Purchasing Department ………… $87,600 ÷ 24,000 = $3.65 per req.
The service department charges are determined by multiplying the service
department charge rate by the activity base for each division as shown below.
Payroll:
Residential: $4.75 × 4,400 checks = $20,900
Commercial: $4.75 × 3,240 checks = $15,390
c. Residential’s service department charge is higher than the other two divi-
sions because Residential is a heavy user of service departments. Residential
has many employees on a weekly payroll, which translates into a larger num-
ber of check-issuing transactions. This may be because residential jobs are
less productive per labor hour, compared to larger commercial and govern-
458
E14–6
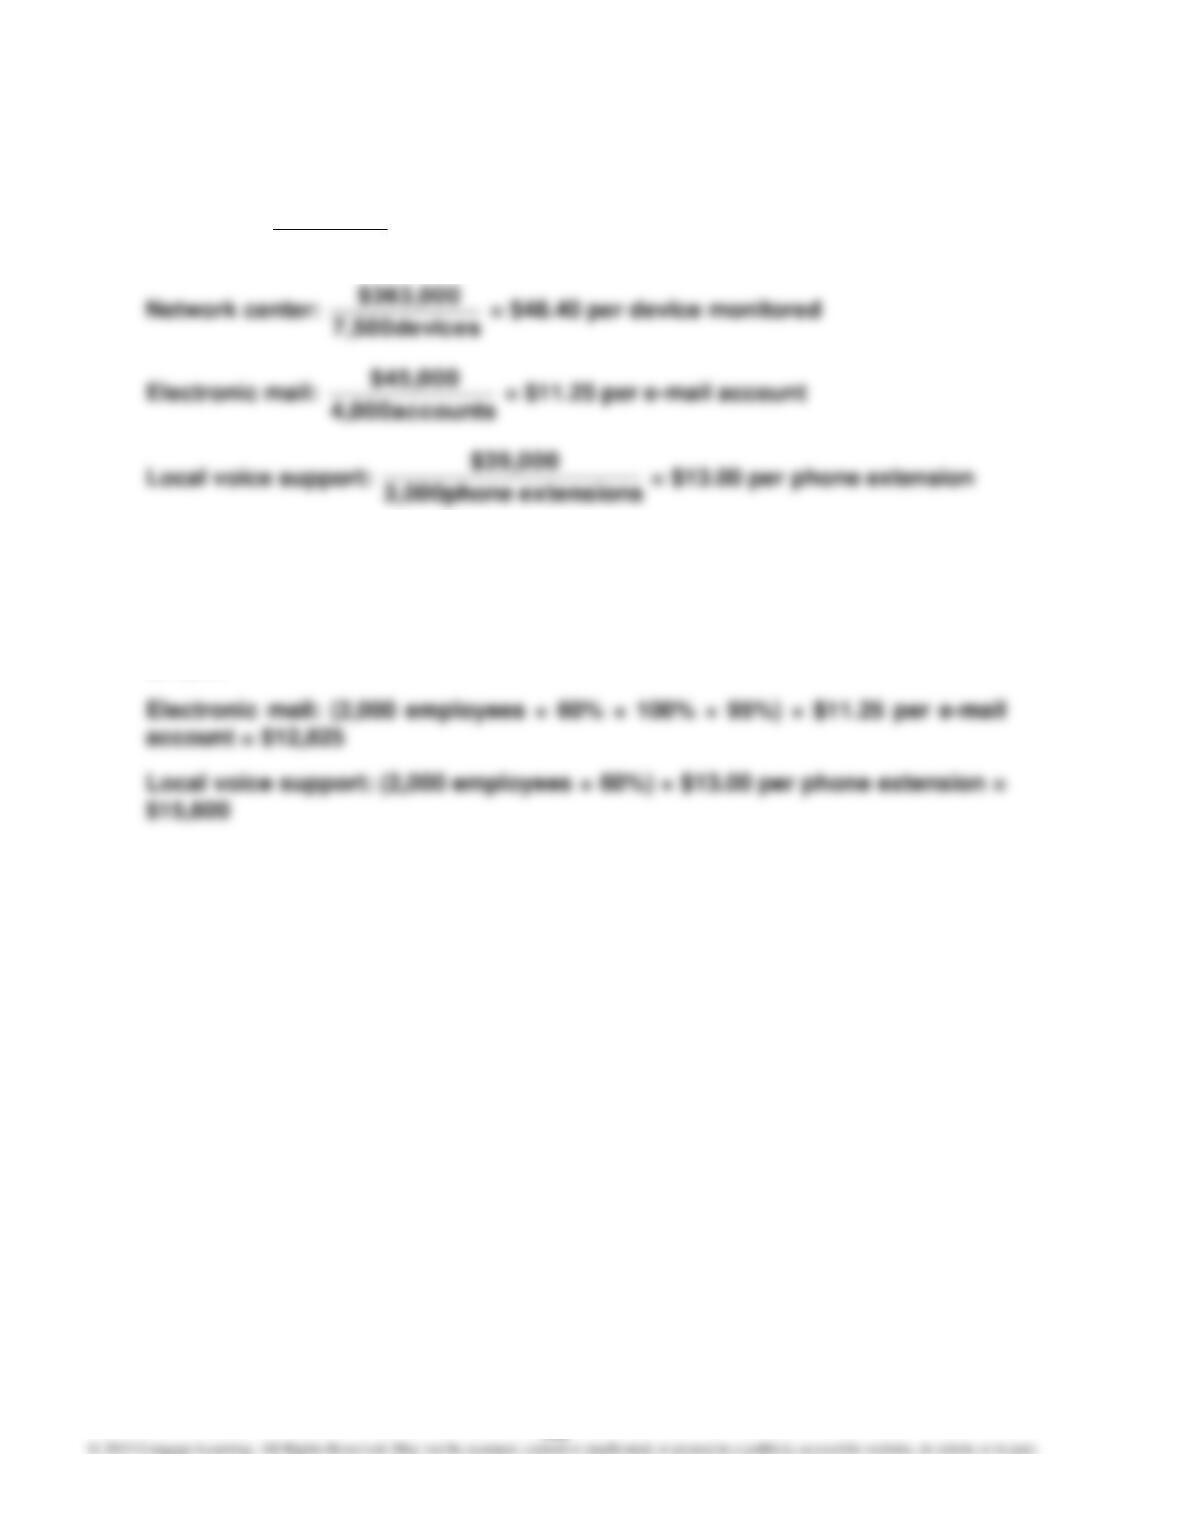
a. Help desk:
calls 5,000
$135,000
= $27.00 per call
b. February charges to the Electronics sector:
Help desk: (2,000 employees × 60% × 100% × 0.45) × $27.00 per call = $14,580
Network center: [(2,000 employees × 60% × 100%) + 80] × $48.40 per device =
$61,952
459
E14–7
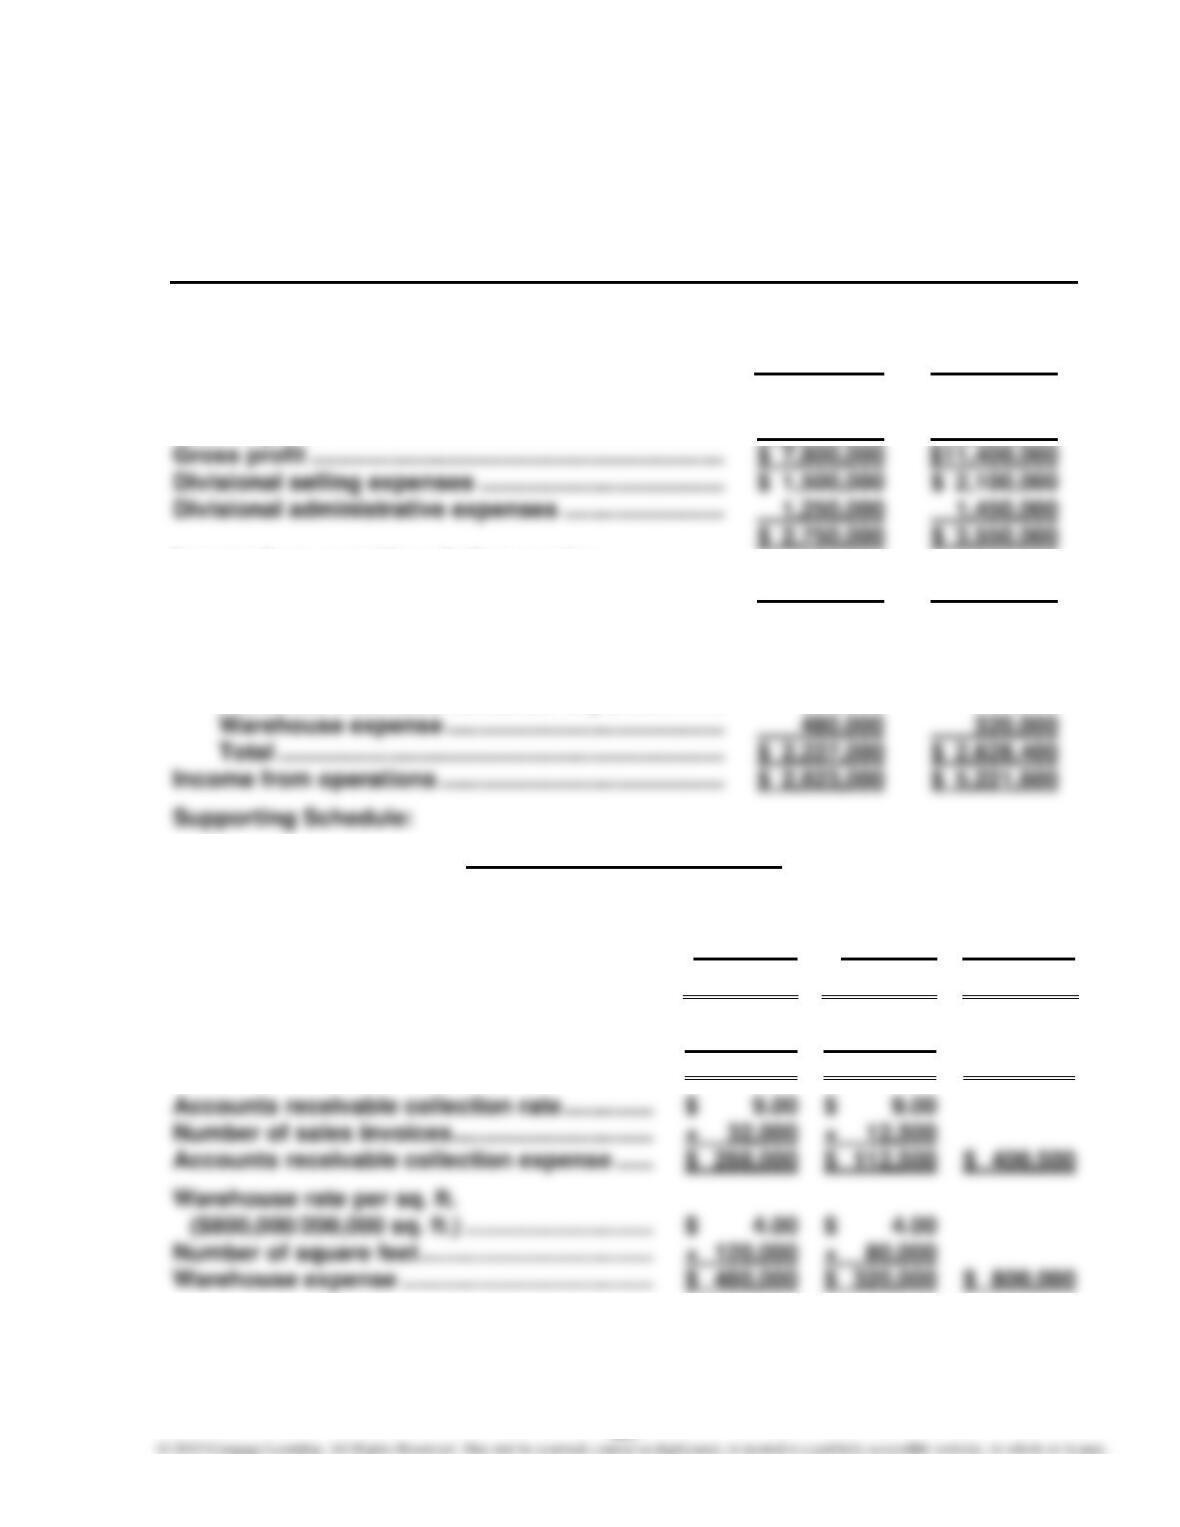
POWER SPORTS COMPANY
Divisional Income Statements
For the Year Ended December 31, 20Y7
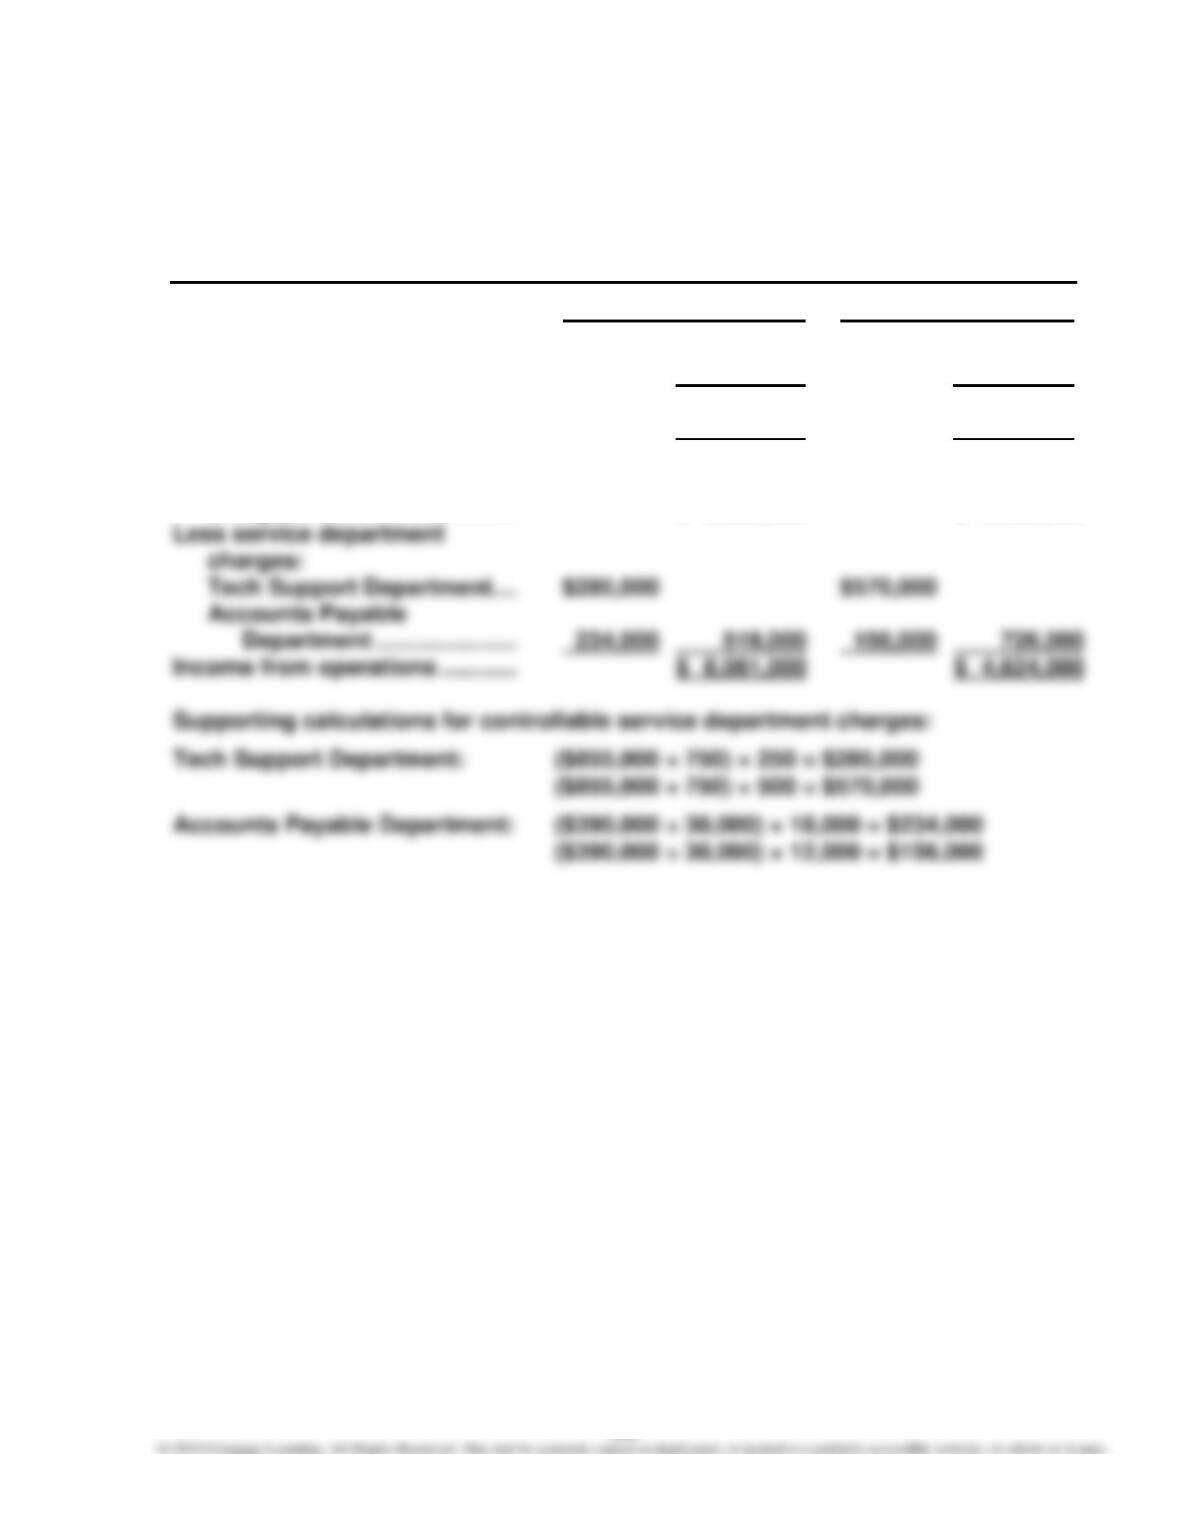
Wholesale Division Retail Division
Revenues ……………………………… $24,600,000 $13,750,000
Cost of goods sold ……………….. 14,500,000 8,000,000
Gross profit ………………………….. $ 10,100,000 $ 5,750,000
Operating expenses ………………. 1,500,000 400,000
Income from operations
before service department
charges ………………………….... $ 8,600,000 $ 5,350,000
460
E14–8
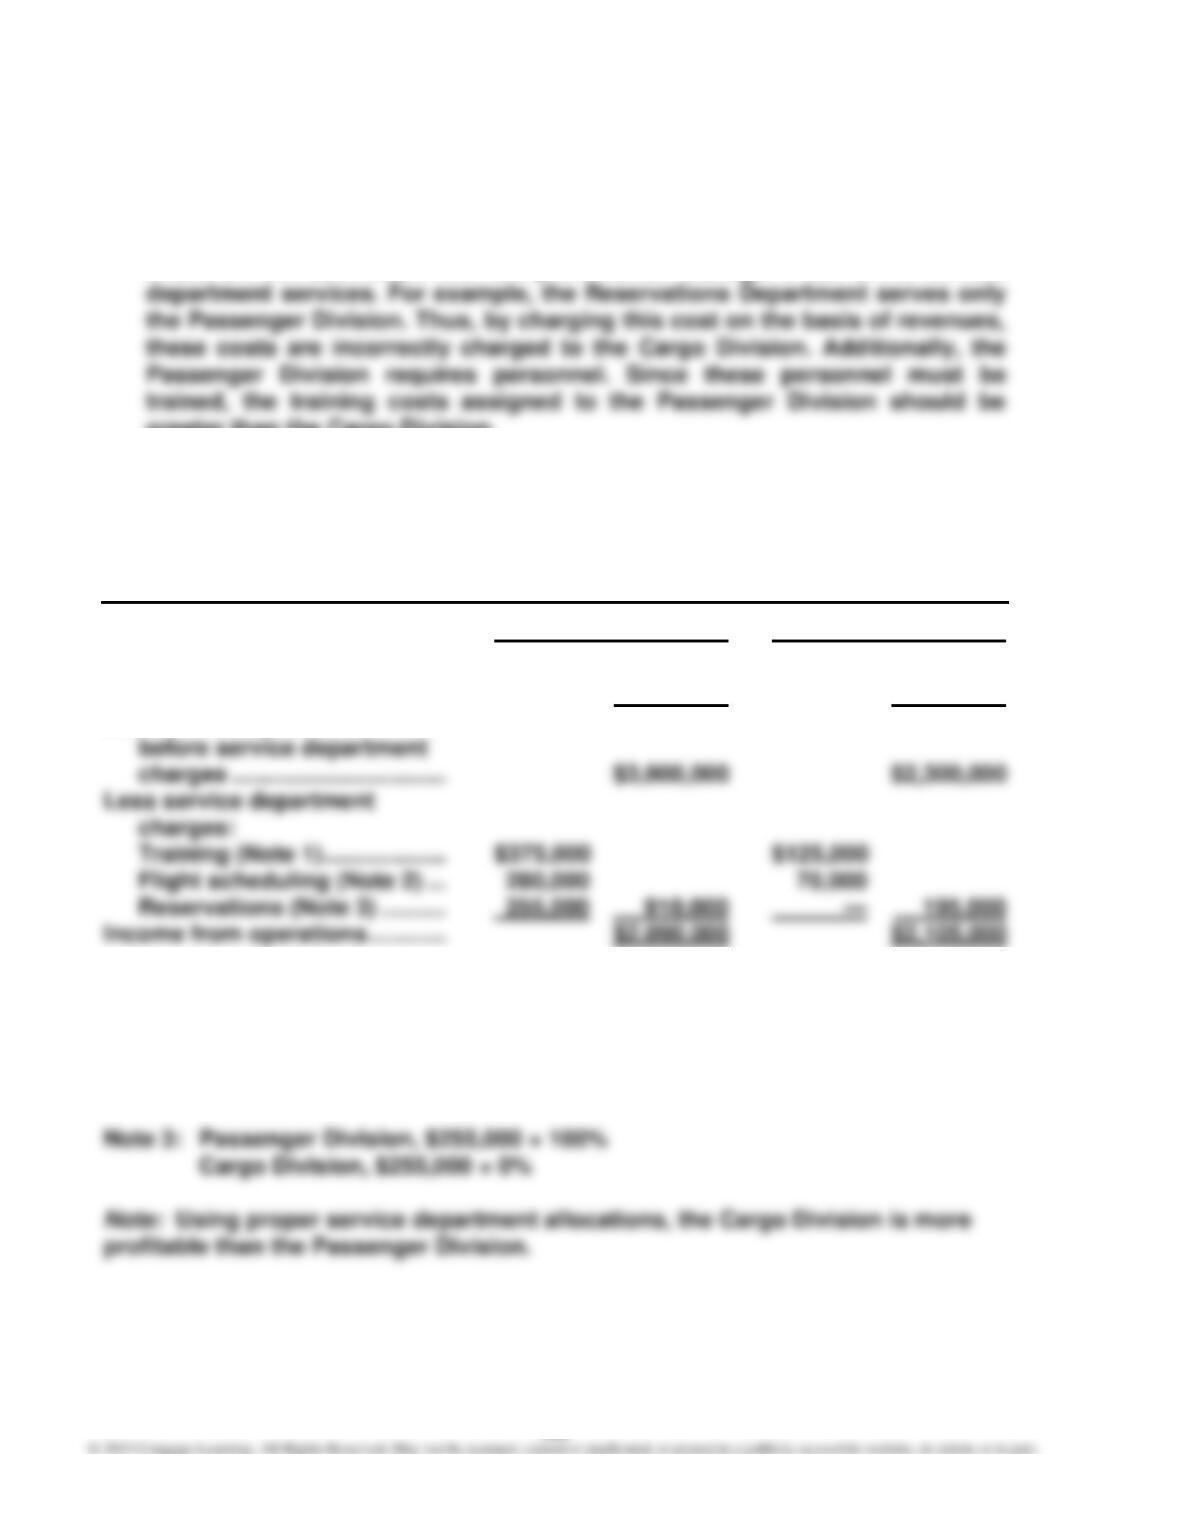
a. The reported income from operations does not accurately measure perfor-
mance because the service department charges are based on revenues. Rev-
enues are not associated with the profit center manager’s use of the service
greater than the Cargo Division.
b.
PANDA AIRLINES INC.
Divisional Income Statements
For the Year Ended April 30, 20Y9
Passenger Division Cargo Division
Revenues ……………………………… $7,500,000 $5,000,000
Operating expenses ……………… 4,500,000 2,700,000
Income from operations
Note 1: Passenger Division, ($500,000 ÷ 800 personnel trained) × 600
Cargo Division, ($500,000 ÷ 800 personnel trained) × 200
Note 2: Passenger Division, ($350,000 ÷ 5,000 flights) × 4,000
Cargo Division, ($350,000 ÷ 5,000 flights) × 1,000
461
E14–9
ON-DEMAND SPORTS CO.
Divisional Income Statements
For the Year Ended November 30, 20Y1
Action Team
Sports Sports
Division Division
Sales ………………………………………………………………… $18,500,000 $30,600,000
Cost of goods sold ……………………………………………. 10,700,000 19,200,000
Income from operations before service
department charges…………………………………….. $ 5,050,000 $ 7,850,000
Less service department charges:
Advertising expense ……………………………………. $ 1,200,000 $ 1,800,000
Transportation expense ………………………………. 259,000 395,900
Accounts receivable collection expense ………. 288,000 112,500
Service Department Charges
Action Team
Sports Sports
Division Division Total
Advertising expense ………………………………… $1,200,000 $1,800,000 $3,000,000
Transportation rate per bill of lading ………… $ 18.50 $ 18.50
Number of bills of lading ………………………….. × 14,000 × 21,400
Transportation expense …………………………... $ 259,000 $ 395,900 $ 654,900
462
E14–10
a. Sporting Goods Division: 18% ($540,000 ÷ $3,000,000)
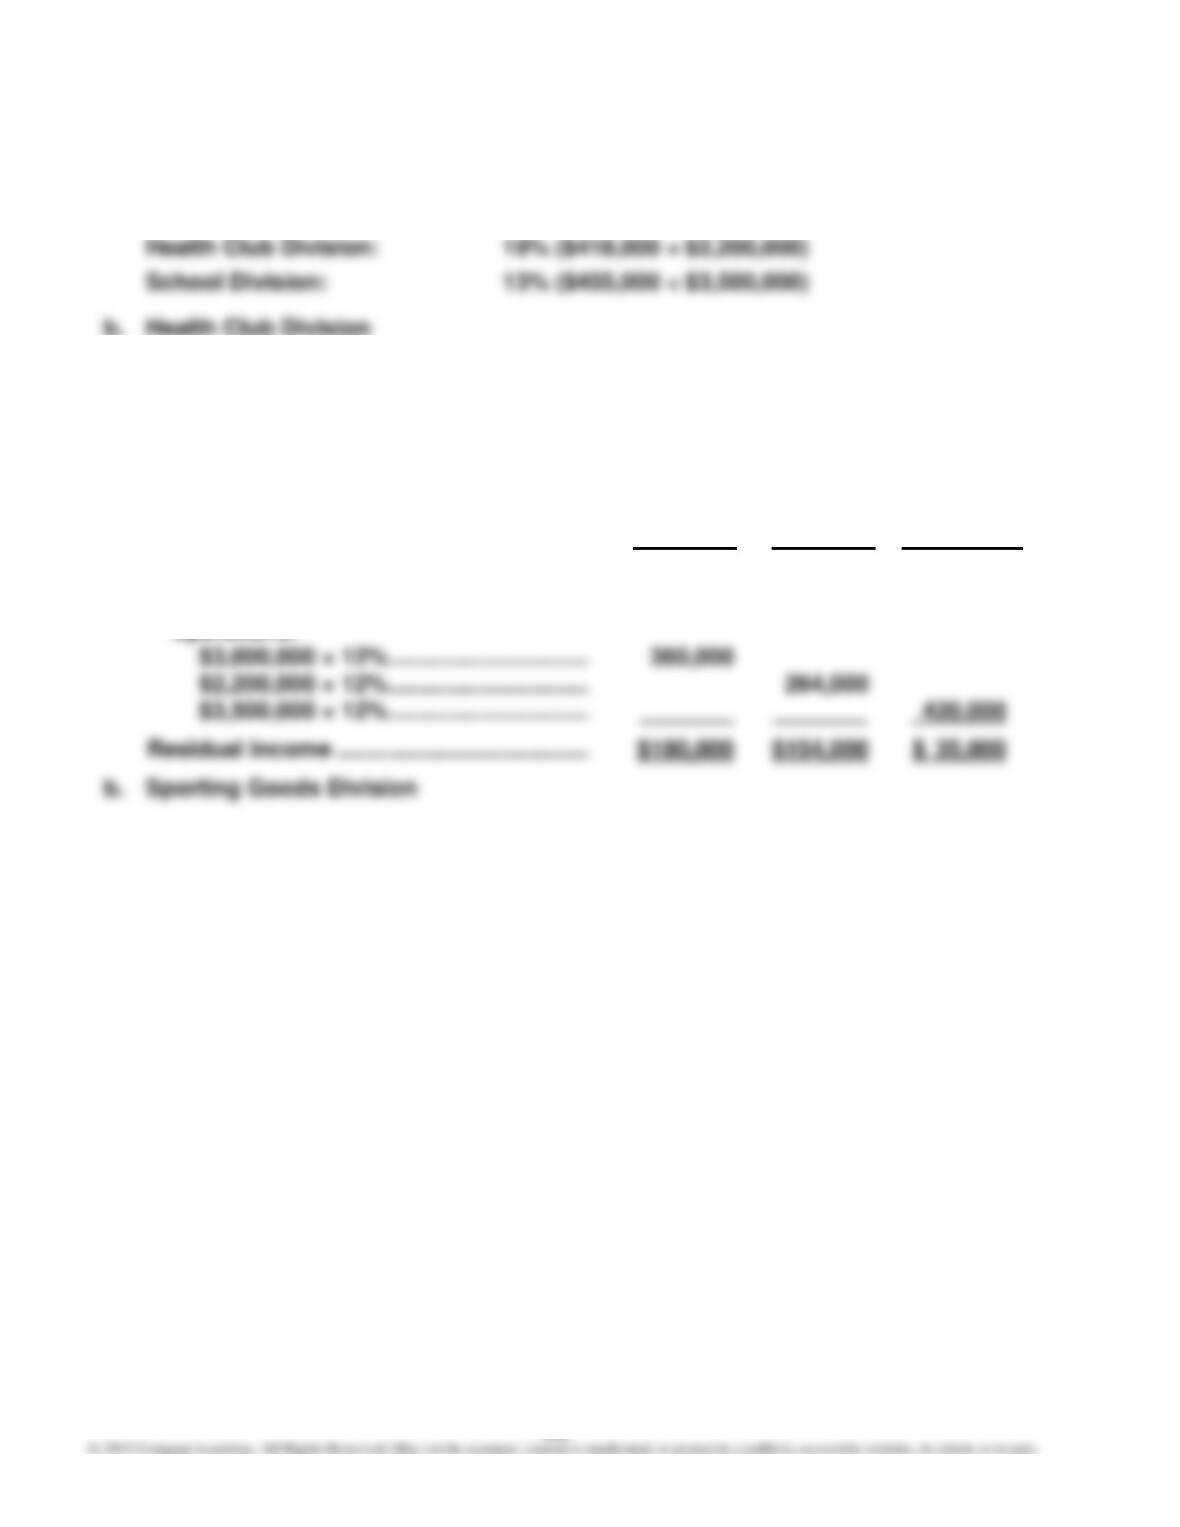
E14–11
a.
Sporting Health
Goods Club School
Division Division Division
Income from operations ……………………… $540,000 $418,000 $455,000
Minimum amount of income from
operations:
463
E14–12
a. 1.50 = 12% ÷ 8%
E14–13
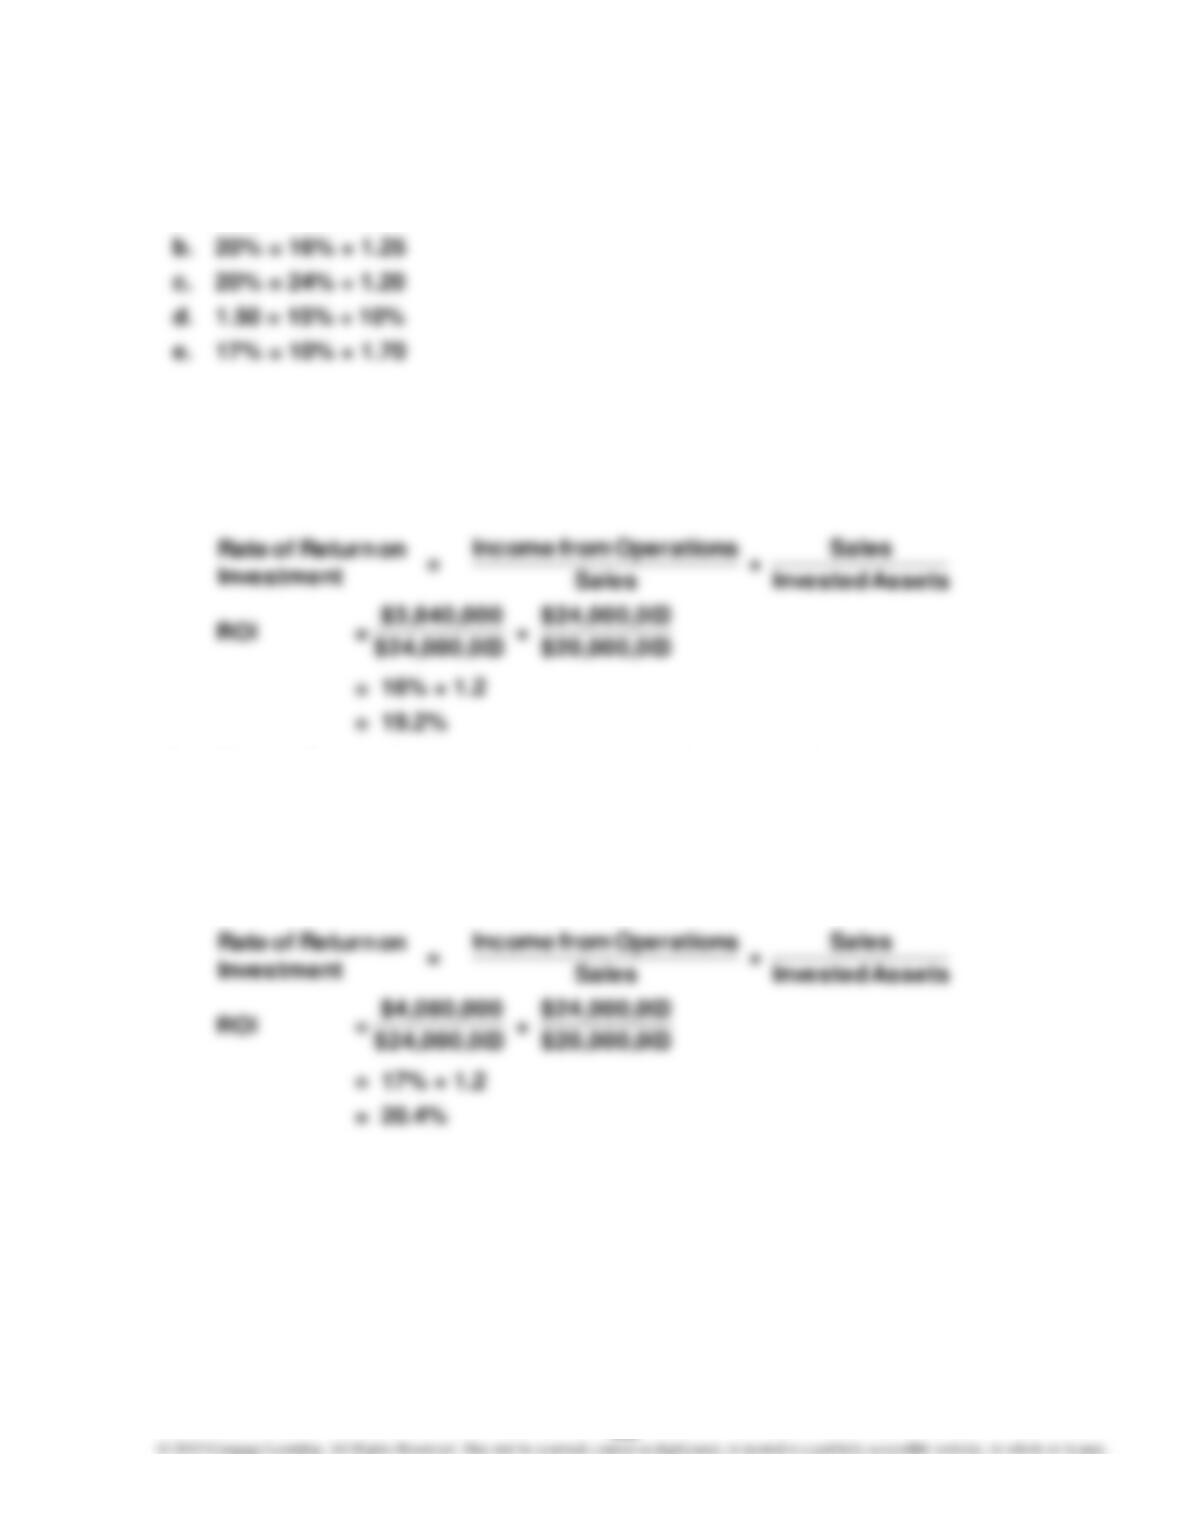
a.
Investment
on Return of Rate
= Profit Margin × Investment Turnover
Investment
on Return of Rate
b. The profit margin would increase from 16% to 17%, the investment turnover
would remain unchanged, and the rate of return on investment would in-
crease from 19.2% to 20.4%, as shown below.
Investment
on Return of Rate
= Profit Margin × Investment Turnover
Investment
on Return of Rate
464
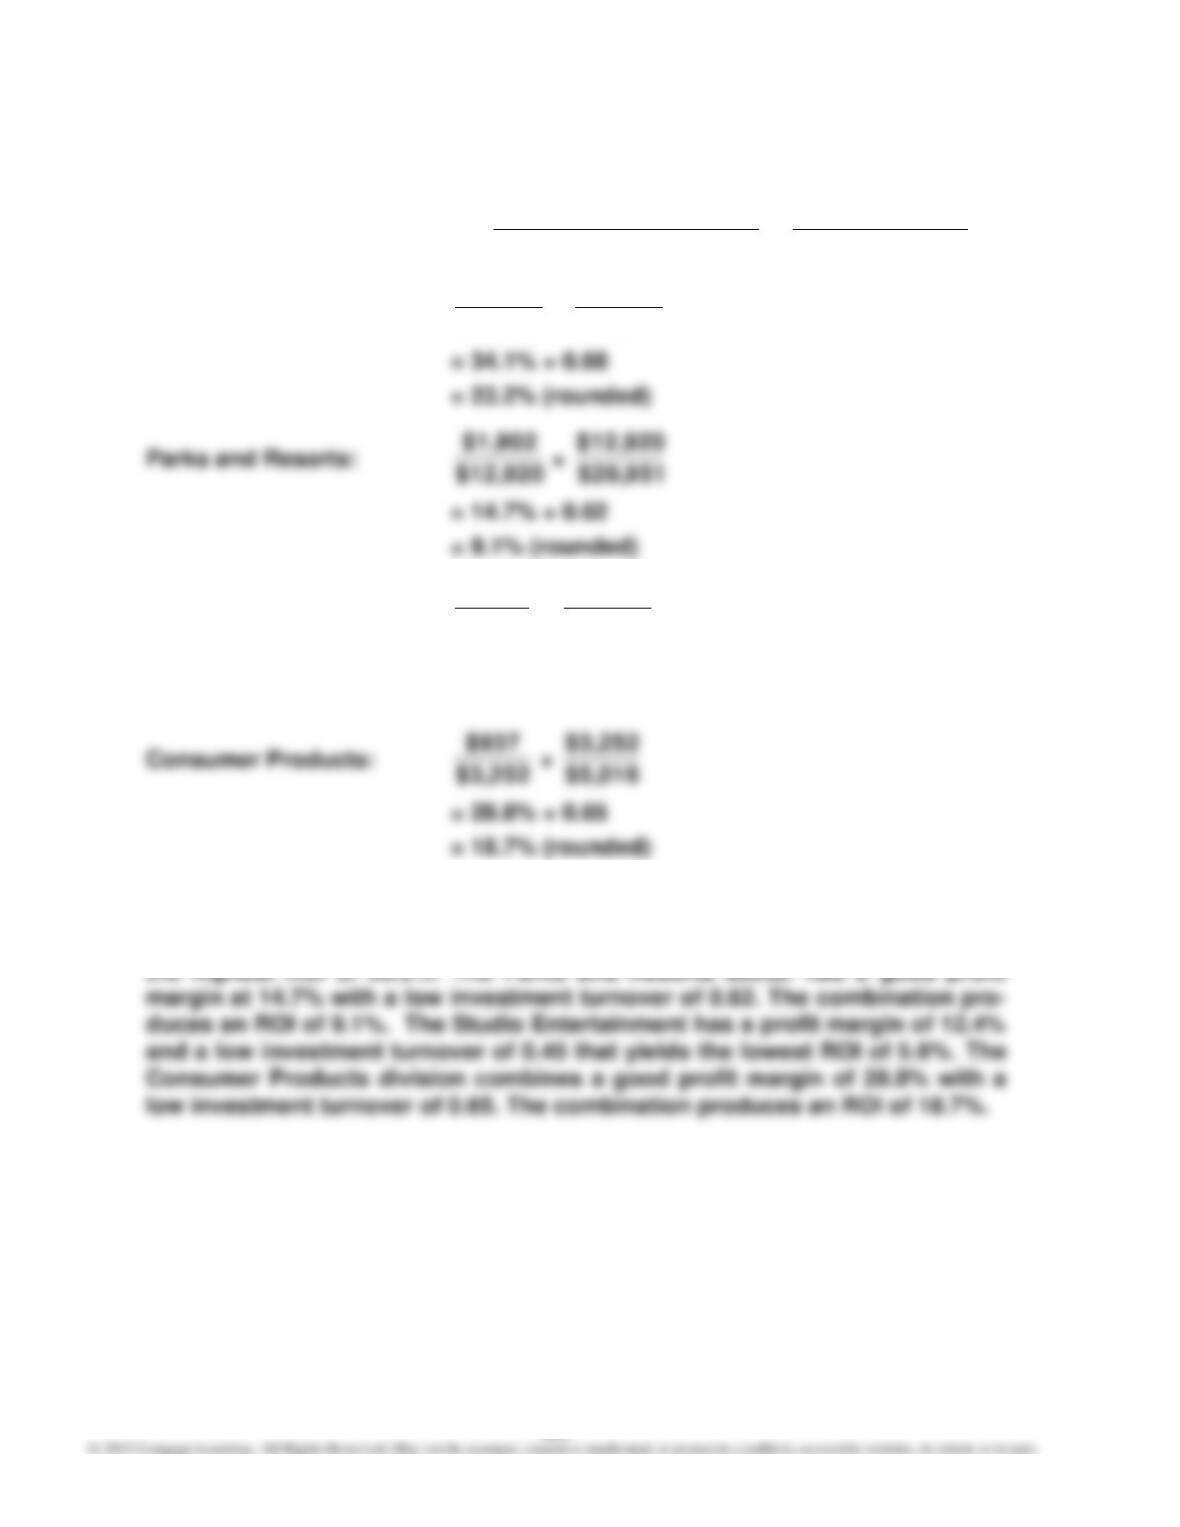
E14–14
a. Rate of Return on Investment =
Revenues
Operations from Income
×
AssetsInvested
Revenues
Media Networks:
$19,436
$6,619
×
$28,660
$19,436
$12,920
$1,902
$12,920
Studio Entertainment:
$5,825
$722
×
$12,928
$5,825
= 12.4% × 0.45
= 5.6% (rounded)
$3,252
$5,016
b. The four sectors are different from each other. Media Networks combines a
good profit margin of 34.1% with a low investment turnover of 0.68 to yield
E14–15
a. 16% ($400,000 ÷ $2,500,000)
b. $300,000 ($2,500,000 × 12%)
c. $100,000 ($400,000 – $300,000)
466
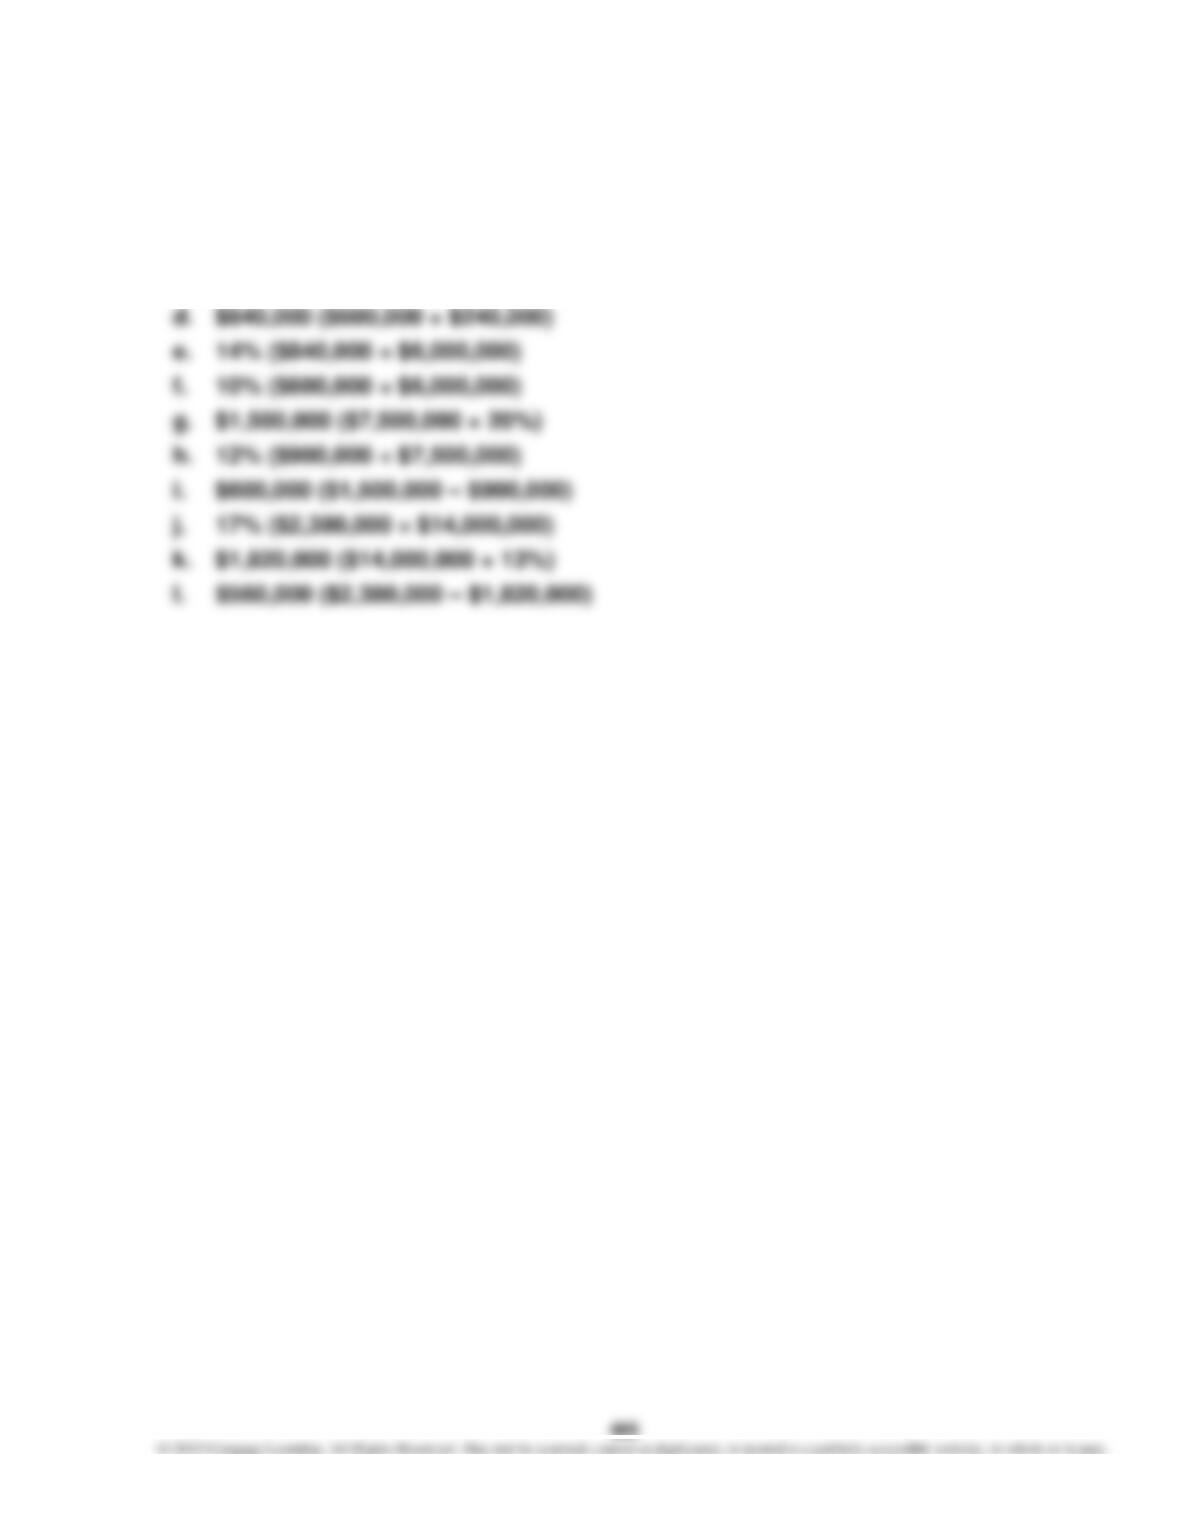
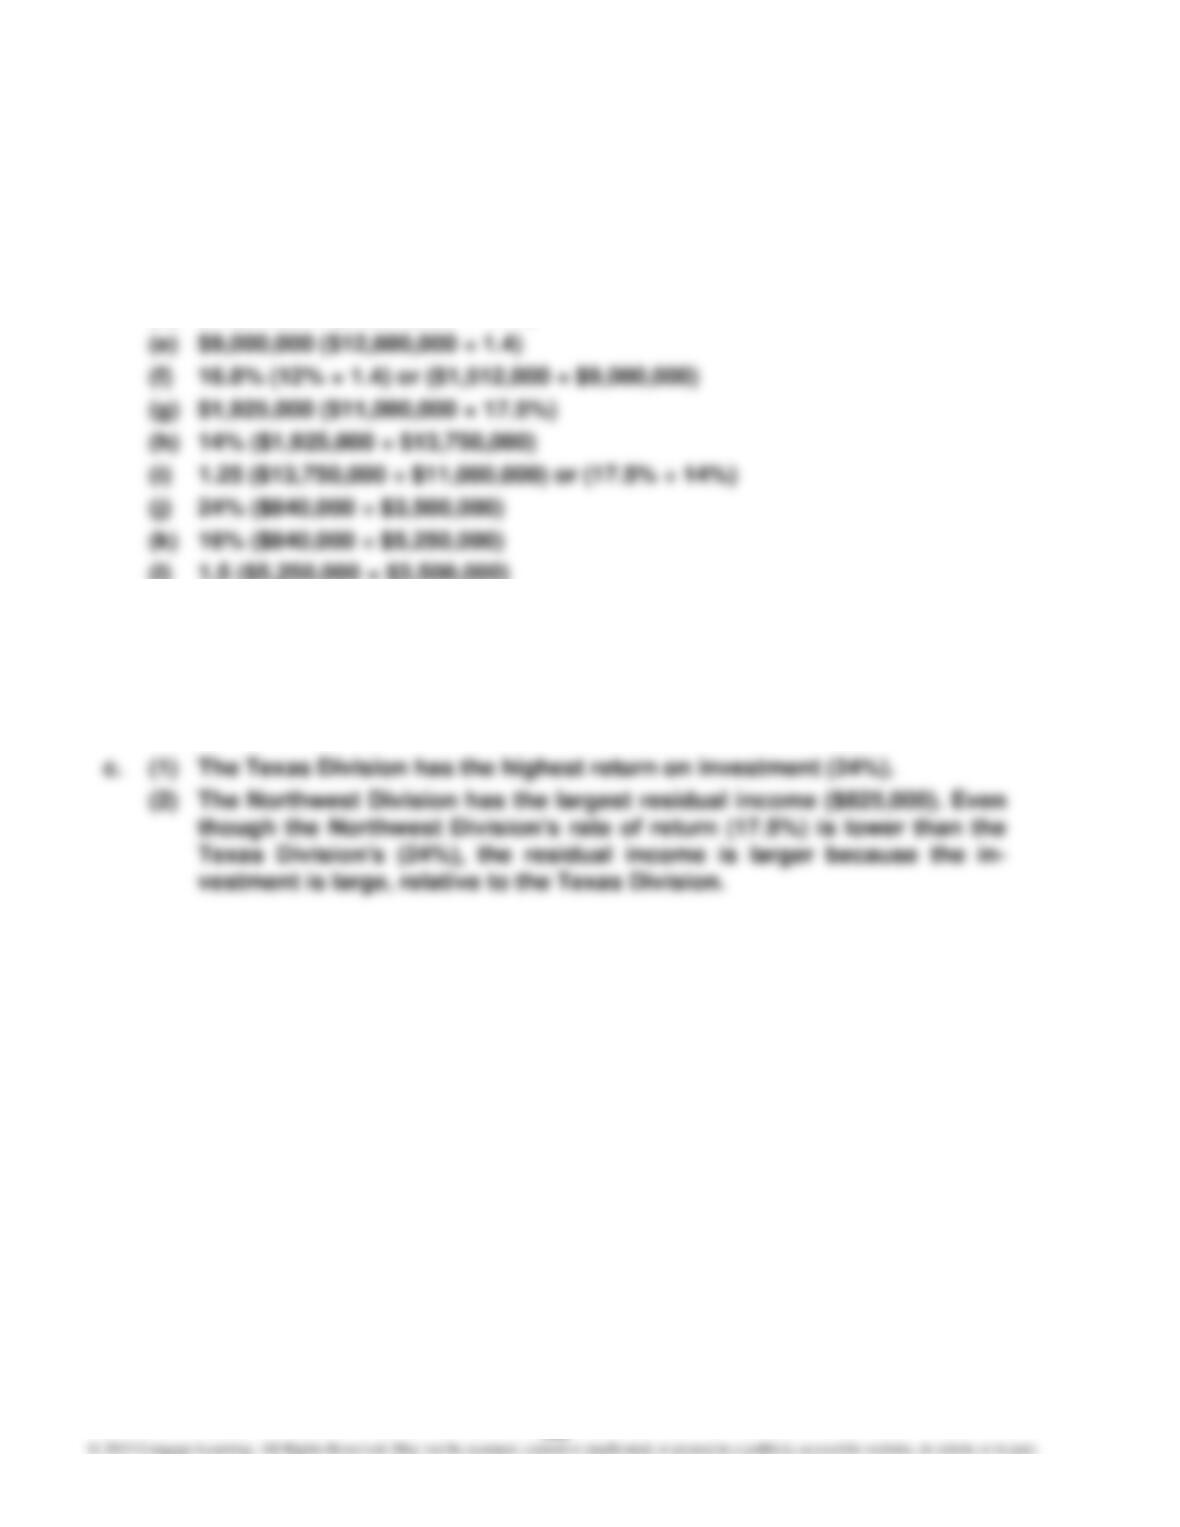
E14–16
a. (a) $1,200,000 ($6,000,000 × 20%)
(b) $7,500,000 ($1,200,000 ÷ 16%)
(c) 0.8 (16% ÷ 20%) or ($6,000,000 ÷ $7,500,000)
(d) $12,600,000 ($1,512,000 ÷ 12%)
(l) 1.5 ($5,250,000 ÷ $3,500,000)
b. California Division: $450,000 [$1,200,000 – ($7,500,000 × 10%)]
Midwest Division: $612,000 [$1,512,000 – ($9,000,000 × 10%)]
Northwest Division: $825,000 [$1,925,000 – ($11,000,000 × 10%)]
Texas Division: $490,000 [$840,000 – ($3,500,000 × 10%)]
467
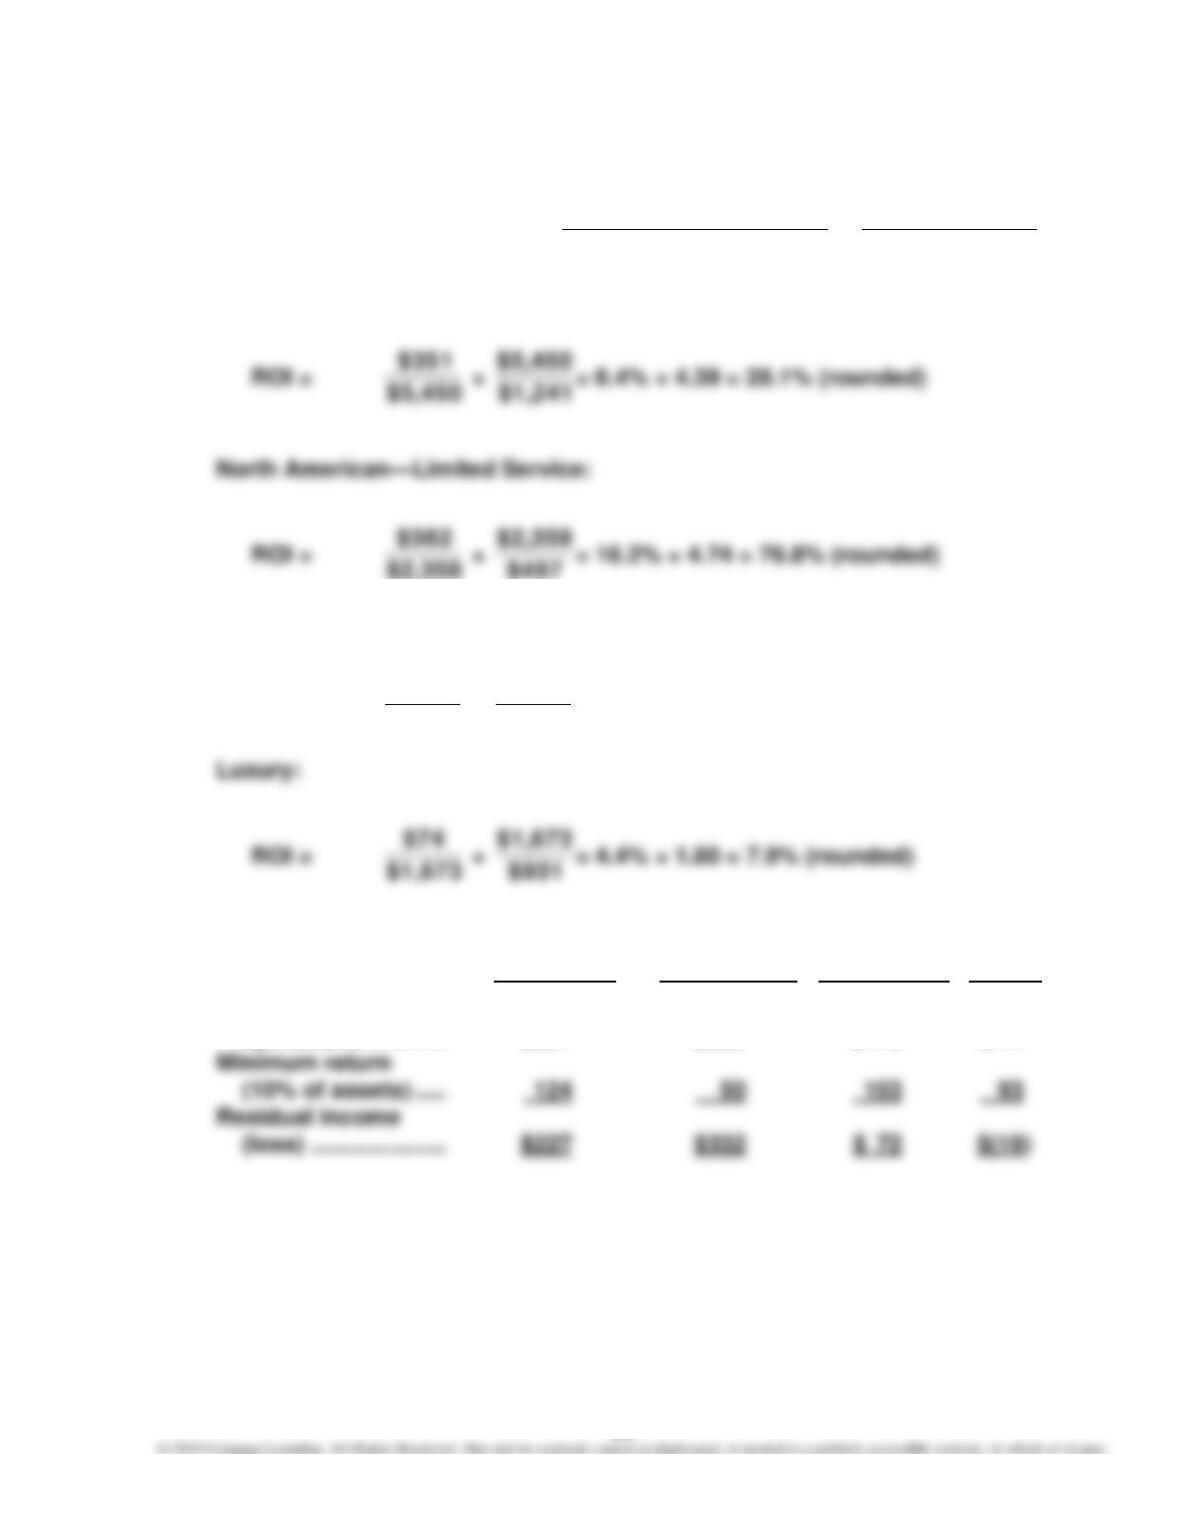
E14–17
a. Rate of Return on Investment =
Revenues
Operations from Income
×
AssetsInvested
Revenues
North American—Full Service:
$5,450
$2,358
$382
International:
ROI =
$1,278
$175
×
$1,026
$1,278
= 13.7% × 1.25 = 17.1% (rounded)
$1,673
N. American— N. American—
b. Full Service Limited Serv. International Luxury
Income from
operations …………. $351 $382 $175 $ 74
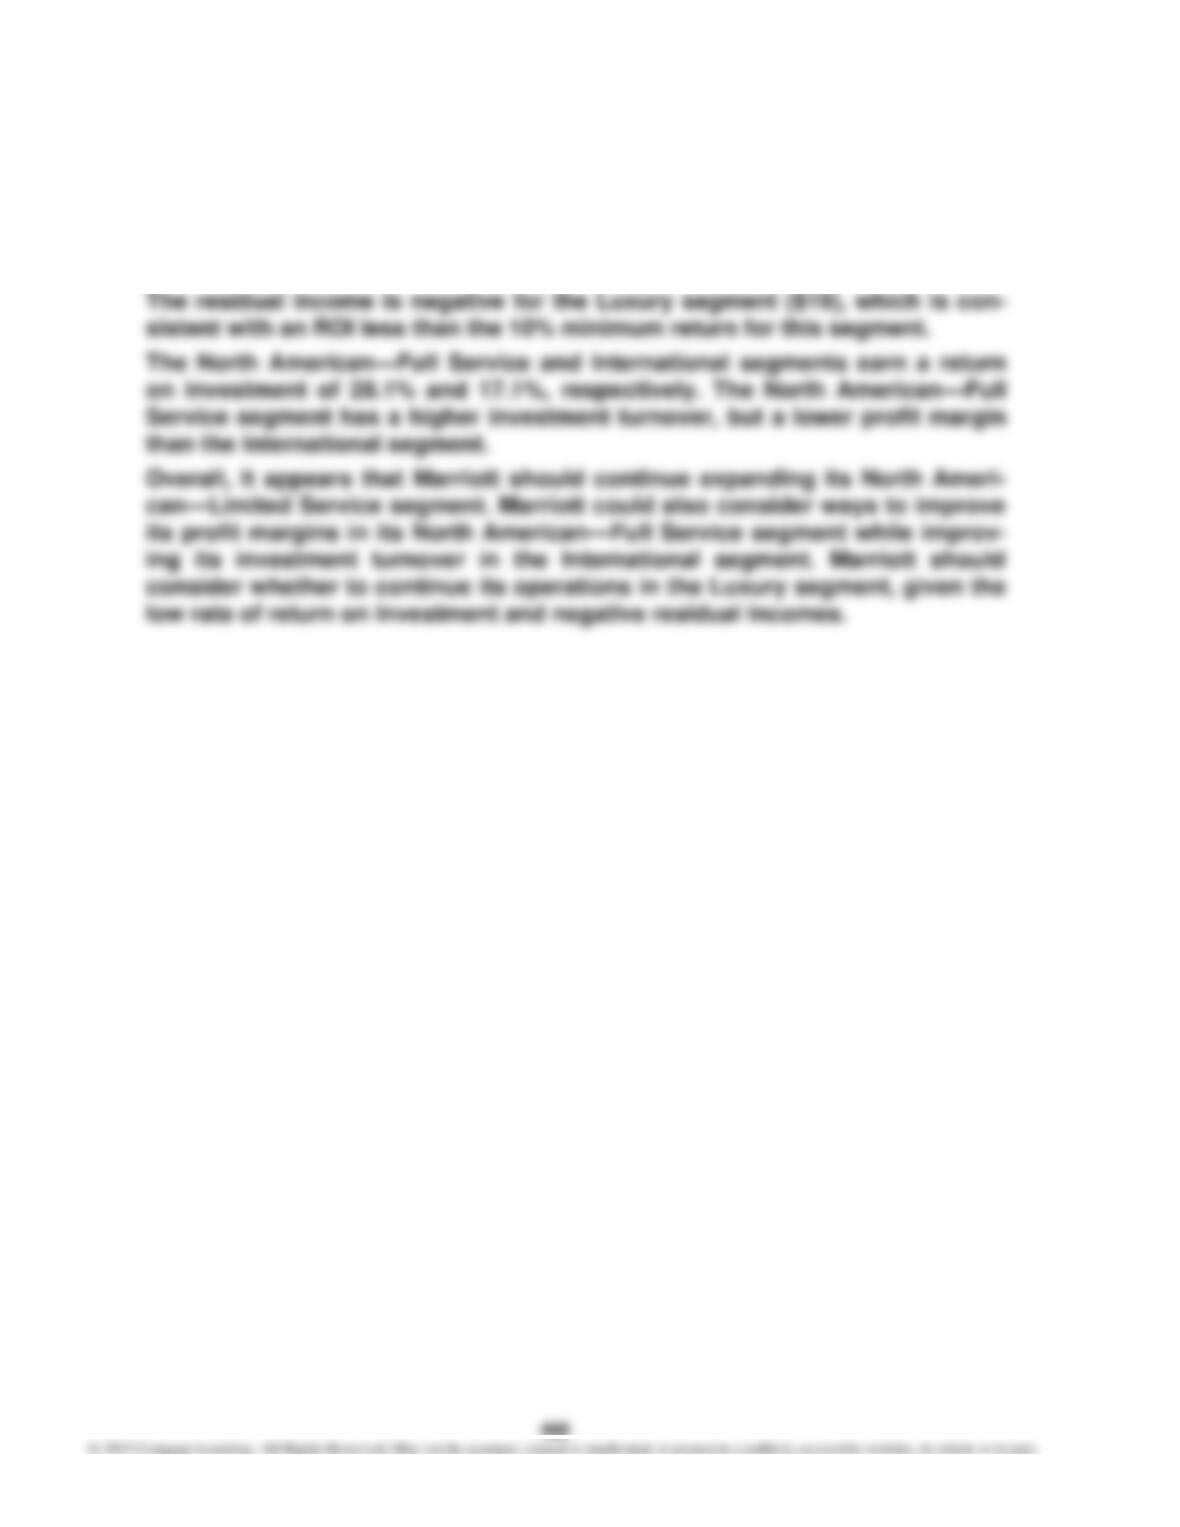
E14–17, Concluded
c. The North American—Limited Service segment has the highest return on in–
vestment of 76.8% due to a strong investment turnover of 4.74, which may be a
result of more franchise operations in this segment.
469
E14–18
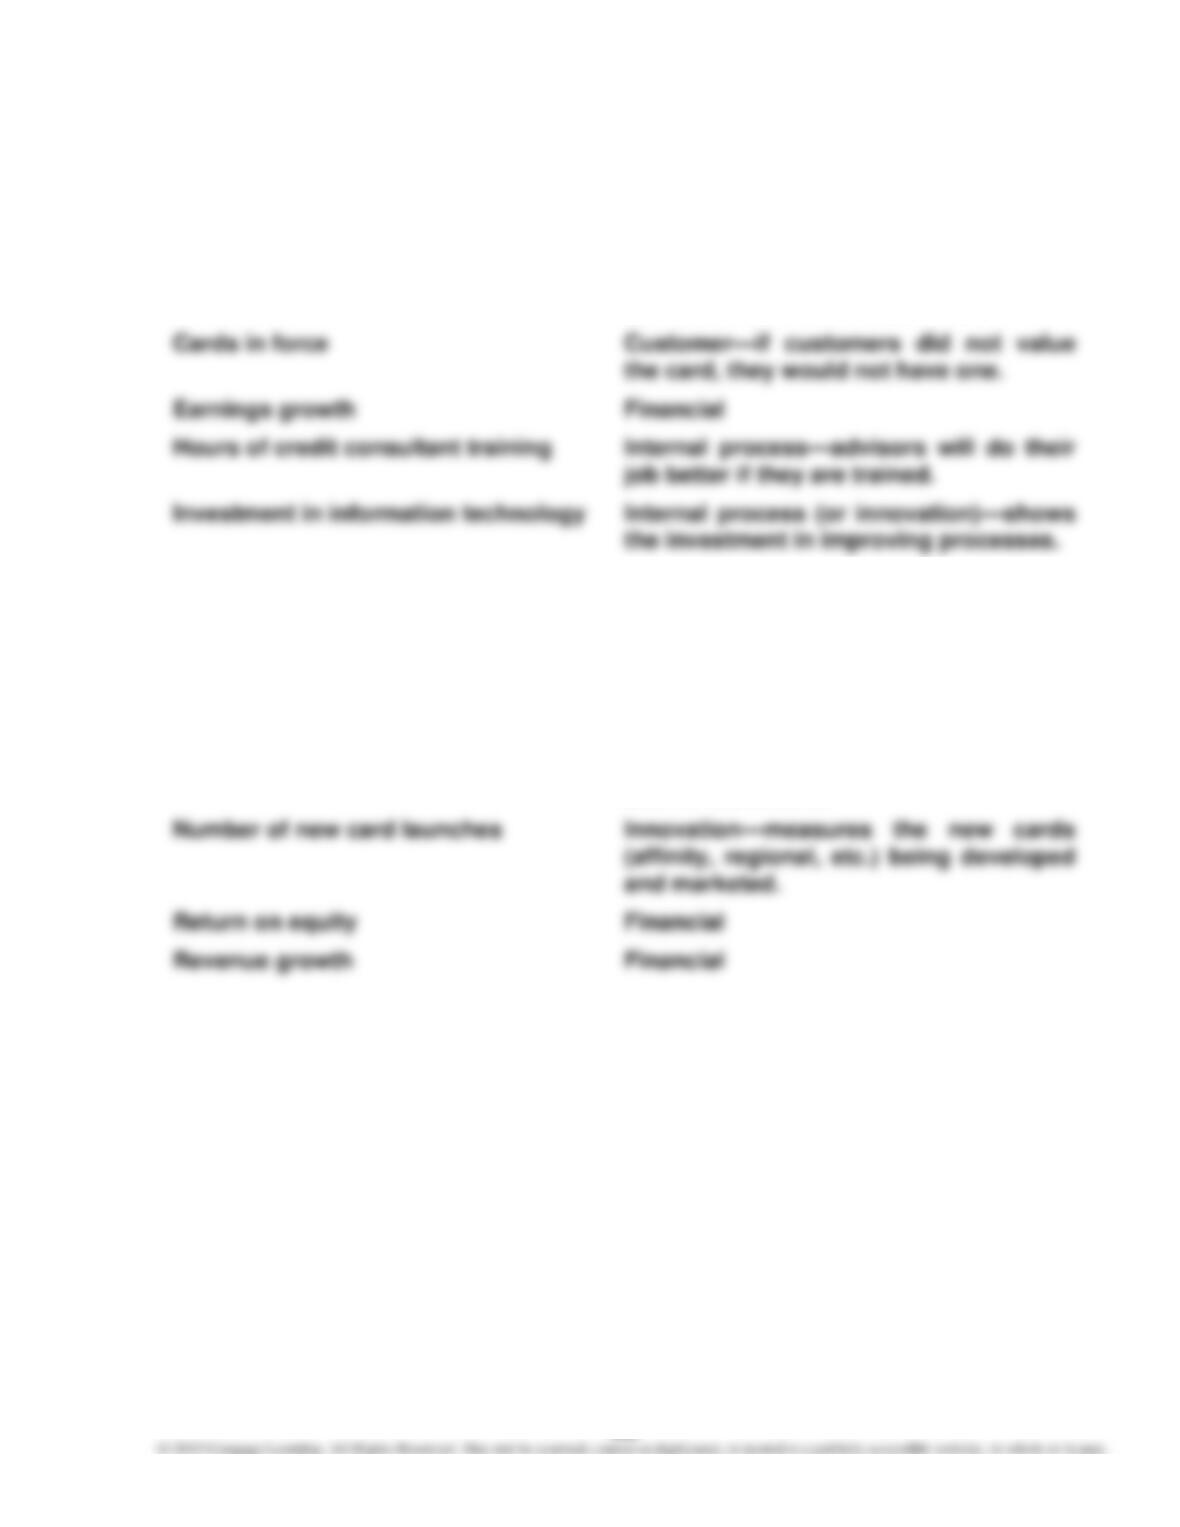
Although there is some judgment in classifying each of these measures, the fol-
lowing represents our assessment with explanations:
Average cardmember spending Customer—demonstrates the useful-
ness of the card to the customer.
Number of Internet features Internal process (or innovation)—shows
new process investments in a new
channel.
Number of merchant signings Customer—the larger the number of
merchants that honor the card, the more
valuable it is to cardholders.
Number of card choices Customer—more choices are more valu-
able to customers.
470
E14–19
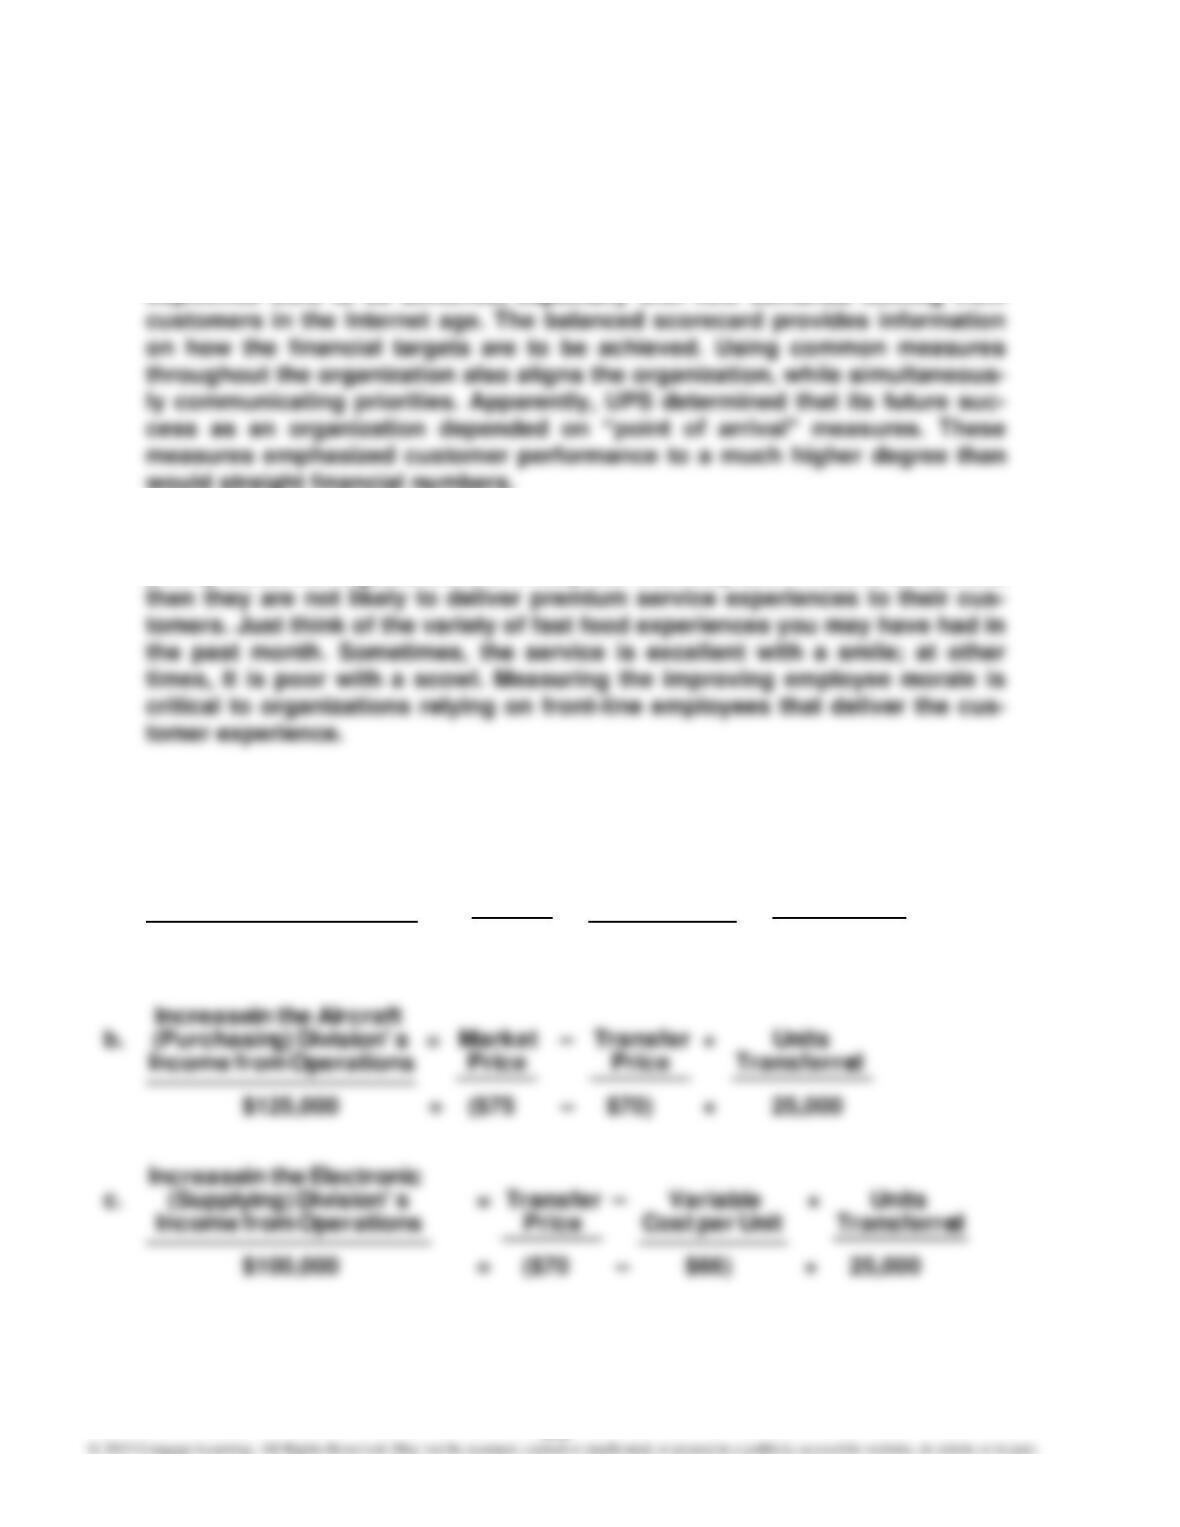
a. UPS wanted a performance measurement system that would focus more on
the underlying drivers, or levers, of financial success. It believed that focus-
ing on the financial numbers by themselves would not reveal how financial
objectives were to be achieved, especially with new demands coming from
would straight financial numbers.
b. The employee sentiment number is common in service businesses. The
employees are the face of the company to the customer. If employees feel
poorly about the organization, or if they feel that they don’t make a difference,
E14–20
a.
Operations from
Income sing‘Manufactur
Retina in Increase
=
Price
Market
–
Unit per Cost
Variable
×
dTransferre
Units
$225,000 = ($75 – $66) × 25,000
Price
Market
dTransferre
Units