14
Business Unit Performance Measurement
Solutions to Review Questions
14–1.
14–2.
The basic computations are the same. Because divisional income is not reported, the
firm is free to specify certain accounting policies that might not be consistent with
GAAP. In addition, depending on the decision authority of the manager, some accounts
might be ignored or might be computed using firm-wide averages.
14–3.
ROI = (After-tax income ÷ Divisional assets).
14–4.
ROI-type measures adjust for size. In addition, ROI measures adjust for asset usage.
14–5.
14–6.
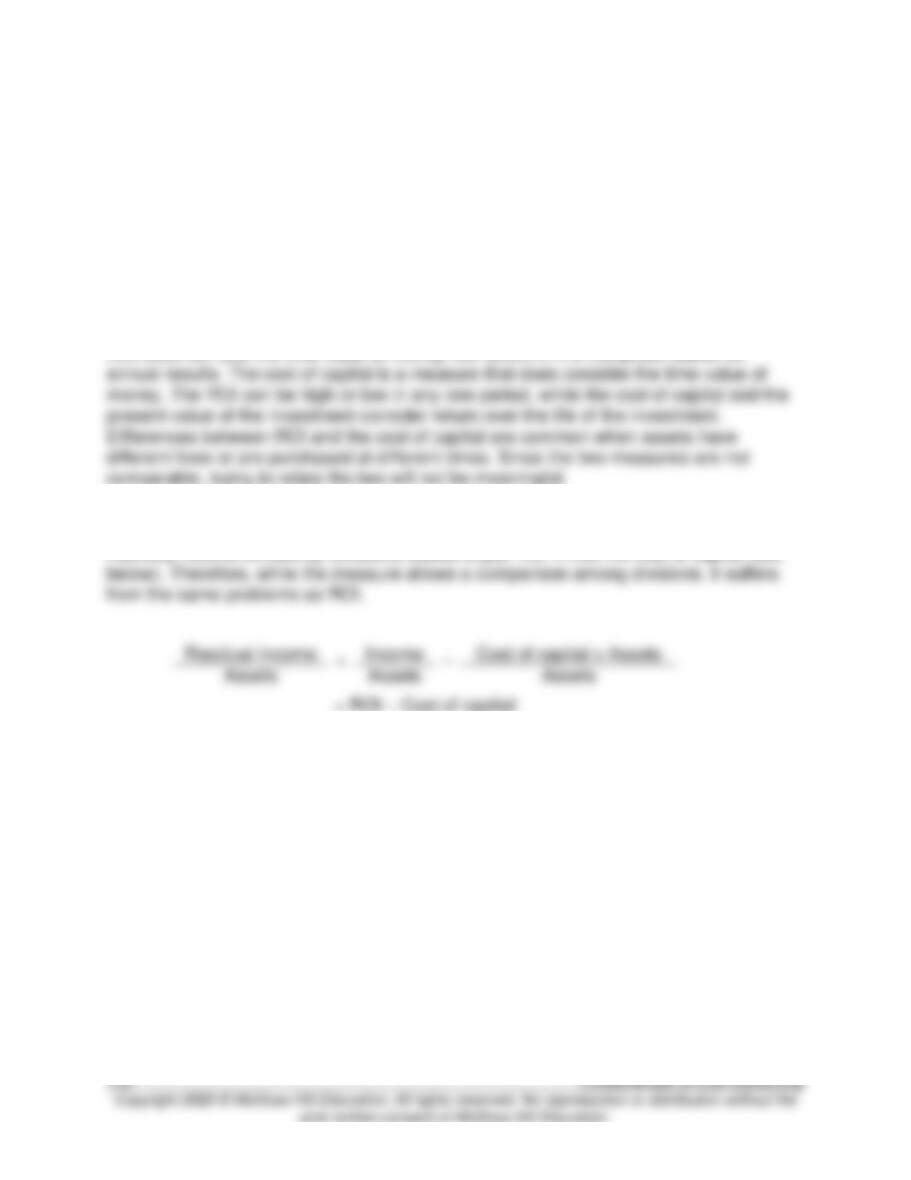
ROI is income divided by assets; residual income is income less a capital charge equal
to the cost of capital multiplied by the investment. Residual income is a dollar amount,
not a ratio. It subtracts a capital charge, equal to the cost of capital multiplied by the
assets used.
14-7.
14–8.
14–9.
The danger is that you will ignore the interdependence of the business units. No
incentive is given to business unit managers to make them consider the effect of their
actions on other units.
Solutions to Critical Analysis and Discussion Questions
14–10.
14–11.
By maximizing their own divisional income, managers might refuse to sell products to
each other, or might not share information about customers. This statement ignores
interdependencies among business units.
14–12.
Two problems usually arise here:
14–13.
There are two common situations. First, managers might choose not to invest in
worthwhile projects because the ROI is less than the target, even though the net
present value is positive. Second, decisions made based on ROI depend on the current
level of ROI. If the ROI of a project is greater than the ROI of the unit without the
project, the project will increase ROI, regardless of how low it is.
14–14.
Residual income measures depend upon the rate chosen for charging a division for its
investments. Different rates can yield different residual income rankings. In addition,
residual income measures will tend to favor large divisions over smaller ones since the
measures are based on an absolute dollar value. ROI uses information easily available
from the accounting system.
14–15.
14–16.
• Residual Income (RI) is defined as follows:
Investment center operating profits—(Capital charge × Investment center assets)
The capital charge is the minimum acceptable rate of return, which will likely be
greater than the company’s cost of capital.
• Economic value added (EVA) is defined as follows:
After-tax (adjusted) operating profits–(Cost of capital × Capital employed (adjusted))
• Comparison:
Investment center operating profits (in the RI formula) can be equated to after-tax
operating profits (in the EVA formula). Investment center assets can be equated to
capital employed. However, the capital charge is not the same as the cost of capital.
The capital charge is the company’s minimum acceptable rate of return, and the cost
of capital is the weighted average cost of the company’s debt and equity. While it is
possible that these percentages might be the same for a given company, the terms
clearly have different meanings.
More important, EVA calculations “adjust” the income and capital numbers from the
accounting, or book, numbers to reflect basic differences between economic results
and accounting measurements.
Therefore, although the two methods—RI and EVA—have many similarities, they
are not typically identical.
14–17.
14–18.
If the division can rent and the rent does not have to be capitalized for inclusion in the
investment base, the residual income will increase so long as the income from the asset
exceeds the lease payment. If EVA is used, and if these types of transactions are
common, an adjustment will be made to income and assets to treat the leases as if they
are capital leases, even if the company treats the leases as operating leases for
financial reporting purposes.
14–19.
14–20.
14–21.
EVA uses accounting income, so any issue associated with a short-term focus will be
present with EVA. The difference is that some of the accounting treatments that make
the short-term focus “worse,” such as accounting for R&D, are reduced with EVA.
Solutions to Exercises
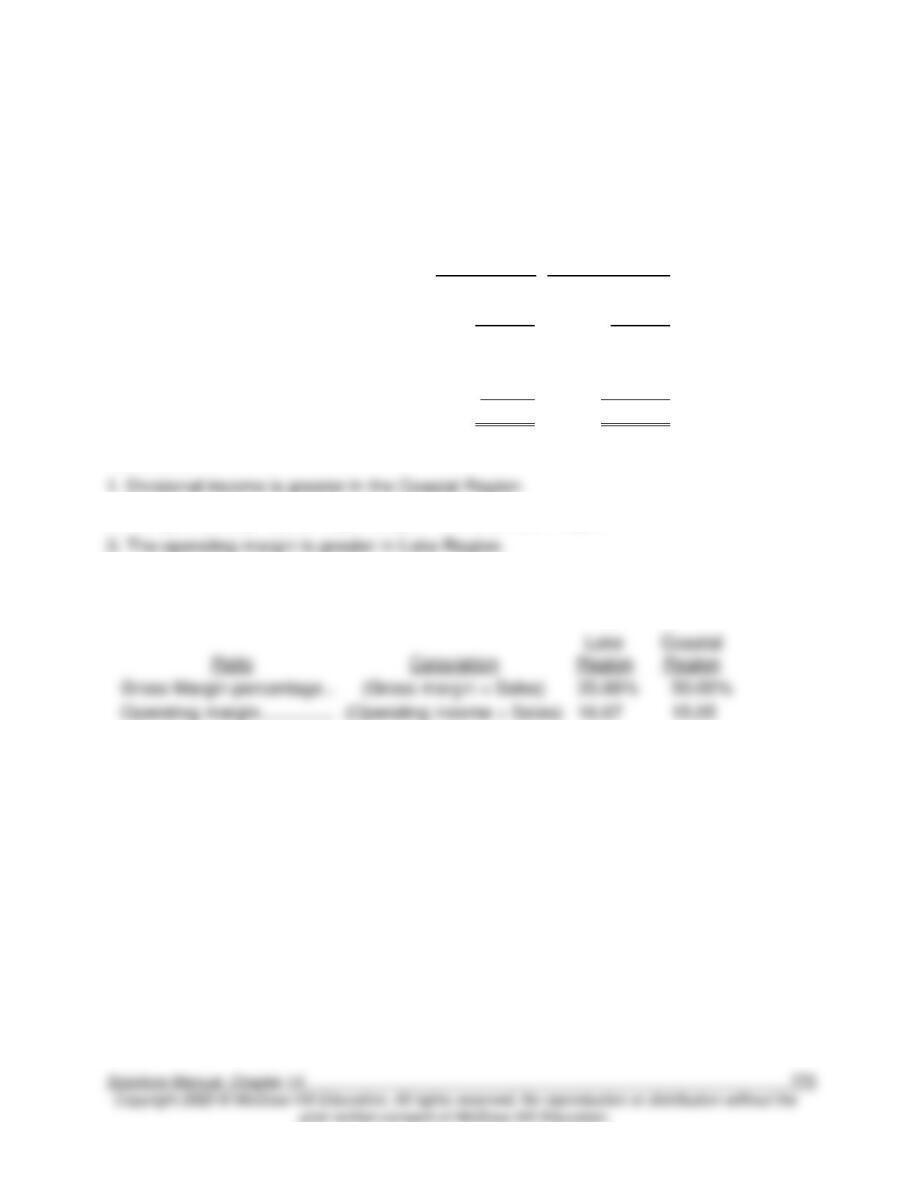
14–22. (10 min.) Compute Divisional Income: Arlington Clothing, Inc.
Operating Income
(thousands)
Lake Region
Coastal Region
Sales revenue ……………………….
$4,080.0
$12,920.0
Cost of sales …………………………
2,616.3
6,460.0
Gross margin ……………………..
$ 1,463.7
$6,460.0
Allocated corporate overhead ….
244.8
775.2
Other general and administration
538.9
3,740.0
Operating income ………………….
$ 680.0
$1,944.8
Comments:
2. The gross margin percentage is higher in the Coastal Region.
4. Corporate overhead appears to be allocated on the basis of revenues (6% in both
divisions).
Gross Margin percentage ..
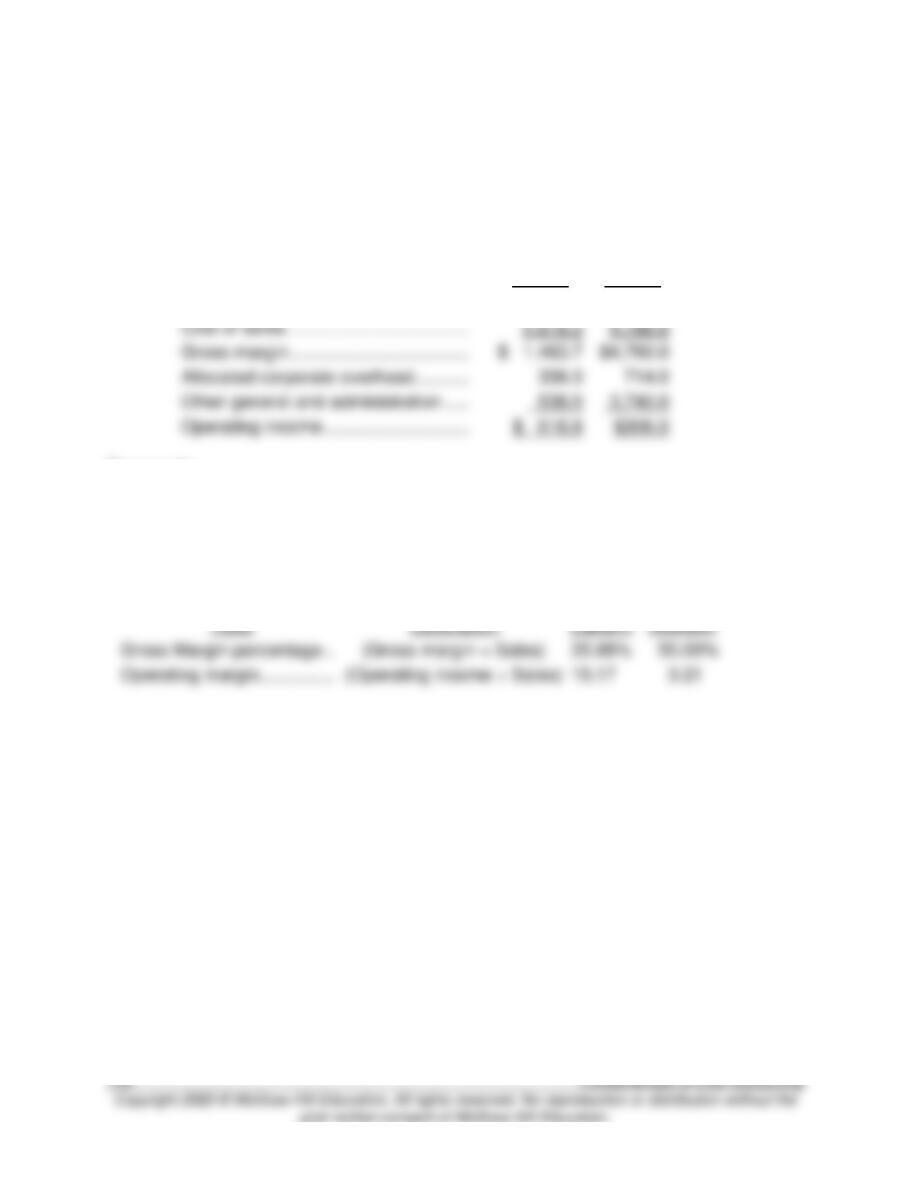
14–23. (10 min.) Compute Divisional Income: Arlington Clothing, Inc.
Operating Income
(thousands)
Lake
Region
Coastal
Region
Sales revenue …………………………….
$4,080.0
$9,520.0
Other general and administration …..
Comments:
In addition to the comments for Exercise 14-22, nothing changed in Lake Region.
However, because sales fell in Coastal Region, the reported divisional income for the
Lake Region went down. Corporate overhead is allocated on the basis of relative
revenues, not absolute revenues. Thus, the performance of the Lake Region is affected
by the results in the Coastal Region.
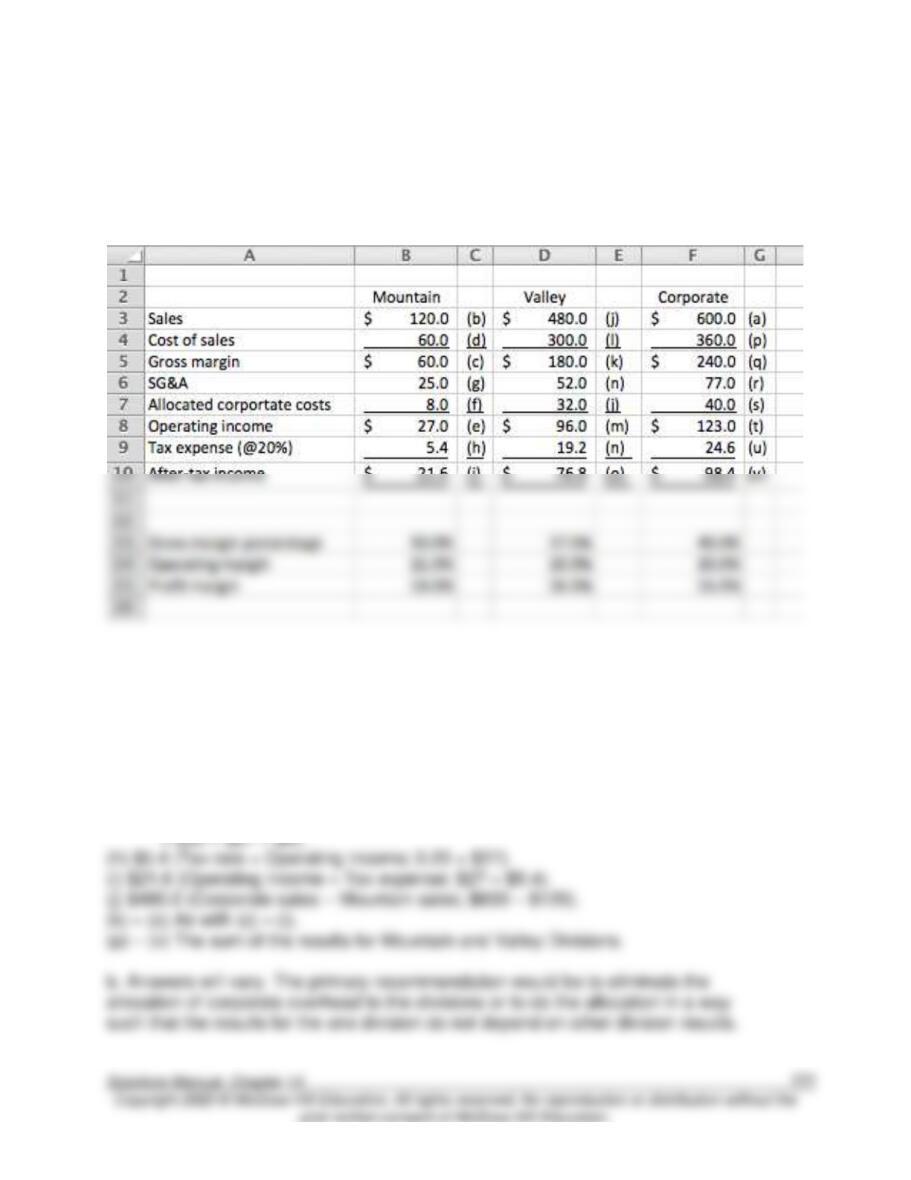
14–24. (10 min.) Compute Divisional Income: Incomplete Information and Financial
Ratios: Sneaky Pete’s.
a. There are many approaches to solving this problem (although it is likely that the first
step will be to calculate total corporate sales). One approach follows.
(a) $600.0 (= After-tax income ÷ Profit margin; $98.4 ÷ .164).
(b) $120.0 Corporate costs are allocated on relative sales. Mountain was
allocated 20% (= $8 ÷ $40) of the costs, so sales must be 20% of corporate
sales. ($120 = 0.20 × $600.0).
(c) $60.0 (= Sales × Gross margin percentage; $120 × 0.50).
(d) $60.0 (= Sales – Gross margin; $120 – $60).
(e) $27.0 (= Sales × Operating margin; $120 × 0.225).
(f) Given.
(g) $25.0 (= Gross margin – Operating income – Allocated corporate costs;
14–25. (10 min.) Compute RI and ROI: All-States Bank.
a.
$225,000,000
= 12.5% (ROI)
$1,800,000,000
b.
$225,000,000 – (.04 $1,800,000,000)
=
$153,000,000 (Residual Income)
14–26. (25 min.) ROI Versus RI.
Annual income = $700,000 – ($2,520,000 ÷ 4 years) = $70,000
1
2
1,890,000
4
Investment
(a)
ROI
(b)
Residual Income
14–27. (10 min.) Compare Alternative Measures of Division Performance:
Solomons Company.
a. Using return on investment measures:
*North:
$6,000,000
= 20%
$30,000,000
South:
$40,000,000
= 12.5%
$320,000,000
14–28. (10 min.) Comparing Business Units Using ROI: BMI.
East
West
Income
Investment
$200
$2,000
$390
$3,000
= 10%
= 13%
Based on ROI, West performed better than East.
14–29. (10 min.) Comparing Business Units Using Residual Income: BMI.
East
West
Income
$200
$390
14–30. (10 min.) Comparing Business Units Using Economic Value Added: BMI.
In computing EVAs, we need to adjust both income and investment (assets). The
income adjustment is for R&D and the investment adjustment is for R&D and
current liabilities. Because R&D is assumed to benefit two periods, we only
expense 50% of R&D (it is assumed spent at the beginning of the year) each
year.
East
Adjusted profit ………….
Adjusted investment …
Adjusted profit ………….
Adjusted investment …
14–31. (10 min.) Comparing Business Units Using ROI: UEI.
Consumer
Commercial
Income
Investment
$3,850
$27,500
$3,885
$27,750
= 14%
= 14%
Based on ROI, the two divisions performed equally well.
14–32. (10 min.) Comparing Business Units Using Residual Income: UEI.
Consumer
Commercial
14–33. (10 min.) Comparing Business Units Using Economic Value Added: UEI.
In computing EVAs, we need to adjust both income and investment (assets). The
income adjustment is for R&D and the investment adjustment is for R&D and
current liabilities. Because R&D is assumed to benefit five periods, we only
expense 10% of R&D (it is assumed spent uniformly over the year) for the first
year. (The current divisional income reflects the full R&D expenditure as an
expense.)
Consumer
Adjusted profit………….
Adjusted investment …
Adjusted profit………….
Adjusted investment …
14–34. (10 min.) Impact of New Asset on Performance Measures: Patio
Enterprises.
a. ROI before:
$2,340,000
= 12%
$19,500,000
b. ROI after:
$2,340,000 + $277,500a
= 11.4%
$19,500,000 + $3,375,000
a $277,500 = $840,000 – ($3,375,000 ÷ 6 years)
14–35. (10 min.) Impact Of Leasing On Performance Measures: Patio
Enterprises.
= 12.5%
14–36. (15 min.) Residual Income Measures And New Project Consideration:
Patio Enterprises.
a.
$2,340,000 – (.09 $19,500,000)
=
$585,000
b.
$585,000 + $840,000 – ($3,375,000 ÷ 6 years)
– .09 ($3,375,000)
=
$558,750
or
$2,340,000 + $840,000 – ($3,375,000 ÷ 6 years)
– .09 ($19,500,000 + $3,375,000)
14–37. (20 min.) Impact of an Asset Disposal on Performance Measures: Harbor
Division.
= 14%
$92,400 – $5,400
= 14.5%
$660,000 – $60,000
14–38. (20 min.) Impact of an Asset Disposal on Performance Measures: Harbor
Division.
a. ROI before disposal:
$92,400
= 15.4%
$600,000
b. ROI after disposal:
$92,400 – $5,400
= 14.5%
$600,000
c. Residual income before disposal:
$92,400 – 0.12 × $600,000
= $20,400
d. Residual income after disposal:
($92,400 – $5,400) – 0.12 × ($600,000)
= $15,000
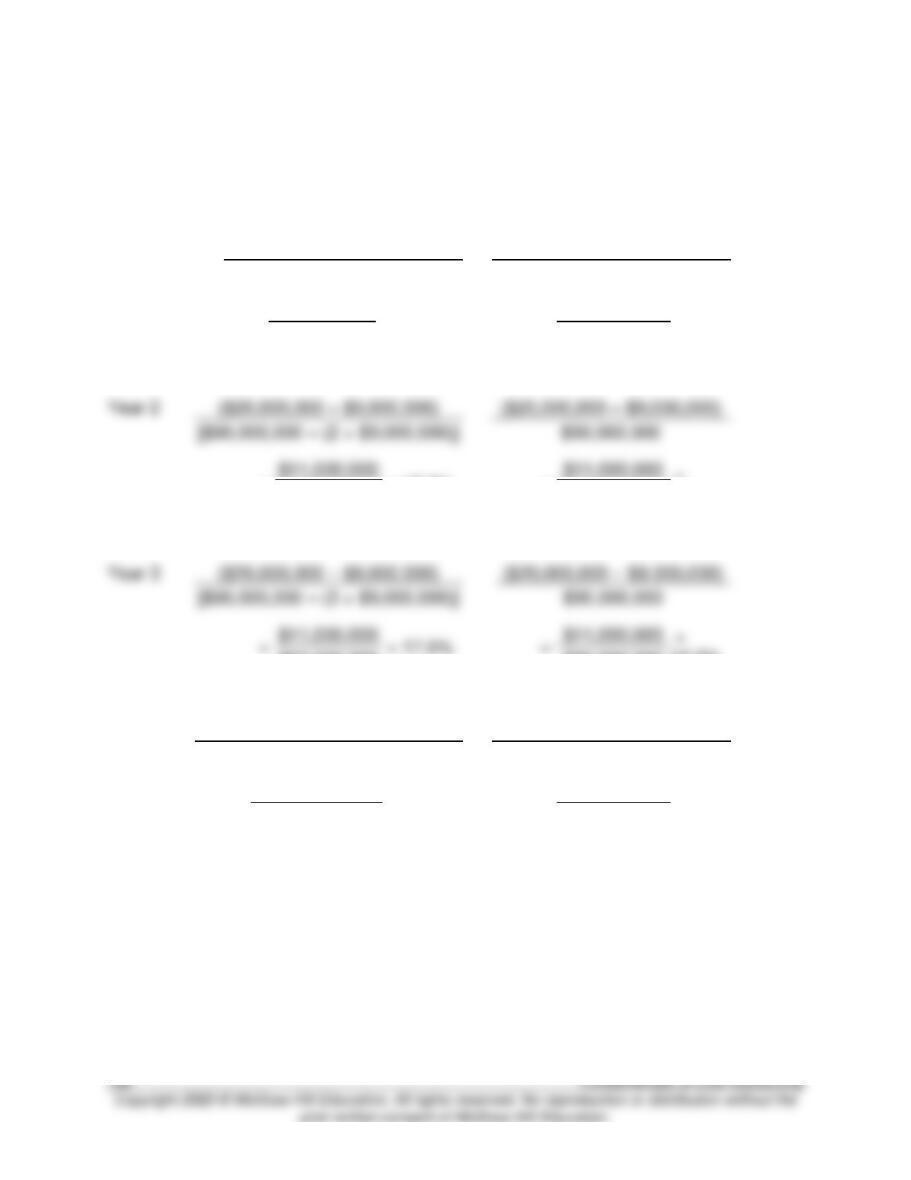
14–39. (25 min.) Compare Historical Cost, Net Book Value To Gross Book Value:
Ste. Marie Division.
a. Net Book Value
b. Gross Book Value
Year 1
($20,000,000 – $9,000,000)
($20,000,000 – $9,000,000)
($90,000,000 – $9,000,000)
$90,000,000
=
$11,000,000
= 13.6%
=
$11,000,000
=
12.2%
$81,000,000
$90,000,000
Year 2
($20,000,000 – $9,000,000)
$90,000,000
$11,000,000
$11,000,000
=
= 15.3%
=
=
12.2%
$72,000,000
$90,000,000
Year 3
($20,000,000 – $9,000,000)
[$90,000,000 – (3 × $9,000,000)]
$11,000,000
$11,000,000
=
=
12.2%
$63,000,000
$90,000,000
Year 4
($20,000,000 – $9,000,000)
($20,000,000 – $9,000,000)
[$90,000,000 – (4 × $9,000,000)]
$90,000,000
=
$11,000,000
= 20.4%
=
$1,000,000
=
12.2%
$54,000,000
$90,000,000

14–40. (25 min.) Compare ROI Using Net Book And Gross Book Values: Ste.
Marie Division.
Year 1
$11,000,000
$11,000,000
=
= 12.2%
=
12.2%
$90,000,000
$90,000,000
Year 2
($20,000,000 – $9,000,000)
($20,000,000 – $9,000,000)
($90,000,000 – $9,000,000)
$90,000,000
=
$11,000,000
= 13.6%
=
$11,000,000
=
12.2%
$81,000,000
$90,000,000
Year 3
($20,000,000 – $9,000,000)
($20,000,000 – $9,000,000)
[$90,000,000 – (2 × $9,000,000)]
$60,000,000
$11,000,000
$11,000,000
=
= 15.3%
=
=
12.2%
$72,000,000
$90,000,000
Year 4
($20,000,000 – $9,000,000)
($20,000,000 – $9,000,000)
[$90,000,000 – (3 × $9,000,000)]
$90,000,000
=
$11,000,000
= 17.5%
=
$11,000,000
=
12.2%
$63,000,000
$90,000,000
c. Of course, there is no change under the gross book value method. With the net
method, both alternatives (using end-of-year asset values versus beginning-of-year
values) show the same trend of rising ROIs as the assets depreciate. This is to be
expected. The end-of–year value is the next year’s beginning–of-year value.
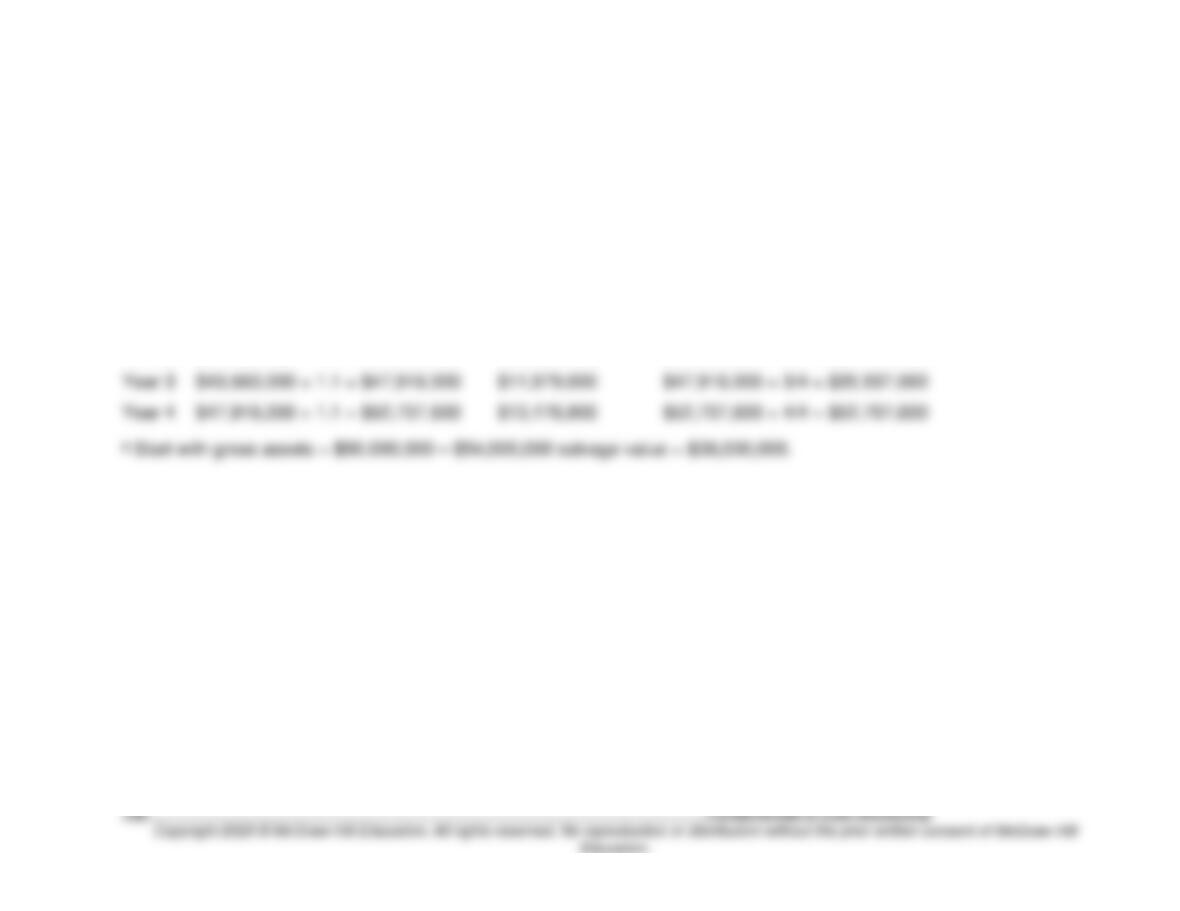
14–41.
(30 min.) Compare Current Cost To Historical Cost: St. Marie Division.
Parts c and d can be solved easier if one first sets up a table showing the change in value of the depreciable assets.
(1)
Gross Depreciable
Asset Valuea
(2)
Yearly
Depreciation
[col. (1) × 25%]
(3)
Total Depreciation
(1) (Years of life ÷ 4 years)
Year 1
$36,000,000 × 1.1 = $39,600,000
$9,900,000
$39,600,000 × 1/4 = $9,900,000
Year 2
$39,600,000 × 1.1 = $43,560,000
$10,890,000
$43,560,000 × 2/4 = $21,780,000
Year 3
$43,560,000 × 1.1 = $47,916,000
$11,979,000
$47,916,000 × 3/4 = $35,937,000
Year 4
$47,916,000 × 1.1 = $52,707,600
$52,707,600 × 4/4 = $52,707,600