Chapter 14 – Analyzing Financial Statements
14–32
AP14–6.
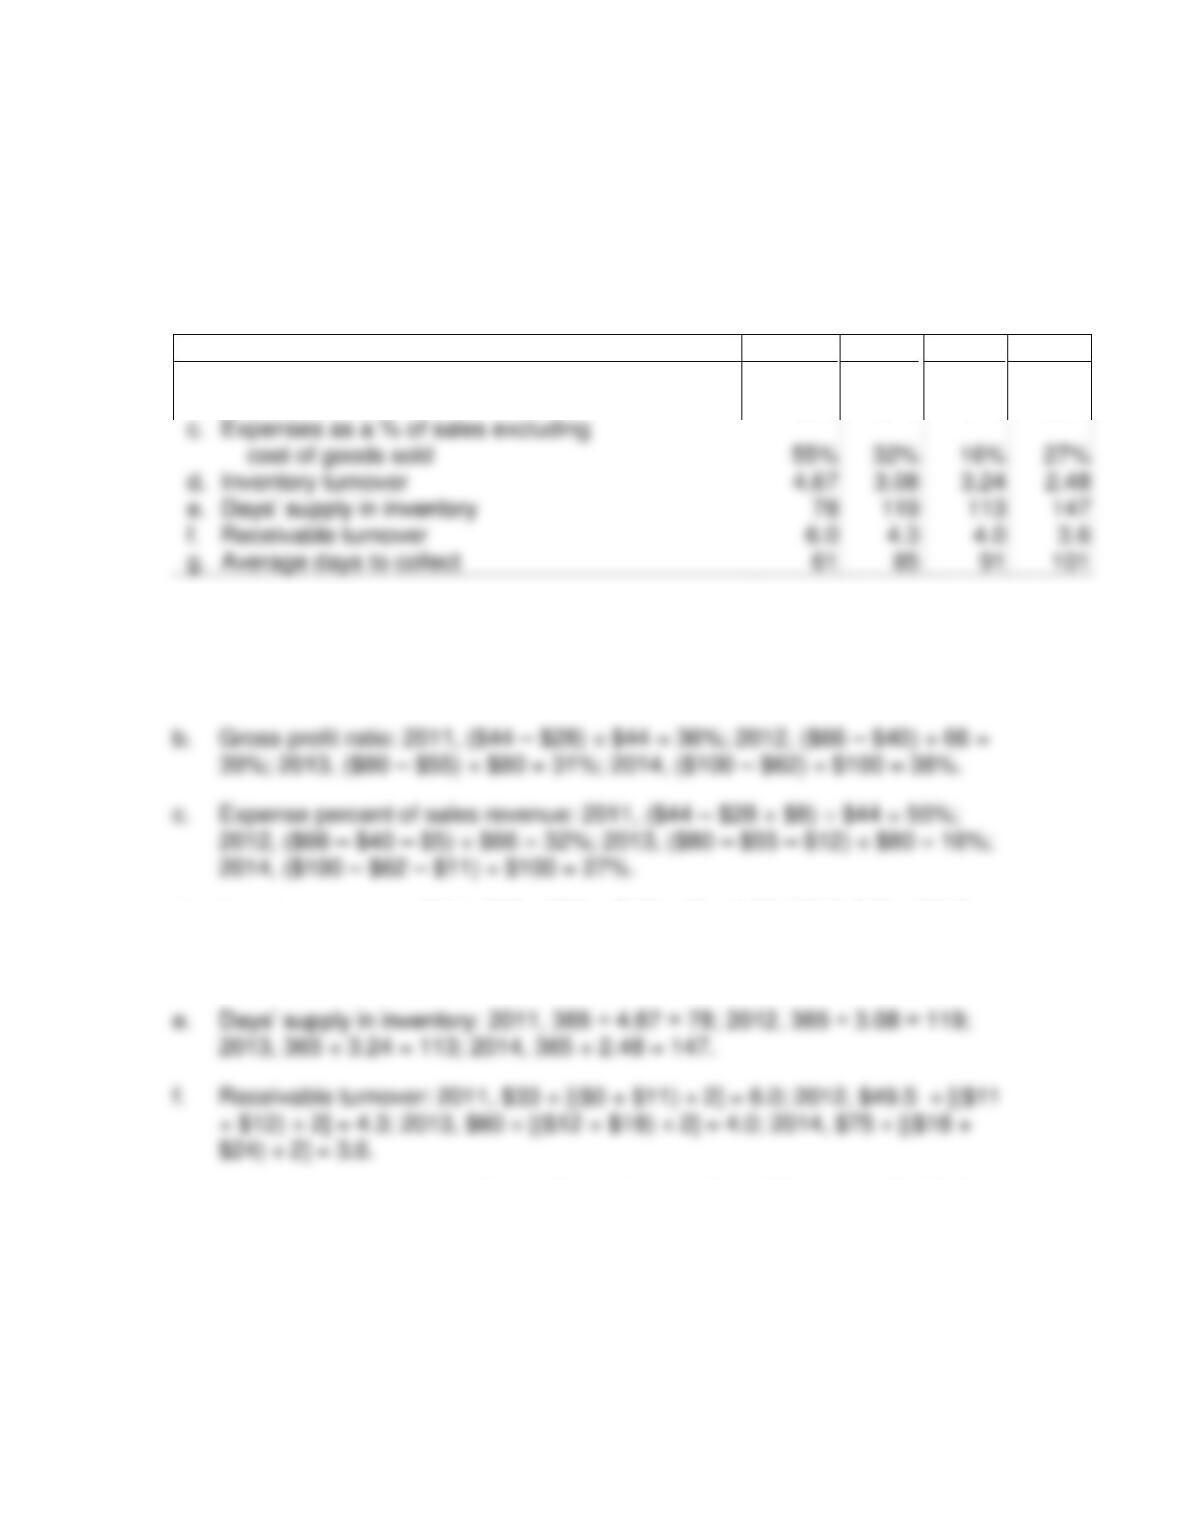
Req. 1
Ratio
2011
2012
2013
2014
a.
Profit margin %
(18%)
)
8%
15%
11%
b.
Gross profit ratio
36%
39%
31%
38%
Computations:
a. Profit margin: 2011, ($8) ÷ $44 = (18%); 2012, $5 ÷ $66 = 8%; 2013, $12 ÷
$80 = 15%; 2014, $11 ÷ $100 = 11%.
d. Inventory turnover: 2011, $28 ÷ [($0 + $12) ÷ 2] = 4.67; 2012, $40 ÷ [($12 +
$14) ÷ 2] = 3.08; 2013, $55 ÷ [($14 + $20) ÷ 2] = 3.24; 2014, $62 ÷ [($20 +
$30) ÷ 2] = 2.48.
g. Average days to collect: 2011, 365 ÷ 6.0 = 61; 2012, 365 ÷ 4.3 = 85; 2013,
365 ÷ 4.0 = 91; 2014, 365 ÷ 3.6 = 101.
55%
32%
16%
27%
d.
Inventory turnover
3.08
e.
Receivable turnover
g.
Average days to collect
Chapter 14 – Analyzing Financial Statements
AP14–6. (continued)
Req. 2
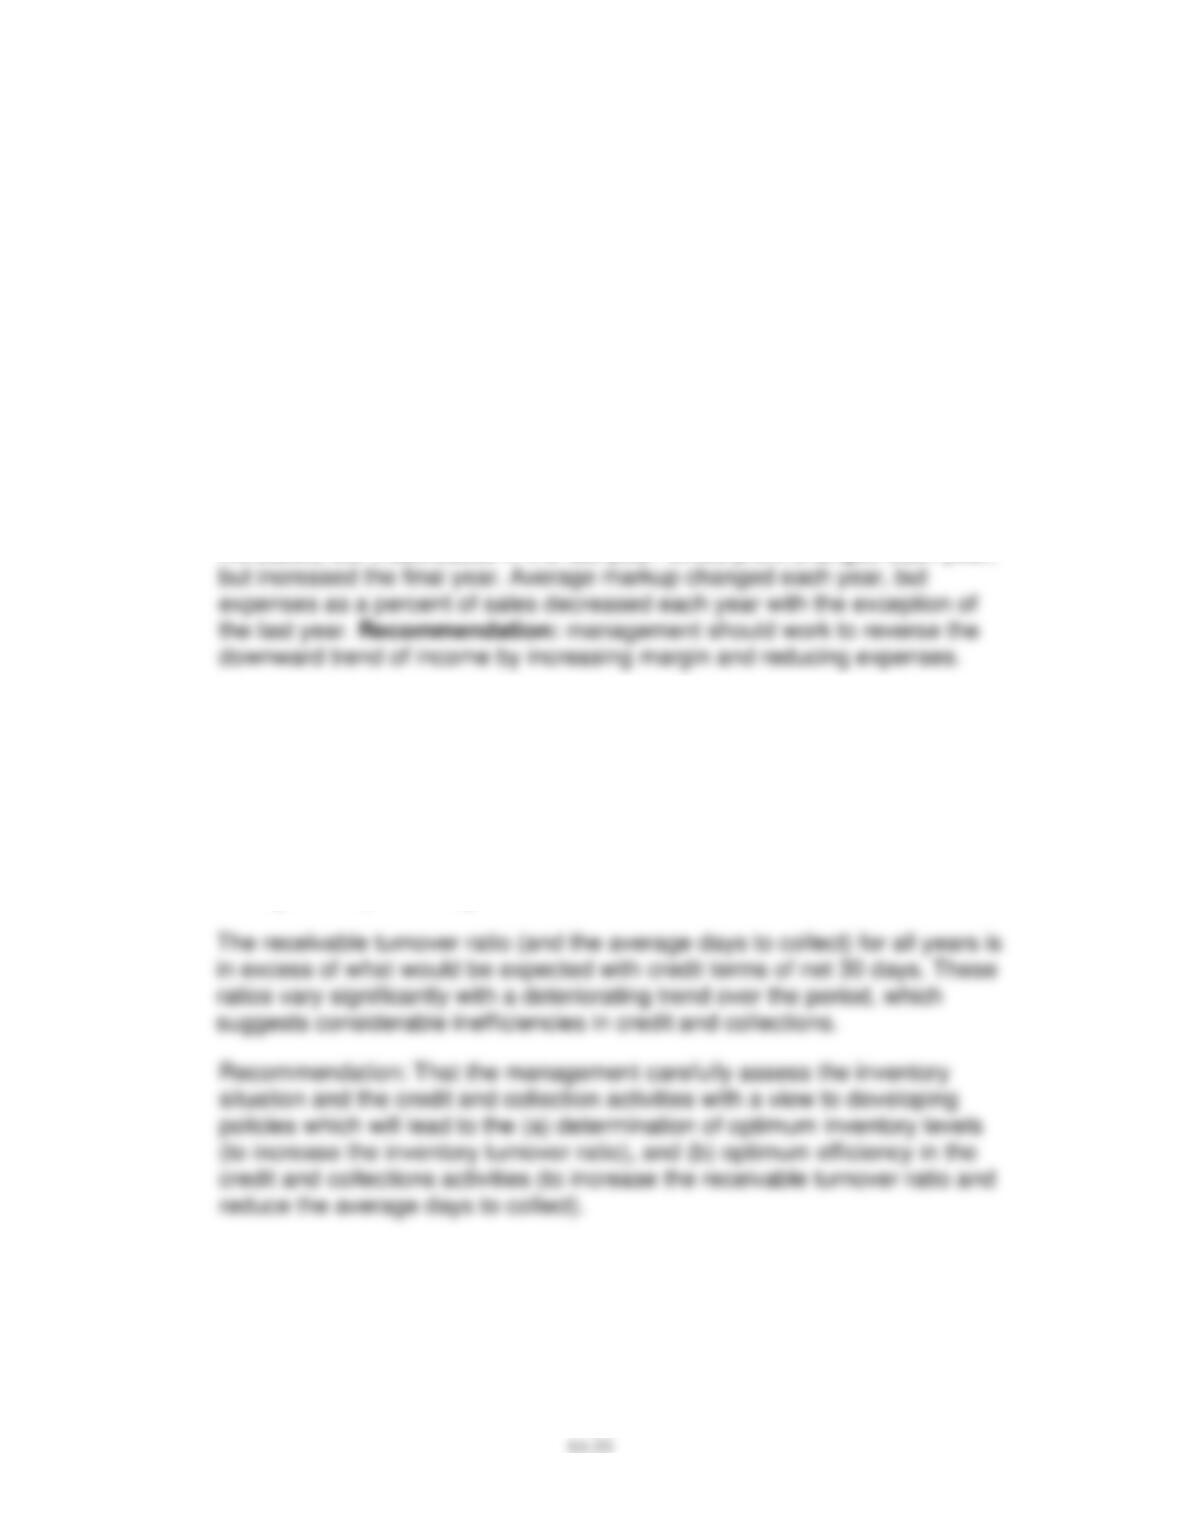
Revenue increased steadily each year. During the first years, profit margin
increased, but it decreased in the last year. Gross profit changed each year,
Req. 3
The inventory turnover ratio (and days’ supply) reflect instability. This effect
is even more pronounced when the turnover ratio is compared with the gross
profit ratio and the profit margin ratio. These comparisons strongly suggest
that inventory control (i.e., the amount of goods to stock) is seriously lacking.
Recall that the higher the inventory turnover (and the lower the days’ supply)
the higher the profit margin.
Chapter 14 – Analyzing Financial Statements
14–34
AP14–7.
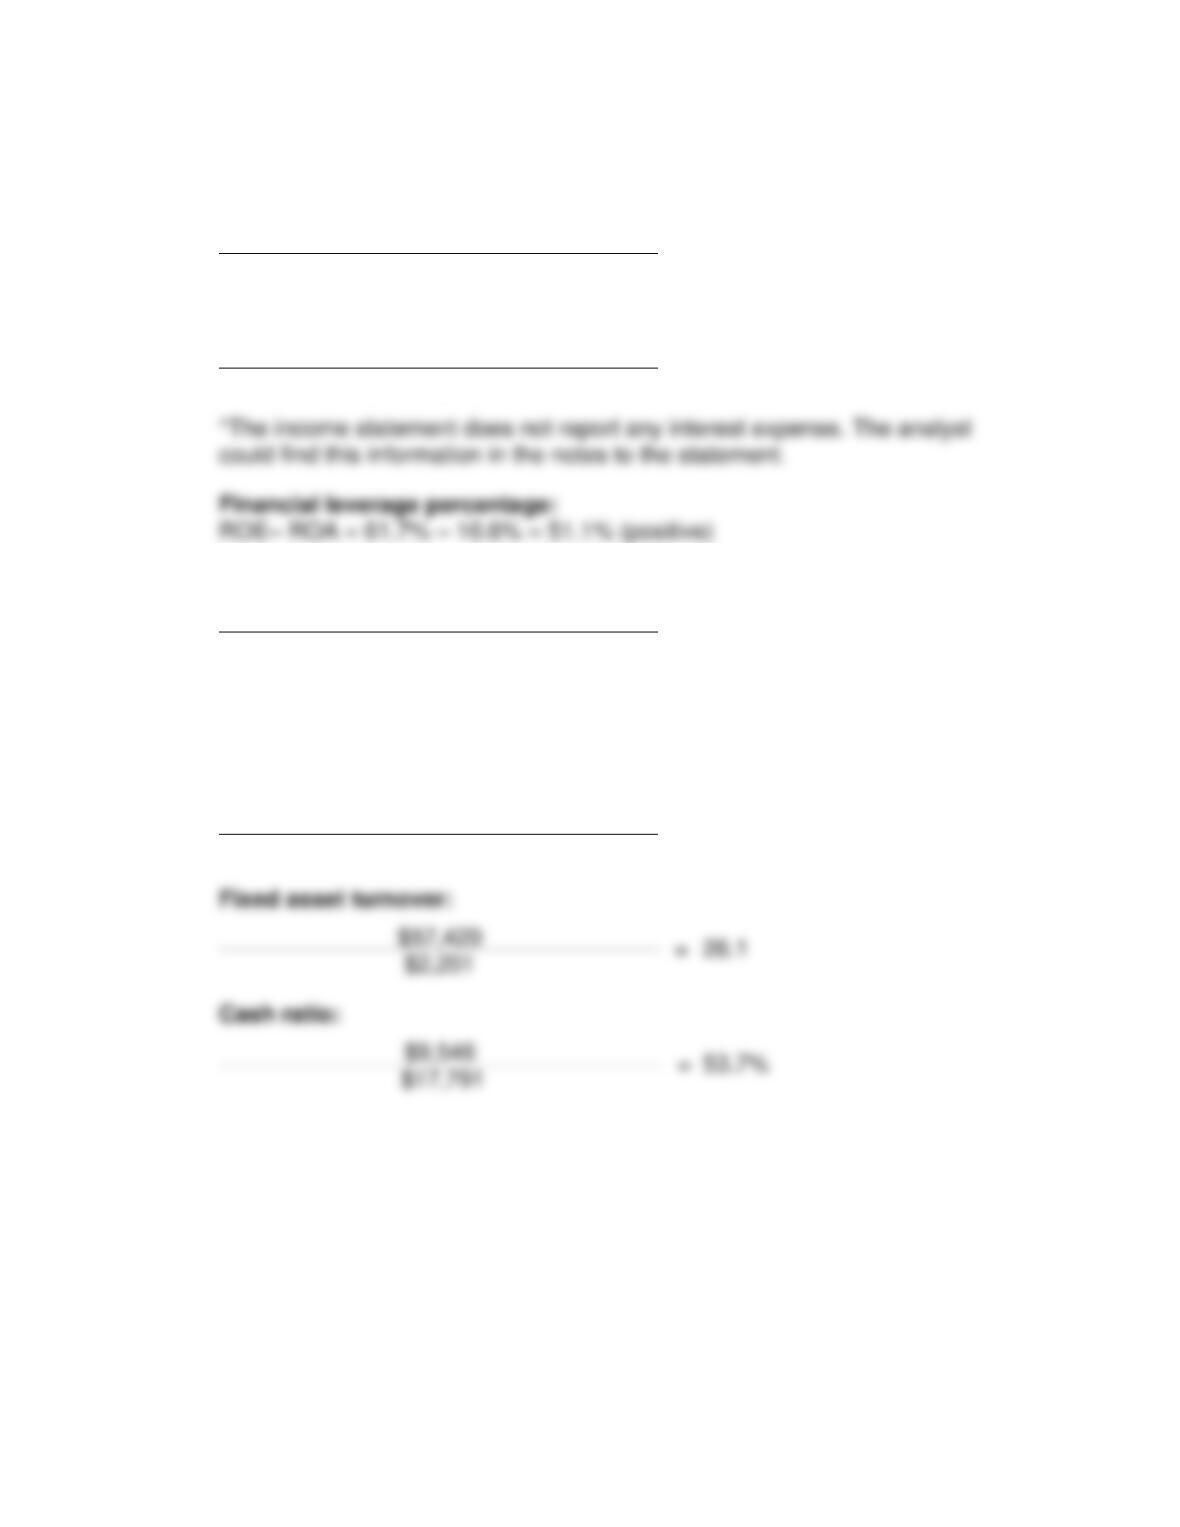
Return on equity:
$2,583
=
61.7%
($4,328 + $4,047) ÷ 2
Return on assets:
$2,583*
=
10.6%
($25,635 + $23,252) ÷ 2
Earnings per share:
$2,583
=
$1.13
(2,226 + 2,330) ÷ 2
Quality of Income:
Cannot compute without the statement of cash flows.
Profit margin:
$2,583
=
4.5%
$57,420
$57,420
$2,201
$9,546
53.7%
Chapter 14 – Analyzing Financial Statements
14–35
AP14–7. (continued)
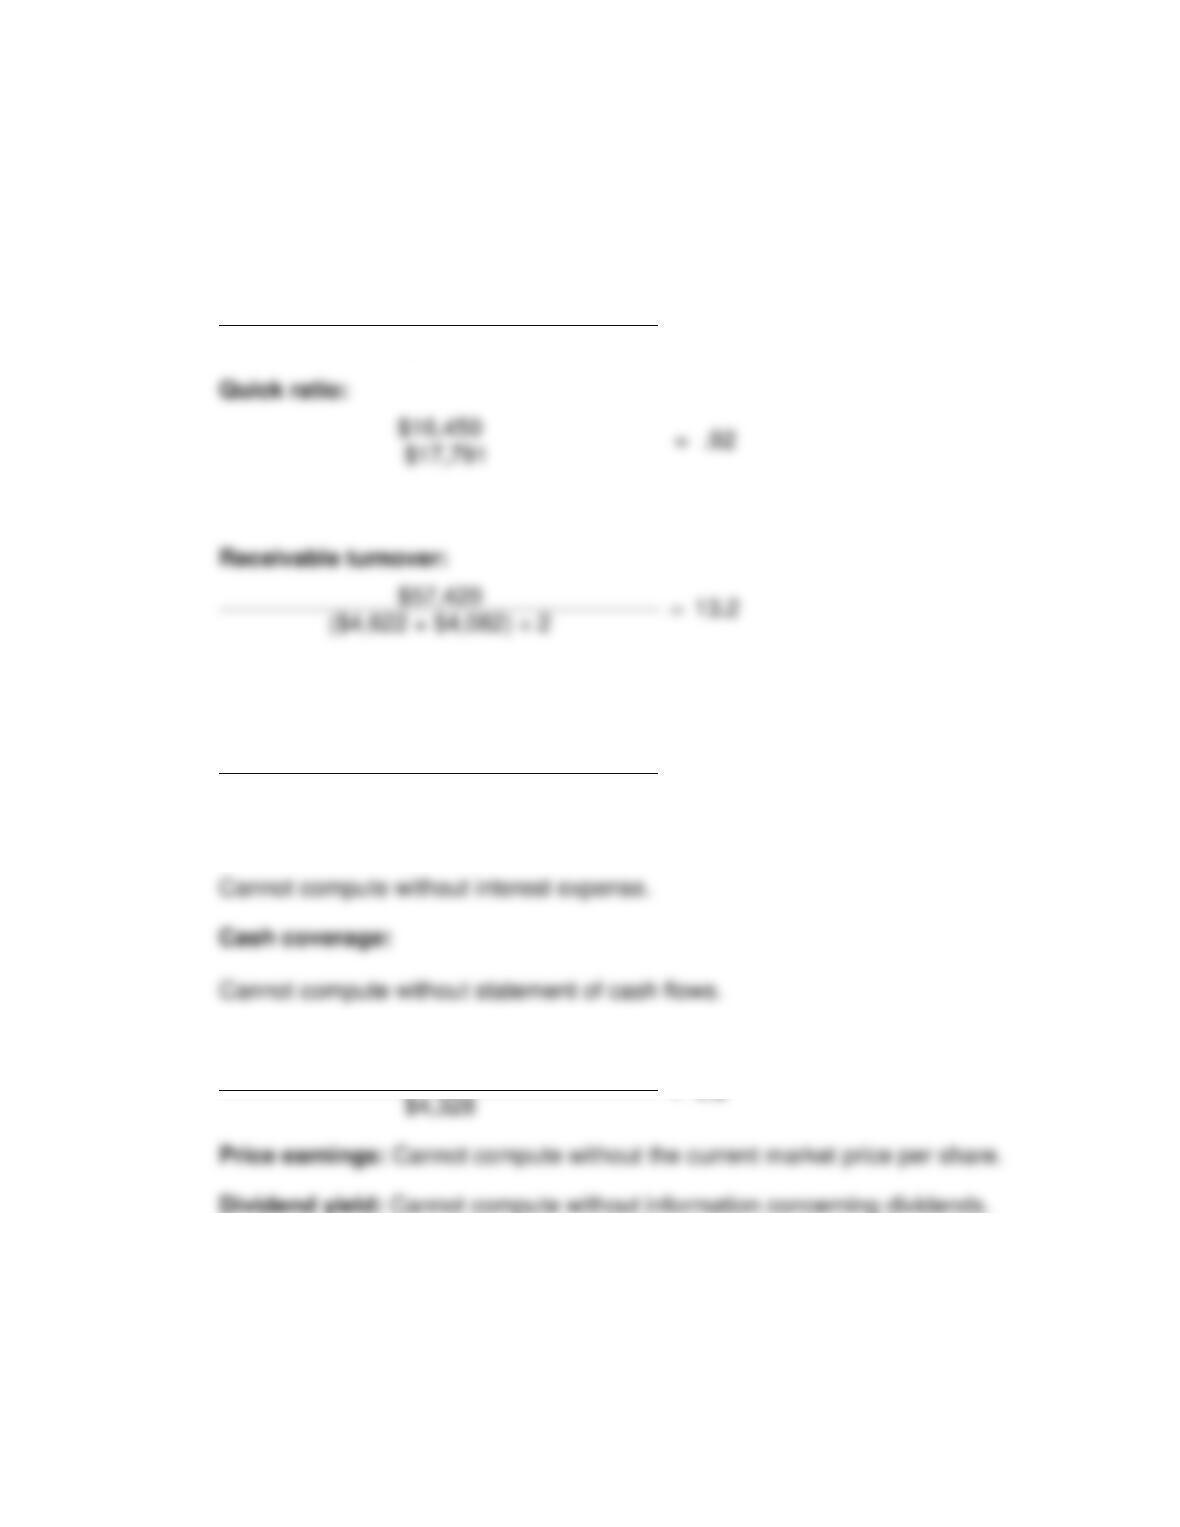
Current ratio:
$19,939
=
1.1
$17,791
Inventory turnover:
$47,904
=
76.8
($660 + $588) ÷ 2
Times interest earned:
Debt/Equity:
$21,196
=
4.9
$16,450
.92
$57,420
=
13.2
Chapter 14 – Analyzing Financial Statements
14–36
CASES AND PROJECTS
FINANCIAL REPORTING AND ANALYSIS CASES
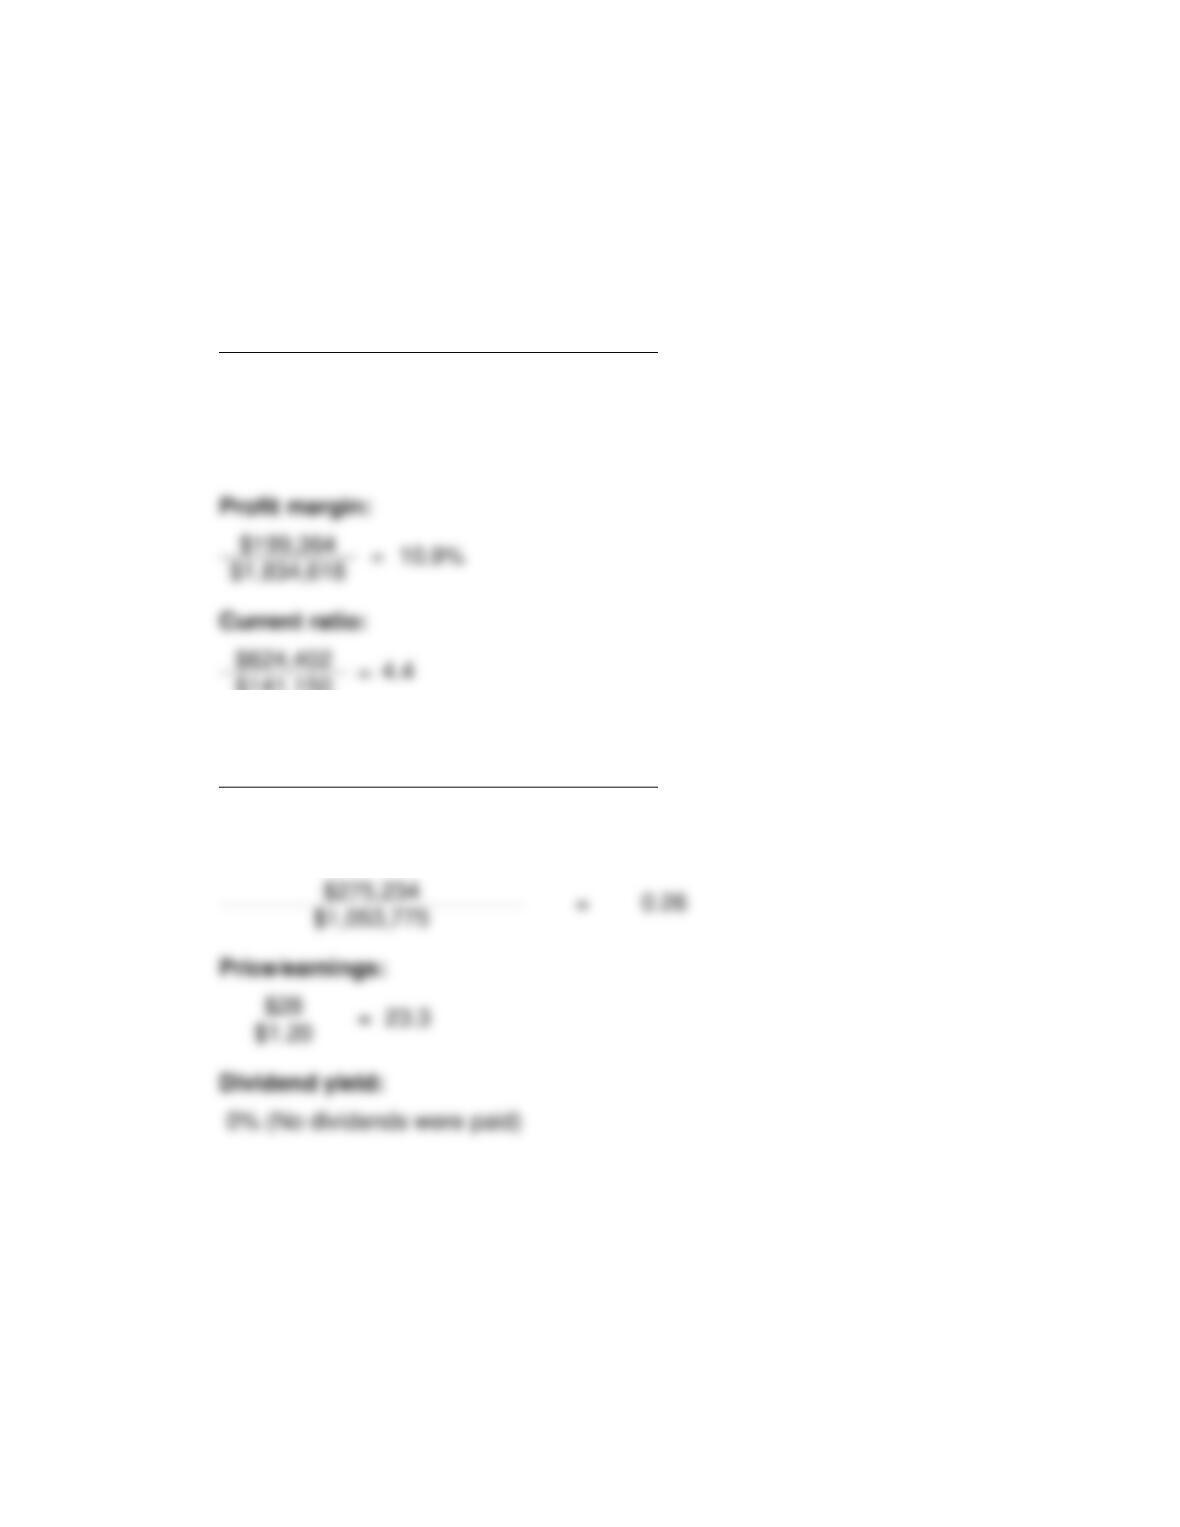
CP14–1.
=
13.0%
($1,409,031 + $1,340,464) ÷ 2
Earnings per share:
As reported $0.87
=
2.3
Inventory turnover:
$1,814,765
=
6.2
($294,928 + $286,485) 2
.39
2.7%
Chapter 14 – Analyzing Financial Statements
14–37
CP14–2.
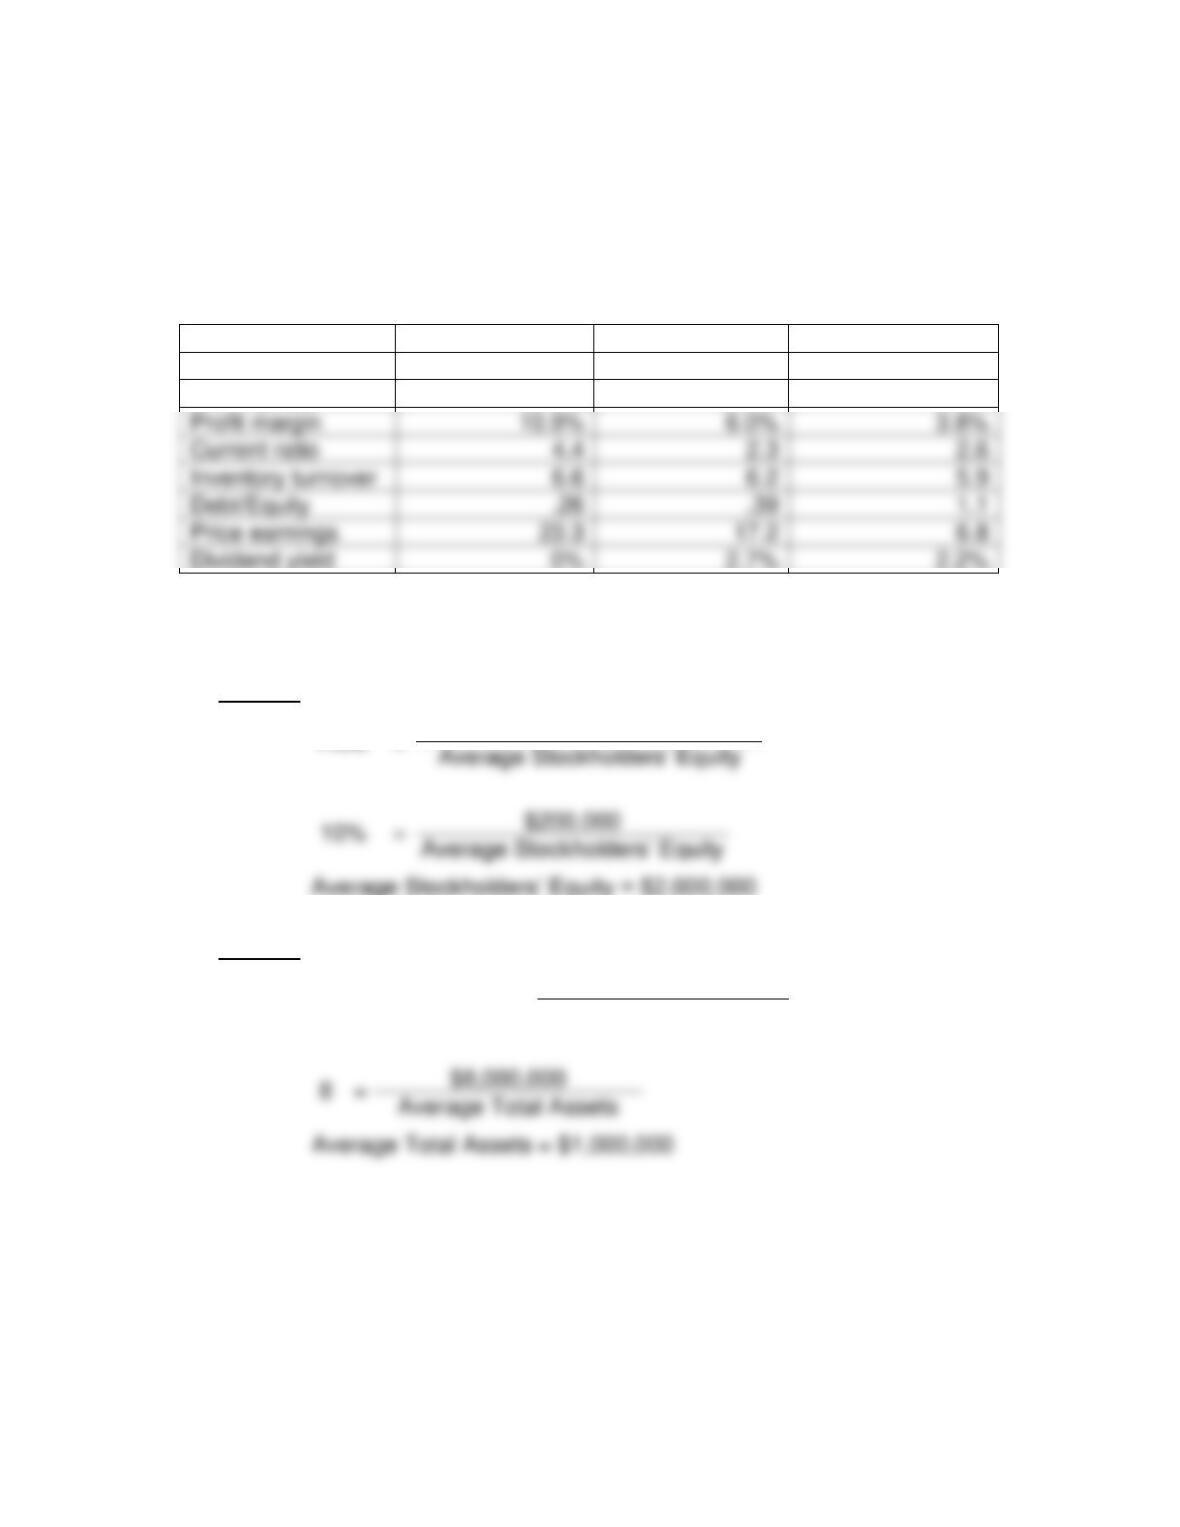
Urban Outfitters
Return on equity:
$199,364
=
20.9%
($1,053,775 + $853,431) 2
Earnings per share:
As reported $1.20
$141,150
Inventory turnover:
$1,121,140
=
6.6
($169,698 + $171,925) 2
Debt/Equity:
$624,402
Chapter 14 – Analyzing Financial Statements
14–38
CP14–3.
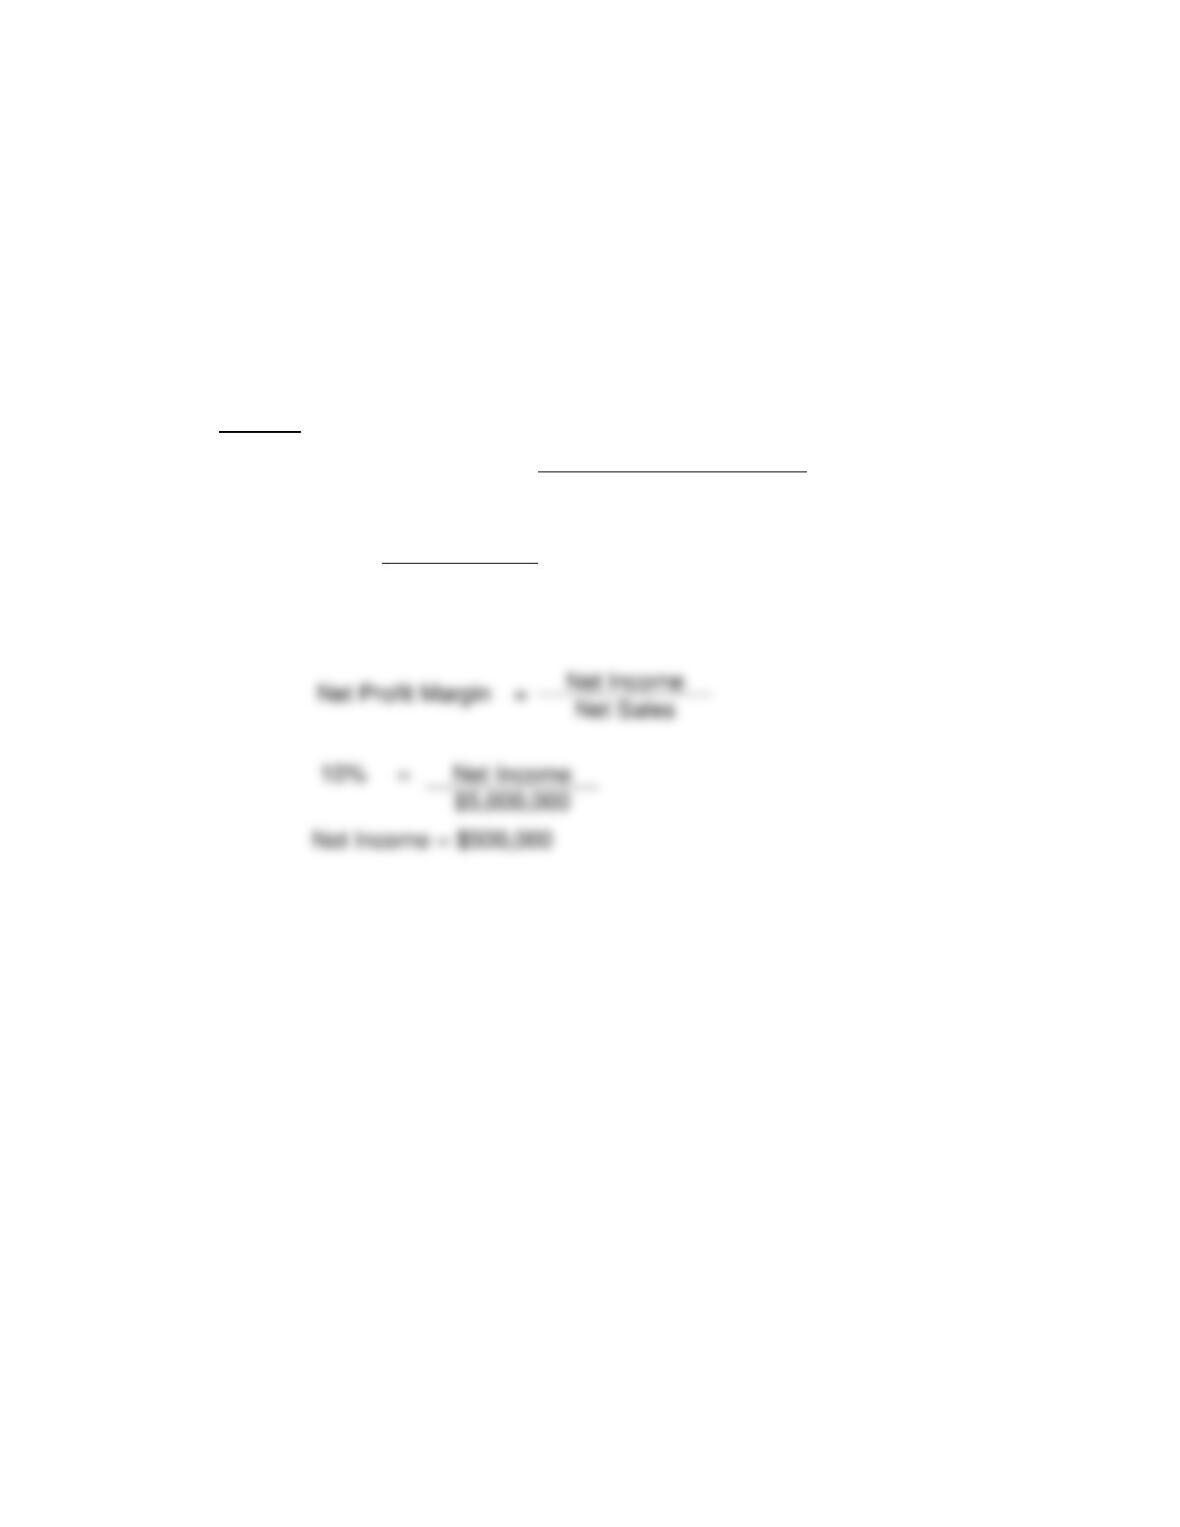
For calculations, see CP14-1, CP14-2, and Appendix D.
Urban Outfitters
American Eagle
Industry Average
Return on equity
20.9%
13.0%
13.1%
Earnings per share
$1.20
$0.87
N/A
CP14–4.
Case 1:
ROE
=
Net Income
=
Case 2:
Asset Turnover
=
Net Sales
Average Total Assets
Profit margin
10.9%
Current ratio
Inventory turnover
Debt/Equity
Price earnings
Dividend yield
Chapter 14 – Analyzing Financial Statements
14–39
CP14–4. (continued)
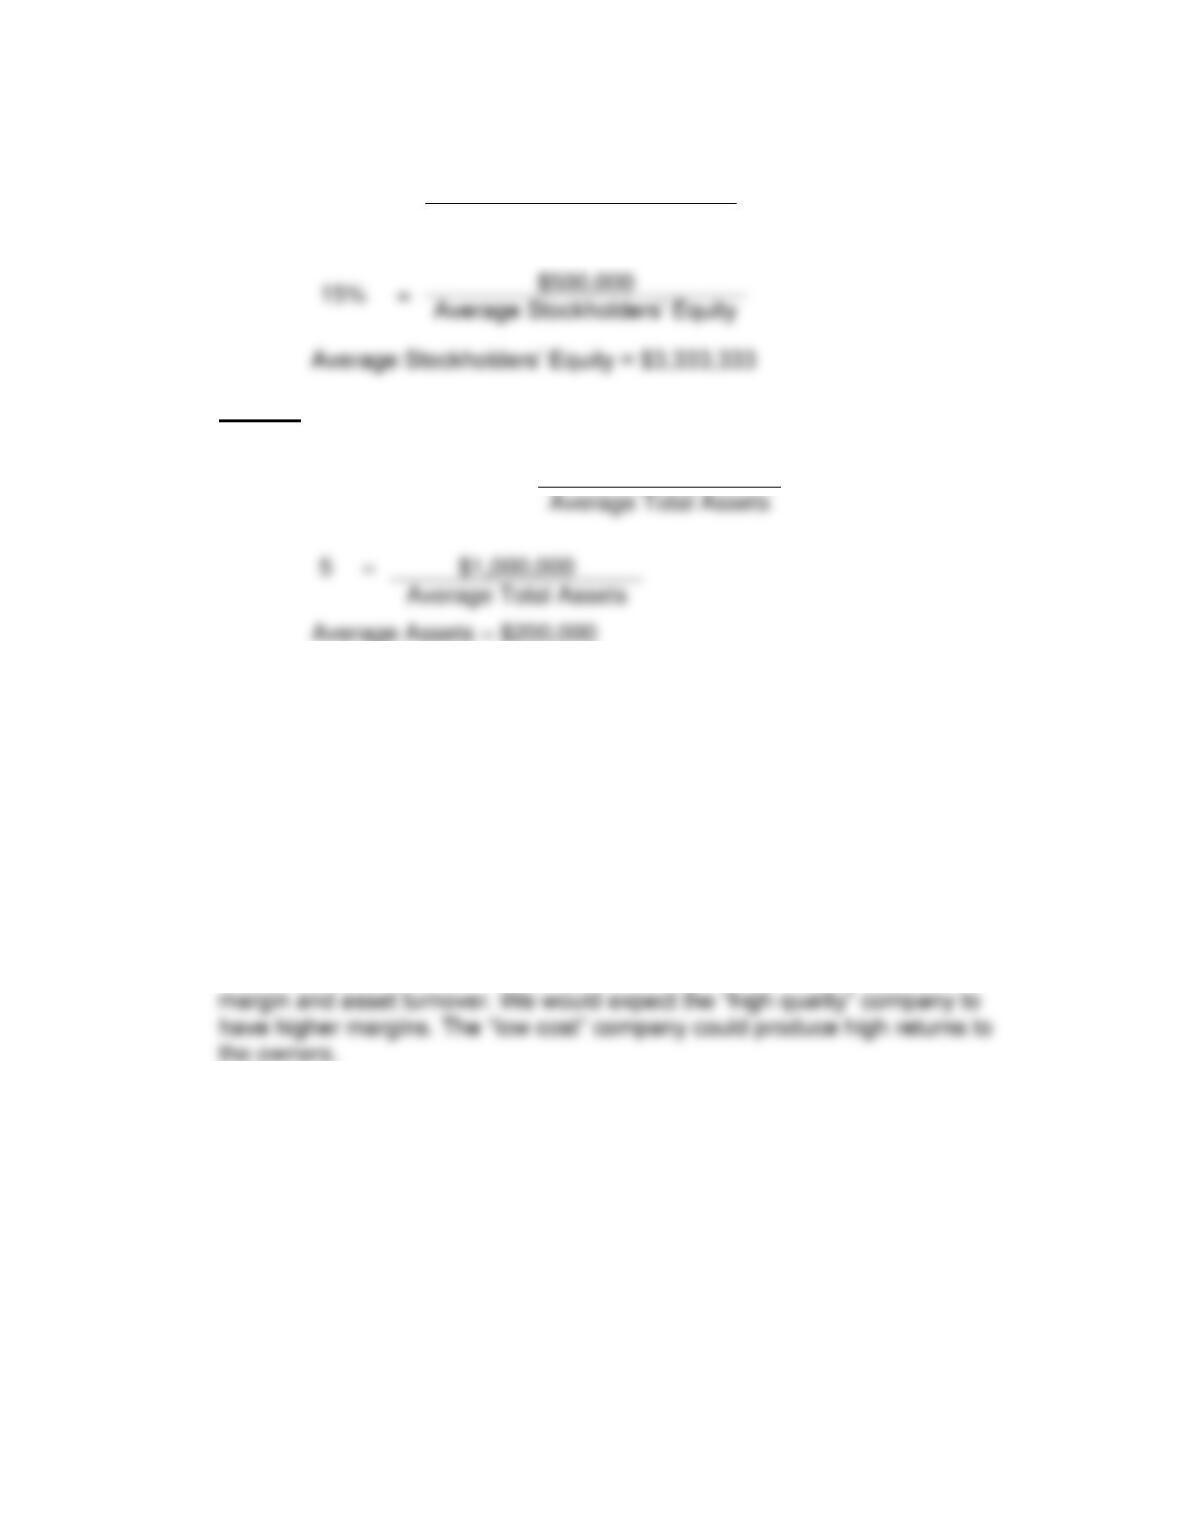
Case 3:
Asset Turnover
=
Net Sales
Average Total Assets
5
=
Net Sales
$1,000,000
Net Sales = $5,000,000
=
Chapter 14 – Analyzing Financial Statements
14–40
ROE
=
Net Income
Average Stockholders’ Equity
Case 4:
Asset Turnover
=
Net Sales
CP14–5.
The two areas where we would expect the largest difference are profit
=
Chapter 14 – Analyzing Financial Statements
14–41
CRITICAL THINKING CASES
CP14–6.
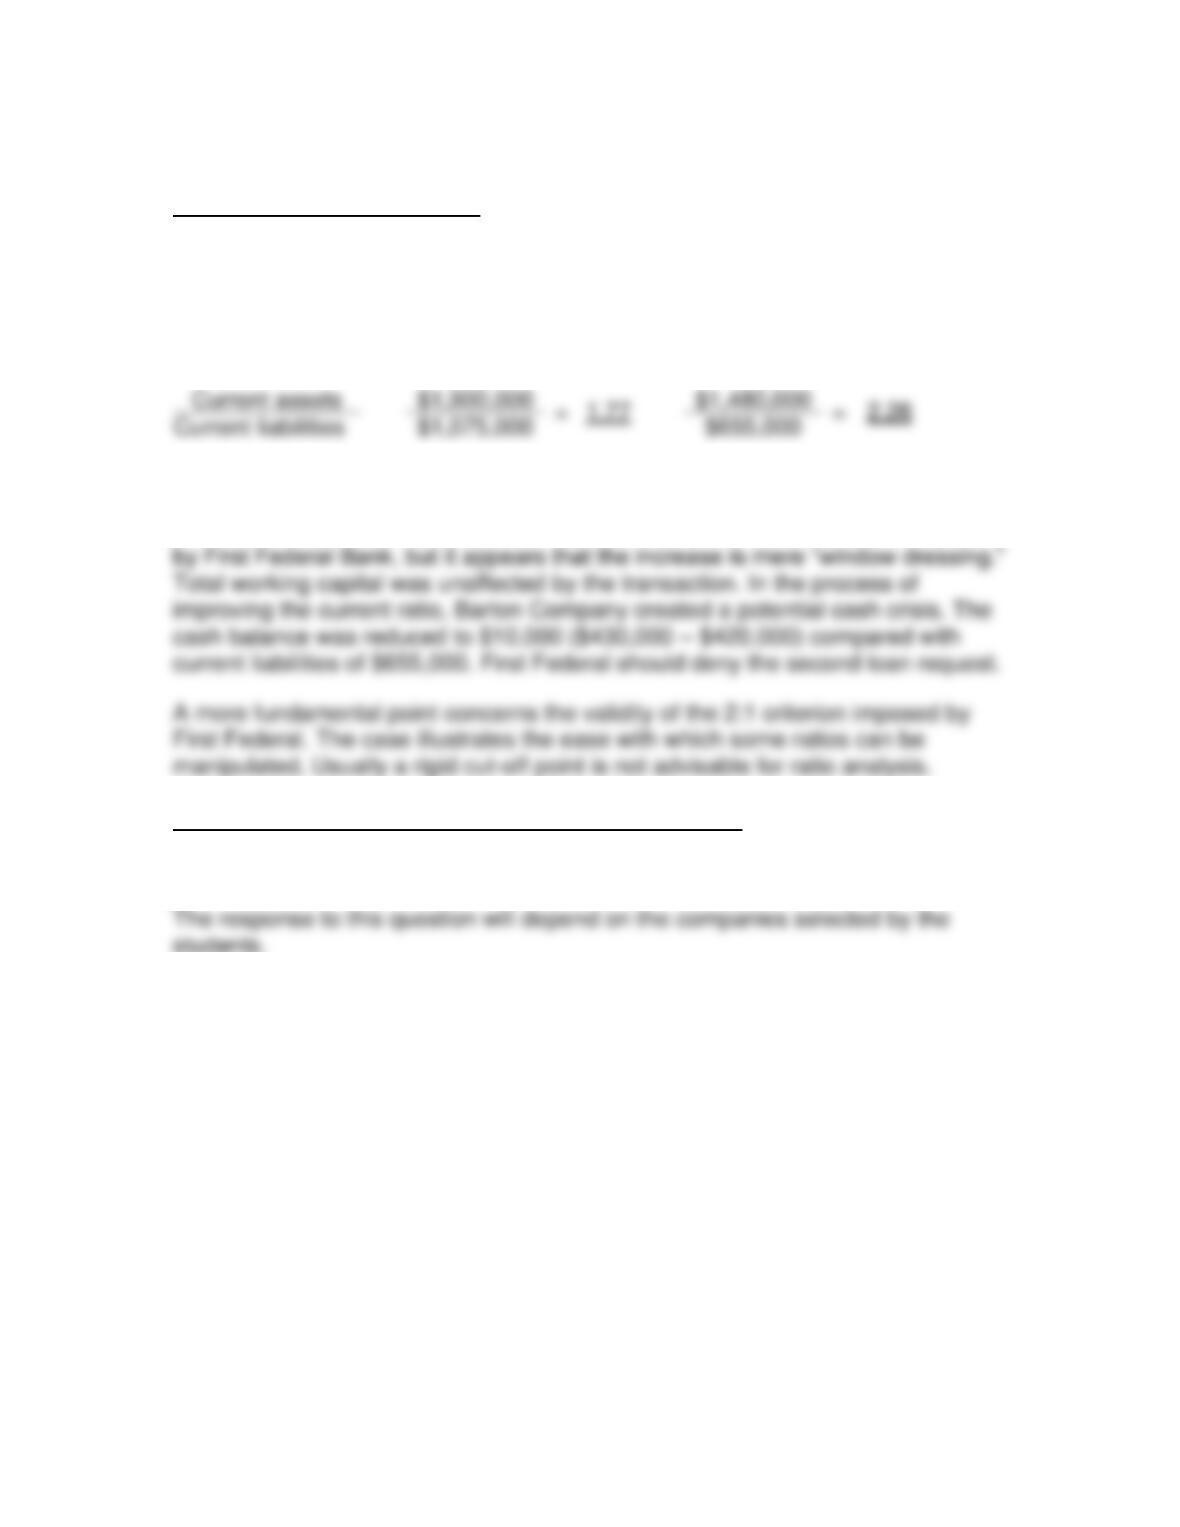
Although the amount of working capital was unchanged, the current ratio for
Barton Company increased as a result of paying $420,000 to the trade creditors:
Before
After
Working capital
$ 825,000
$825,000
The current ratio has increased to an amount that is considered to be acceptable
FINANCIAL REPORTING AND ANALYSIS PROJECTS
CP14–7.
Current assets
Current liabilities
$655,000