443
CHAPTER 14
DECENTRALIZED OPERATIONS
CLASS DISCUSSION QUESTIONS
1. In a cost center, the department manager is
responsible for and has authority over costs
only. In a profit center, the manager’s re-
sponsibility and authority extend to costs
and revenues.
3. The difference in budget performance re-
ports prepared for department supervisors
and plant managers is the amount of detail
provided to each. The departmental supervi-
sors require considerable detail to control
costs. The report for the plant managers
would contain more summarized cost data
for the various departments.
Database administration: Number of reports.
6. The major shortcoming of using operating
income as a measure of investment center
performance is that it ignores the amount of
investment committed to each center. Since
7. Revenues and expenses are considered in
computing the return on investment because
they directly impact the determination of
operating income. Invested assets are con-
sidered in computing the return on invest-
is the lowest. In this situation, the division
would be considered the least profitable per
dollar invested in the division.
9. By dividing operating income by the amount
of invested assets, each division is placed on
a comparable basis of operating income per
dollar invested.
10. North Division. The North Division will return
444
E14–1
a. (a) $148,975 (g) $758,875
(b) $137,500 (h) $750,000
(c) $11,475 (i) $8,875
Schedules of supporting calculations (answers in italics; the solution requires
working from the department level, up to the plant level, then to the vice president
of production level):
EZ BREEZY COMPANY
Budget Performance Report—Vice President, Production
For the Month Ended April 30
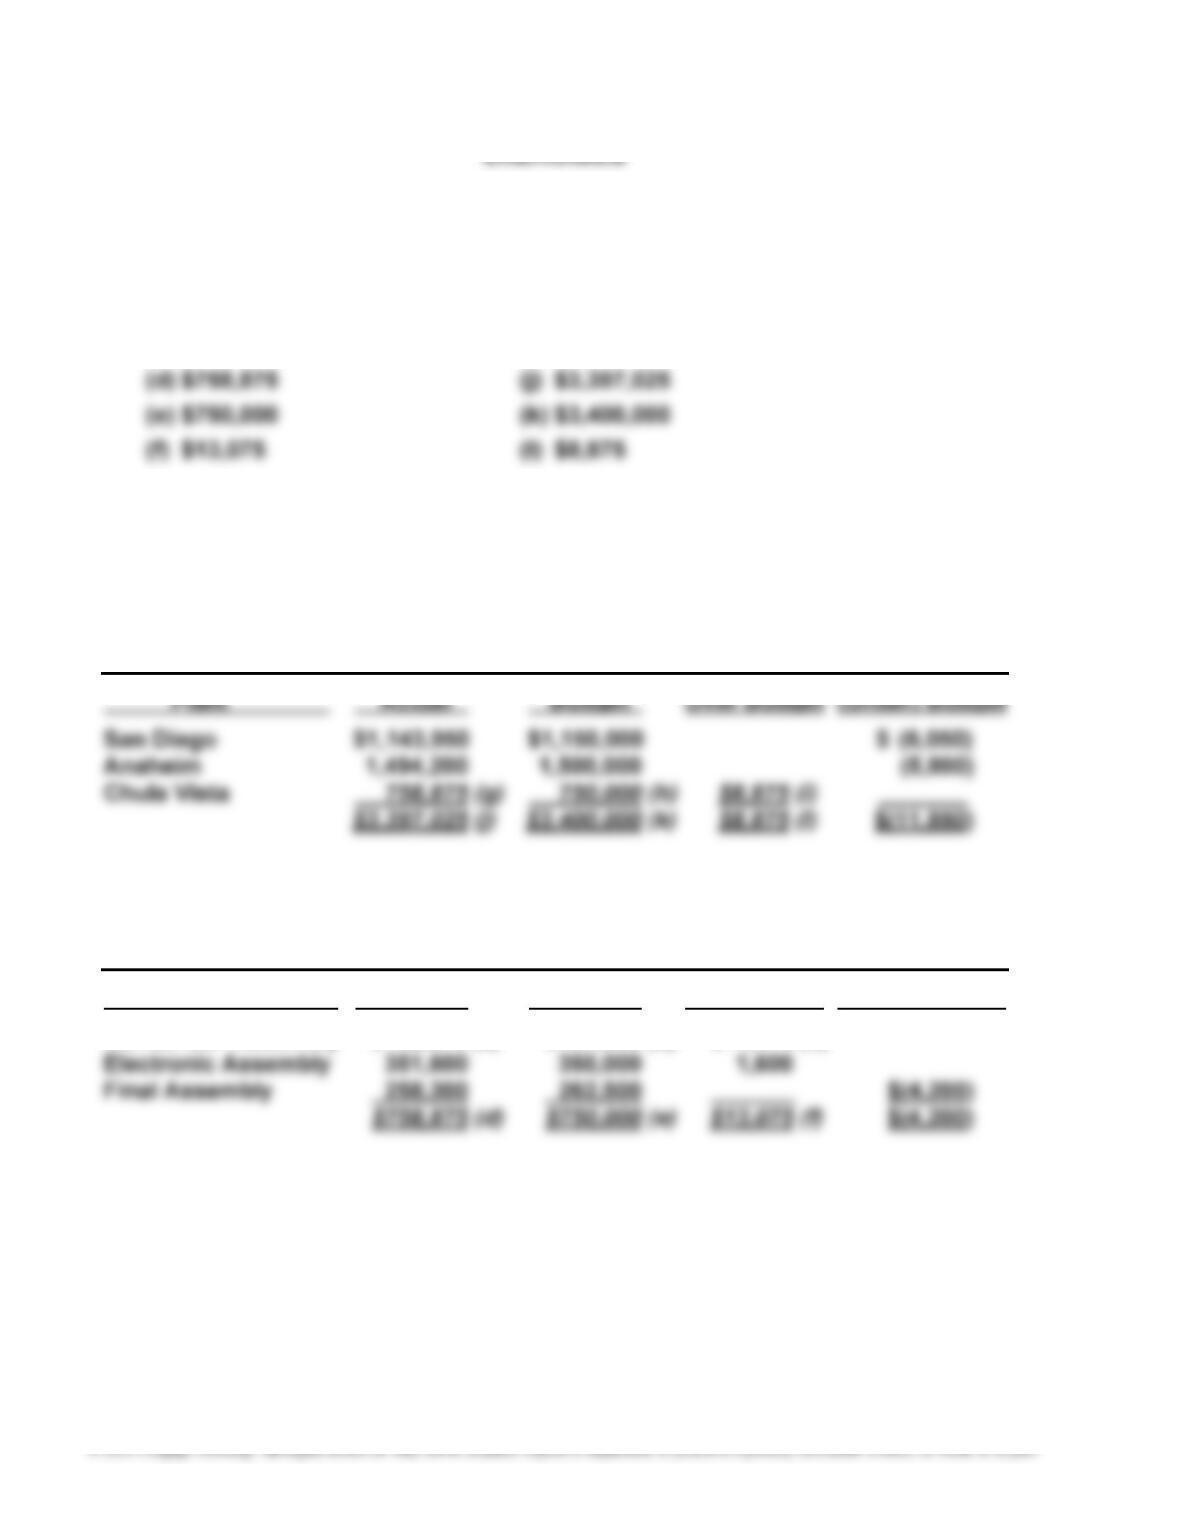
EZ BREEZY COMPANY
Budget Performance Report—Plant Manager, Chula Vista Plant
For the Month Ended April 30
Department Actual Budget Over Budget (Under) Budget
Condenser Assembly $148,975 (a) $137,500 (b) $11,475 (c)
445
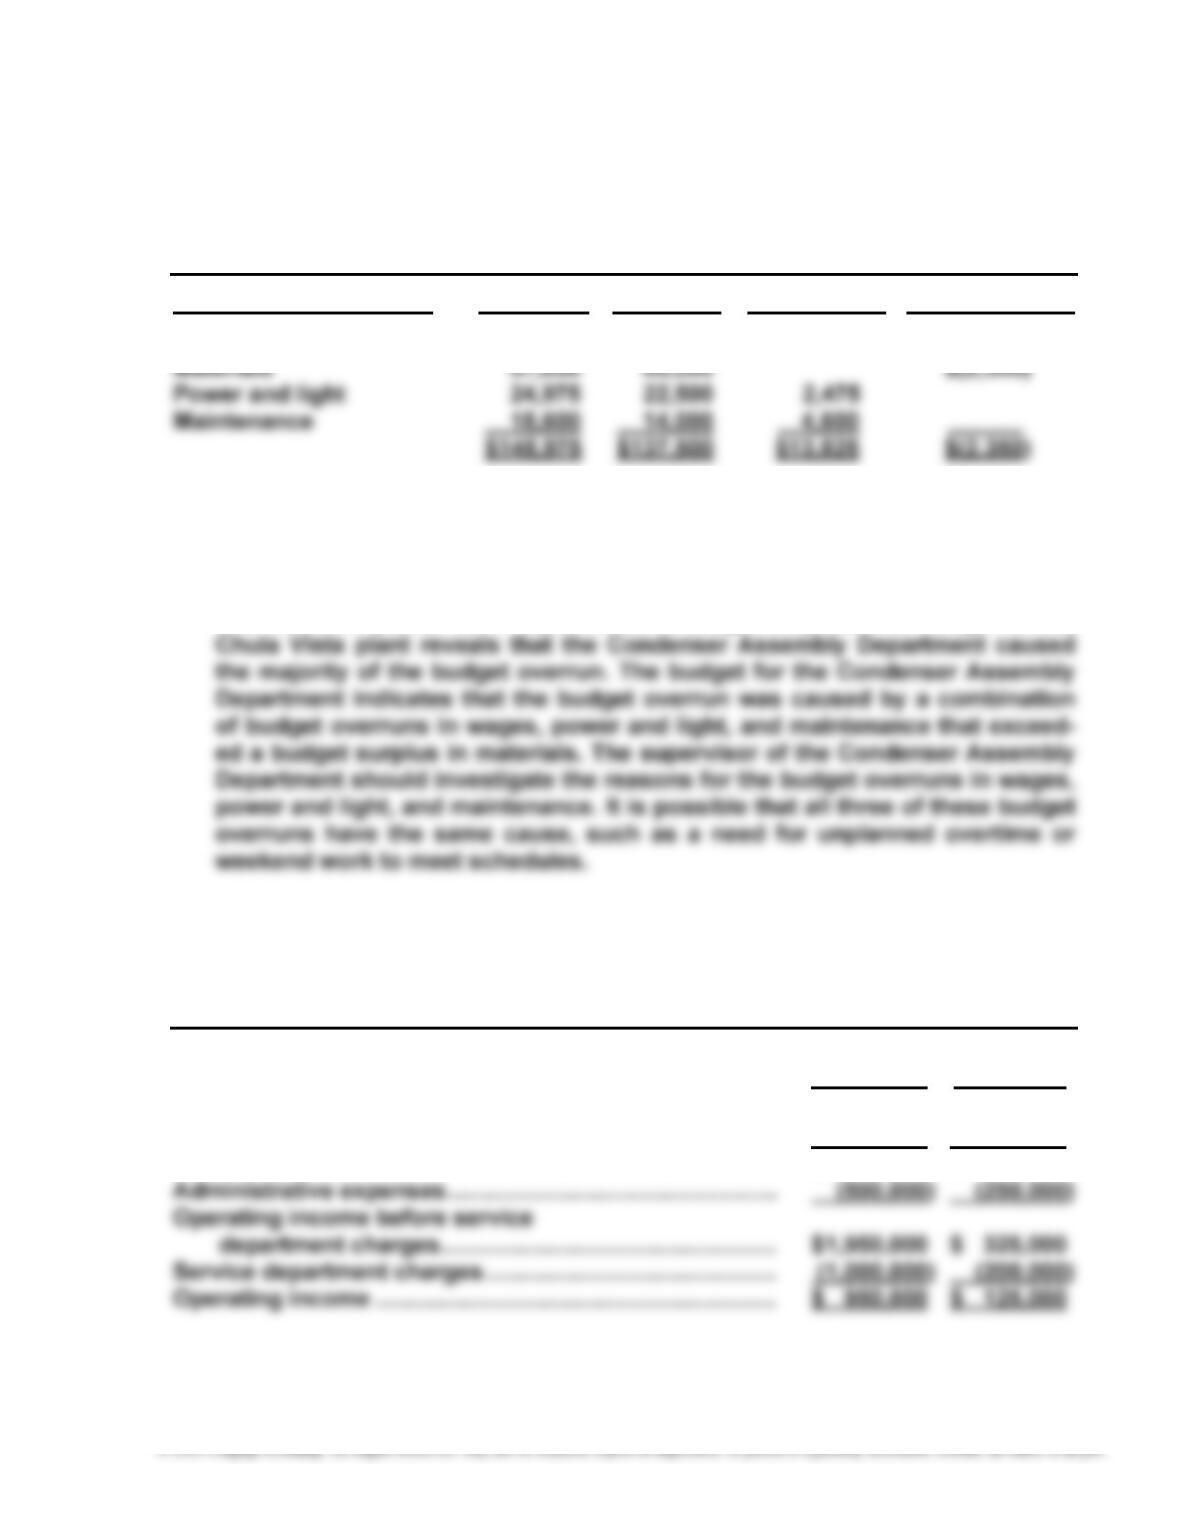
E14–1, Concluded
EZ BREEZY COMPANY
Budget Performance Report—Supervisor, Condenser Assembly
For the Month Ended April 30
Cost Actual Budget Over Budget (Under) Budget
Factory wages $ 47,750 $ 41,000 $ 6,750
b. MEMO
To: Bop Higgins, Vice President of Production
The Chula Vista plant has experienced a budget overrun, while the San Diego
and Anaheim plants have experienced a budget surplus. The budget of the
E14–2
VINTAGE CONSTRUCTION COMPANY
Divisional Income Statements
For the Year Ended October 31, 20Y3
Commercial Residential
Division Division
Sales ……………………………………………………………………….. $ 6,250,000 $ 1,875,000
Cost of goods sold …………………………………………………… (3,800,000) (1,300,000)
Gross profit ……………………………………………………………… $ 2,450,000 $ 575,000
446
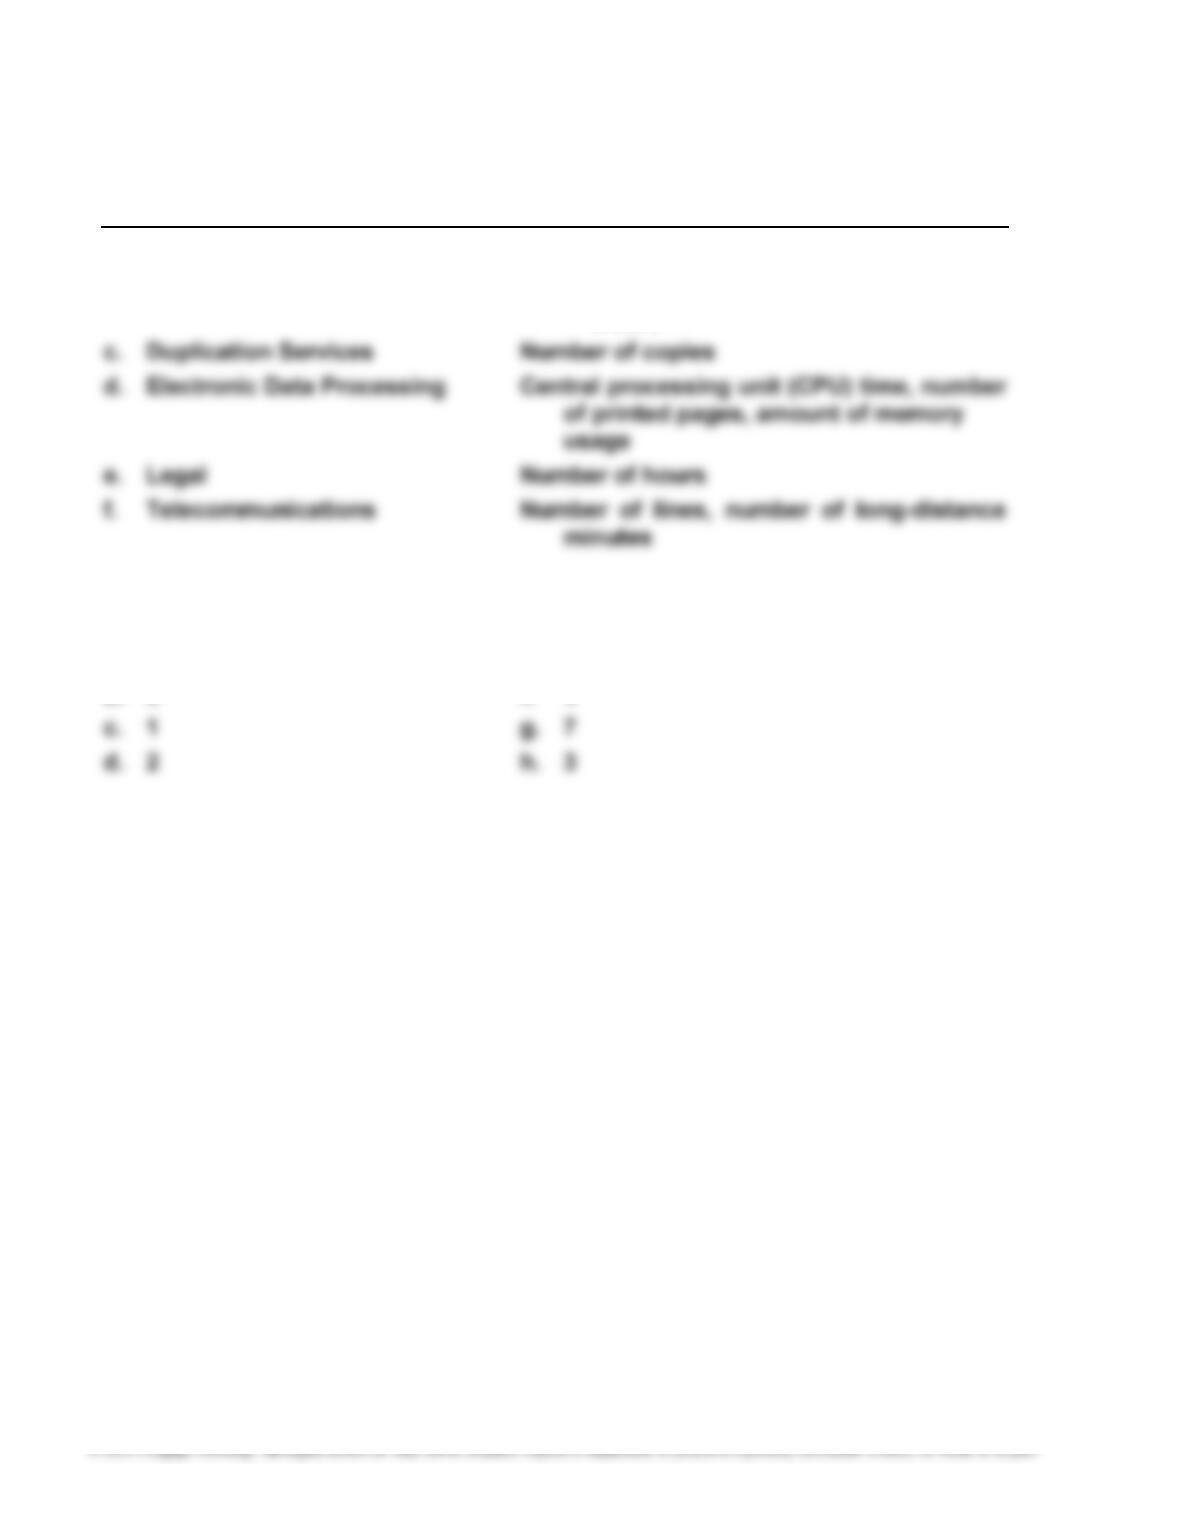
E14–3
Expense Activity Bases
a. Accounts Receivable Number of invoices, number of customers
b. Central Purchasing Number of requisitions, number of purchase
orders
E14–4
a. 6 e. 8
447
E14–5
a. Government
Residential Commercial Contract Total
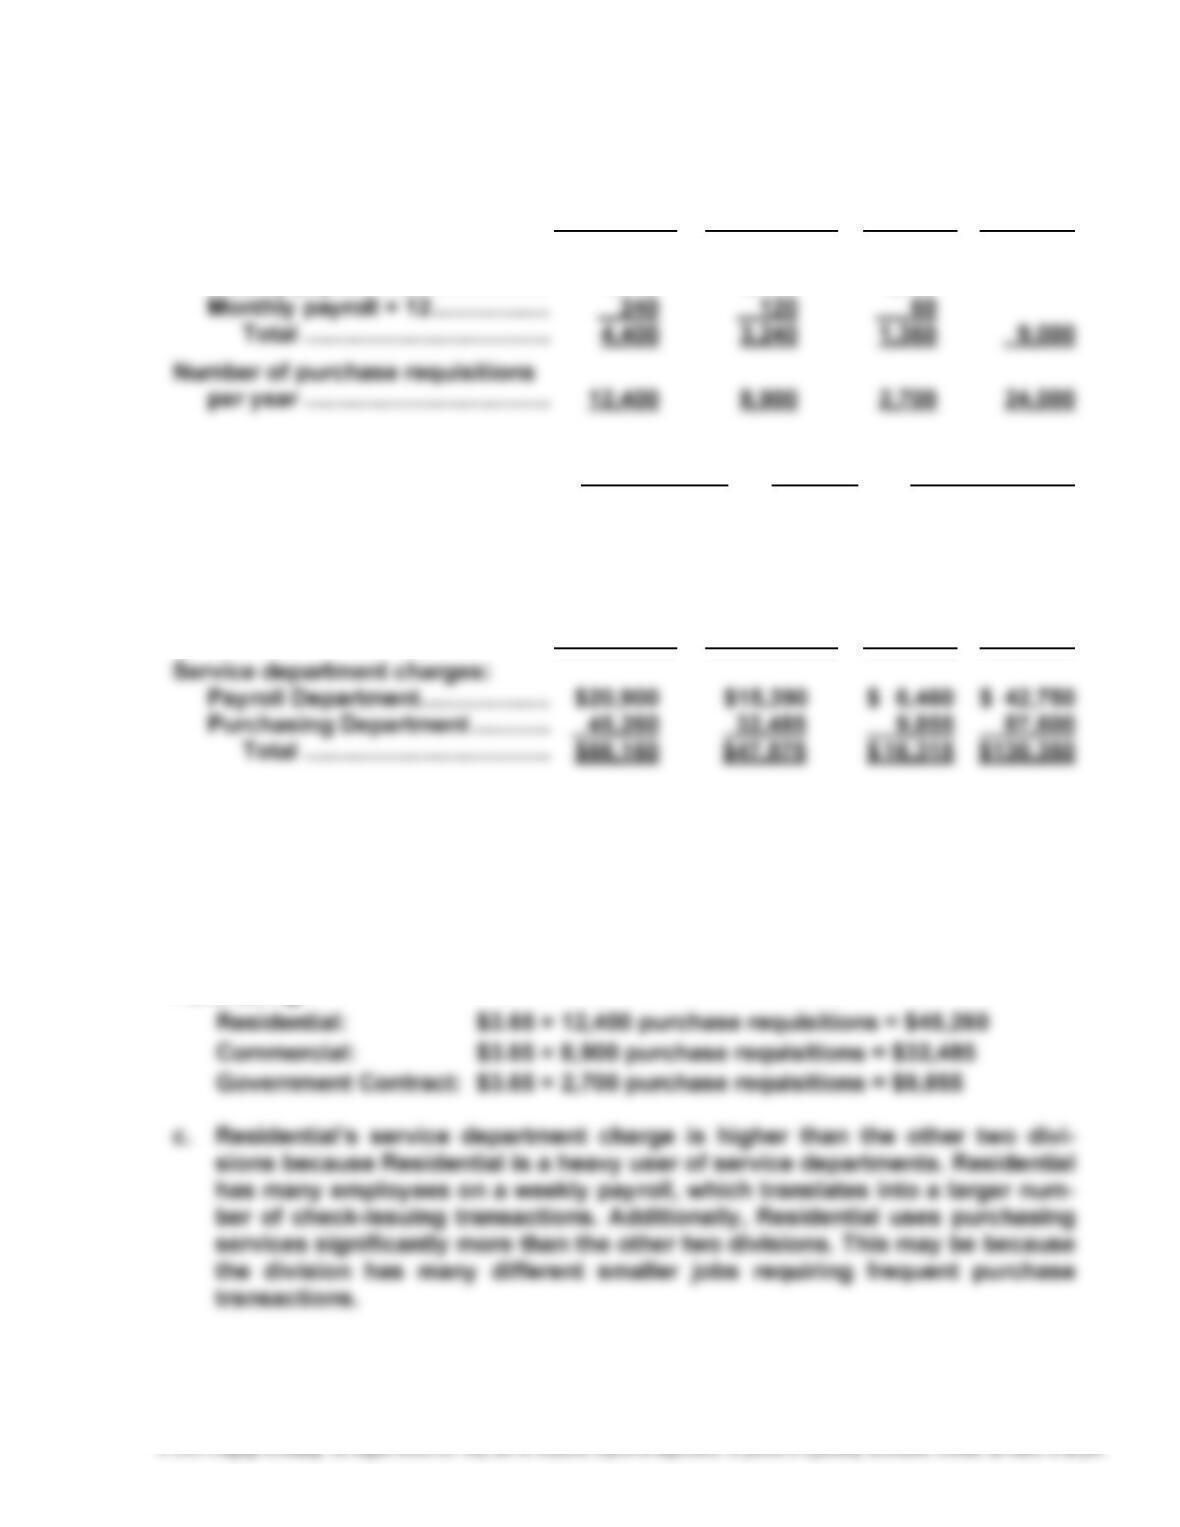
Number of payroll checks:
Weekly payroll × 52 ………………. 4,160 3,120 1,300
b. Service Dept. Activity Charge
Cost ÷ Base = Rate
Service department charge rates:
Payroll Department ……………….. $42,750 ÷ 9,000 = $4.75 per check
Purchasing Department ………… $87,600 ÷ 24,000 = $3.65 per req.
Government
Residential Commercial Contract Total
The service department charges are determined by multiplying the service
department charge rate by the activity base for each division as shown next.
Payroll:
Residential: $4.75 × 4,400 checks = $20,900
Commercial: $4.75 × 3,240 checks = $15,390
Government Contract: $4.75 × 1,360 checks = $6,460
Purchasing:
448
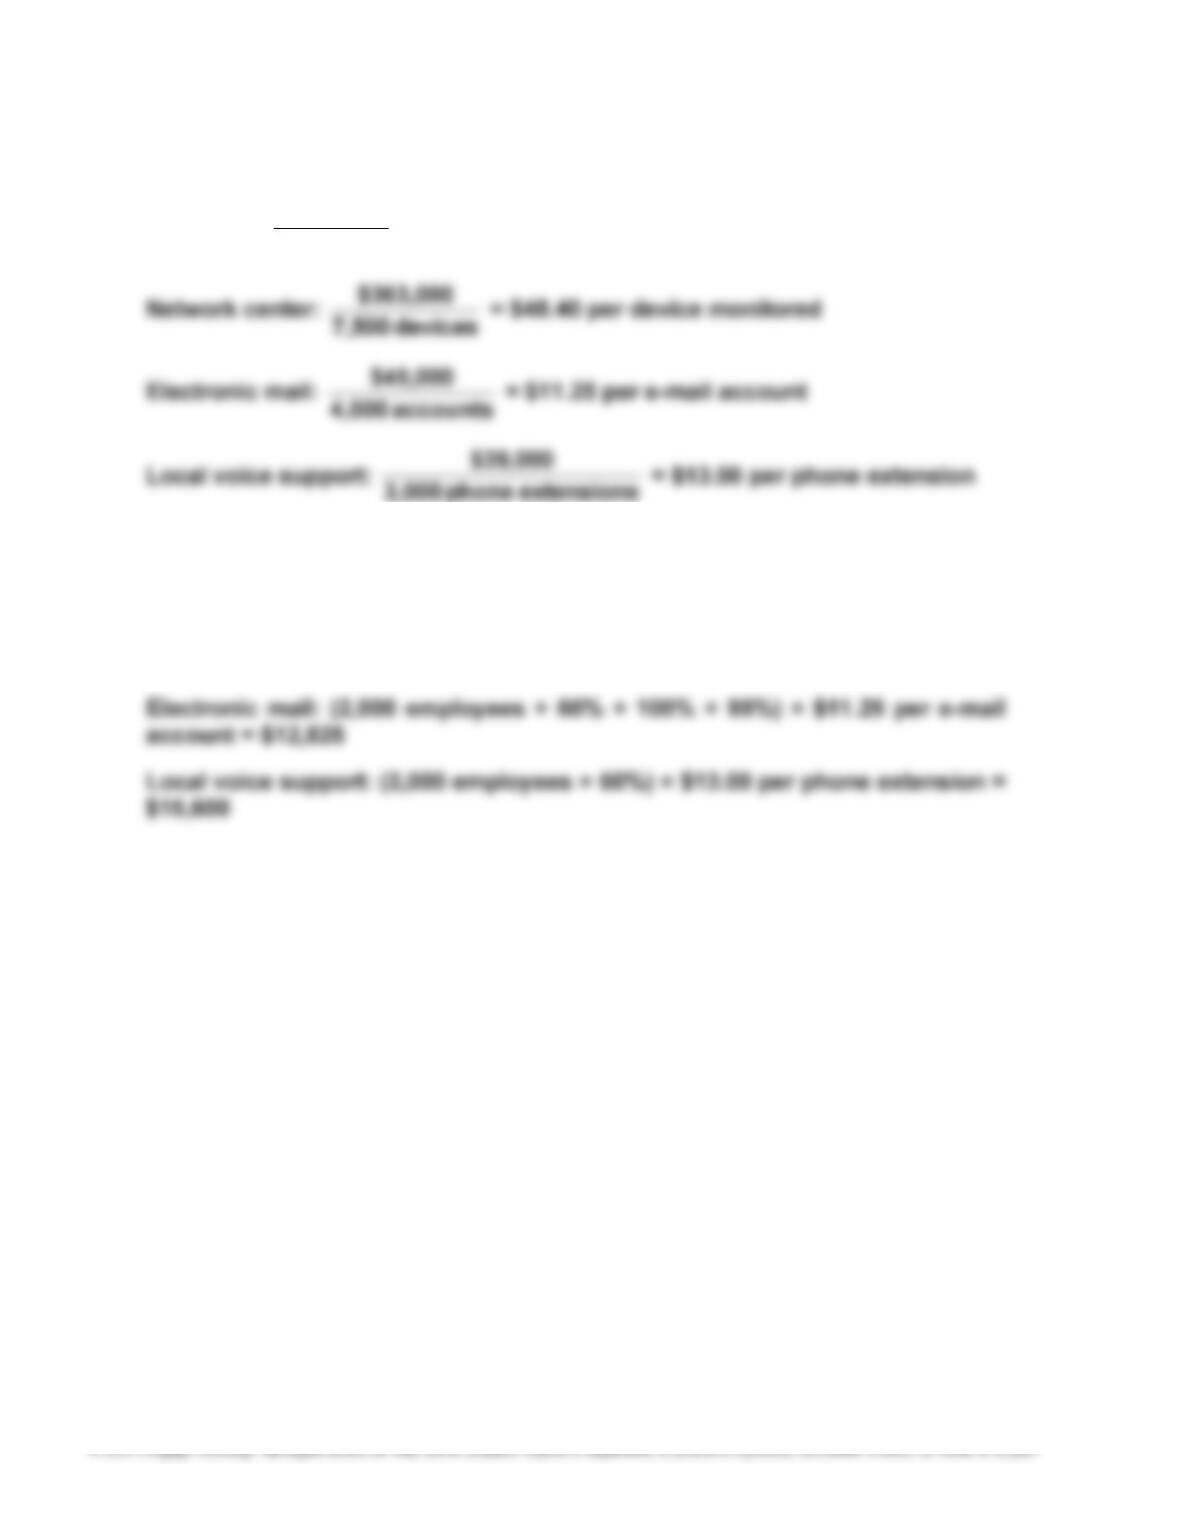
E14–6
a. Help desk: calls 5,000
$135,000 = $27.00 per call
b. February charges to the Electronics sector:
Help desk: (2,000 employees × 60% × 100% × 0.45) × $27.00 per call = $14,580
Network center: [(2,000 employees × 60% × 100%) + 80] × $48.40 per device =
$61,952
449
E14–7
POWER SPORTS COMPANY
Divisional Income Statements
For the Year Ended December 31, 20Y7
Wholesale Division Retail Division
Revenues ………………………………… $24,600,000 $13,750,000
Cost of goods sold ………………….. (14,500,000) (8,000,000)
Gross profit …………………………….. $ 10,100,000 $ 5,750,000
Operating expenses …………………. (1,500,000) (400,000)
Operating income before
450
E14–8
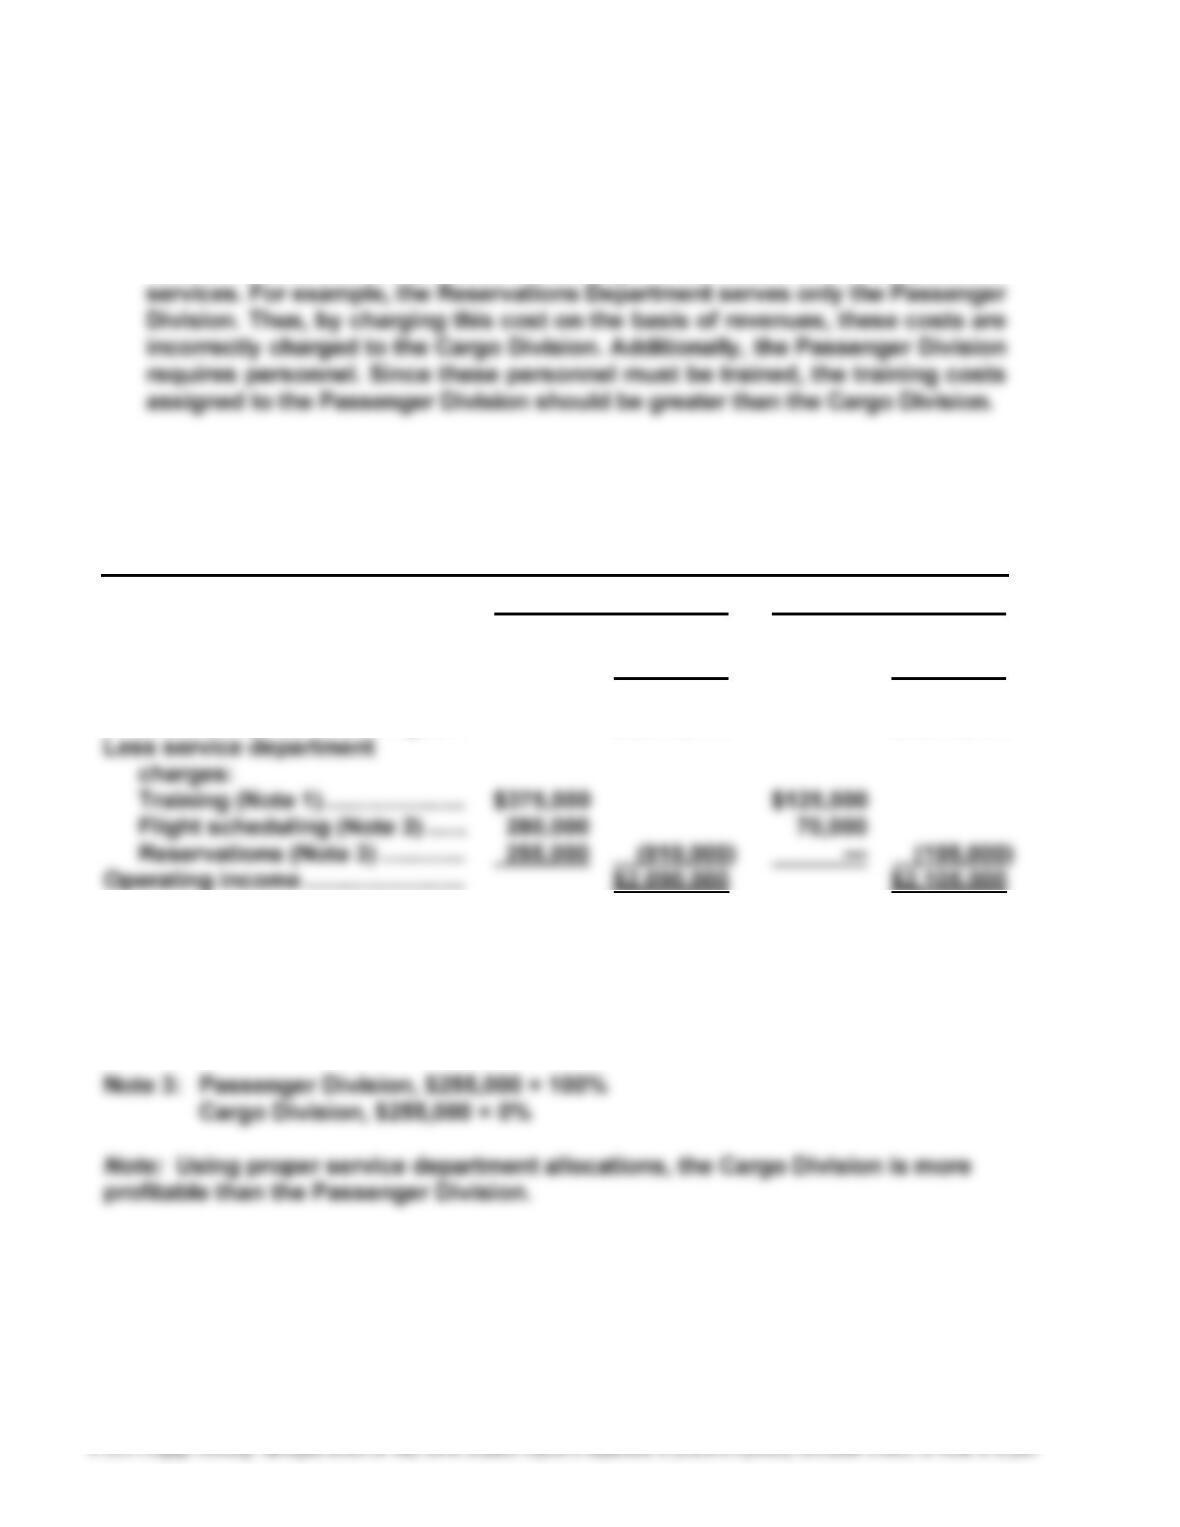
a. The reported operating income does not accurately measure performance
because the service department charges are based on revenues. Revenues are
not associated with the profit center manager’s use of the service department
b.
PANDA AIRLINES INC.
Divisional Income Statements
For the Year Ended April 30, 20Y9
Passenger Division Cargo Division
Revenues ………………………………… $7,500,000 $5,000,000
Operating expenses ………………… (4,500,000) (2,700,000)
Operating income before
service department charges … $3,000,000 $2,300,000
Note 1: Passenger Division, ($500,000 ÷ 800 personnel trained) × 600
Cargo Division, ($500,000 ÷ 800 personnel trained) × 200
Note 2: Passenger Division, ($350,000 ÷ 5,000 flights) × 4,000
Cargo Division, ($350,000 ÷ 5,000 flights) × 1,000
451
E14–9
HUTCHINSON SPORTS CO.
Divisional Income Statements
For the Year Ended November 30, 20Y1
Action Team
Sports Sports
Division Division
Sales ………………………………………………………………… $ 9,250,000 $15,300,000
$(1,375,000) $ (1,775,000)
Operating income before service
department charges …………………………………….. $ 2,525,000 $ 3,925,000
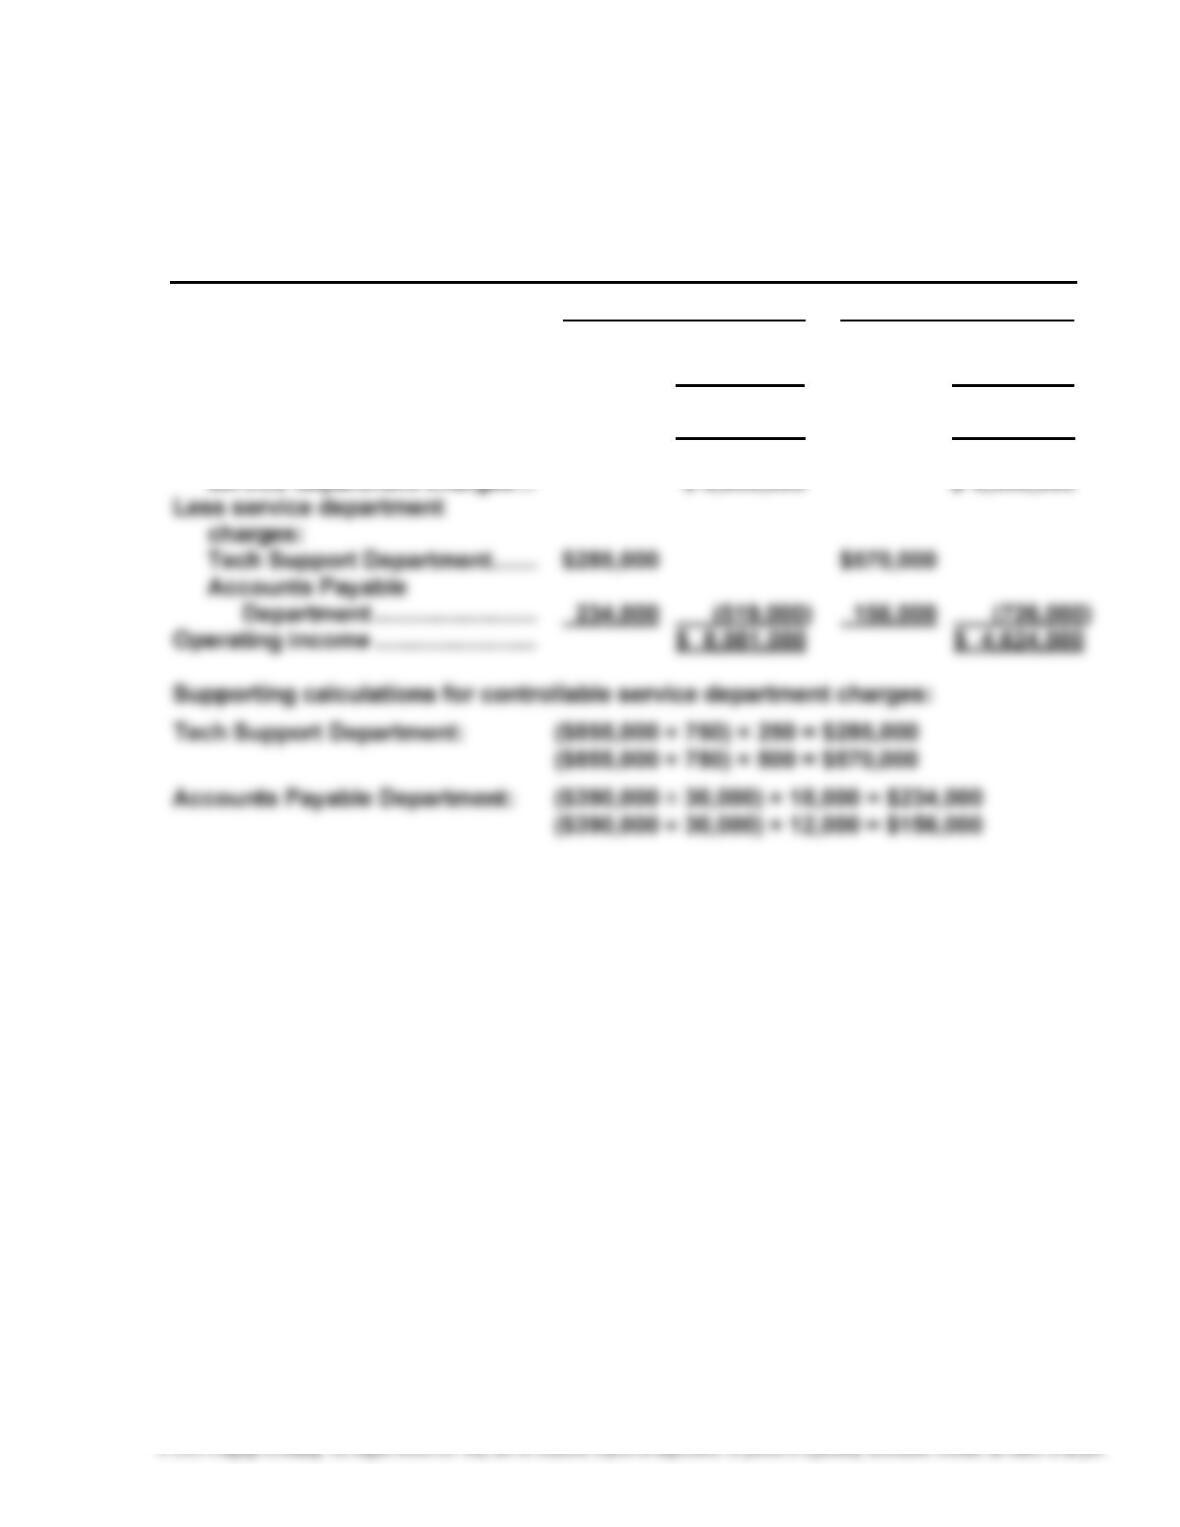
Less service department charges:
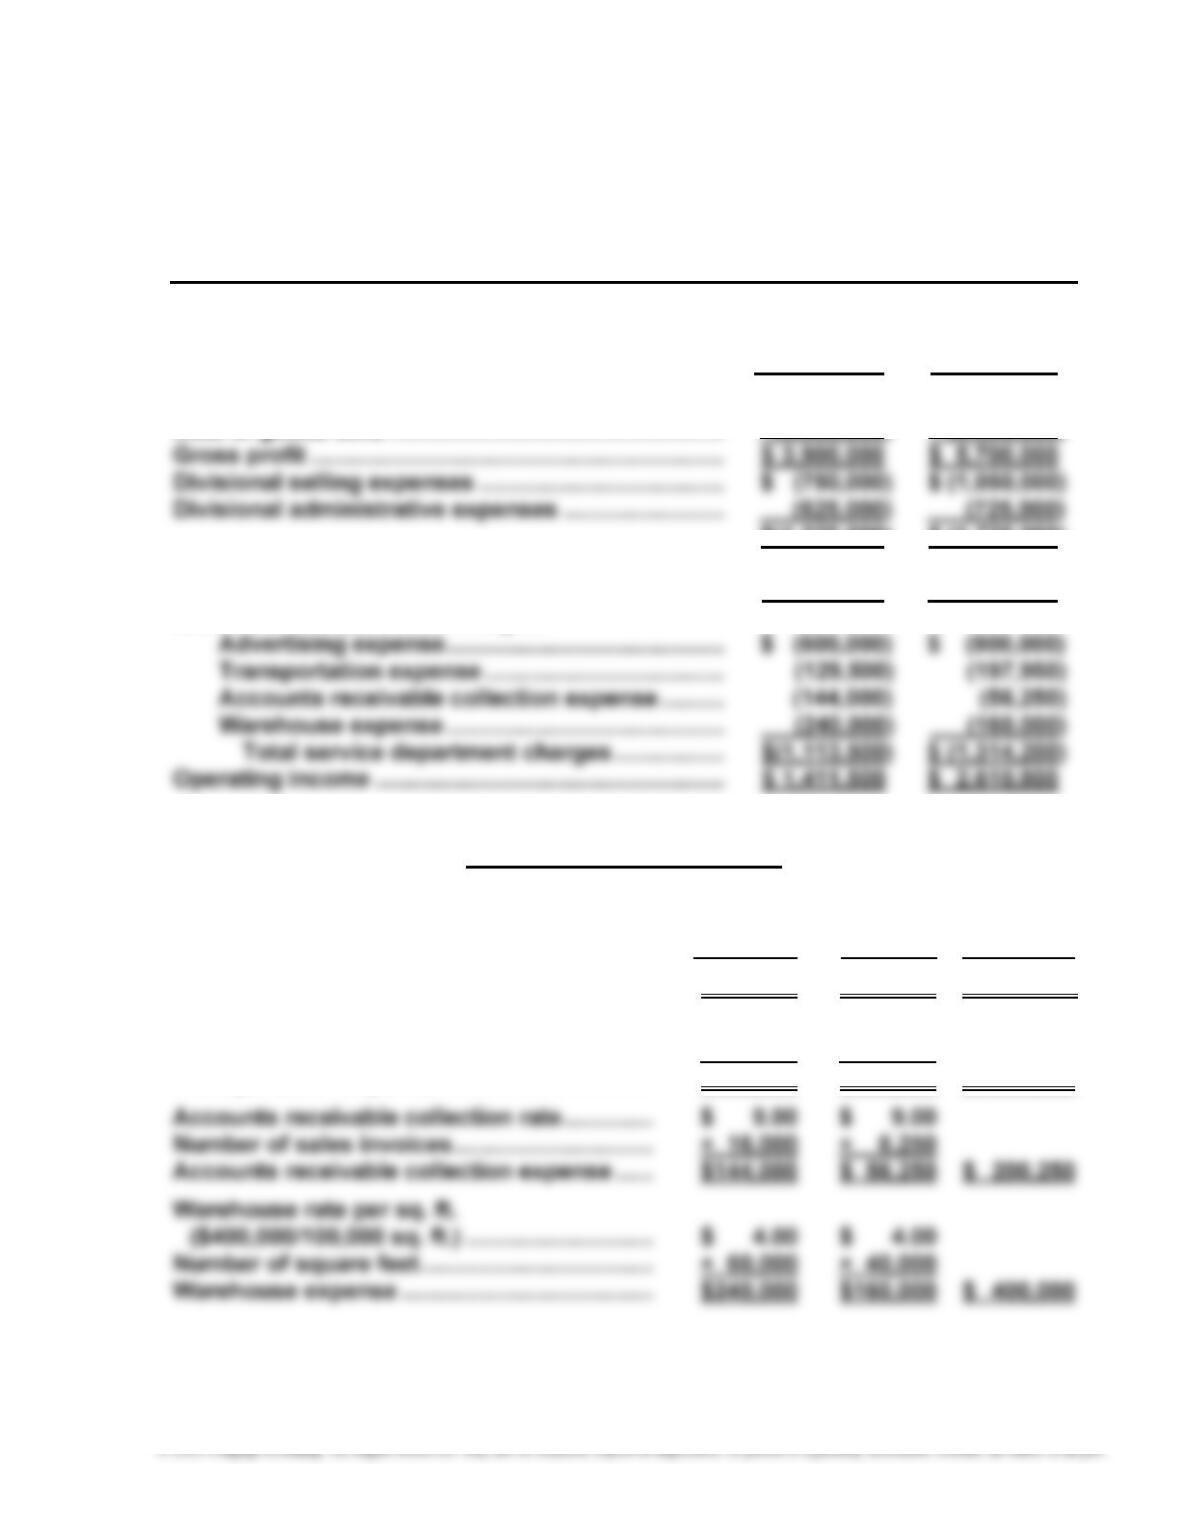
Supporting Schedule:
Service Department Charges
Action Team
Sports Sports
Division Division Total
Advertising expense ………………………………… $600,000 $900,000 $1,500,000
Transportation rate per bill of lading ………… $ 18.50 $ 18.50
Number of bills of lading ………………………….. × 7,000 × 10,700
Transportation expense …………………………… $129,500 $197,950 $ 327,450
452
E14–10
a. Retail Division: 20% ($4,000,000 ÷ $20,000,000)
Commercial Division: 17% ($6,375,000 ÷ $37,500,000)
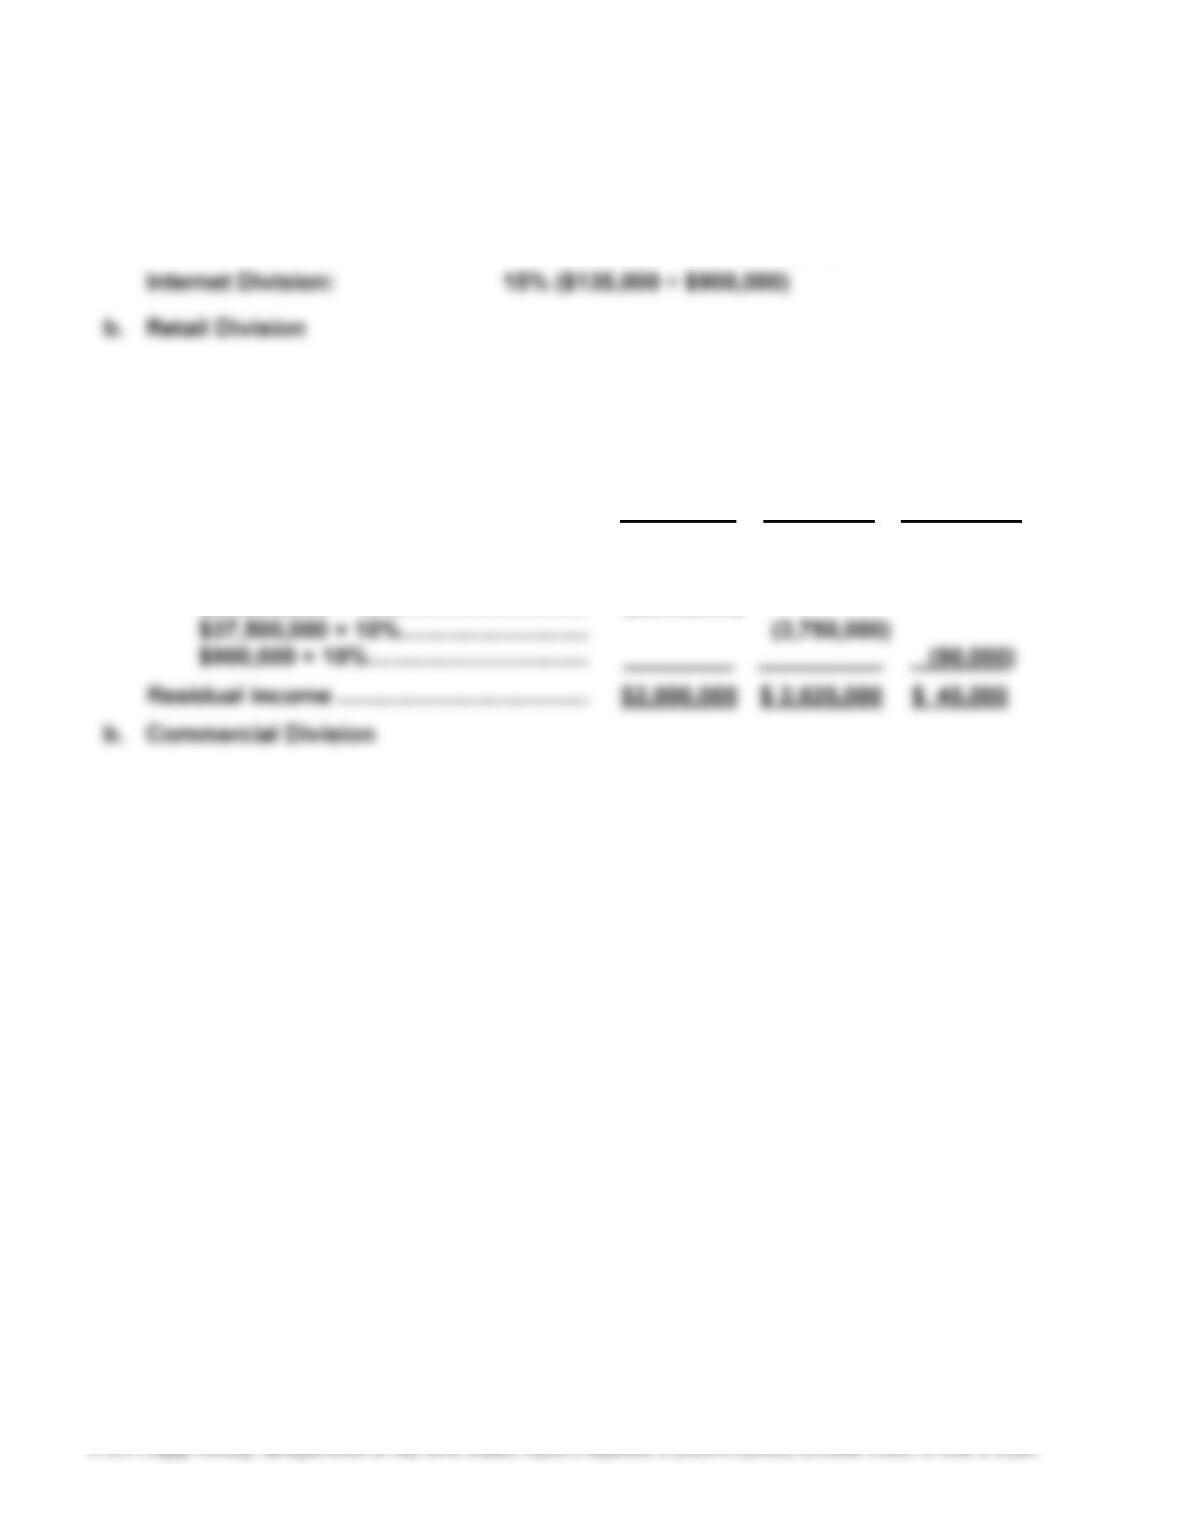
E14–11
a.
Retail Commercial Internet
Division Division Division
Operating income ………………………………. $4,000,000 $ 6,375,000 $135,000
Minimum amount of operating income:
$20,000,000 × 10% ……………………….. (2,000,000)
453
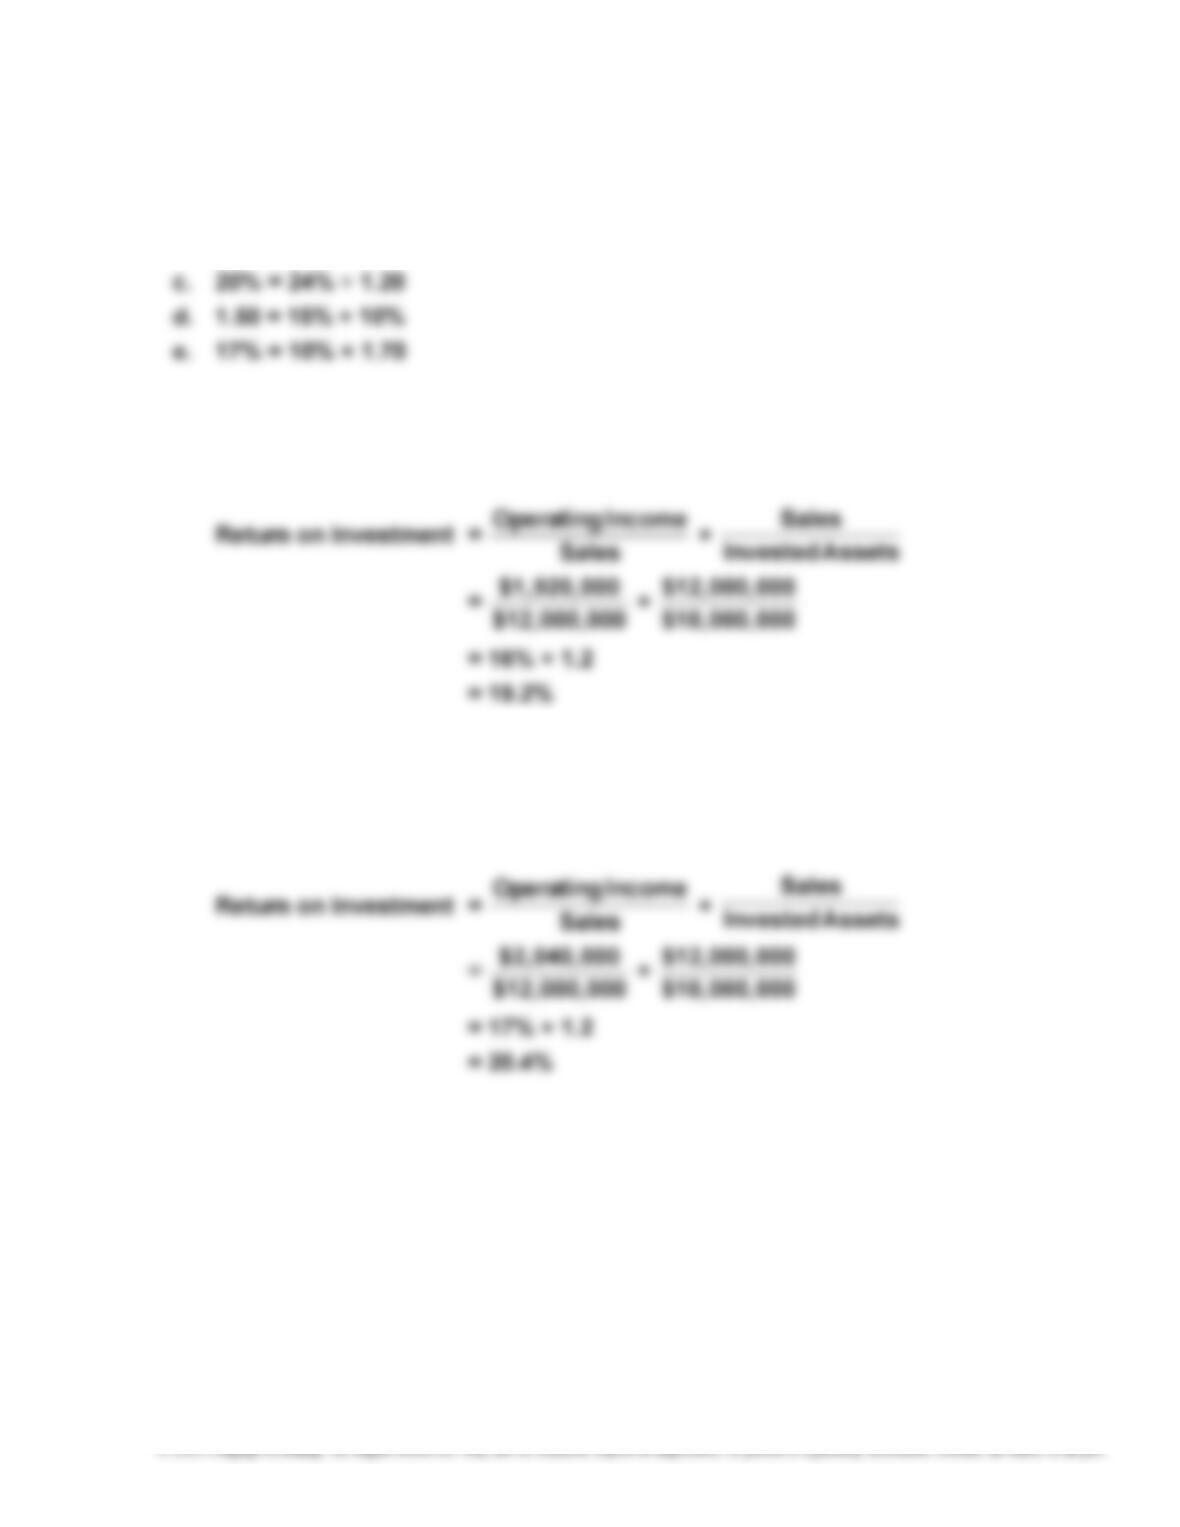
E14–12
a. 1.50 = 12% ÷ 8%
b. 20% = 16% × 1.25
E14–13
a. Return on Investment = Profit Margin × Investment Turnover
b. The profit margin would increase from 16% to 17%, the investment turnover
would remain unchanged, and the return on investment would increase from
19.2% to 20.4%, as shown next.
Return on Investment = Profit Margin × Investment Turnover
454
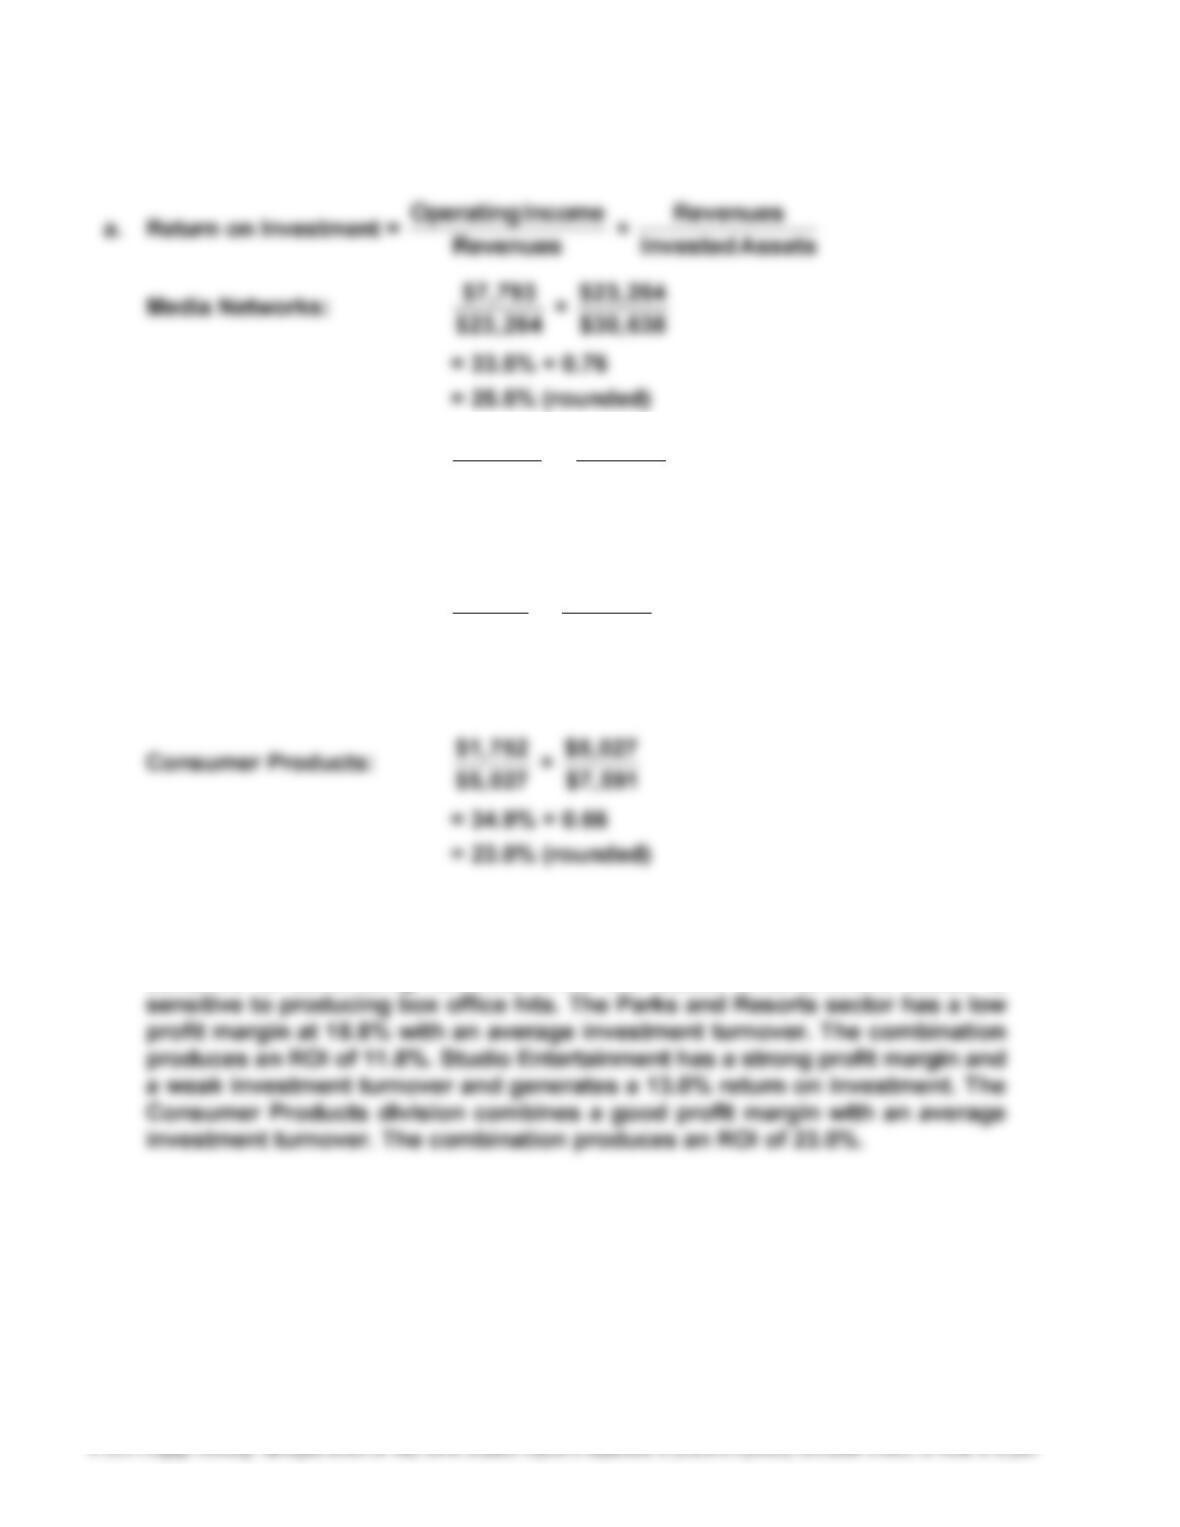
E14–14
Parks and Resorts: $3,031
$16,162 × $16,162
$25,510
= 18.8% × 0.63
= 11.8% (rounded)
Studio Entertainment: $1,973
$6,838 × $6,838
$15,334
= 28.9% × 0.45
= 13.0% (rounded)
b. The four sectors are different from each other. Media Networks combines a
good profit margin with an average investment turnover. Media Networks is
sensitive to advertising revenue, while the Studio Entertainment sector is
455
E14–15
a. 16% ($400,000 ÷ $2,500,000)
e. 14% ($840,000 ÷ $6,000,000)
f. 10% ($600,000 ÷ $6,000,000)
g. $1,500,000 ($7,500,000 × 20%)
h. 12% ($900,000 ÷ $7,500,000)
i. $600,000 ($1,500,000 – $900,000)
456
E14–16
a. (a) $1,200,000 ($6,000,000 × 20%)
(b) $7,500,000 ($1,200,000 ÷ 16%)
(f) 16.8% (12% × 1.4) or ($1,512,000 ÷ $9,000,000)
(g) $1,925,000 ($11,000,000 × 17.5%)
(h) 14% ($1,925,000 ÷ $13,750,000)
(i) 1.25 ($13,750,000 ÷ $11,000,000) or (17.5% ÷ 14%)
b. California Division: $450,000 [$1,200,000 – ($7,500,000 × 10%)]
Midwest Division: $612,000 [$1,512,000 – ($9,000,000 × 10%)]
Northwest Division: $825,000 [$1,925,000 – ($11,000,000 × 10%)]
Texas Division: $490,000 [$840,000 – ($3,500,000 × 10%)]
457
E14–17 Appendix
a. Increase in Childs Manufacturing’s
Operatin
g
Income = Market
Price – Variable Cost
per Unit × Units
Transferred
$187,500 = ($12.50 – $10.00) × 75,000 units
g
g
458
E14–18 Appendix
a. Increase in Childs Manufacturing’s
Operatin
g
Income = Market
Price – Variable Cost
per Unit × Units
Transferred
$187,500 = ($12.50 – $10.00) × 75,000 units
g
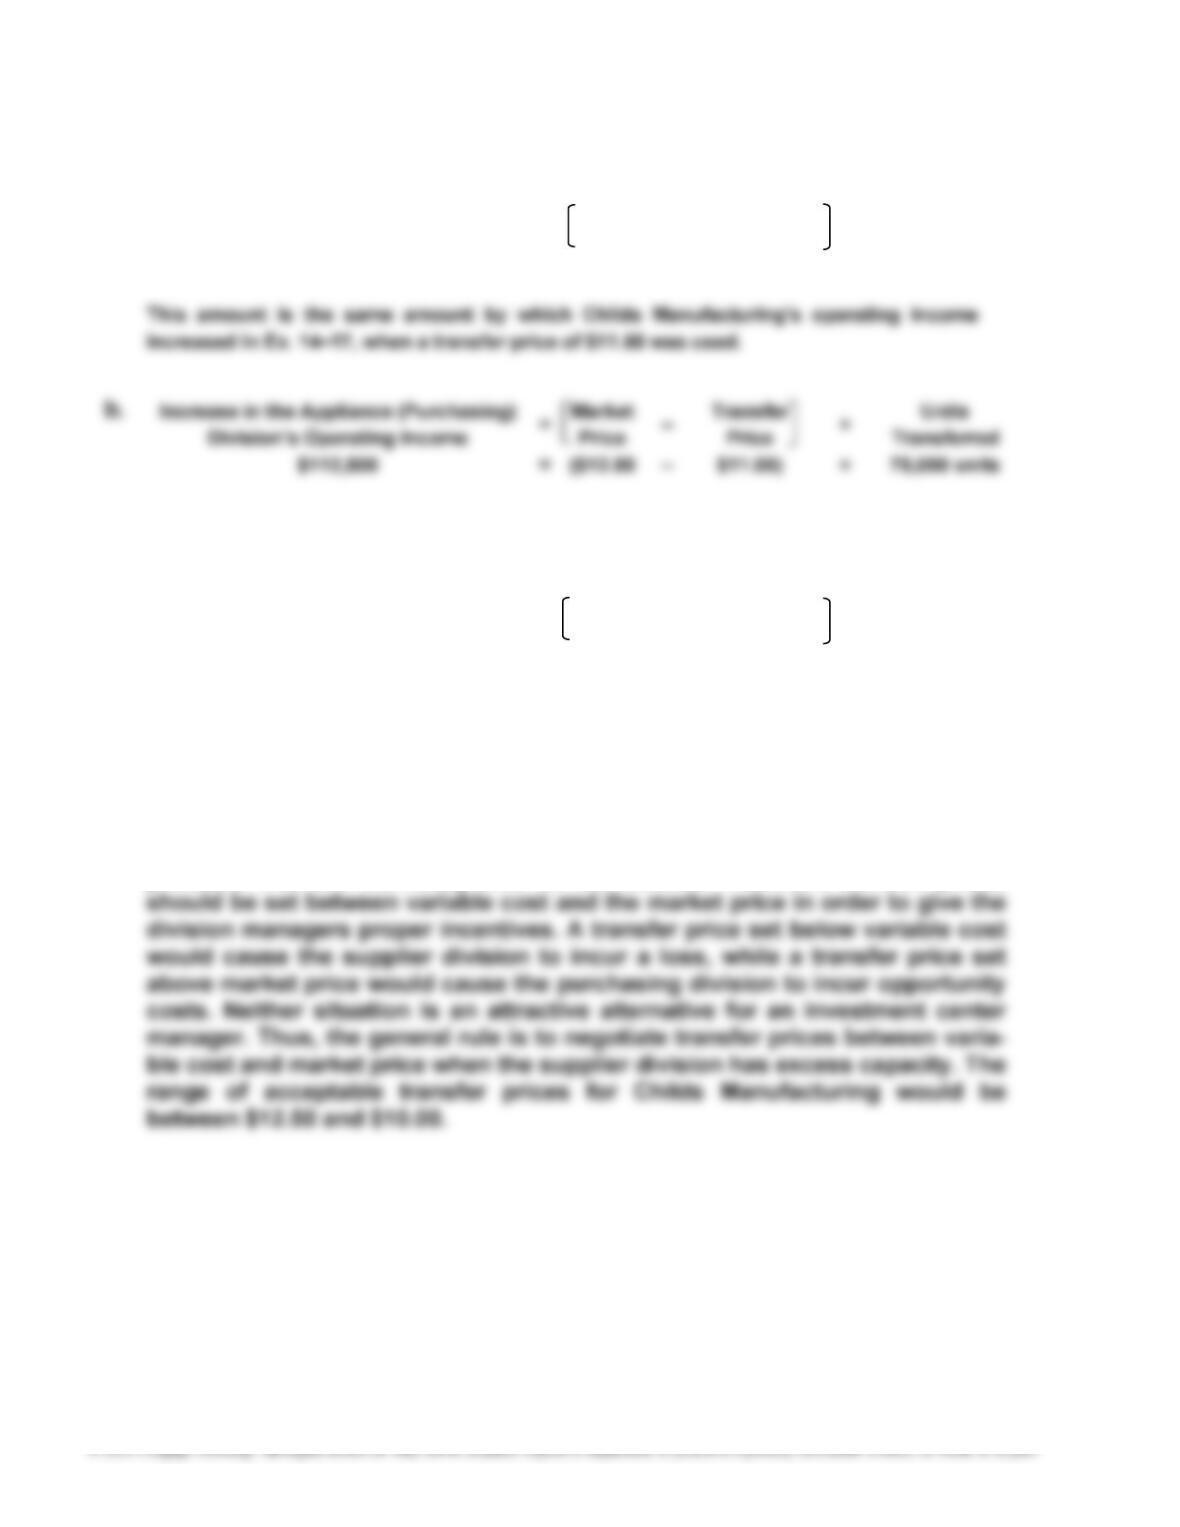
This is the amount the Appliance Division saves by purchasing from the Electronics Division
at an internal price that is lower than the market price.
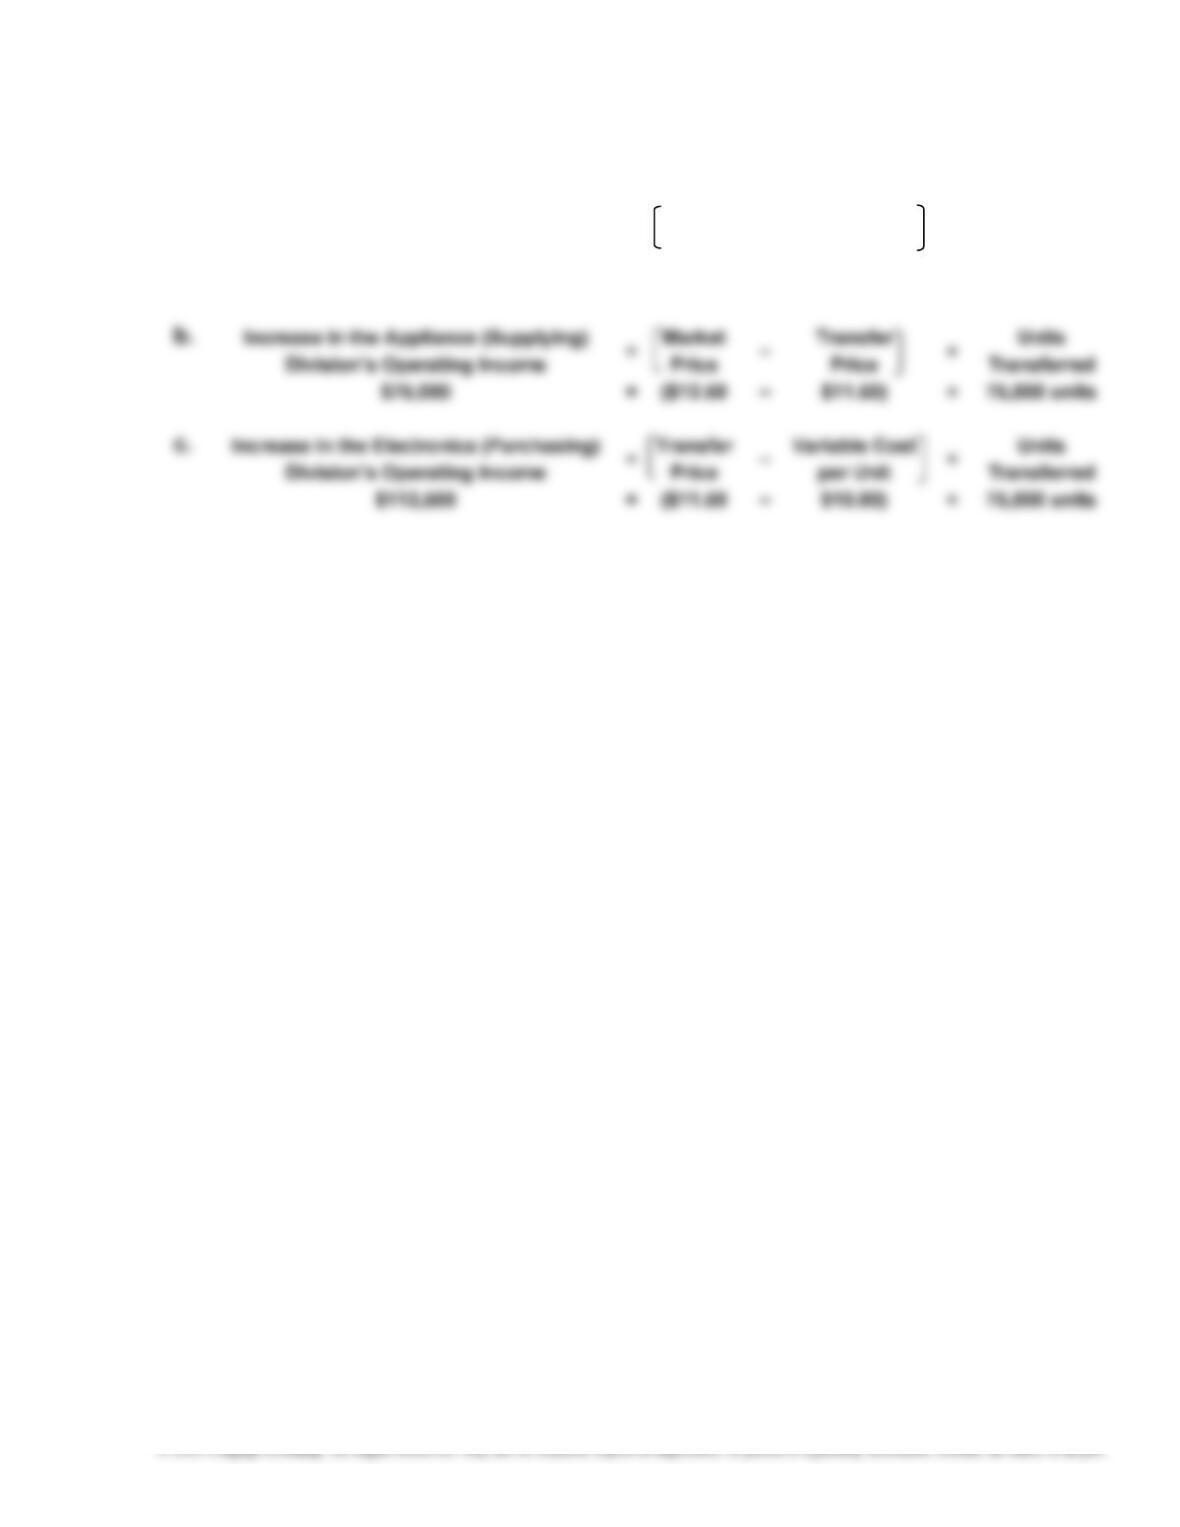
c. Increase in the Electronics (Supplying)
Division’s Operatin
g
Income = Transfer
Price – Variable Cost
per Unit × Units
Transferred
$75,000 = ($11.00 – $10.00) × 75,000 units
This is the amount the Appliance Division earns by using available excess
capacity to produce and sell products above variable cost to the Electronics
Division.
d. Any transfer price will cause the total income of the company to increase, as
long as the supplier division’s capacity is used toward making materials for
products that are ultimately sold to the outside. However, transfer prices
459
PROBLEMS
P14–1
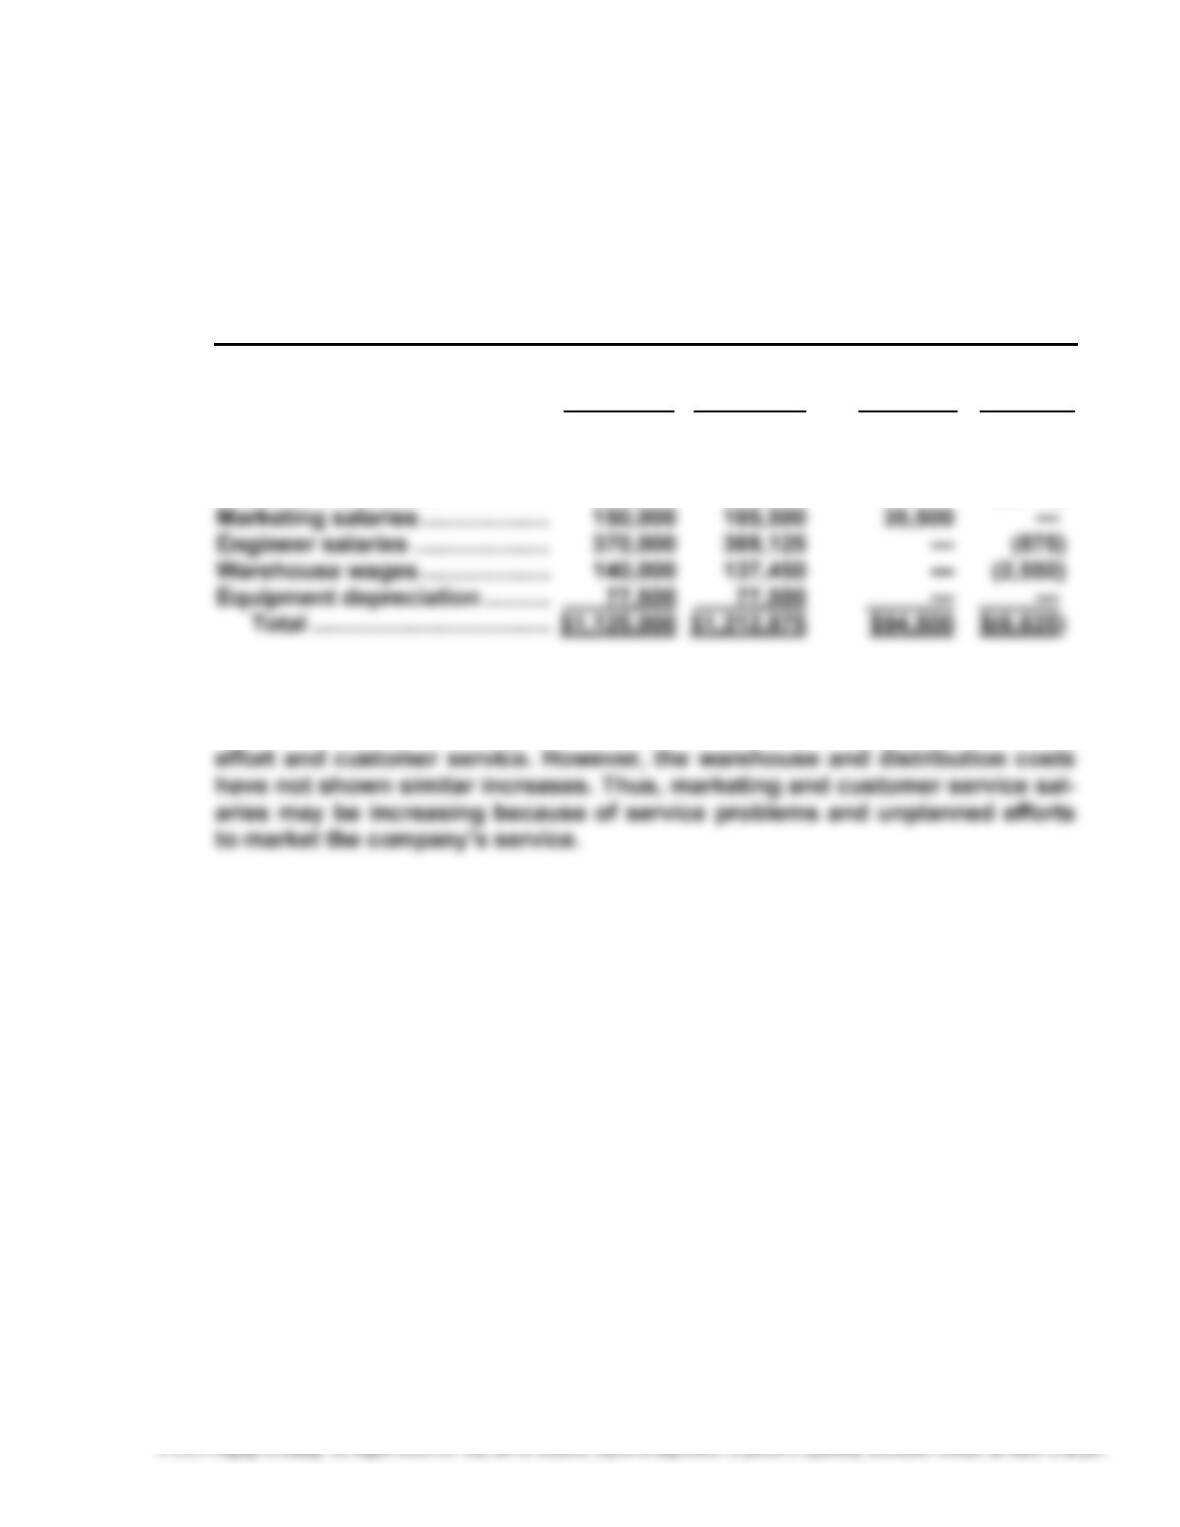
1. RAPTOR COMPANY
Budget Performance Report—Director, Bulldozer Division
For the Month Ended August 31, 20Y6
Over (Under)
Budget Actual Budget Budget
Customer service salaries ……. $ 125,000 $ 184,000 $59,000 $ —
Insurance and property taxes 25,000 24,550 — (450)
Distribution salaries …………….. 237,500 234,750 — (2,750)
2. The customer service and marketing salaries are significantly over budget.
The director should investigate the cause of these results. One possibility is
that the company is having an increase in sales, requiring greater marketing
460
P14–2
1.
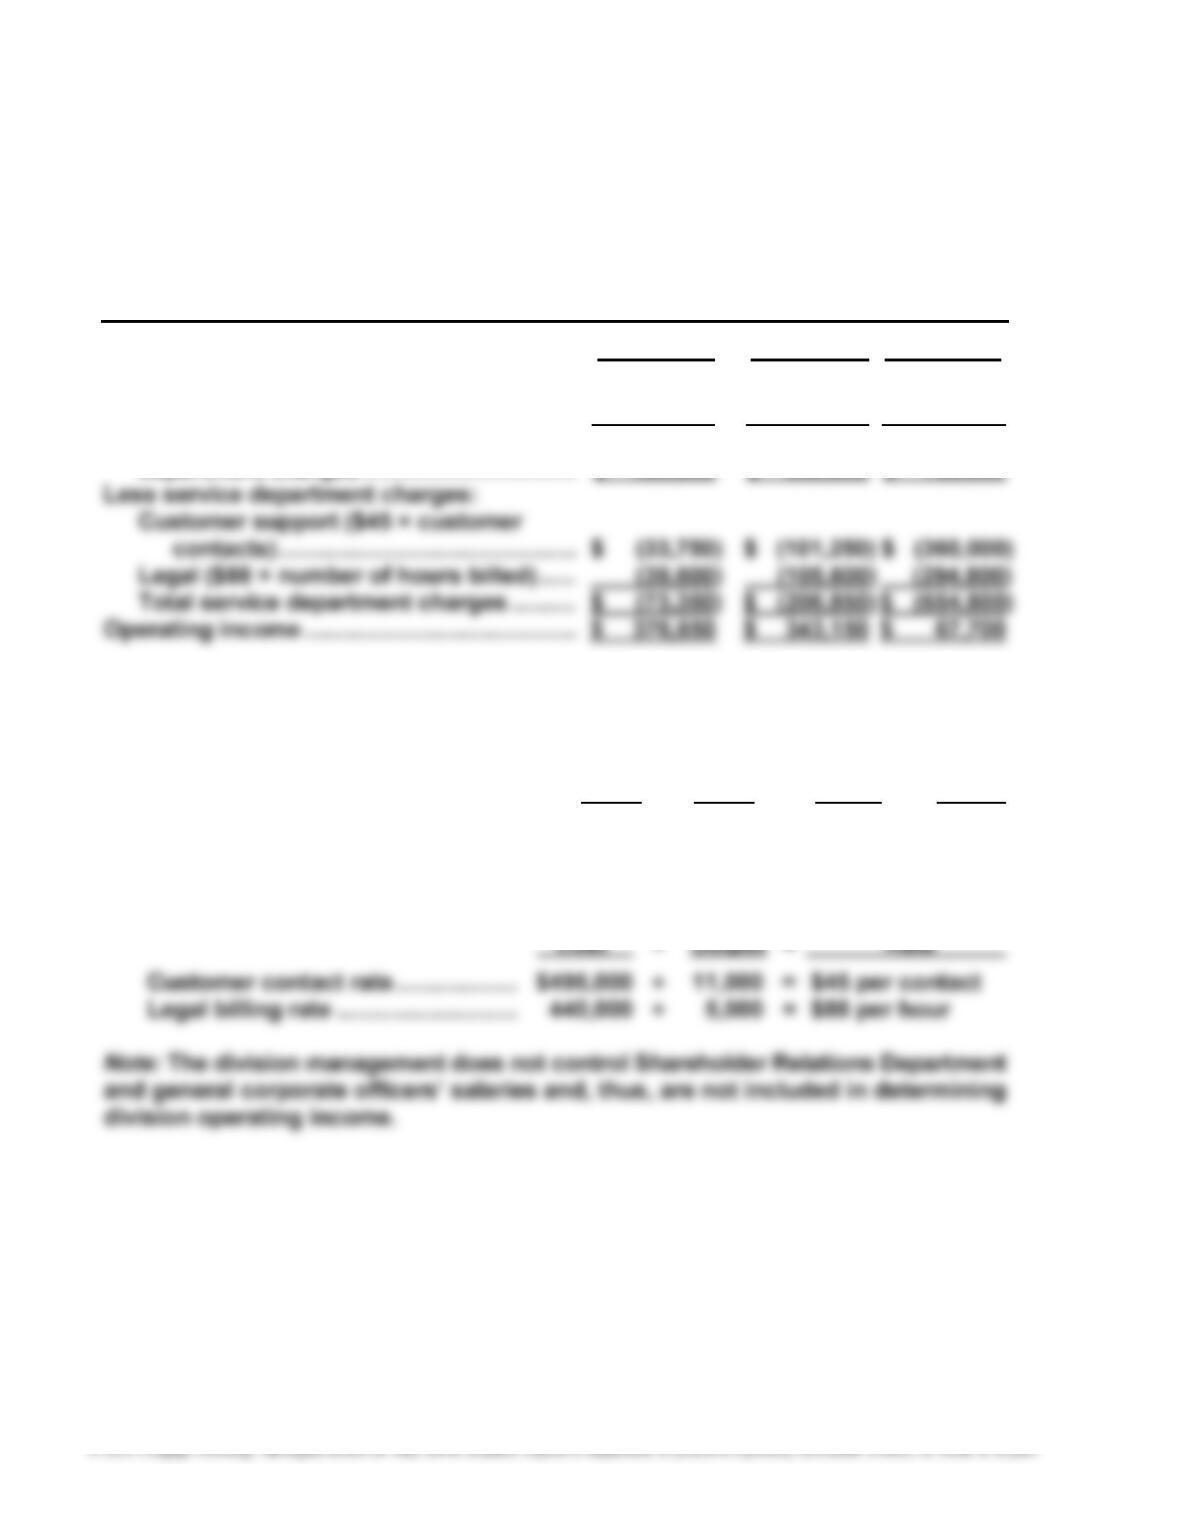
CARRY ON FREIGHT INC.
Divisional Income Statements
For the Quarter Ended December 31, 20Y3
Air Rail Truck
Revenues ……………………………………………….. $ 2,500,000 $ 3,000,000 $ 4,500,000
Operating expenses ……………………………….. (2,050,000) (2,450,000) (3,777,500)
Operating income before service
Supporting schedules:
Service department charge rates for the two service departments, Customer
Support and Legal, are determined as follows:
Air Rail Truck Total
Number of customer contacts …… 750 2,250 8,000 11,000
Number of hours billed ……………… 450 1,200 3,350 5,000
Service
461
P14–2, Concluded
2. The CEO evaluates the three divisions using operating income as a percent of
revenues (profit margin). This measure is calculated for the three divisions as
follows:
Air Division: 15.1% ($376,650 ÷ $2,500,000)
3. To: CEO
The method used to evaluate the performance of the divisions should be
reevaluated. The present method identifies the amount of operating income
per dollar of earned revenue. However, this company requires a significant in-
vestment in fixed assets and distribution facilities. In addition, the amount of
assets may not be related to the revenue earned. For example, some divisions