Chapter 14 – Analyzing Financial Statements
Chapter 14
Analyzing Financial Statements
ANSWERS TO QUESTIONS
1. Primary items on the financial statements about which creditors usually are
2. The notes to the financial statements are particularly important to decision
makers because they explain, usually in narrative fashion, circumstances
3. The primary purpose of comparative financial statements is to provide the
user with information on the short-term trends of the various financial
factors reported in the financial statements. For example, the trends of such
4. Statement users are interested especially in financial summaries covering
several years because the long-term trends of the business are revealed.
Statement users must make projections of the future performance of the
Chapter 14 – Analyzing Financial Statements
14–2
5. Ratio analysis is a technique for computing and pinpointing certain
significant relationships in the financial statements. A ratio or percent
6. Component percentages are representations, as ratios or percents, of the
relationships between each of the several individual amounts that make up a
7. Fundamentally, return on investment is income divided by investment. The
two concepts of return on investment are:
(a) Return on equity (net income divided by owners’ investment). This rate
reflects the return earned for the owners after deducting the return to
8. Financial leverage percentage is measured as the difference between the
rate of return on equity and the rate of return on assets. This difference is
Chapter 14 – Analyzing Financial Statements
14-3
9. Profit margin is the ratio between net income and net sales. It reflects
performance in respect to the control of expenses to net sales but is
10. The current ratio is computed by dividing total current assets by total current
liabilities. In contrast, the quick ratio is computed by dividing quick assets
11. A debt/equity ratio reflects the portion of total assets or resources used by a
business that was provided by creditors versus owners. In some companies,
the amount of debt is approximately 70 percent of the total assets which
12. Market tests are intended to measure the “market worth” per share of stock.
Market tests relate some amount to a share of stock (such as EPS or
13. The primary limitations associated with using ratios are:
(a) no specification exists (which is generally agreed upon) of how each ratio

Chapter 14 – Analyzing Financial Statements
14–4
ANSWERS TO MULTIPLE CHOICE
Chapter 14 – Analyzing Financial Statements
14-5
Authors’ Recommended Solution Time
(Time in minutes)
Mini-exercises
Exercises
Problems
Alternate
Problems
Cases and
Projects
No.
Time
No.
Time
No.
Time
No.
Time
No.
Time
1
5
1
20
1
60
1
60
1
50
2
5
2
20
2
45
2
45
2
50
9
5
9
20
9
20
10
5
10
20
10
50
11
20
12
20
13
20
14
25
15
25
* Due to the nature of this project, it is very difficult to estimate the amount of
time students will need to complete the assignment. As with any open-ended
3
5
3
20
3
60
3
20
3
60
4
5
4
25
4
20
4
60
4
45
5
5
5
15
5
60
5
60
5
20
6
5
6
20
6
30
6
30
6
30
7
5
7
20
7
60
7
30
7
8
5
8
20
8
30
Chapter 14 – Analyzing Financial Statements
MINI-EXERCISES
M14–1.
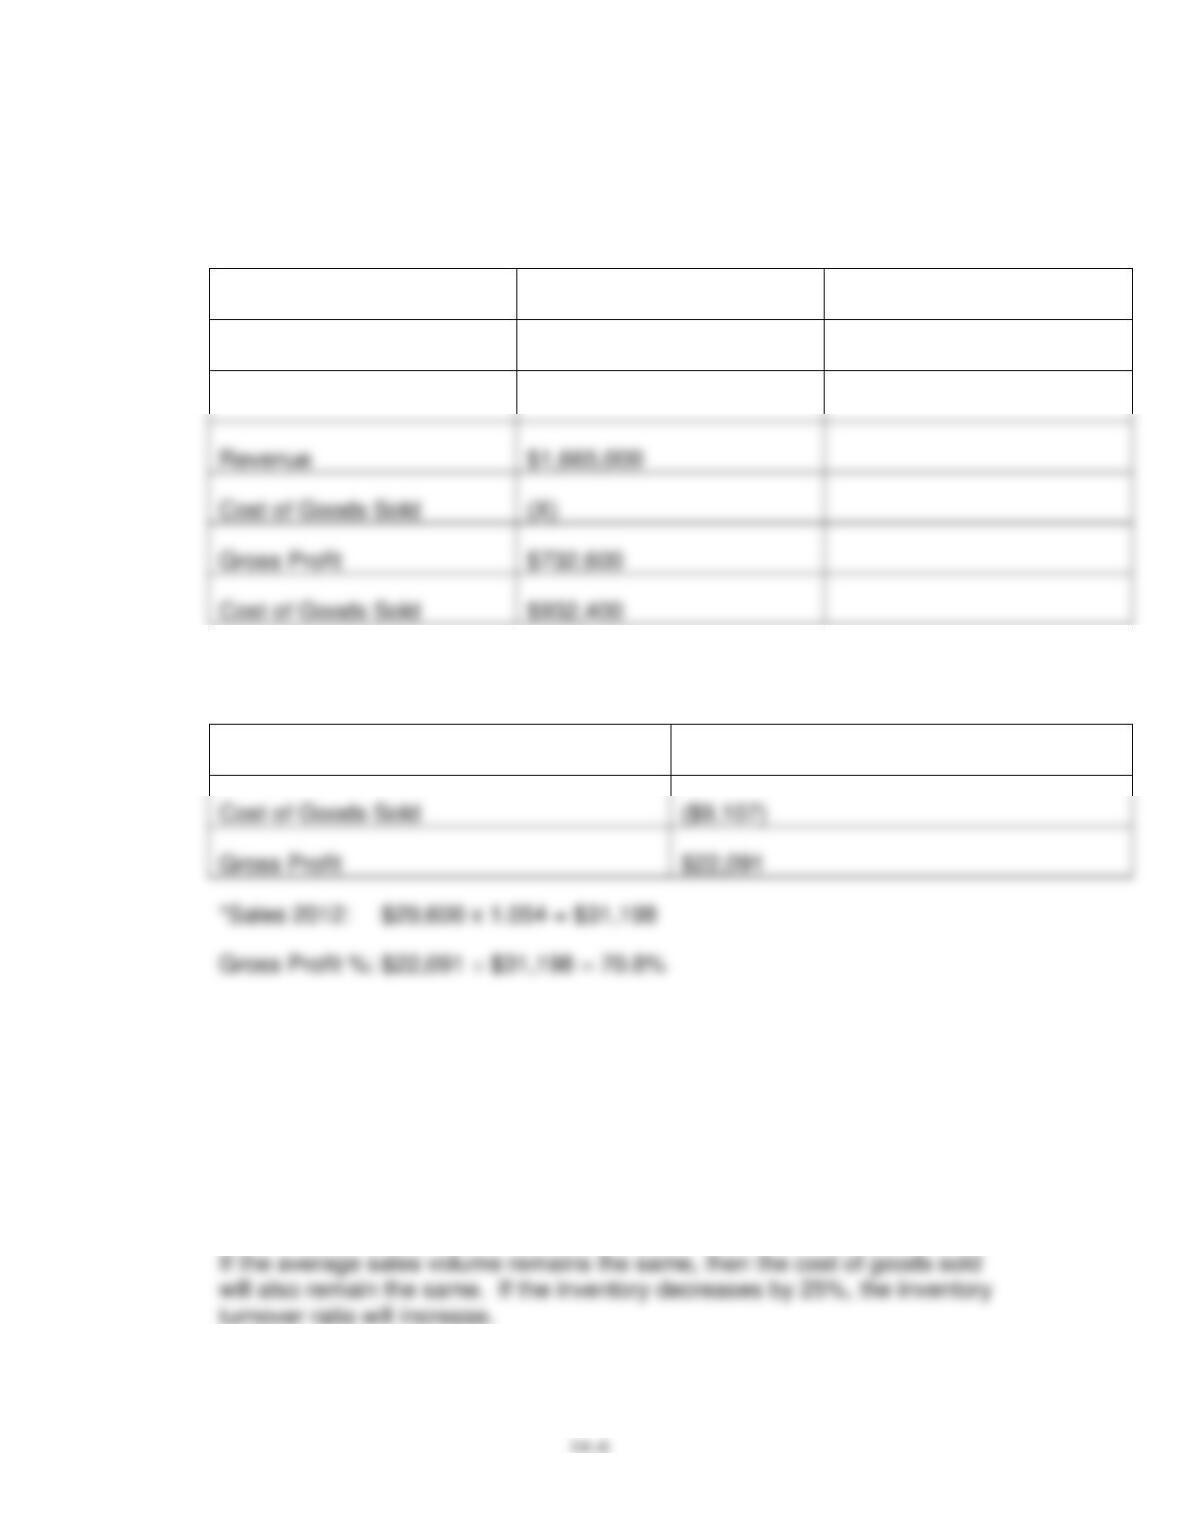
Gross Profit ÷ $1,665,000
=
44%
Gross Profit
=
$732,600
Revenue
Cost of Goods Sold
(X)
Gross Profit
$732,600
Cost of Goods Sold
$932,400
M14–2.
2012
Sales
$31,198 *
Cost of Goods Sold
($9,107)
Gross Profit
M14–3.
$183,000 / [($1,100,000 + $1,250,000) ÷ 2] = 15.6%
M14–4.
21% – 6% = 15%
M14–5.
Chapter 14 – Analyzing Financial Statements
M14–6.
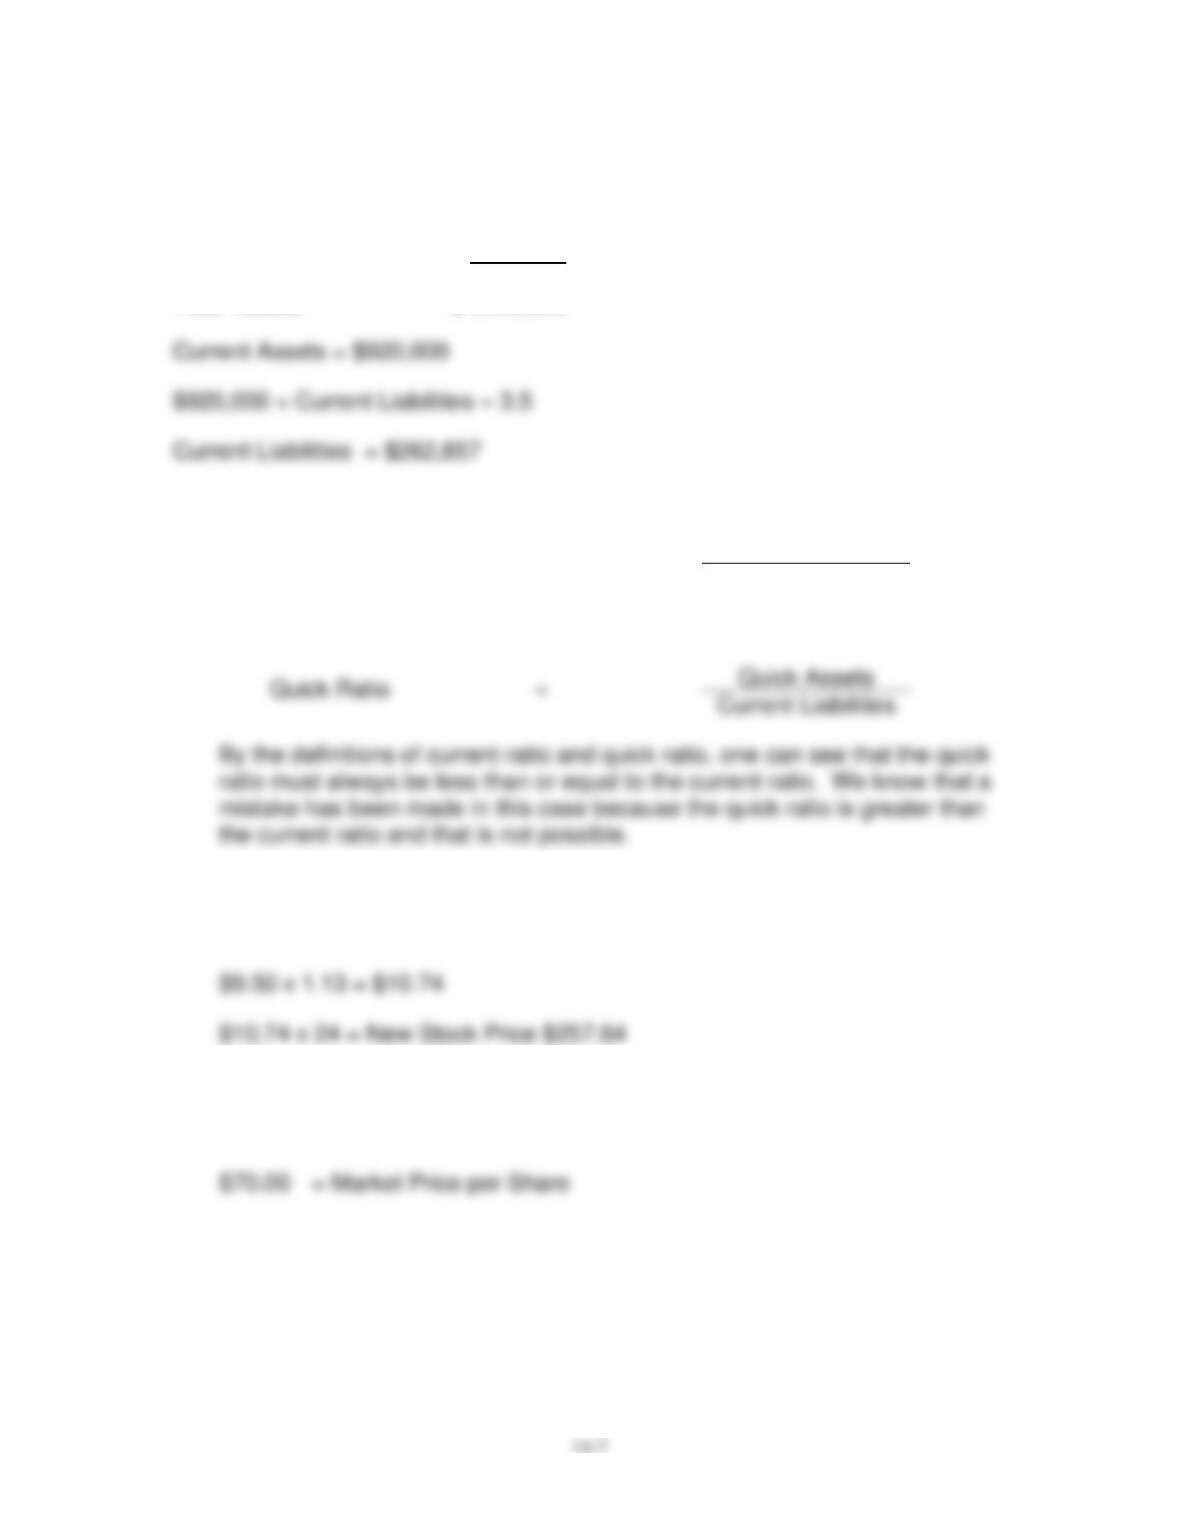
Current Assets X
+ Noncurrent Assets $480,000
Total Assets $1,400,000
M14–7.
Current Ratio
=
Current Assets
Current Liabilities
=
Quick Assets
Current Liabilities
M14–8.
Market Price per Share $228 ÷ Earnings per Share $9.50 = P/E multiplier 24
M14–9.
5% = $3.50 ÷ Market Price per Share
Chapter 14 – Analyzing Financial Statements
14–8
M14–10.
In most circumstances, a change from FIFO to LIFO will cause inventory to
decrease and cost of good sold to increase.
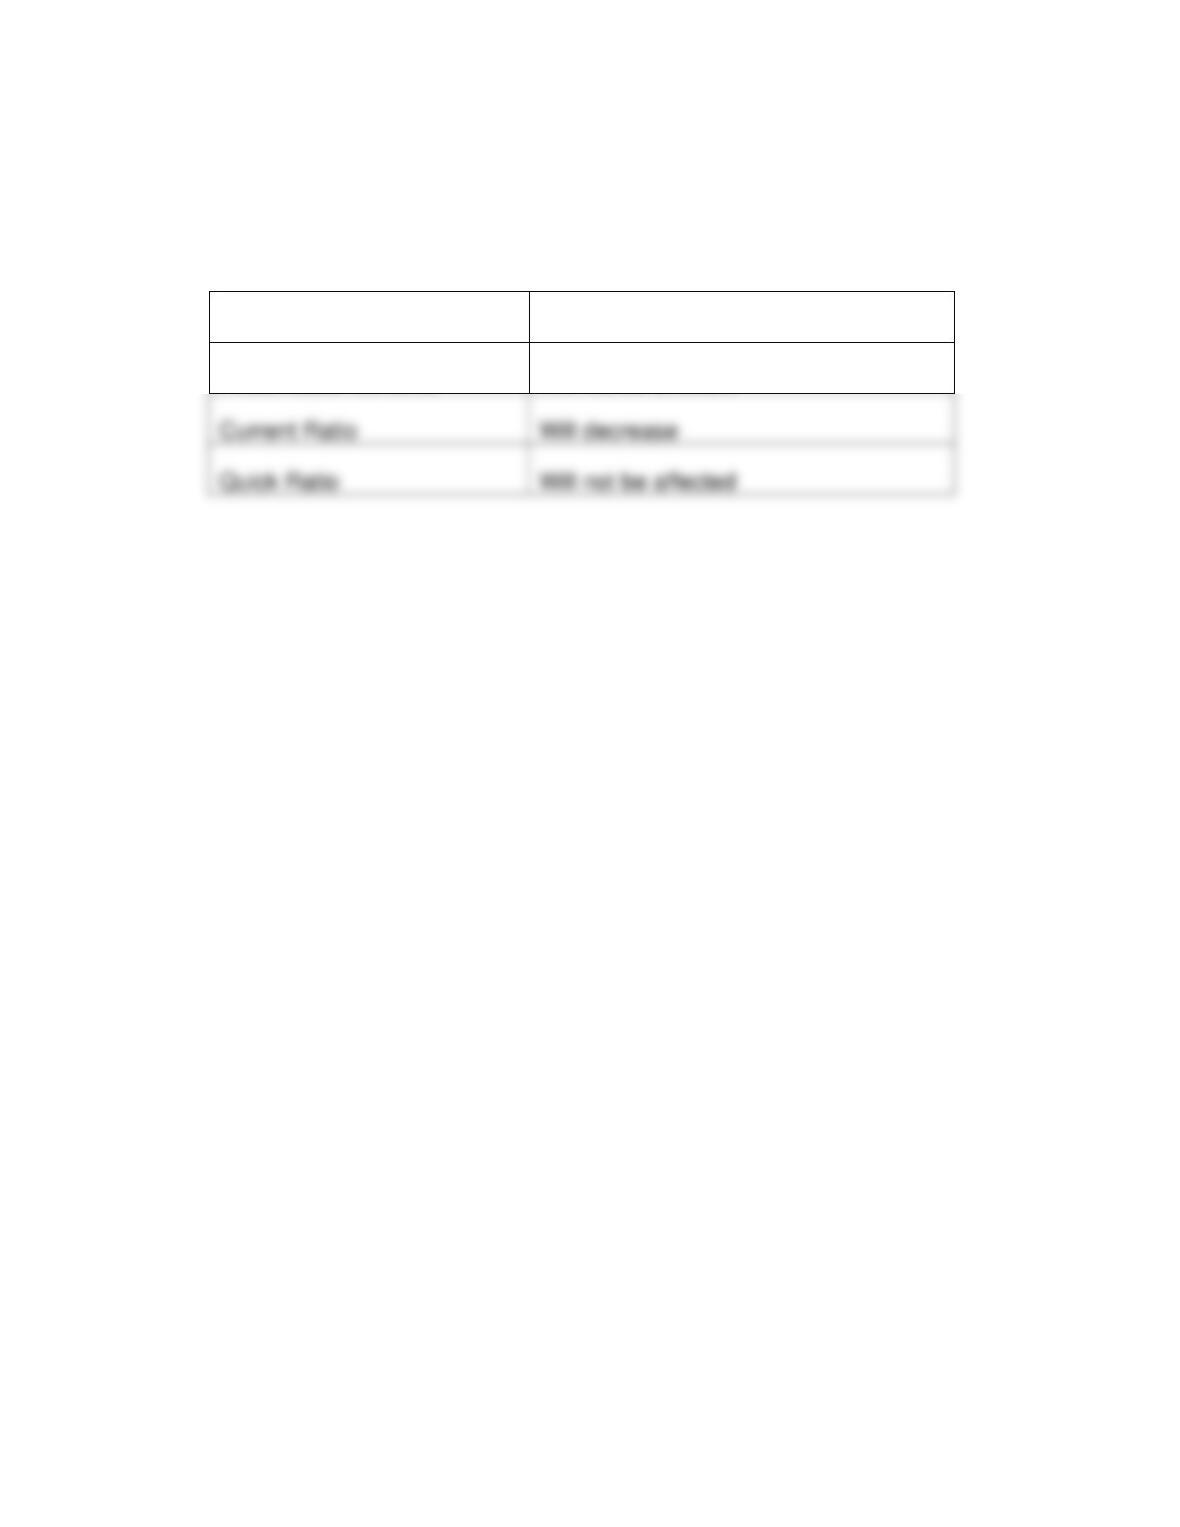
Profit Margin
Will decrease
Fixed Asset Turnover
Will not be affected
Current Ratio
Will decrease
Quick Ratio
Will not be affected
Chapter 14 – Analyzing Financial Statements
14-9
EXERCISES
E14–1.
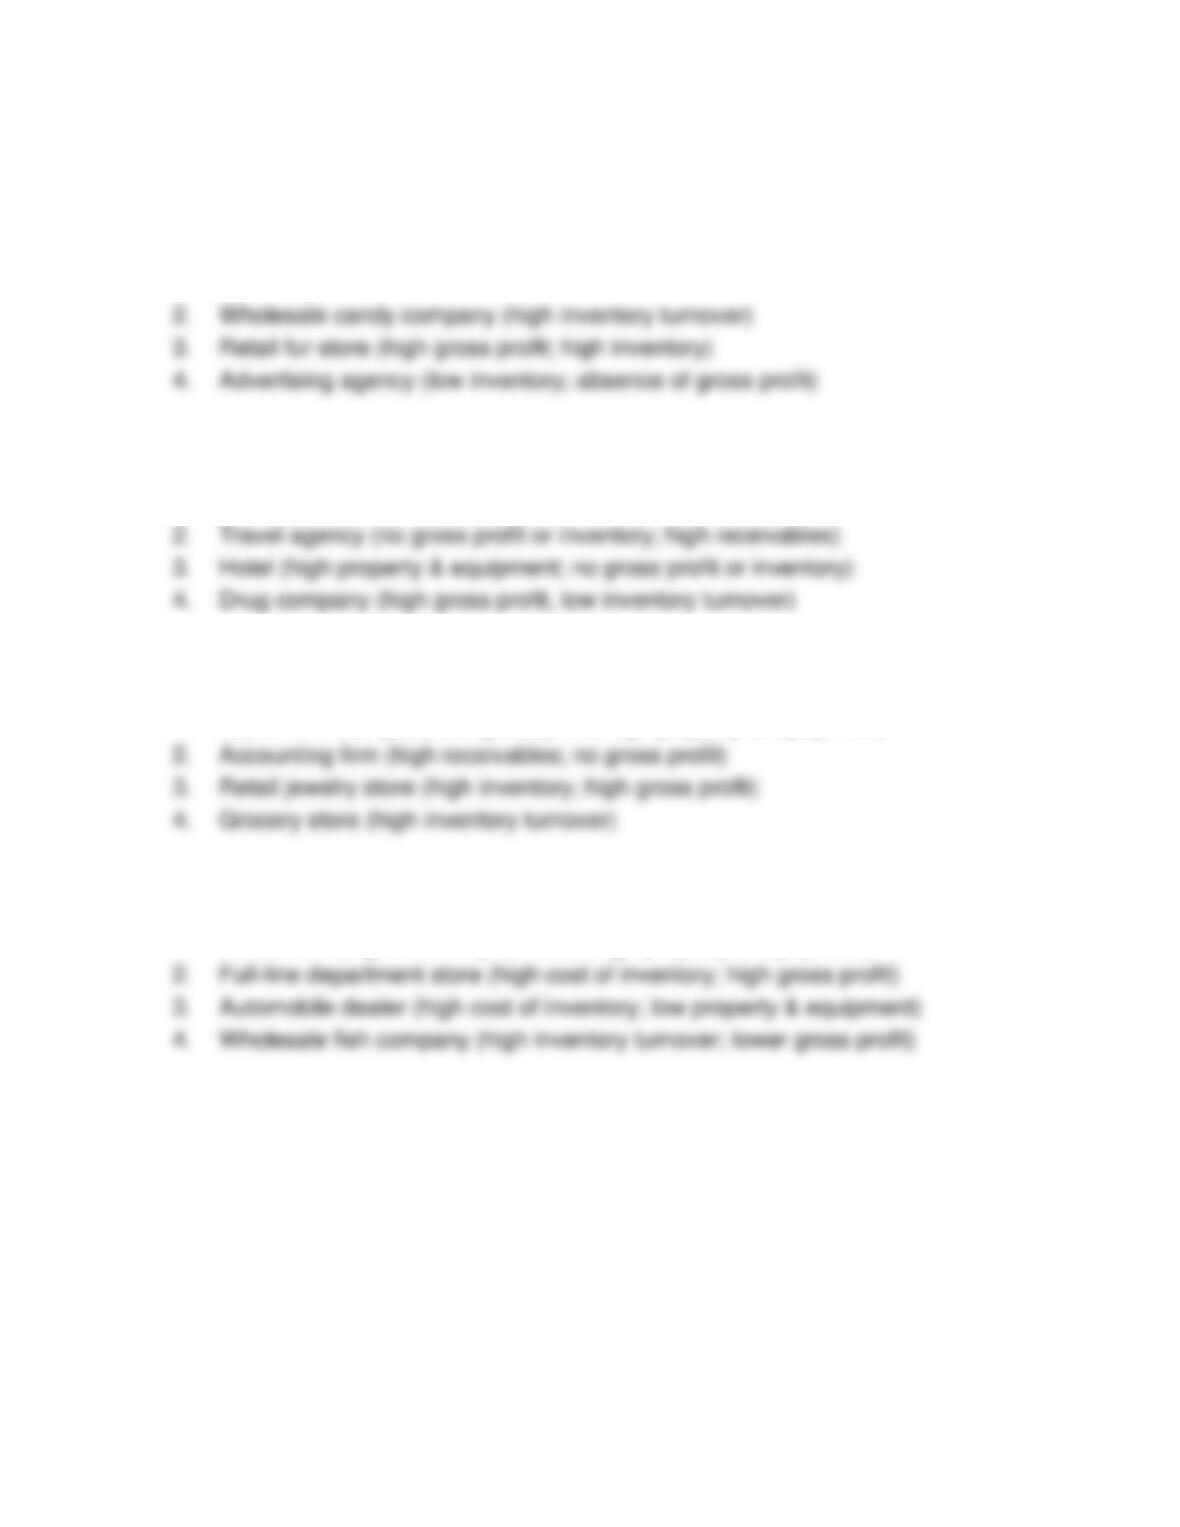
1. Car manufacturer (high inventory; high property & equipment; lower
inventory turnover)
E14–2.
1. Meat packer (high inventory turnover)
E14–3.
1. Cable T.V. Company (no gross profit; high property & equipment)
E14–4.
1. Restaurant (high inventory turnover; high property & equipment)
Chapter 14 – Analyzing Financial Statements
E14–5.
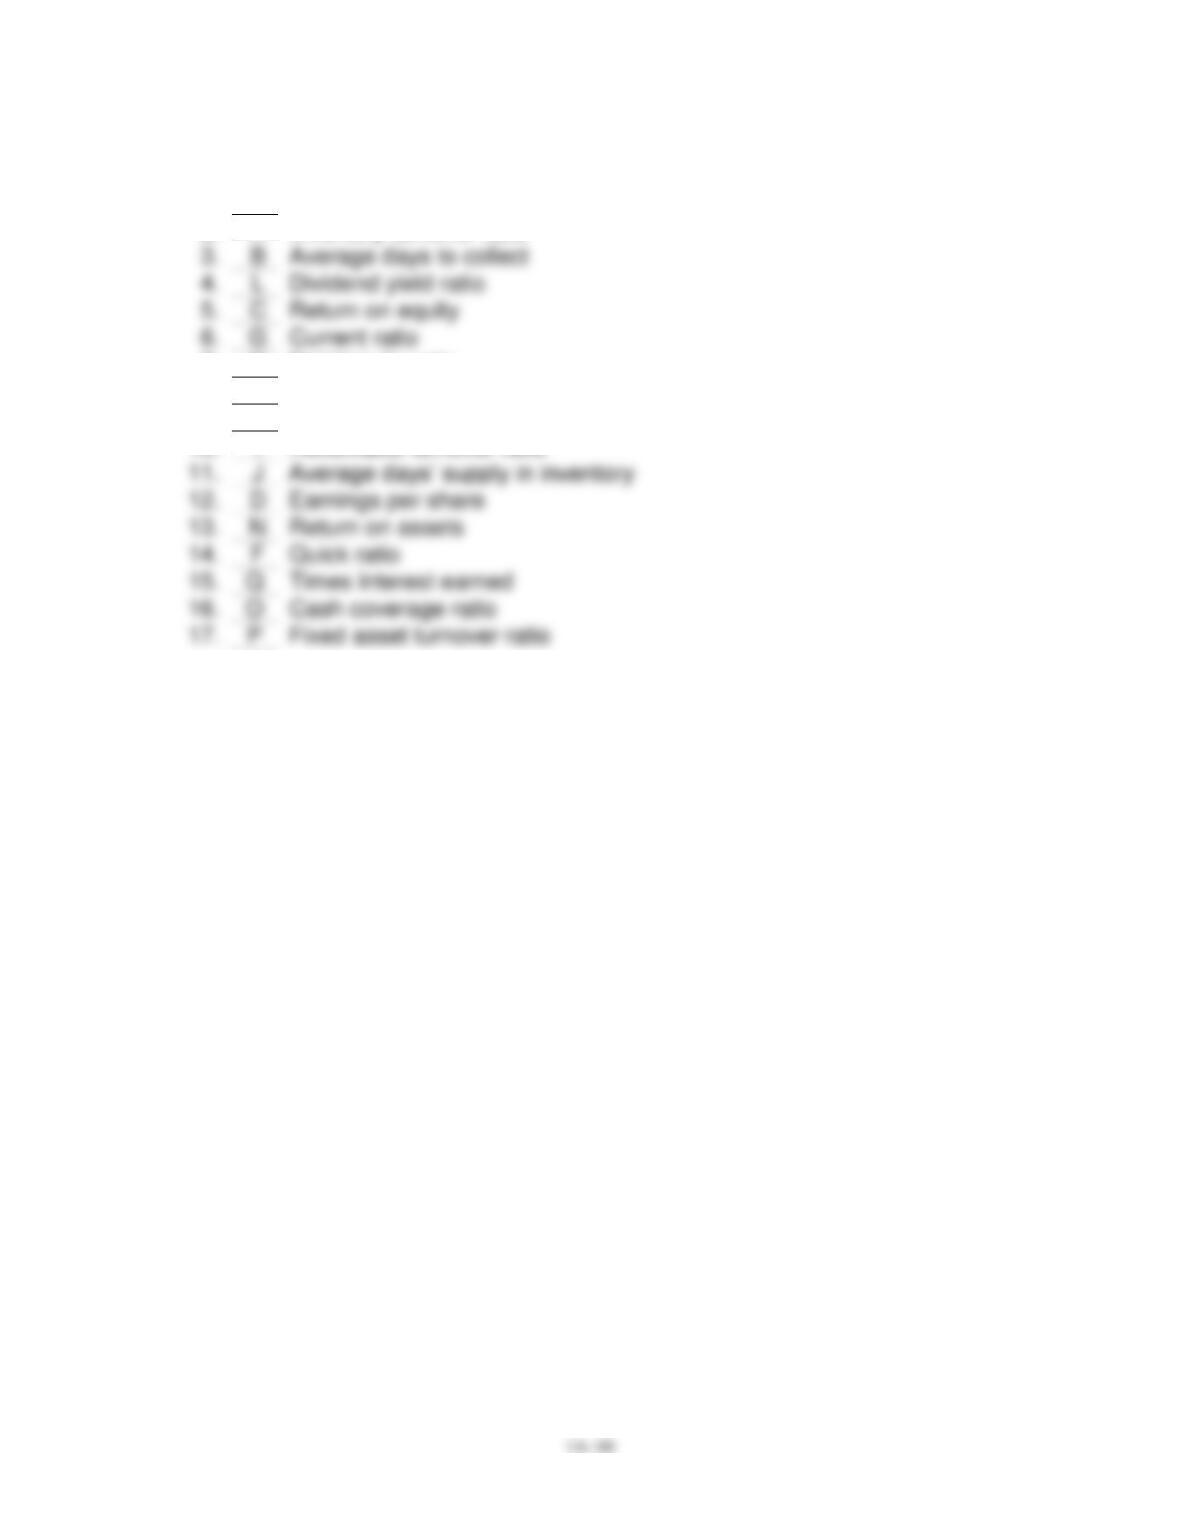
1.
A
Profit margin
2.
H
Inventory turnover ratio
3.
B
Average days to collect
4.
Dividend yield ratio
5.
C
Return on equity
6.
G
Current ratio
7.
K
Debt/equity ratio
8.
M
Price/earnings ratio
9.
E
Financial leverage percentage
10.
I
Receivable turnover ratio
12.
D
Earnings per share
13.
N
Return on assets
14.
F
Quick ratio
15.
Times interest earned
16.
Cash coverage ratio
17.
Fixed asset turnover ratio
Chapter 14 – Analyzing Financial Statements
14–11
E14–6.
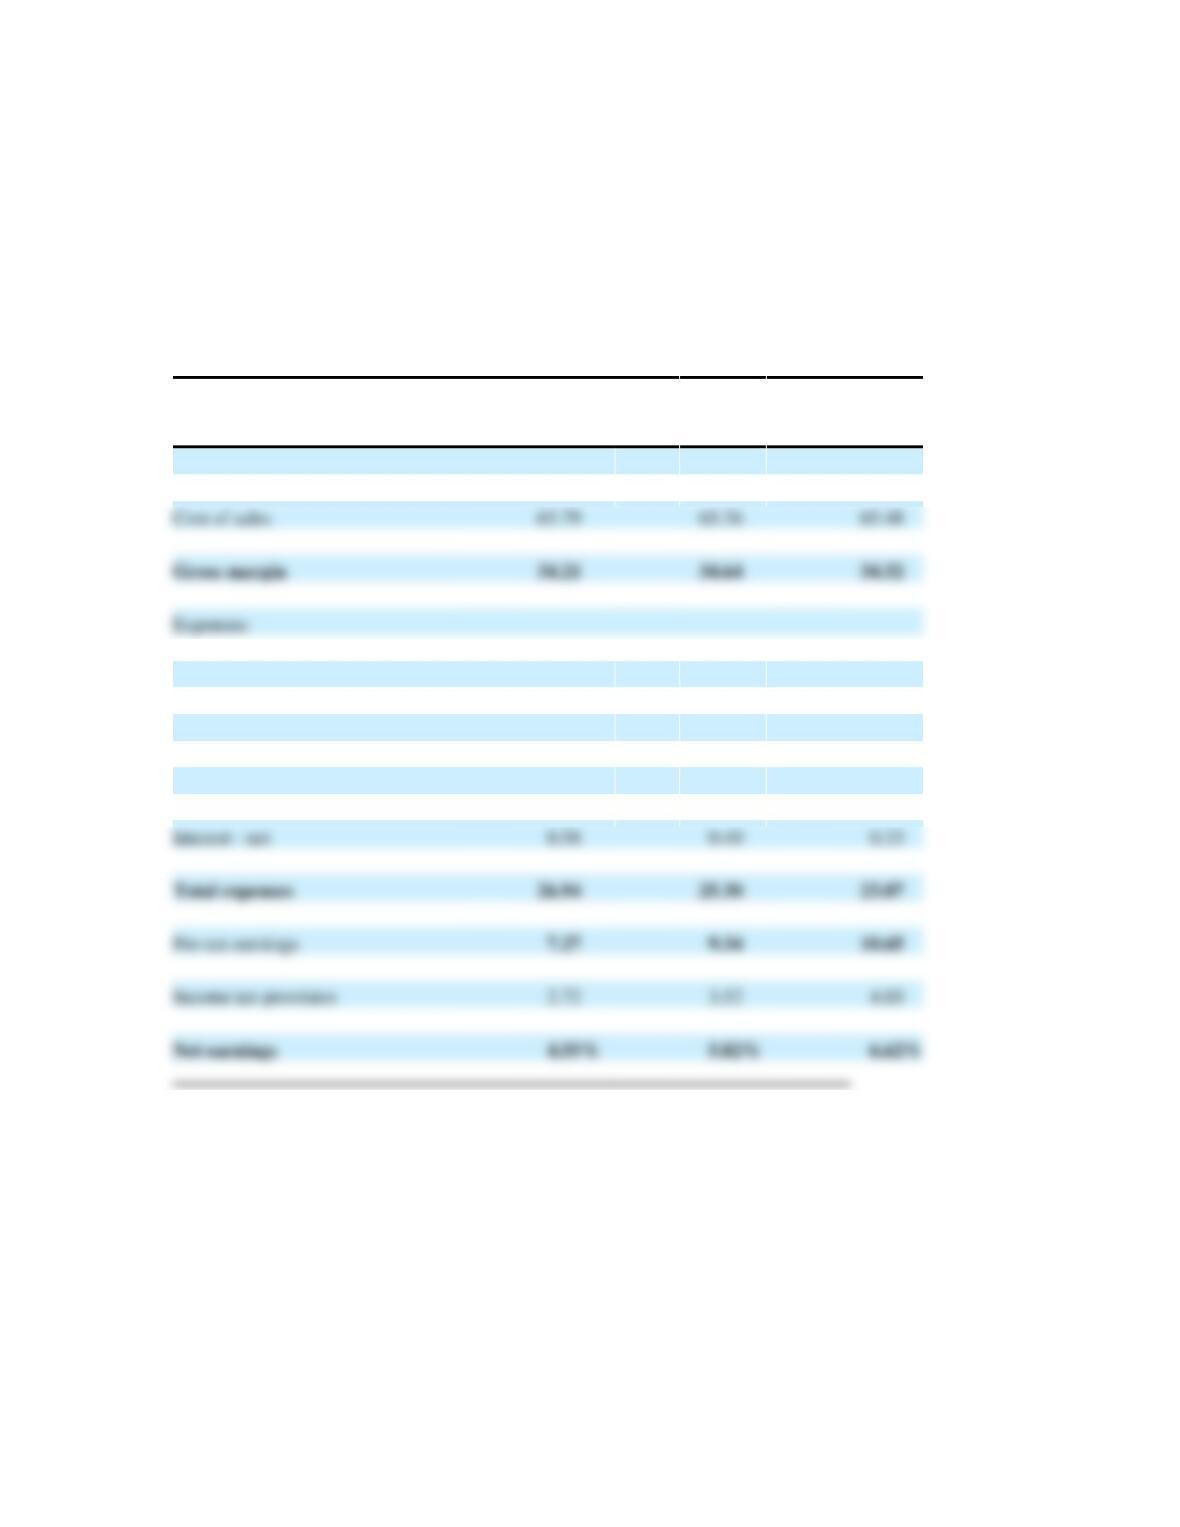
Consolidated Statements of
Earnings
(In millions, except per share and
percentage data)
January
30,
%
February
1,
%
February
2,
%
Fiscal years ended on
2009
Sales
2008
Sales
2007
Sales
Net sales
100.00
%
100.00
%
100.00
%
Selling, general and administrative
22.96
21.78
20.75
Store opening costs
0.21
0.29
0.31
Depreciation
3.19
2.83
2.48
Interest – net
0.58
0.40
0.33
Total expenses
Pre-tax earnings
Income tax provision
2.72
3.52
4.03
Net earnings
%
%
%
There is a steady decline in net earnings as a percent of sales which gross
margin is fairly stable. The decline in profitability appears to be related to cost
control with expenses increasing as a percent of sales. Management should
focus on reducing selling, general and administrative costs.
Cost of sales
65.79
65.36
65.48
Gross margin
Expenses:
Chapter 14 – Analyzing Financial Statements
14–12
E14–7.
Current Assets
(1)
Current Liabilities
(2)
Current
Ratio
(1 ÷ 2)
Start
$54,000
($54,000 ÷ 1.5)
$36,000
1.50
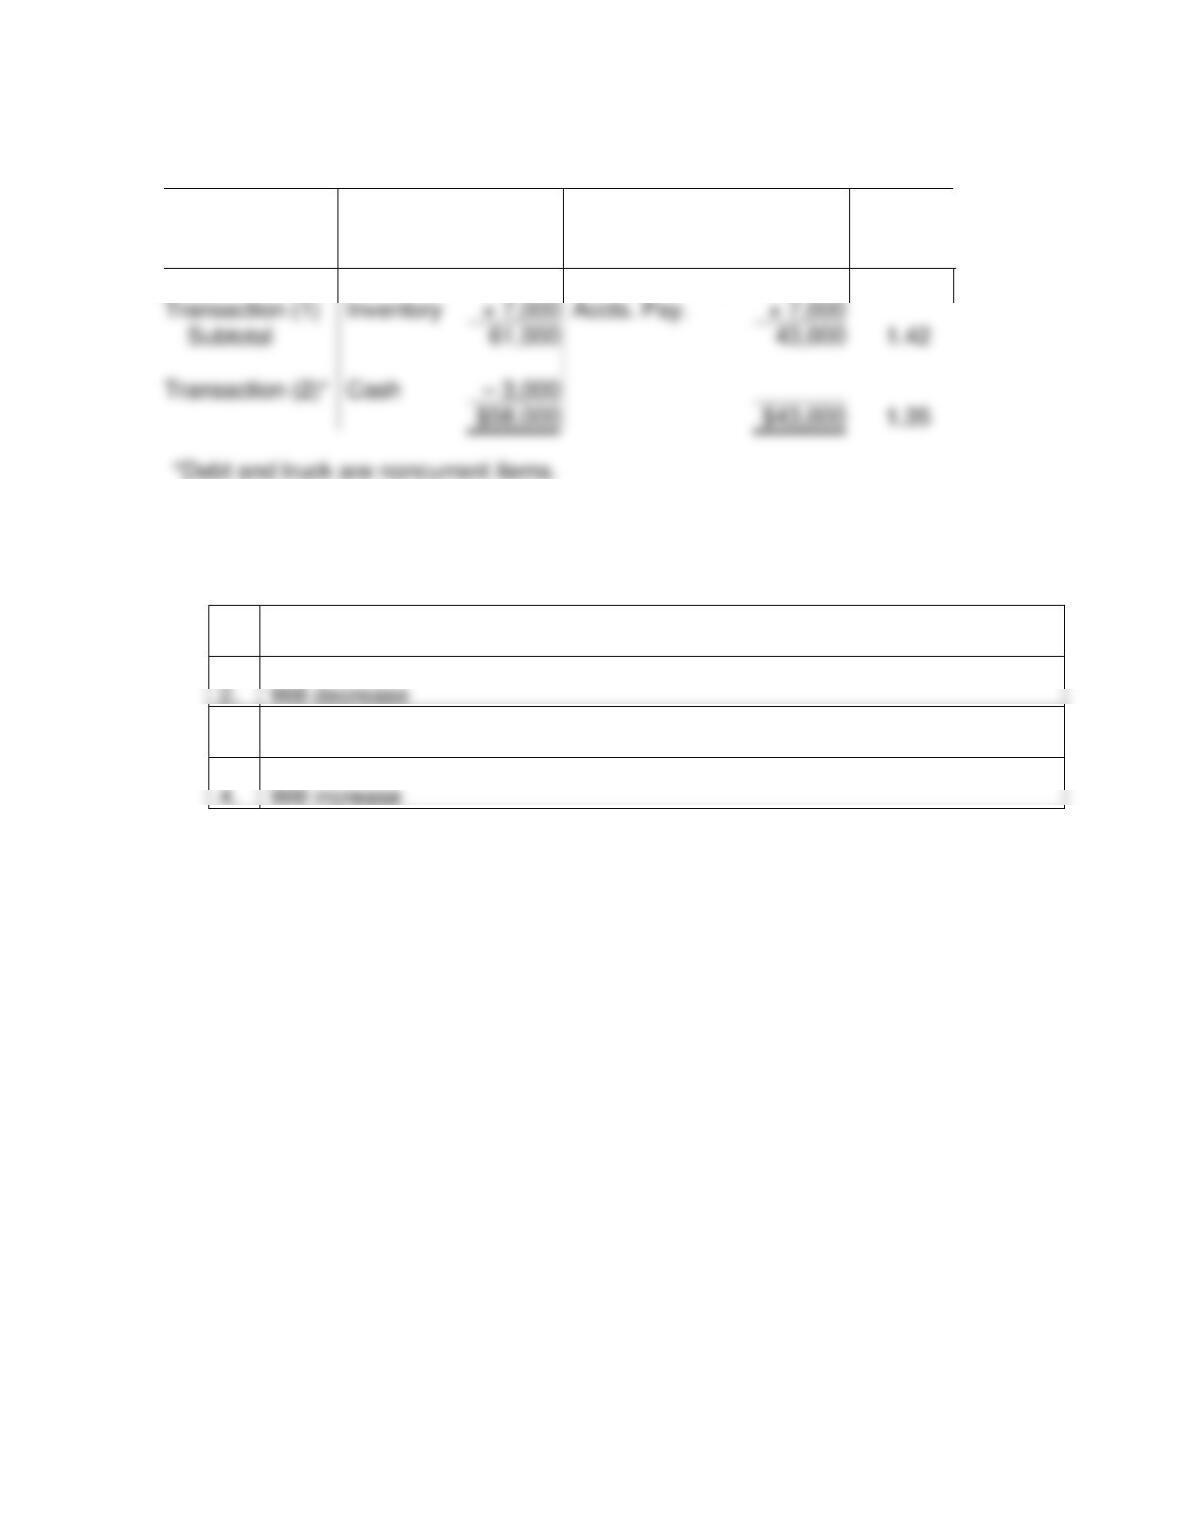
E14–8.
Effect on Current Ratio
1.
Increase, assuming that cash was collected from sale
2.
Will decrease
3.
Will decrease
Inventory
Accts. Pay.
Subtotal
61,000
43,000
1.42
Transaction (2)*
Cash
$58,000
$43,000
1.35
Chapter 14 – Analyzing Financial Statements
E14–9.
Turnover:
Accounts receivable $68,828* ÷ [($6,629 + $5,725) ÷ 2]
=
11.1
Inventory ($76,476 x .48) ÷ [($6,819 + $6,291) ÷ 2]
=
5.6
*$76,476 x 90% = $68,828
Accounts receivable (365 days ÷ 11.1)
=
32.9
Inventory (365 days ÷ 5.6)
=
65.2
E14–10.
Rate of return on equity $4,341 ÷ ($13,930 – $2,570)
=
38.2
%
Rate of return on assets
Financial leverage percentage (positive)
=
6.0
%
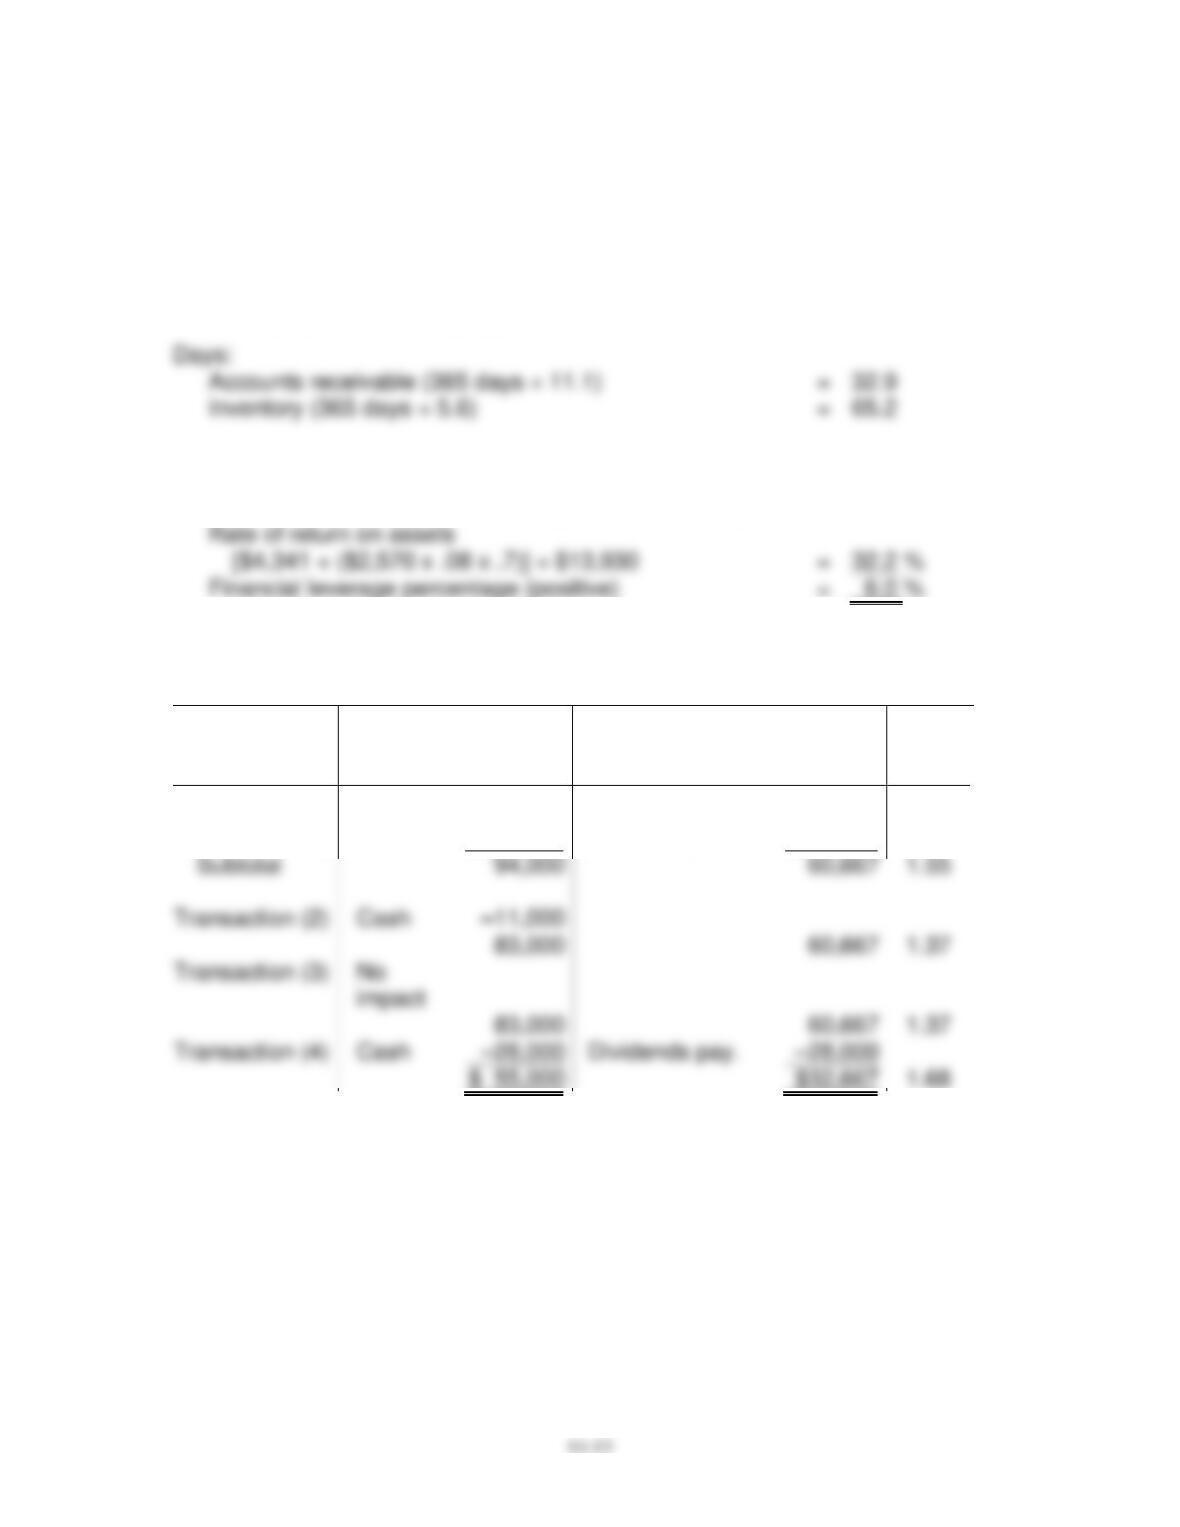
E14–11.
Current Assets
(1)
Current Liabilities
(2)
Current
Ratio
(1 ÷ 2)
Start
$100,000
($100,000 ÷ 1.5)
$66,667
1.50
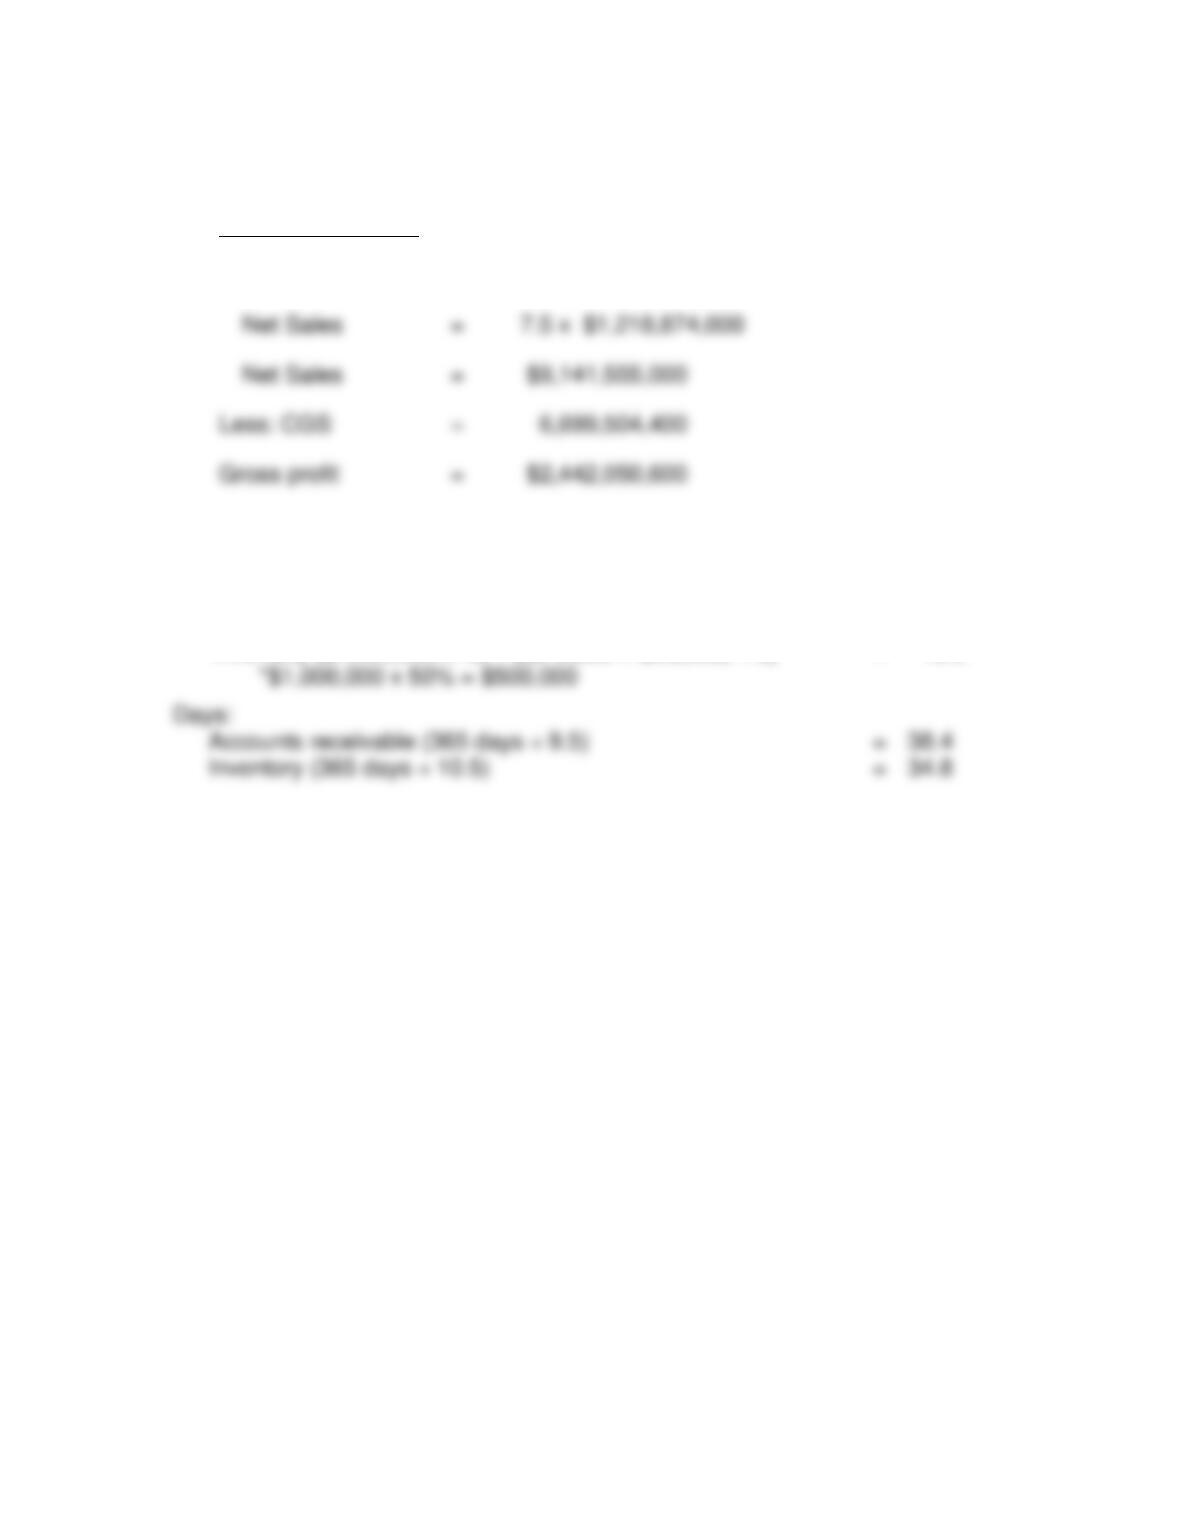
Transaction (1)
Cash
–6,000
Accts. pay.
–6,000
Subtotal
1.55
Transaction (2)
Cash
1.37
impact
1.37
Transaction (4)
Cash
Dividends pay.
1.68
Chapter 14 – Analyzing Financial Statements
14–14
E14–12.
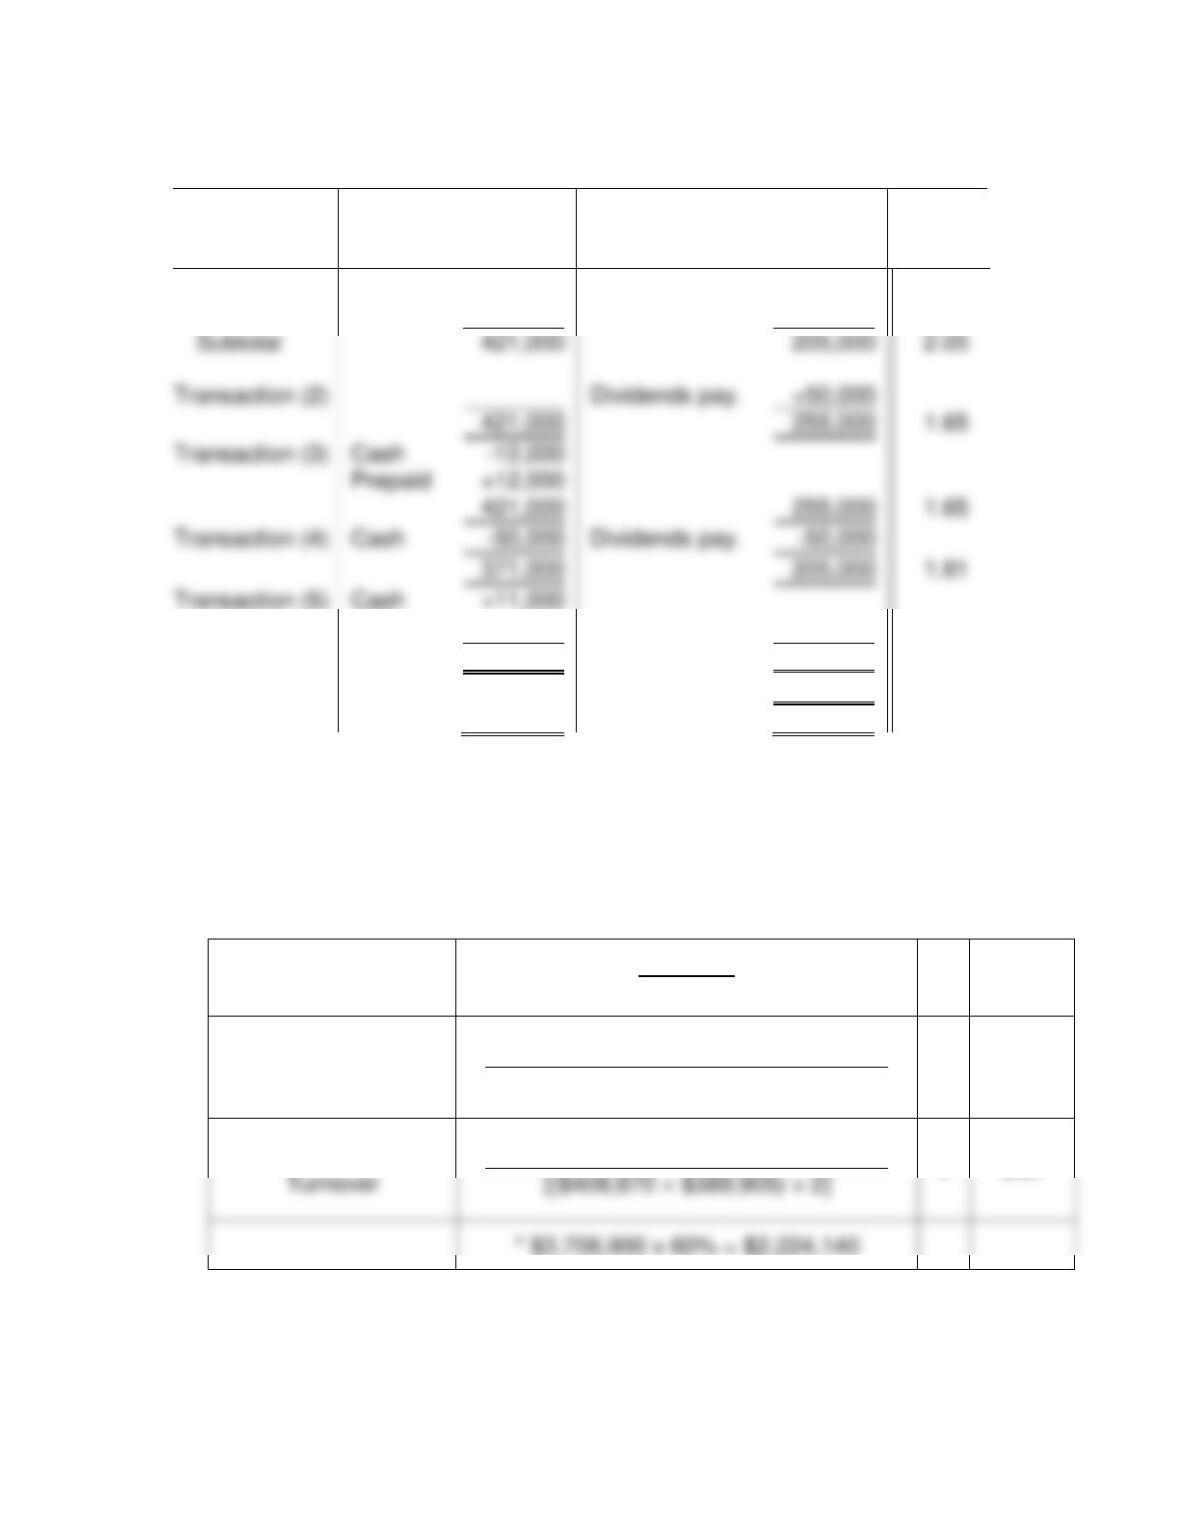
Cost of Goods Sold = 4.6 x $1,456,414,000
Cost of Goods Sold = $6,699,504,400
E14–13.
Turnover:
Accounts receivable $500,000* ÷ [($45,000 + $60,000) ÷ 2]
=
9.5
Inventory ($1,000,000 x .5) ÷ [($70,000 + $25,000) ÷ 2]
=
10.5
*$1,000,000 x 50% = $500,000
=
=
Chapter 14 – Analyzing Financial Statements
14–15
E14–14.
Current Assets
(1)
Current Liabilities
(2)
Current
Ratio
(1 ÷ 2)
Start
$410,000
($410,000 ÷ 2)
$205,000
2.00
Transaction (1)
A/R*
+11,000
-11,000
A/R
371,000
205,000
1.81
Transaction (6)
ST Lia.
+30,000
371,000
235,000
1.58
*We assume that the periodic inventory system is used and, therefore, there
is no impact on inventory. Some students will try to try to reduce inventory as
part of this transaction.
E14–15.
Current Ratio
$811,805
$403,038
=
2.01
Inventory Turnover
$1,515,815
=
7.05
[($231,741 + $198,000) ÷ 2]
[($408,870 + $389,905) ÷ 2]
Account Receivable
$2,224,140 *
=
5.57
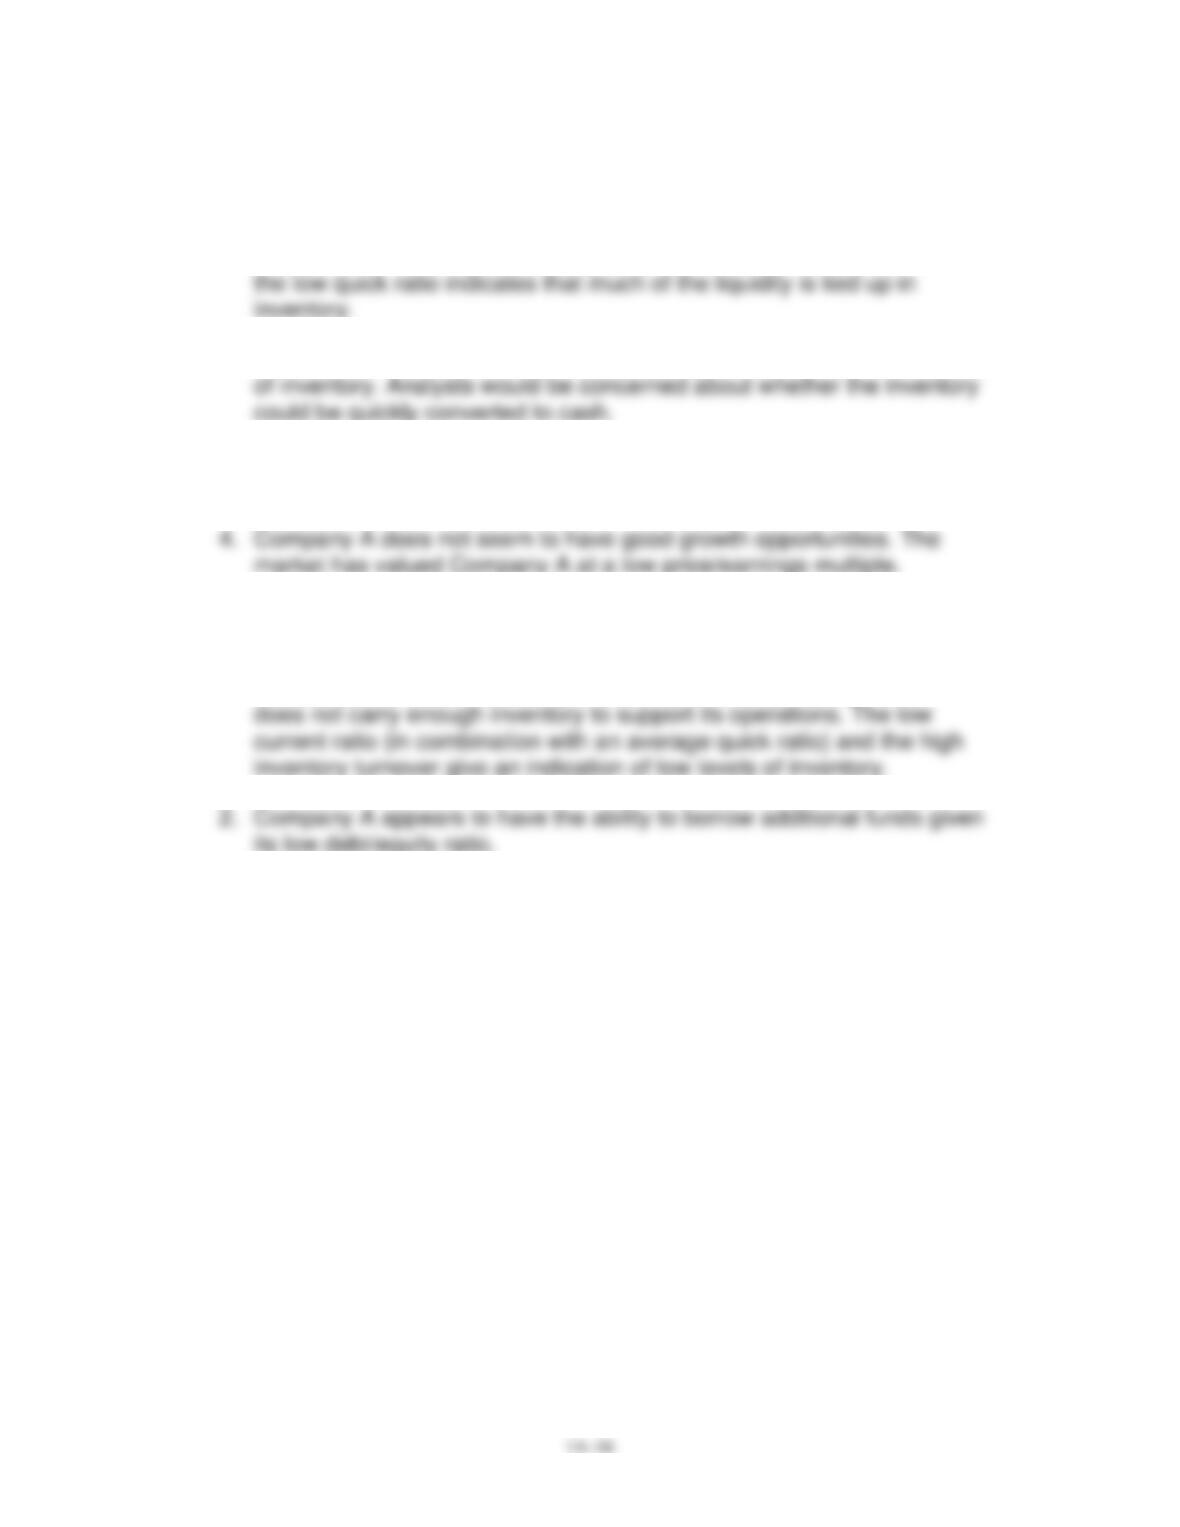
Subtotal
421,000
205,000
2.05
Transaction (2)
Dividends pay.
+50,000
421,000
255,000
1.65
421,000
255,000
1.65
Transaction (4)
Cash
Dividends pay.
371,000
205,000
1.81
Transaction (5)
Cash
Chapter 14 – Analyzing Financial Statements
PROBLEMS
P14–1.
1. Company A has a high level of liquidity as shown by the current ratio but
2. The low inventory turnover is another indication of an excessive amount
3. In addition to liquidity concerns, Company A shows a high debt/equity
ratio.
P14–2.
1. Company A is either extremely efficient at inventory management or it
3. Company A seems to pay low dividends and has a high price/earnings
multiple. These ratios would suggest good growth opportunities.
Chapter 14 – Analyzing Financial Statements
14–17
P14–3.
Commerce Bank
C. 15
Duke Energy
F. 13
P14–4.
JCPenney is the stronger company and probably the better investment.
JCPenney has a higher gross profit margin, which means that they make
more gross profit on each dollar of sales than does Sears. This is very
Ford
D. Not applicable
Home Depot
B. 12
Motorola
G. 99
Starbucks
A. 33
Pepsi
Continental Airlines
H. 8
Chapter 14 – Analyzing Financial Statements
14–18
P14–5.
Req. 1
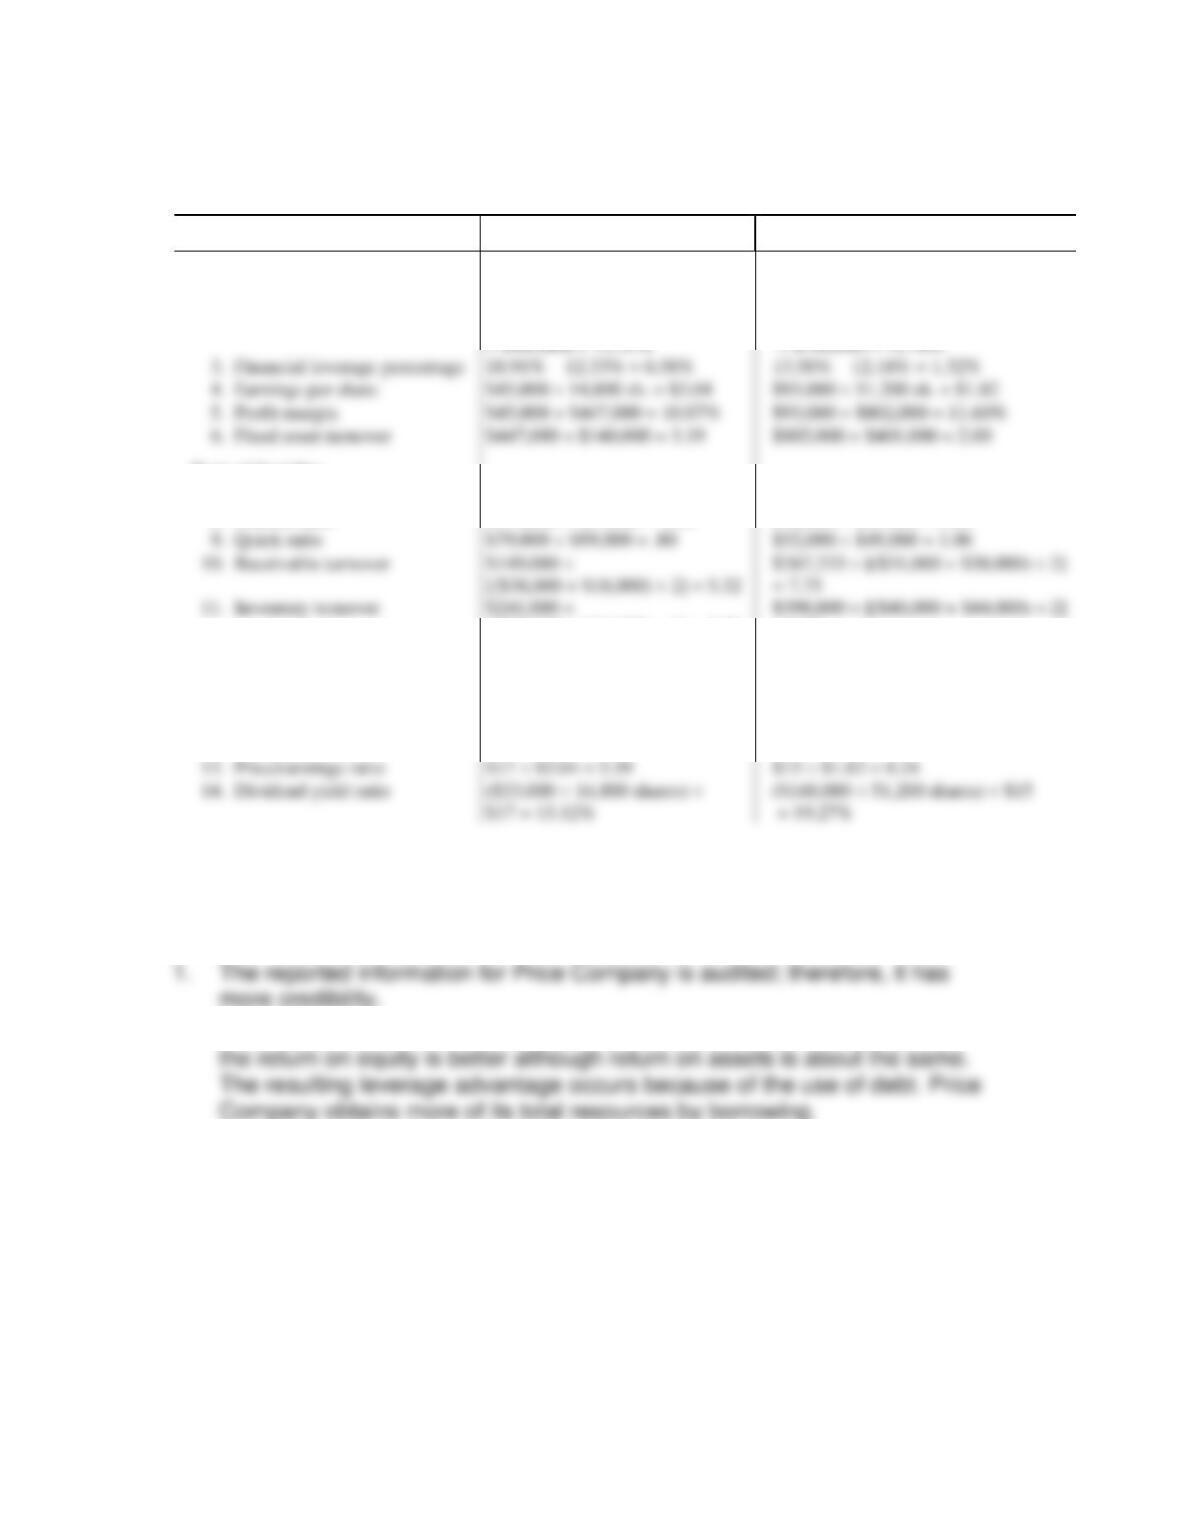
Ratio
Price Company
Waterhouse Company
Tests of profitability:
1.
Return on equity
$45,000 ÷ $238,000 = 18.91%
$93,000 ÷ $689,000 = 13.50%
2.
Return on assets
[$45,000 + ($65,000 x 10% x.70)]
[$93,000 + ($60,000 x 10% x .70)]
Tests of liquidity:
7.
Cash ratio
$41,000 ÷ $99,000 = .41
$21,000 ÷ $49,000 = .43
8.
Current ratio
$178,000 ÷ $99,000 = 1.80
$92,000 ÷ $49,000 = 1.88
Quick ratio
$79,000 ÷ $99,000 = .80
$52,000 ÷ $49,000 = 1.06
Receivable turnover
$149,000 ÷
$267,333 ÷ [($31,000 + $38,000) ÷ 2]
[($99,000 + $94,000) ÷ 2] = 2.50
= 9.48
Solvency and equity position:
12.
Debt/equity ratio
$164,000 ÷ $238,000 = .69
$109,000 ÷ $689,000 = .16
Market tests:
13.
Price/earnings ratio
$17 ÷ $3.04 = 5.59
$15 ÷ $1.82 = 8.24
Req. 2
Recommended choice: Price Company
Basis for recommendation:
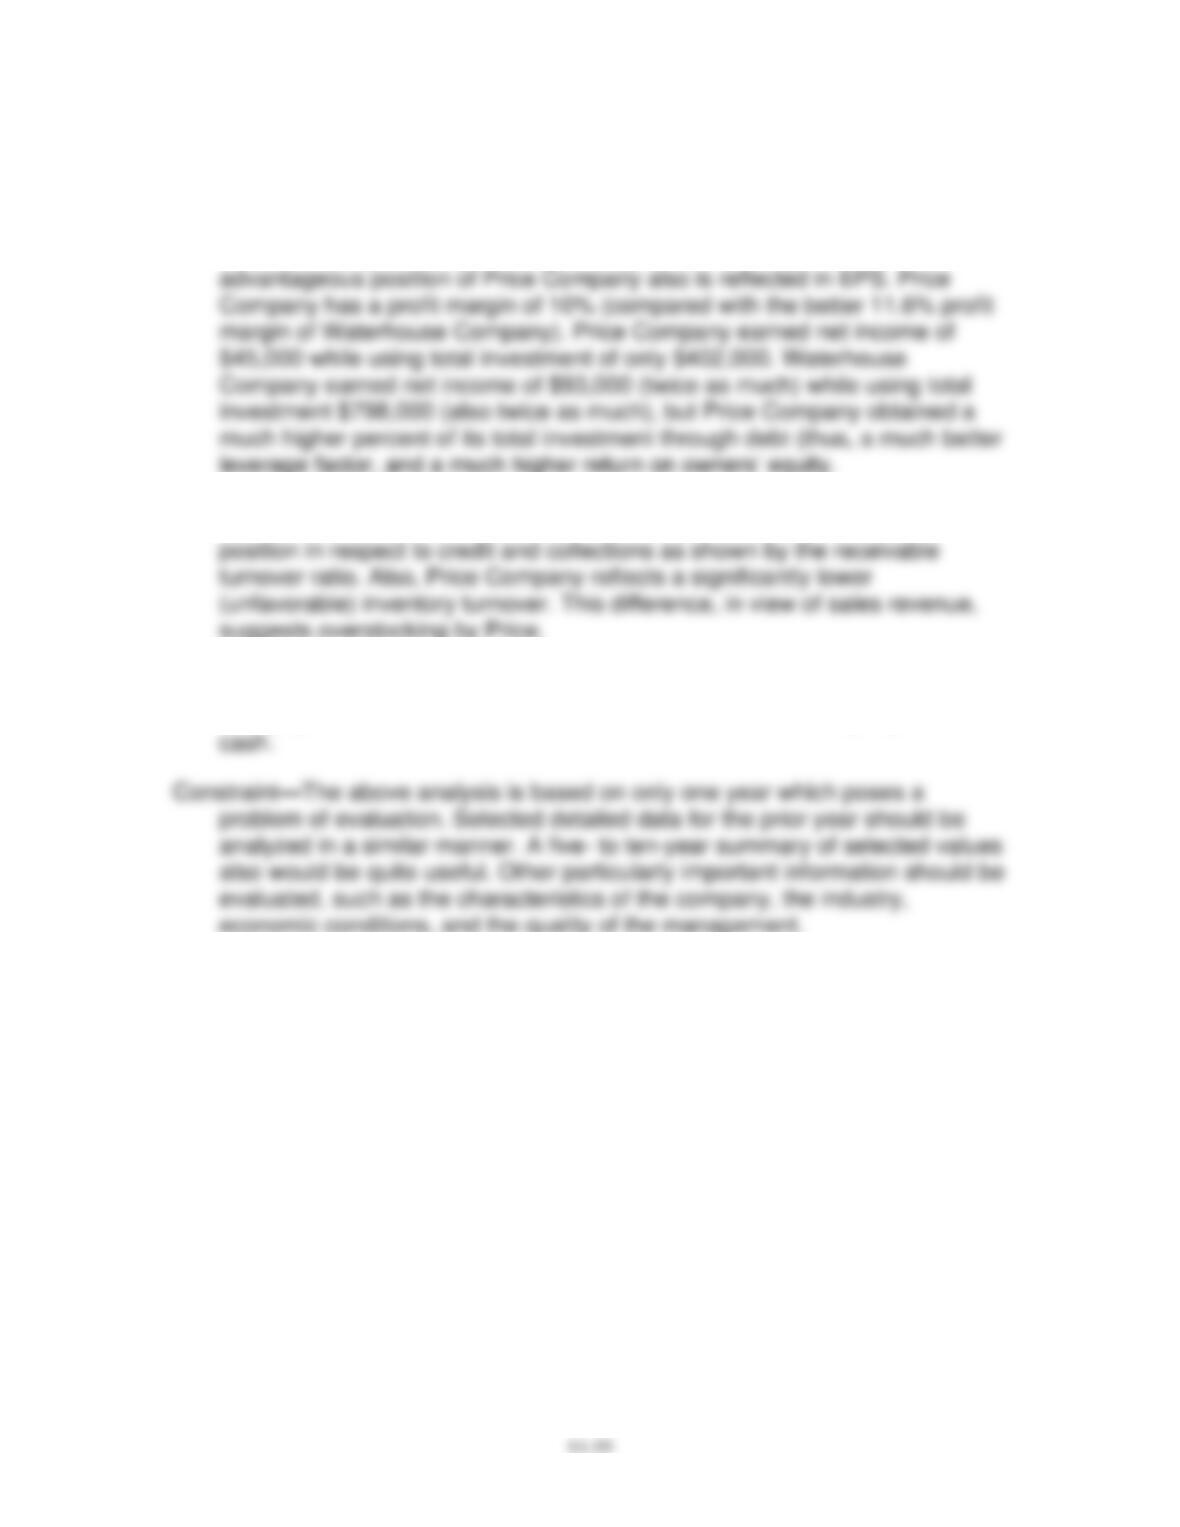
2. Profitability in the future has a higher probability for Price Company because
Financial leverage percentage
18.91% – 12.33% = 6.58%
13.50% – 12.18% = 1.32%
Earnings per share
$45,000 ÷ 14,800 sh. = $3.04
$93,000 ÷ 51,200 sh. = $1.82
5.
Profit margin
$45,000 ÷ $447,000 = 10.07%
$93,000 ÷ $802,000 = 11.60%
Fixed asset turnover
$802,000 ÷ $401,000 = 2.00
Chapter 14 – Analyzing Financial Statements
P14–5. (continued)
Req. 2 (continued)
Price Company is taking better advantage of this leverage. The
3. Waterhouse Company has a better liquidity position measured in terms of
the current ratio and the quick ratio. Waterhouse Company is in a better
4. The market tests favor Waterhouse Company but the company declared and
paid a dividend in excess of 2012 profits. This pattern cannot be continued.
This payout should cause concern because Waterhouse Company is low on
Chapter 14 – Analyzing Financial Statements
14–20
P14–6.
Req. 1
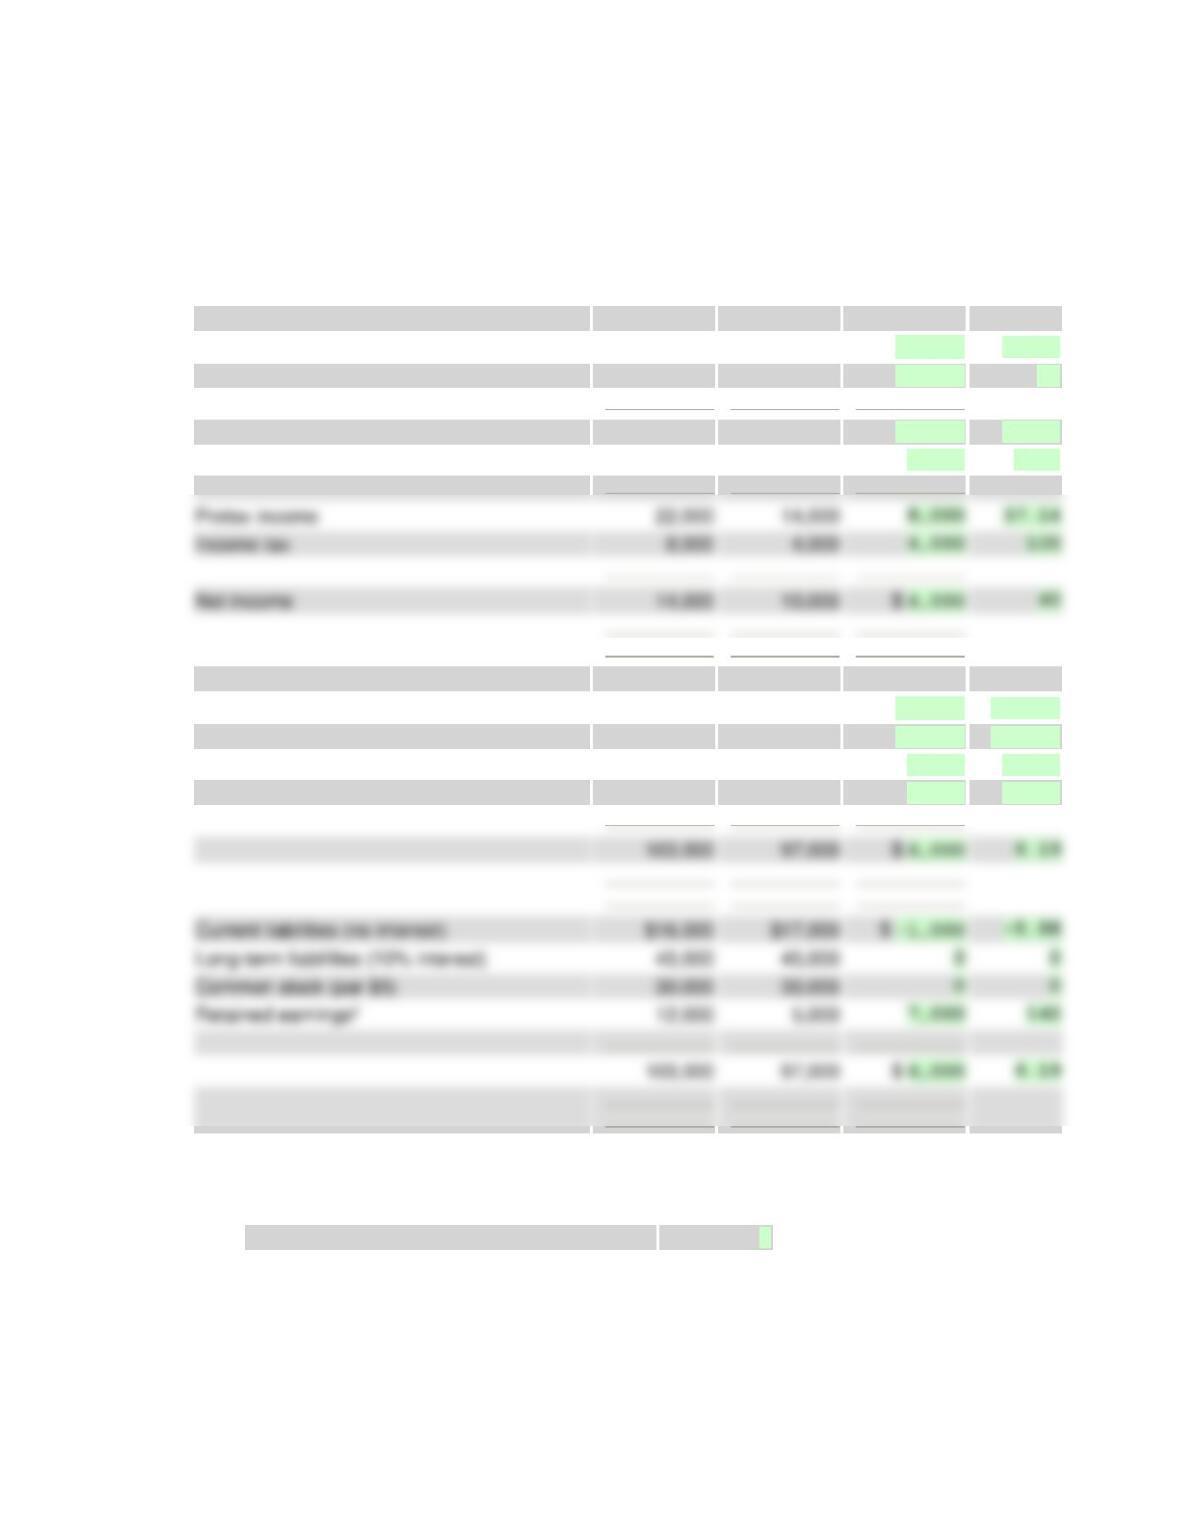
Increase (Decrease)
2012 over 2011
Income Statement
2012
2011
Amount
Percent
Sales revenue
$190,0001
$167,000
$ 23,000
13.77
Cost of goods sold
112,000
100,000
12,000
12
Gross profit
78,000
67,000
11,000
16.42
Operating expenses and interest expense
56,000
53,000
3,000
5.66
Balance Sheet
Cash
$4,000
$7,000
$ -3,000
-42.86
Accounts receivable (net)
14,000
18,000
-4,000
-22.22
Inventory
40,000
34,000
6,000
17.65
Operational assets (net)
45,000
38,000
7,000
18.42
Current liabilities (no interest)
$ -1,000
45,000
45,000
Common stock (par $5)
30,000
30,000
12,000
7,000
97,000
1One-third was credit sales. 2 During 2012, cash dividends amounting to $3,000 were declared and
paid.
Req. 2
Working capital change
0
Pretax income
22,000
14,000
8,000
57.14
Income tax
4,000
Net income
14,000
10,000