
14-1
CHAPTER 14
QUALITY AND ENVIRONMENTAL
COST MANAGEMENT
DISCUSSION QUESTIONS
1. Quality of design is a function of the
product’s specifications, whereas quality of
conformance is a measure of how a product
meets its specifications.
2. All quality costs are incurred because poor
quality may or does exist.
3. The zero-defects approach emphasizes con-
forming to specifications. Upper and lower
limits are set for product variation, and any
unit that falls within those limits is deemed
acceptable (units outside the range are de-
fined as defective). The robust quality
approach emphasizes “fitness for use.”
There is no range within which variation is
acceptable. Thus, any unit not meeting the
target is defective.
4. Under the robust quality approach, any vari-
ation from the ideal entails a loss, a loss
which grows larger as the variation in-
creases. This approach leads to the Taguchi
quality loss function, which is based on the
idea that any variability from the ideal caus-
es hidden quality losses or costs. The
Taguchi quality loss function shows that
costs increase at an increasing rate as vari-
ability increases. This function is symmetric.
5. Prevention costs are incurred to prevent de-
fects in products; appraisal costs are costs
incurred to determine whether products are
conforming to specifications; internal failure
costs are incurred when nonconforming
products are detected prior to shipment; and
external failure costs are incurred because
nonconforming products are delivered to
customers.
6. External failure costs can be more devastat-
ing because of warranty costs, recall costs,
lawsuits, and damage to the reputation of a
company, all of which may greatly exceed
the costs of rework or scrap incurred from
internal failure costs.
7. Agree. It is poor quality, not good quality,
that is costly. All quality costs exist because
poor quality may or does exist.
8. Interim quality standards are used to
measure a firm’s progress toward better
quality within a given period.
9. Interim quality reports are used to measure
quality improvement with respect to a cur-
rent-period standard; multiple-period reports
are used to measure quality improvement
with respect to a base period; and long-
range reports are used to measure progress
toward achieving the goal of zero defects.
10. Both monetary and nonmonetary incentives
can be used. For example, employees can be
given a bonus that is equal to a fixed
percentage of the savings from a suggestion
that improved a product’s quality (referred to
as gainsharing). Additionally, nonmonetary
awards of excellence can be used to
recognize those employees who make
outstanding quality contributions. Gainsharing
pro–vides cash incentives for a company’s
entire workforce that are keyed to quality or
productivity gains.
11. Firms should spend about 2.5 percent of
sales on quality costs. The potential savings
from quality improvement is $31 million [$36
million (0.18 × $200 million) – $5 million
(0.025 × $200 million)].
12. It is possible to improve quality and lower
costs by changing the relative distribution of
quality costs among the four categories. The
optimal mix needs to be identified.
13. A quality cost report shows the amount of
cost for each category as well as the relative
cost of each category. This report requires
managers to identify the costs that should
appear in the report, to identify the current
quality performance level, and to begin
thinking about the level of quality perfor-
mance that should be achieved.
14. Two major reasons: (1) they have the exper-
tise and training, and (2) they have the
objectivity.

14-2
15. ISO 9000 is a family of international quality
standards. These standards center on the
concept of documentation and control of
nonconformance and change. ISO 9000
certification can be a requirement of doing
business (e.g., in Europe). Also, many
companies have found that the process of
applying for ISO 9000, while lengthy and
expensive, yields important benefits in terms
of self-knowledge. U.S. companies are using
ISO 9000 certification as a competitive tool,
as well.
16. Ecoefficiency is the belief that organizations
can produce more competitively priced
goods and services that satisfy customer
needs while simultaneously reducing nega-
tive environmental consequences, resource
consumption, and costs.
17. The four objectives are to (1) reduce envi-
ronmental impact, (2) reduce environmental
liability, (3) reduce consumption of re-
sources, and (4) increase product value.
18. The four opportunities for improving
ecoefficiency are (1) process improvement
and innovation, (2) revalorization of
products, (3) redesign of products, and
(4) new ways of meeting customer needs.
19. An environmental cost is a cost incurred
because poor environmental quality exists or
may exist.
20. The four categories of environmental costs
are prevention, detection, internal failure,
and external failure. Prevention costs are
costs incurred to prevent degradation to the
environment. Detection costs are incurred to
determine if the firm is complying with envi-
ronmental standards. Internal failure costs
are costs incurred to prevent emission of
contaminants to the environment after they
have been produced. External failure costs
are costs incurred after contaminants have
been emitted to the environment.
21. Realized external failure costs are environ-
mental costs paid for by the firm. Unrealized
or societal costs are costs caused by the
firm but paid for by third parties (e.g., mem-
bers of society bear these costs).
22. Full environmental costing means that all
environmental costs are assigned to the
product, including societal costs. Full private
costing means that only private costs are
assigned to products.
23. An activity-based environmental cost per
unit of product signals two things. First, it in-
dicates how much opportunity exists for im-
proving environmental and economic
performance. Second, it is a measure of the
relative cleanliness of products. The “dirty”
products should receive greater attention
than the ones that are “clean.”
14-3
CORNERSTONE EXERCISES
Cornerstone Exercise 14.1
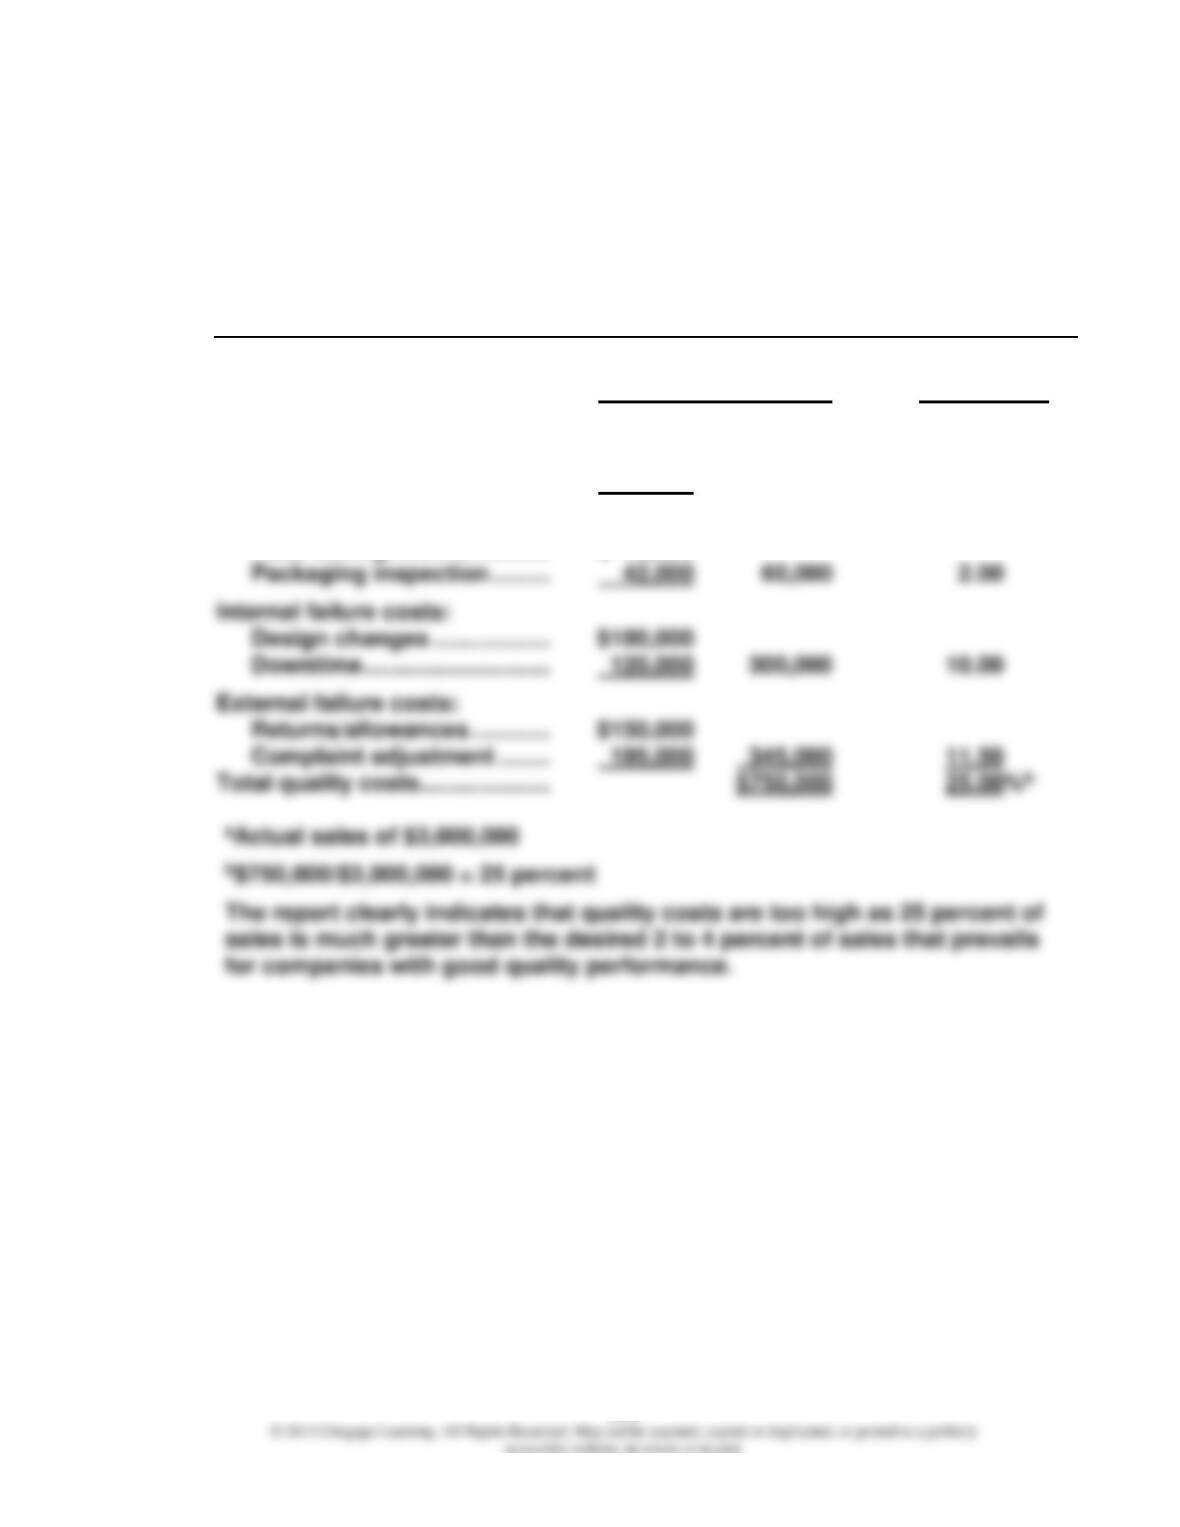
1. Evans Company
Quality Cost Report
For the Year Ended 2015
Percentage
Quality Costs of Salesa
Prevention costs:
Quality circles ………………… $ 6,000
Prototype inspection ………. 39,000 $ 45,000 1.50%
Appraisal costs:
Field testing ……………………. $ 18,000
14-4
Cornerstone Exercise 14.1 (Concluded)
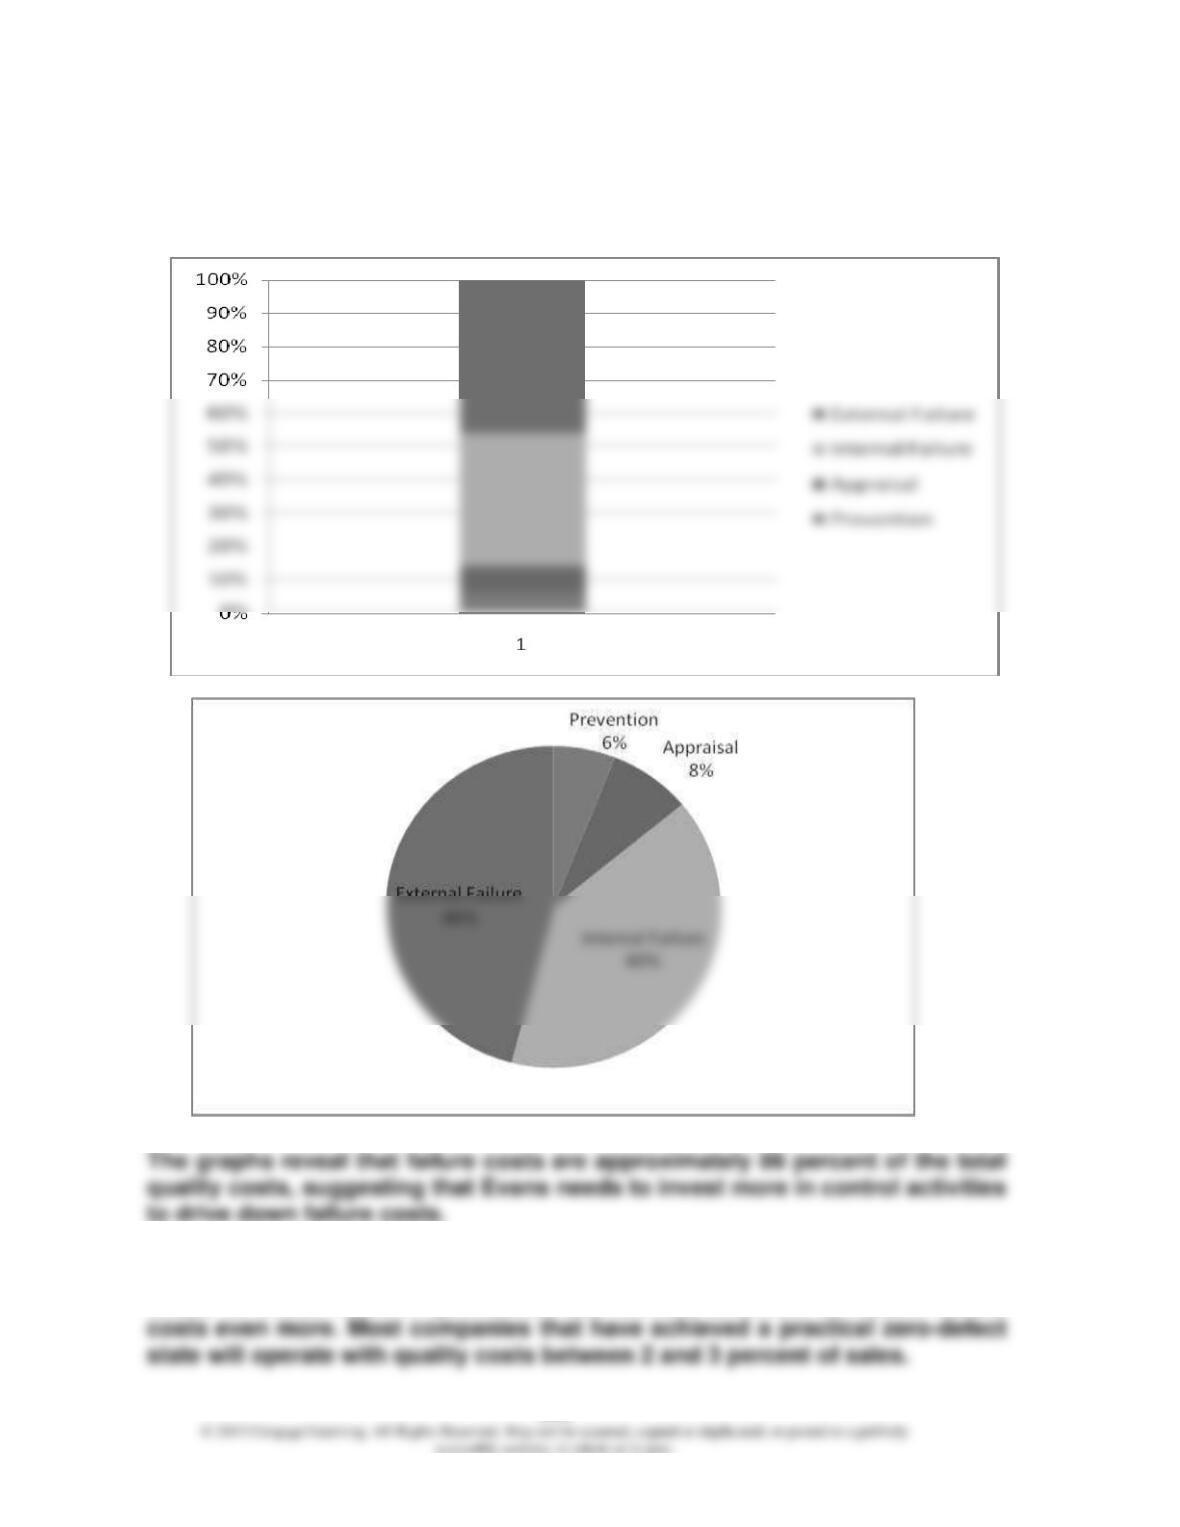
2. Quality Cost Categories: Relative Contribution Graphs
3. The company has made good progress in reducing its quality costs, but still
needs to invest more in prevention and control activities to reduce failure
14-5
Cornerstone Exercise 14.2
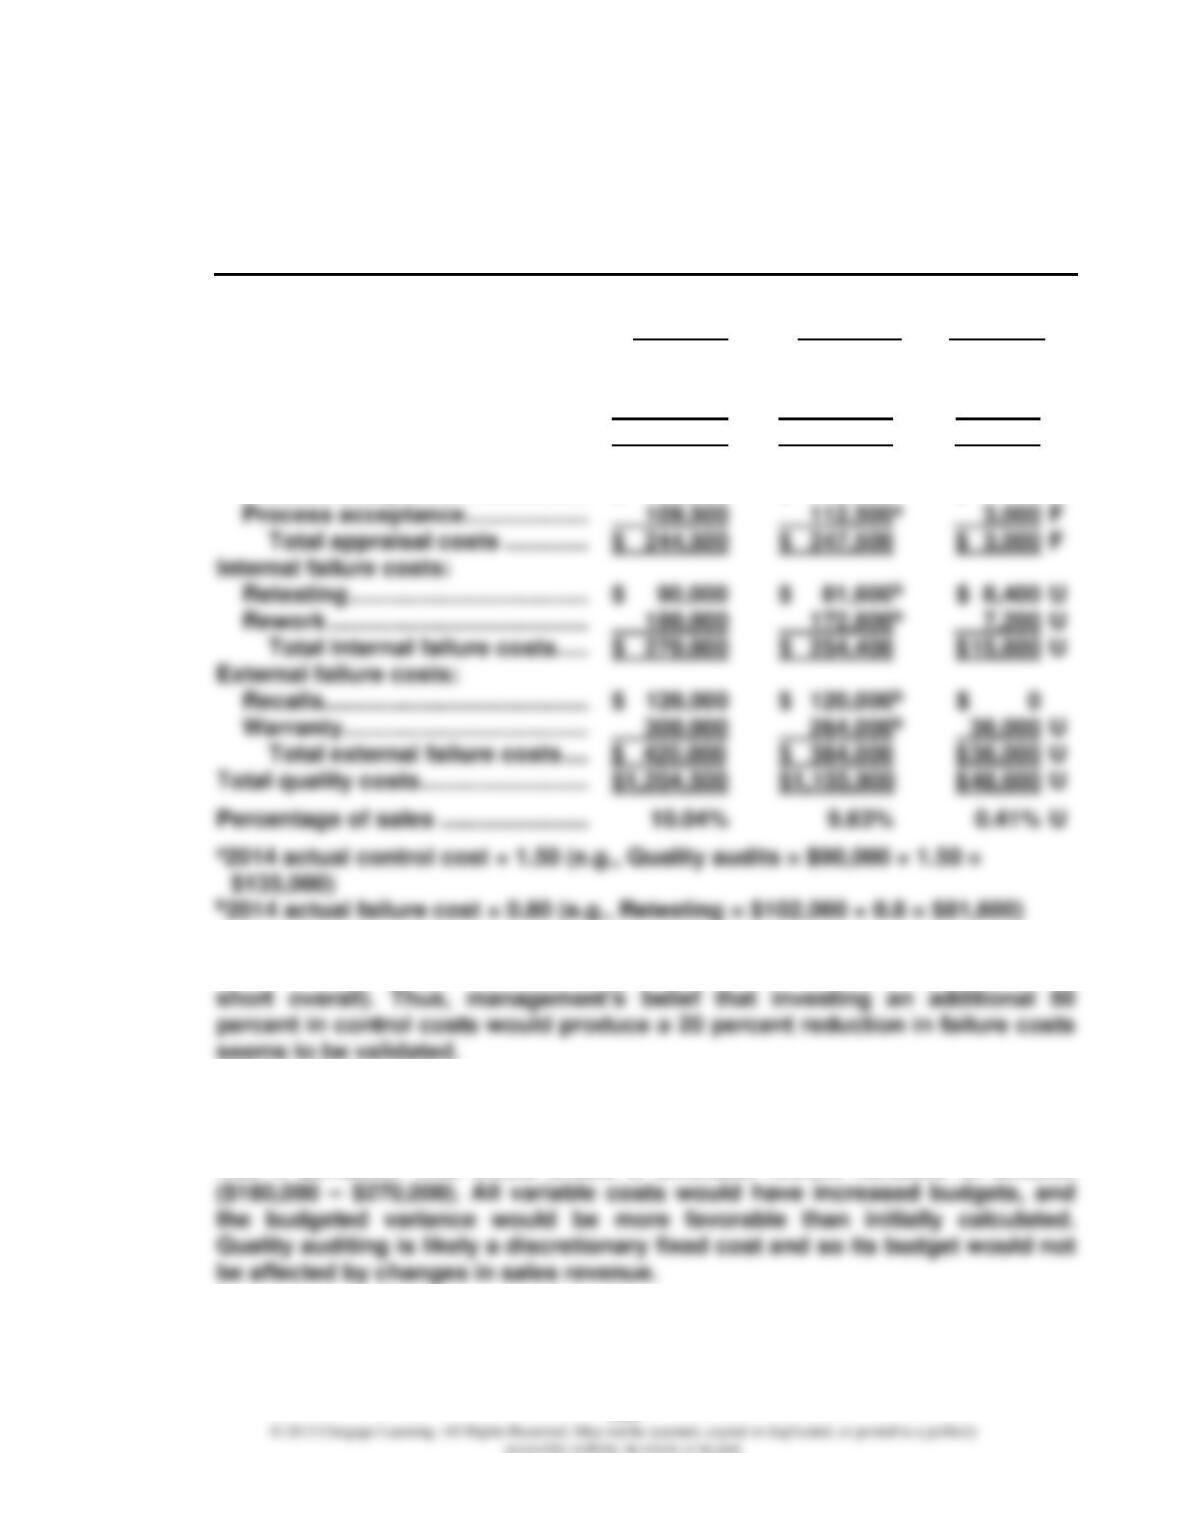
1. Davis, Inc.
Interim Standard Performance Report: Quality Costs
For the Year Ended December 31, 2015
Actual Budgeted
Costs Costs Variance
Prevention costs:
Quality audits ……………………….. $ 90,000 $ 90,000a $ 0
Vendor certification ………………. 180,000 180,000a 0
Total prevention costs ……….. $ 270,000 $ 270,000 $ 0
Appraisal costs:
Product acceptance ………………. $ 135,000 $ 135,000a $ 0
2. Davis has come very close to meeting the planned outcomes (only 0.41 percent
3. Rework would be expected to vary with sales. Thus, a 25 percent increase in
sales, would cause a 25 percent increase in budgeted rework costs: $216,000 ×
1.25 = $270,000. This would create a favorable rework variance of $90,000
14-6
Cornerstone Exercise 14.3
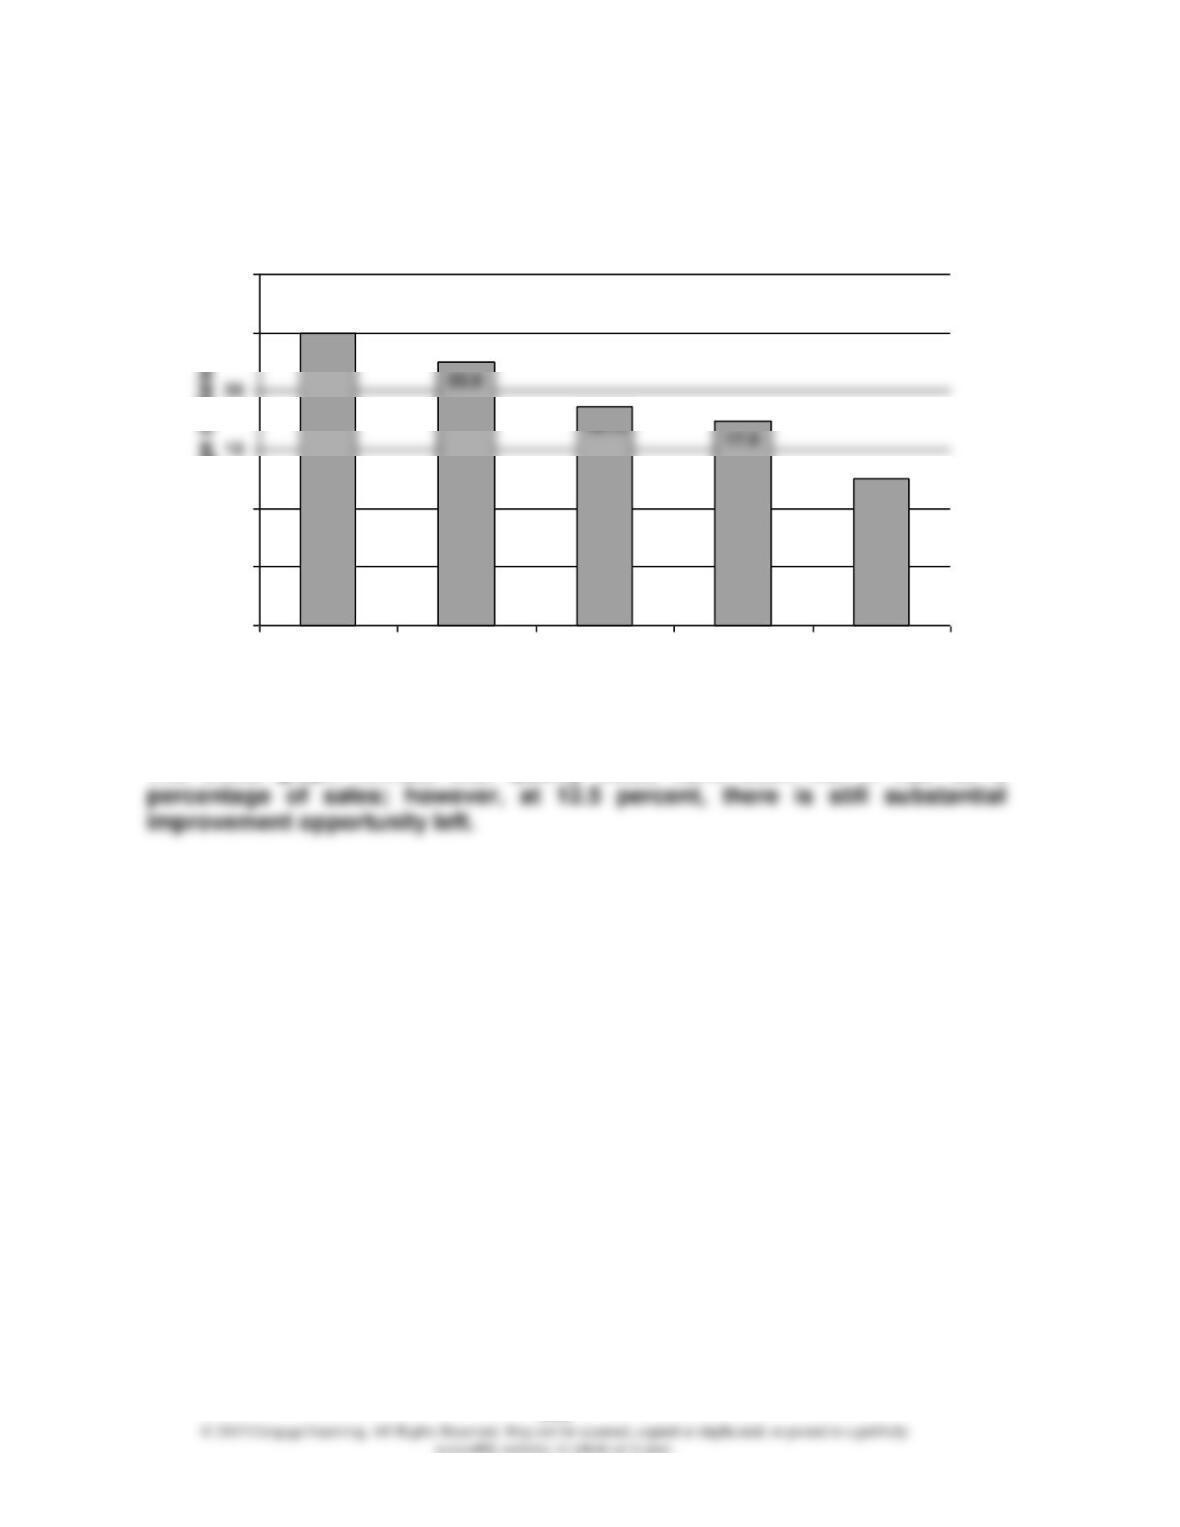
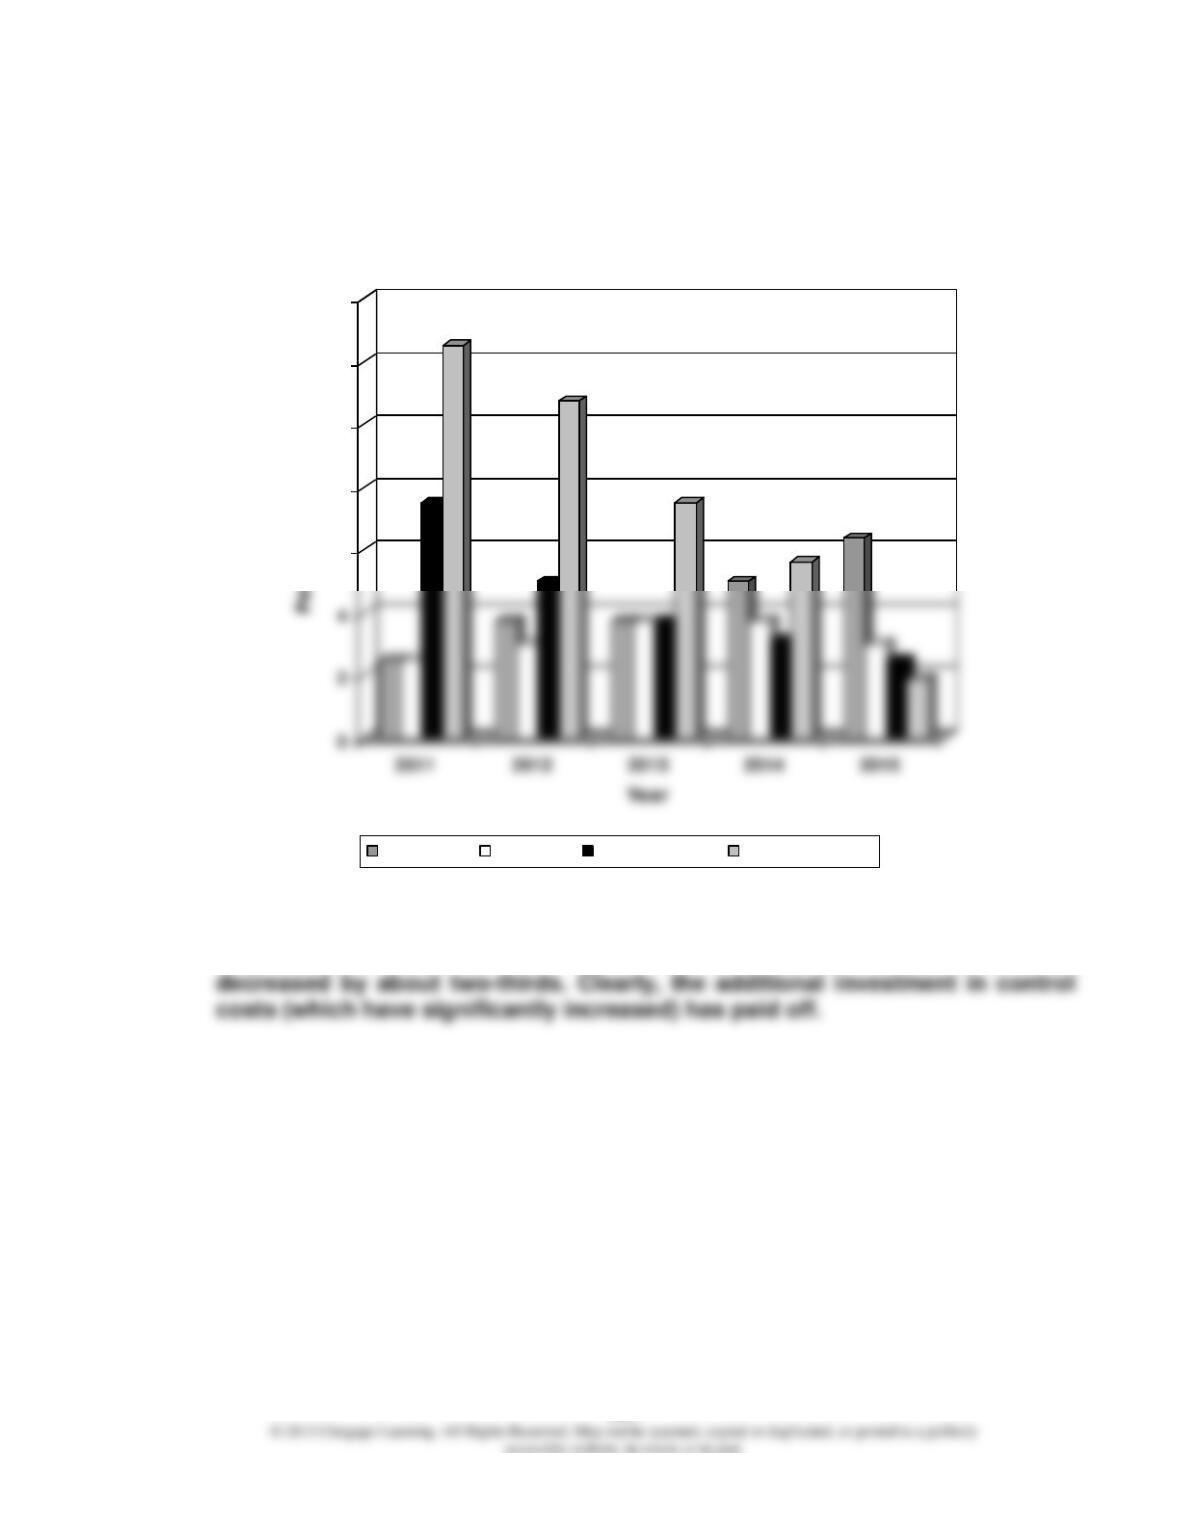
1.
The trend graph reveals that quality costs have been cut in half as a
Multiple-Period Trend Graph: Total Quality Costs
25
12.5
0
5
10
25
30
2011 2012 2013 2014 2015
Year
Percentage of Sales
14-7
Cornerstone Exercise 14.3 (Continued)
2.
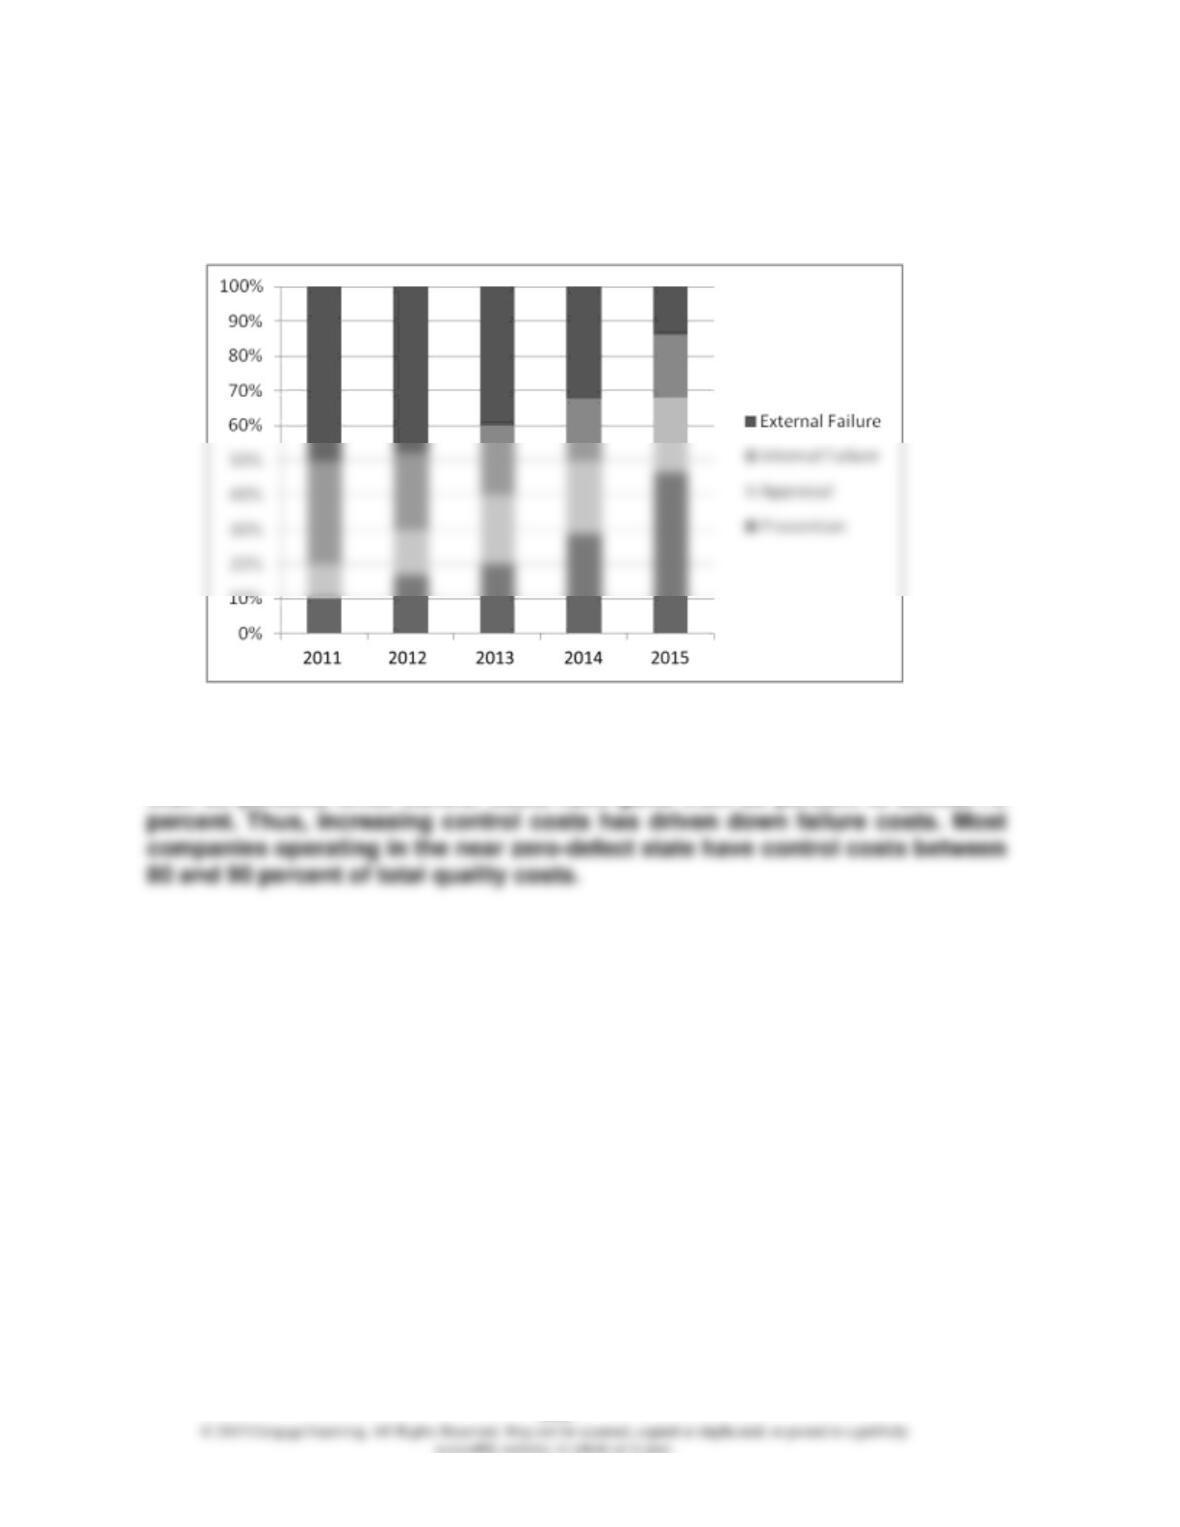
This graph reveals much more detail. For example, external failure costs are
only about one-sixth of the original amount. Internal failure costs have
6
8
10
12
14
Multiple-Period Trend Graph: Individual Quality Cost
Categories
Prevention Appraisal Internal Failure External Failure
14-8
Cornerstone Exercise 14.3 (Concluded)
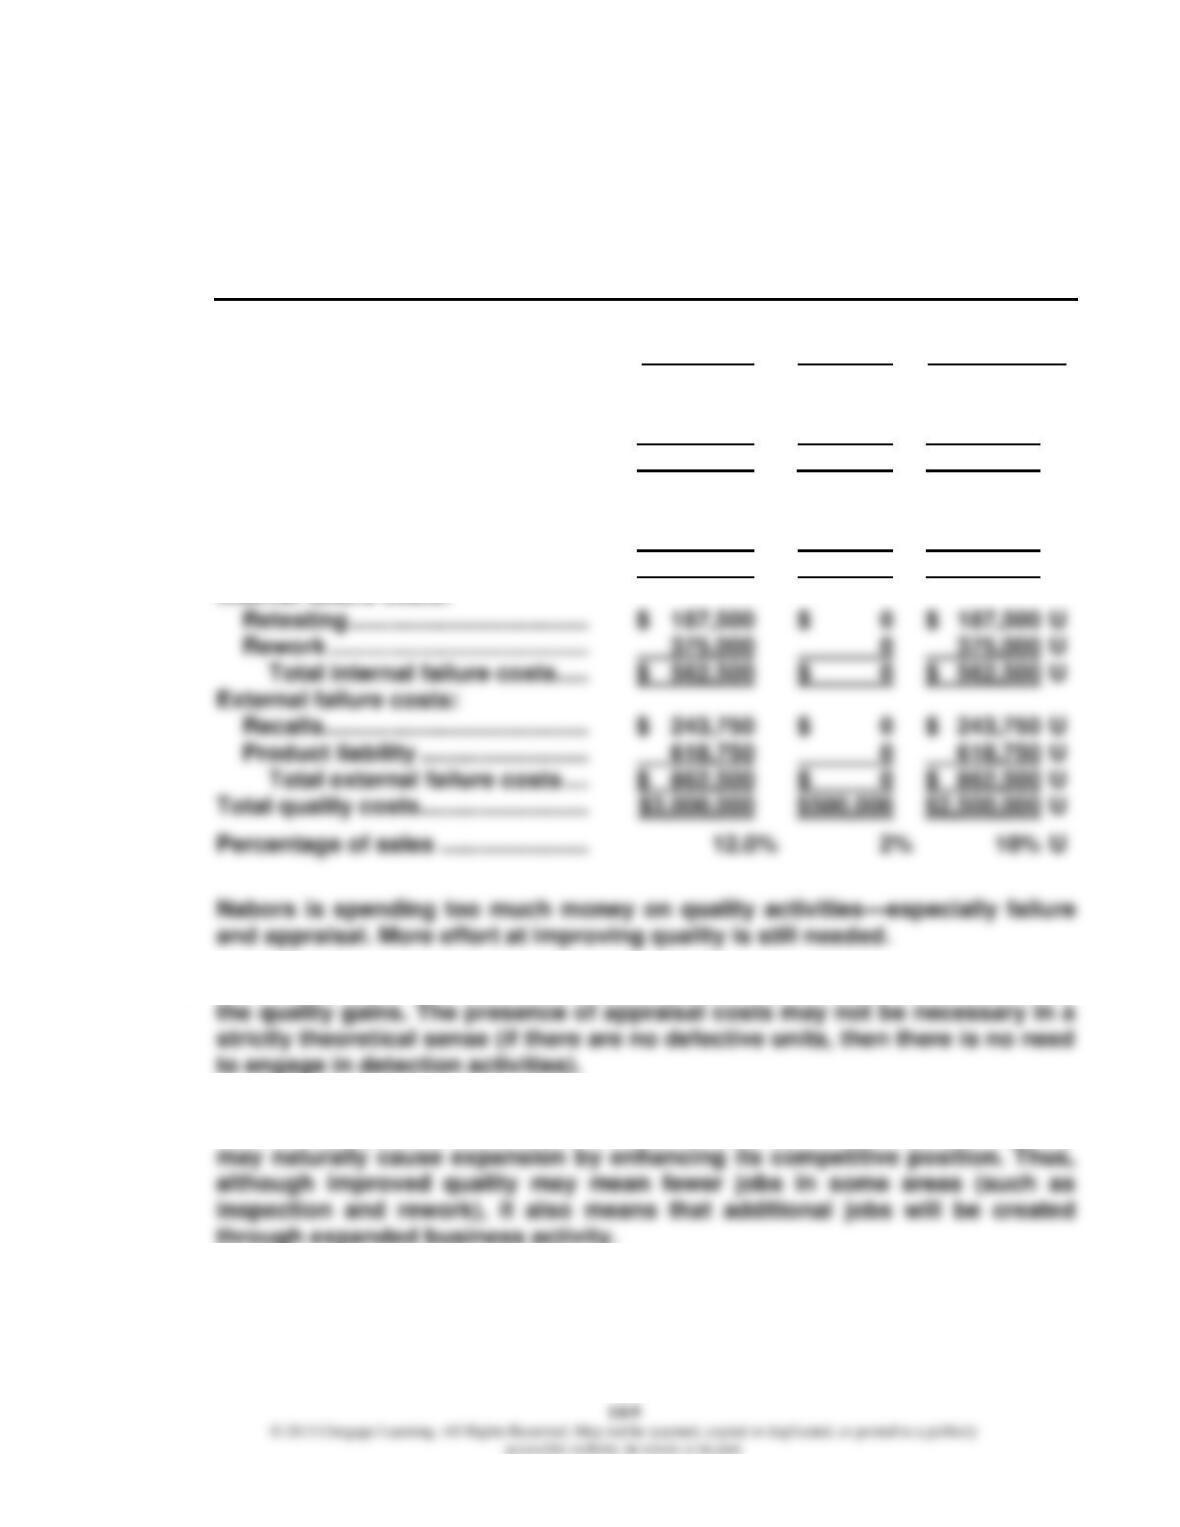
3. Multiple-Period Trend Graph: Relative Quality Costs
Failure costs have decreased from 80 percent of total costs to a little more
than 30 percent, while control costs have gone from 20 percent to almost 70
Cornerstone Exercise 14.4
1. Nabors Company
Long-Range Performance Report
For the Year Ended June 30, 2015
Actual Target
Costs Costs Variance
Prevention costs:
Prototype inspection …………….. $ 300,000 $375,000 $ 75,000 F
Vendor Certification ………………. 600,000 75,000 525,000 U
Total prevention costs ……….. $ 900,000 $450,000 $ 450,000 U
Appraisal costs:
Process acceptance ………………. $ 315,000 $ 50,000 $ 265,000 U
Test labor ……………………………… 360,000 0 360,000 U
Total appraisal costs …………. $ 675,000 $ 50,000 $ 625,000 U
Internal failure costs:
2. Prevention costs are value-added costs and would be necessary to maintain
3. By spending less money on defects, Nabors can use the savings to expand
and to employ additional people to support this expansion. Improved quality
14–10
Cornerstone Exercise 14.5
1. Verde Company
Environmental Cost Report
For the Year Ended December 31, 2015
Percentage
Environmental of Operating
Costs Costsa
Prevention costs:
Obtaining ISO 14001 certification .. $1,050,000
Designing processes …………………. 420,000 $ 1,470,000 2.94%
Detection costs:
Testing for contamination ………….. $ 700,000
Inspecting products …………………… 420,000 1,120,000 2.24
Internal failure costs:
2. Relative Distribution: Environmental Costs
Cornerstone Exercise 14.5 (Concluded)
14–11
3. The most likely reason is that the cost is a social cost and not paid for by the
company and thus not of direct interest to Verde. In fact, such formal
recognition may create a potential liability for the company. The ethical nature
of this issue is a difficult one. Several questions can be asked. Is the
company consciously avoiding the reporting of unfavorable information? Is
the company reporting all relevant information that could influence a user’s
understanding of the reports? Is information being communicated fairly and
objectively? Answers to these kinds of questions will help determine the
ethical content of the issue. Formal recognition is usually not required and so
Cornerstone Exercise 14.6
1. Rates:
Design products: $270,000/9,000 = $30 per design hour
2. Product costs:
Activities Solvent X Solvent Y
Design products ($30 × 6,000; $30 × 3,000) ……….. $ 180,000 $ 90,000
Test, contamination ($20 × 10,500; $20 × 13,500) .. 210,000 270,000
Treat toxic waste ($50 × 1,200; $50 × 28,800) ……… 60,000 1,440,000
14–12
Cornerstone Exercise 14.6 (Concluded)
3. Using the associated activity rates of $30 per design hour ($360,000/12,000)
and $50 per pound of waste ($750,000/15,000), the design cost assigned to Y
14–13
EXERCISES
Exercise 14.7
1. A quality product is one that meets or exceeds customer expectations relative
to key quality attributes such as performance, aesthetics, reliability, durabil-
2. Traditionally, a defective product has been defined as one that fails to con-
form to certain quality specifications. Usually, this meant that the product’s
conformance was within an acceptable range of some ideal target value for
Exercise 14.8
1. Dental services should immediately convey the importance of aesthetics for
service quality. Imagine walking into a dental office where the waiting area
2. Responsiveness conveys the notion of being willing to help customers and
provide prompt, consistent service. Assurance refers to the knowledge and
Exercise 14.9
1. Unit No. Actual Diameter y – T (y – T)2 k(y – T)2
2 0.30 0.02 0.0004 12.00
4 0.27 –0.01 0.0001 3.00
Thus, the average loss per unit is $6.75.
3. k(Measured costs) = Total external failure costs
k(Measured costs) = Measured costs + Hidden costs
(k – 1)(Measured costs) = Hidden costs
Measured costs = Hidden costs/(k – 1)
Exercise 14.10
2. Prevention
4. External failure
6. External failure
8. Internal failure
10. Internal failure
12. Appraisal
14. Prevention
16. Prevention
18. Prevention
20. Appraisal
22. Prevention
14–15
Exercise 14.11
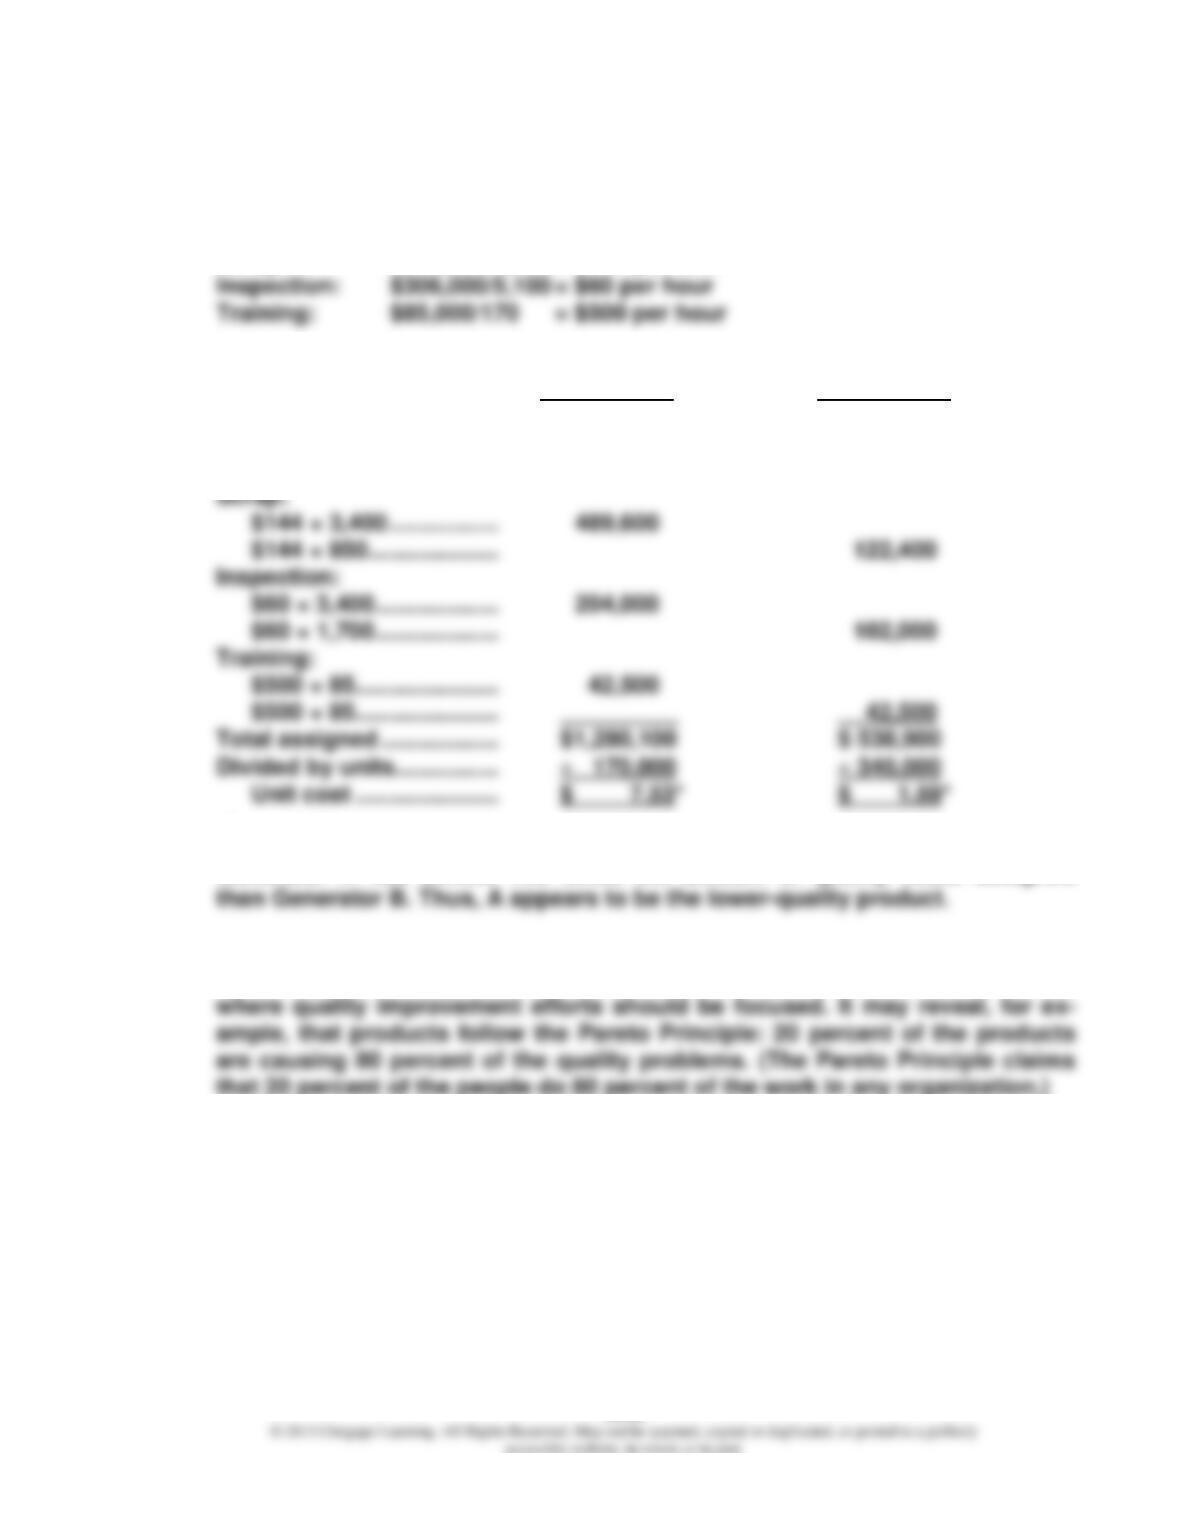
1. Activity rates:
Warranty: $816,000/2,550 = $320 per unit
Scrap: $612,000/4,250 = $144 per unit
Product cost:
Generator A Generator B
Warranty:
$320 × 1,700 …………….. $ 544,000
$320 × 850 ……………….. $ 272,000
*Rounded.
Generator A has almost five times the amount of quality costs assigned
2. The unit quality cost can be used to rank products in order of the lowest qual-
ity to that of the highest. This information can then be used to determine
14–16
Exercise 14.12
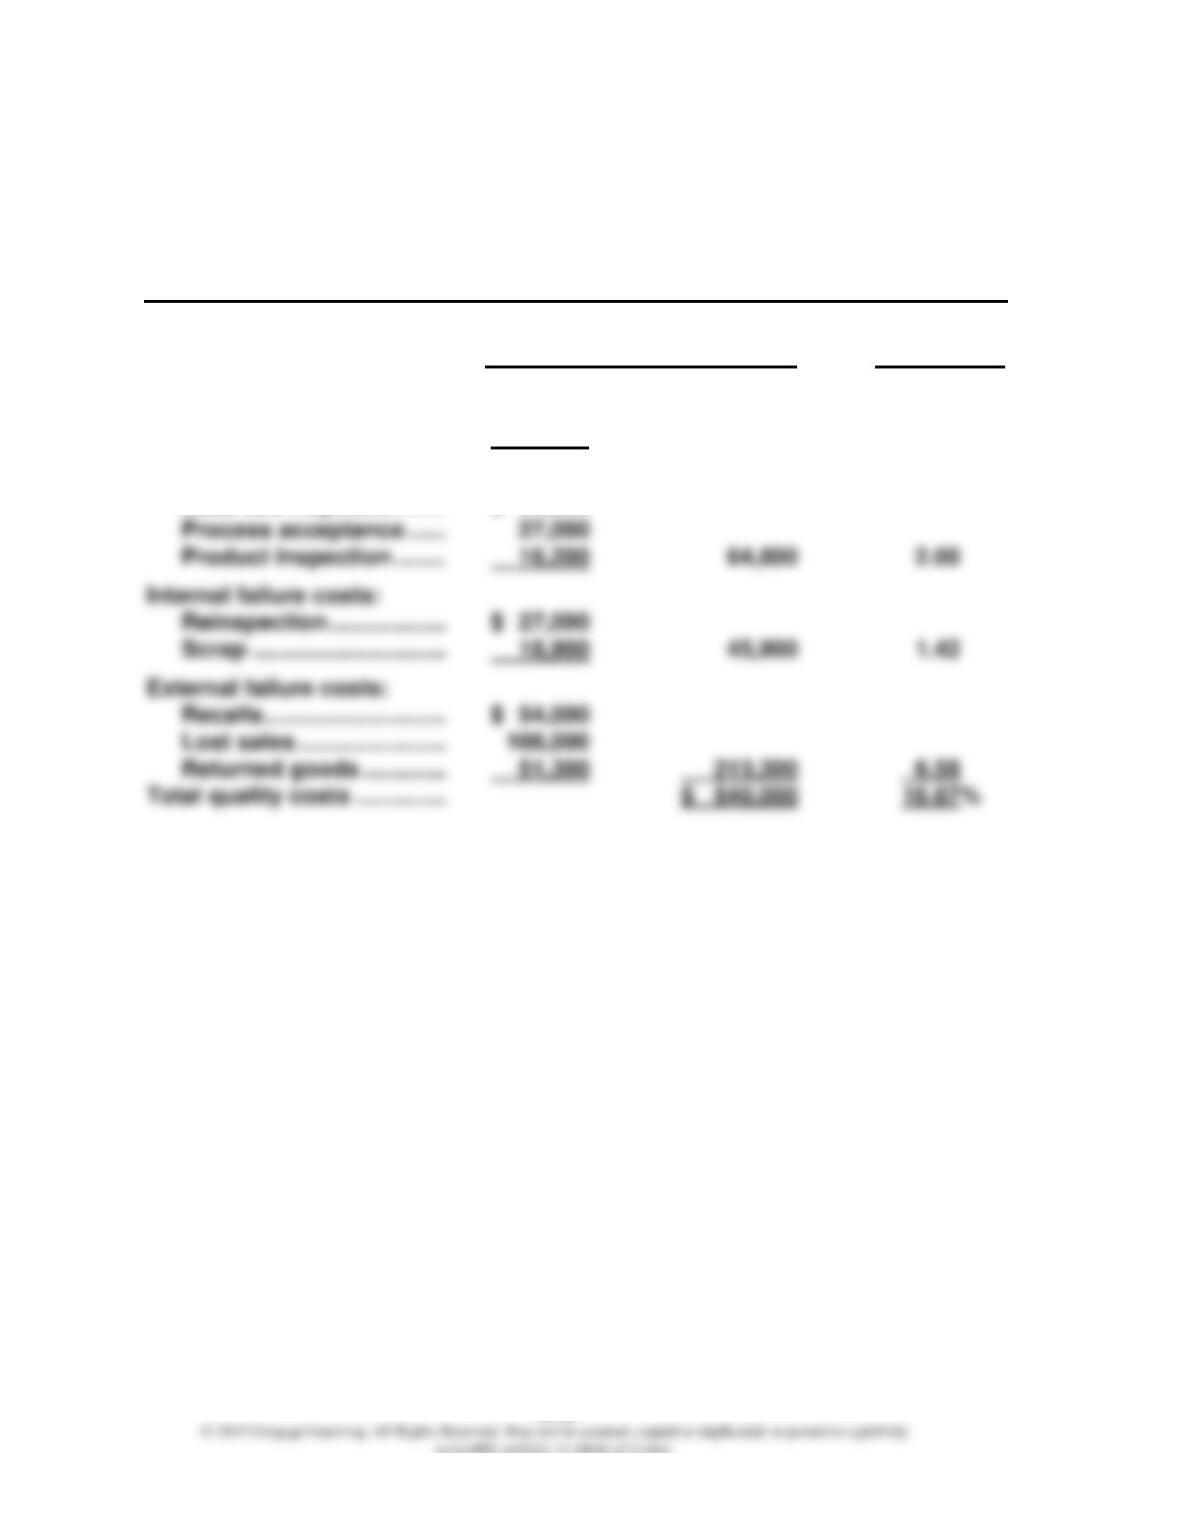
1. Kang Company
Quality Cost Report
For the Year Ended December 31, 2015
Percentage
Quality Costs of Sales
Prevention costs:
Design review ……………. $ 162,000
Quality training ………….. 54,000 $ 216,000 6.67%
Appraisal costs:
Materials inspection …… $ 21,600
14–17
Exercise 14.12 (Concluded)
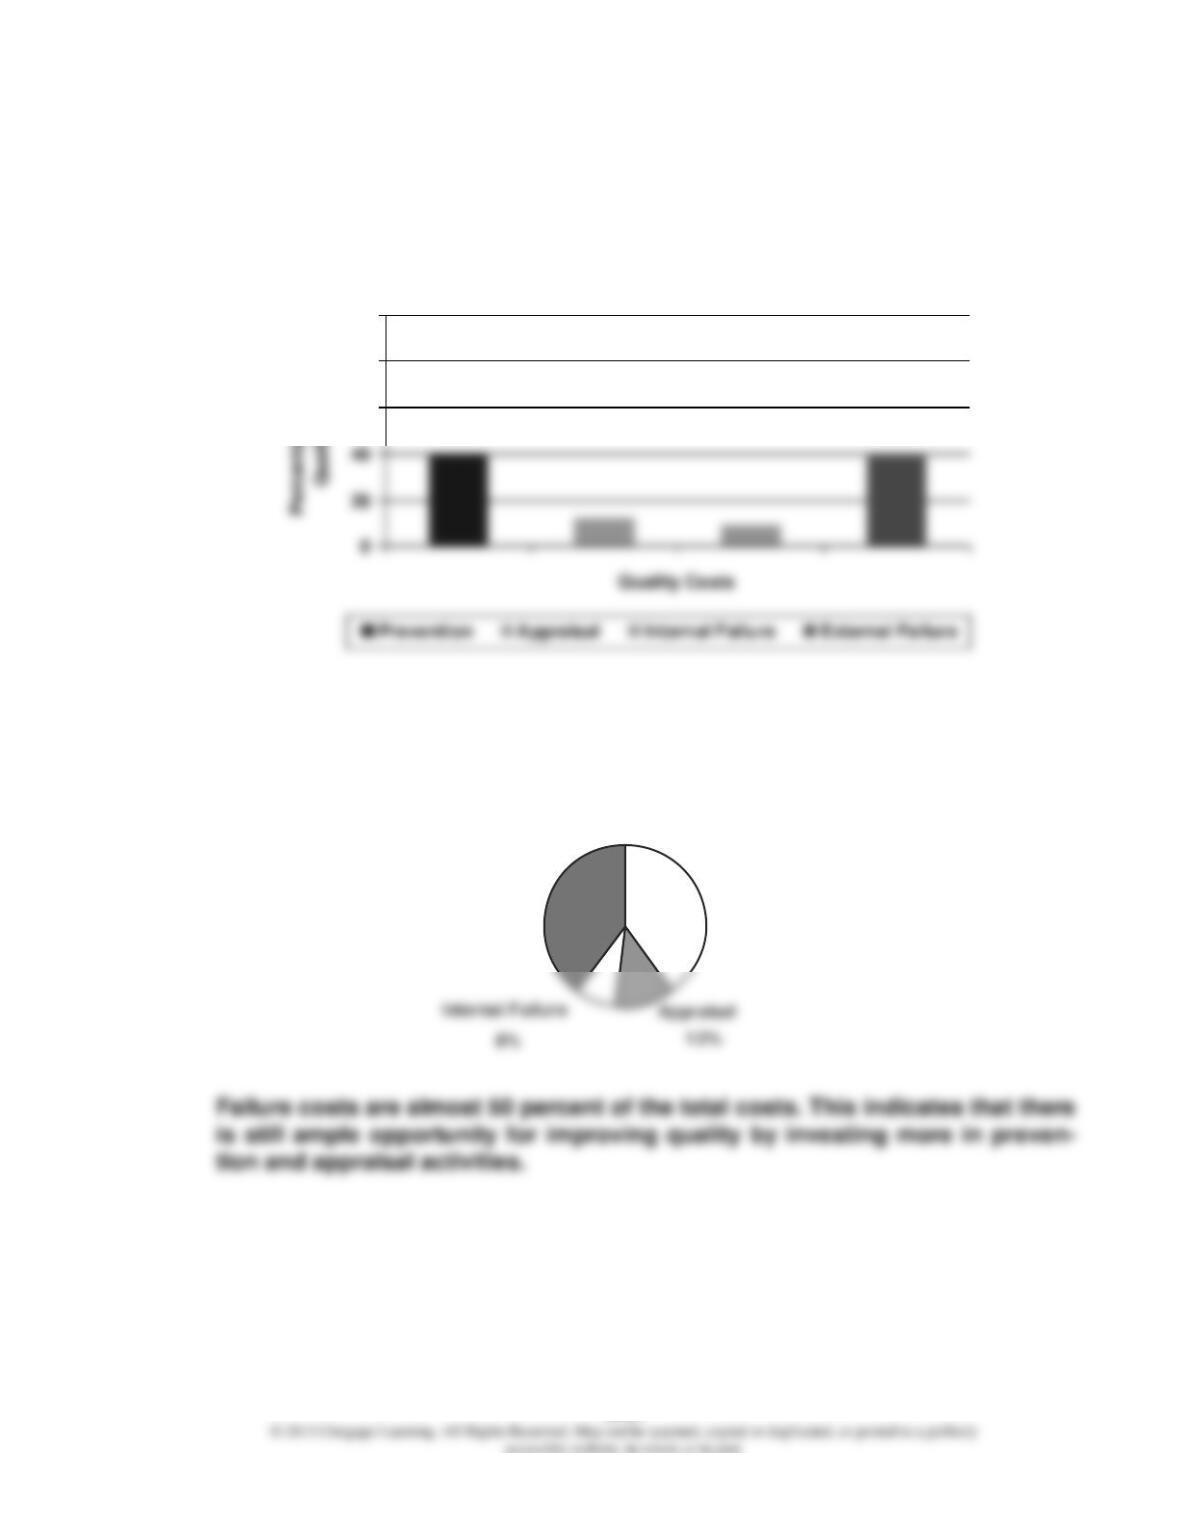
2.
Relative Distribution of Quality Costs
60
80
100
Relative Distribution of Quality Costs
40%
40%
Prevention
External Failure
14–18
Exercise 14.13
1. Quality costs:
Year 1: $5,000,000 (0.25 × $20,000,000)
Year 2: $4,840,000 (0.22 × $22,000,000)
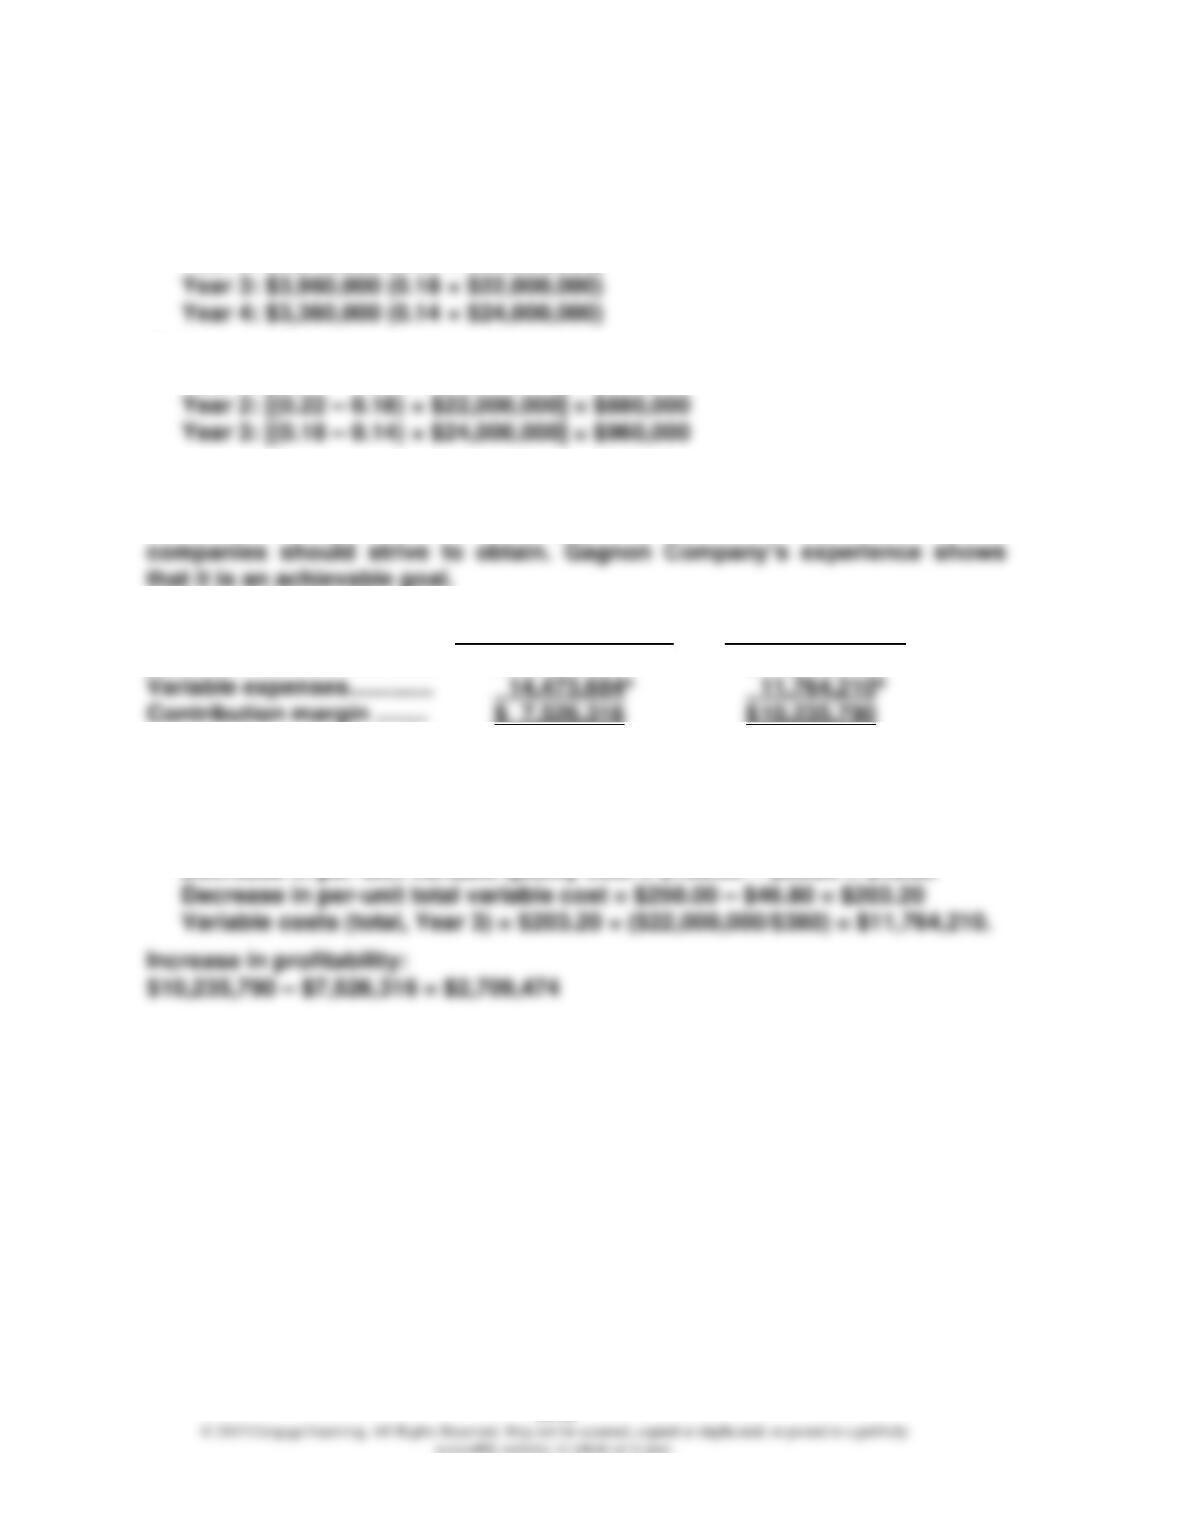
Net income increase:
Year 1: [(0.25 – 0.22) × $22,000,000] = $660,000
2. Profit potential: [(0.14 – 0.025) × $24,000,000] = $2,760,000
The 2.5 percent goal is the level many quality experts identify as the one that
3. Year 3—No Change Year 3—Change
Sales ………………………….... $ 22,000,000 $ 22,000,000
a$250 × $22,000,000/$380
bQuality costs per unit:
Year 1: 0.25 × $400 = $100.00
Year 3: 0.14 × $380 = $ 53.20
Decrease in per-unit variable quality cost = $100.00 – $53.20 = $46.80
14–19
Exercise 14.14
1. 2011: $15,000,000/$60,000,000 = 0.25
2.5 percent ratio is achievable as evidenced by the experiences of real-world
corporations (e.g., Tennant Company).
2. Internal failure: $4,500,000/$15,000,000 = 30%
External failure: $6,000,000/$15,000,000 = 40%
The pie chart for 2011 is as follows:
Relative Distribution of Quality Costs
12%
Internal Failure
Pr evention
14–20
Exercise 14.14 (Continued)
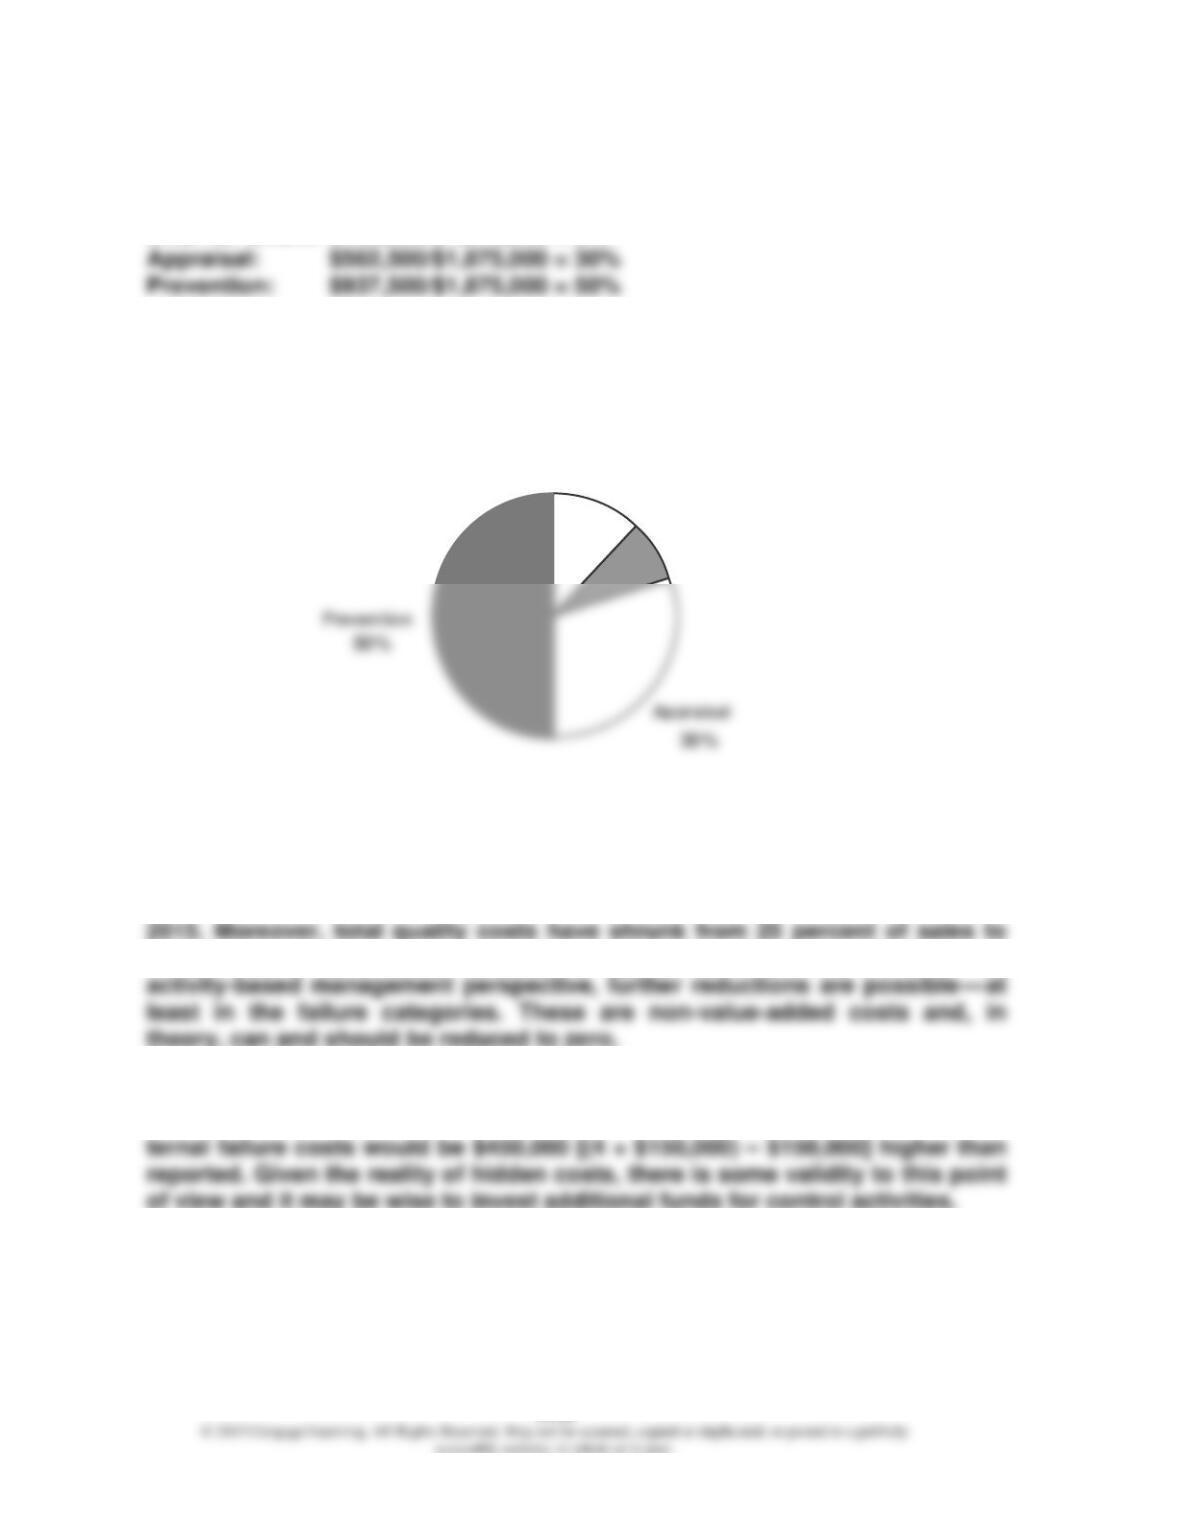
3. Internal failure: $225,000/$1,875,000 = 12%
External failure: $150,000/$1,875,000 = 8%
The pie chart for 2015 is as follows:
Relative Distribution of Quality Costs
12%
8%
Internal Failure
External Failure
Quality costs are better distributed than in 2011. Control costs account for
80 percent of the total quality costs (versus only 30 percent in 2011). Failure
costs have shrunk from 70 percent of the total in 2011 to only 20 percent in
2.5 percent of sales. Costs in every category have been reduced. From an
4. Some external failure costs are not measured and reported in the accounting
records. If the multiplier effect were four (for example), then in 2015, the ex-