Wild and Shaw Financial and Managerial Accounting 9e Solutions Manual: Chapter 13
874
Problem 13–4B (Concluded)
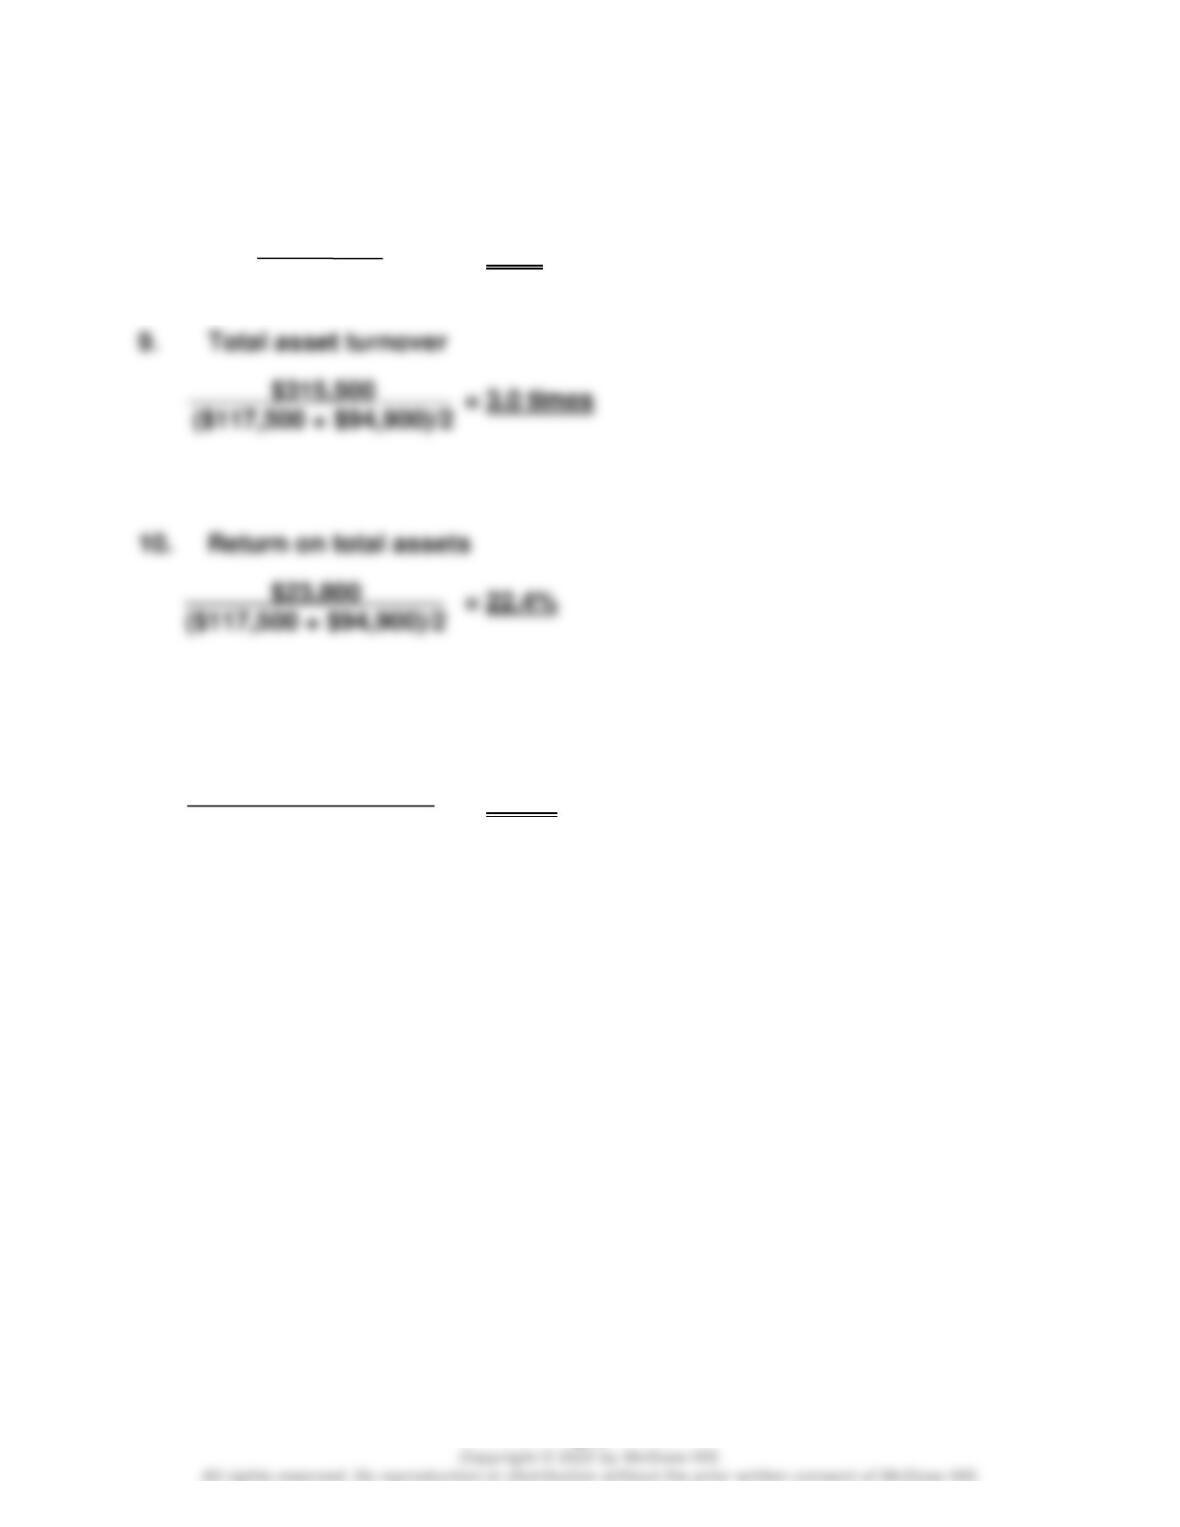
8. Profit margin ratio
= 7.5%
11. Return on equity
= 38.3%
$23,800
$315,500
$23,800
($70,100 + $54,300)/2
Wild and Shaw Financial and Managerial Accounting 9e Solutions Manual: Chapter 13
875
Problem 13-5B (60 minutes)
Part 1
Fargo Company
Ball Company
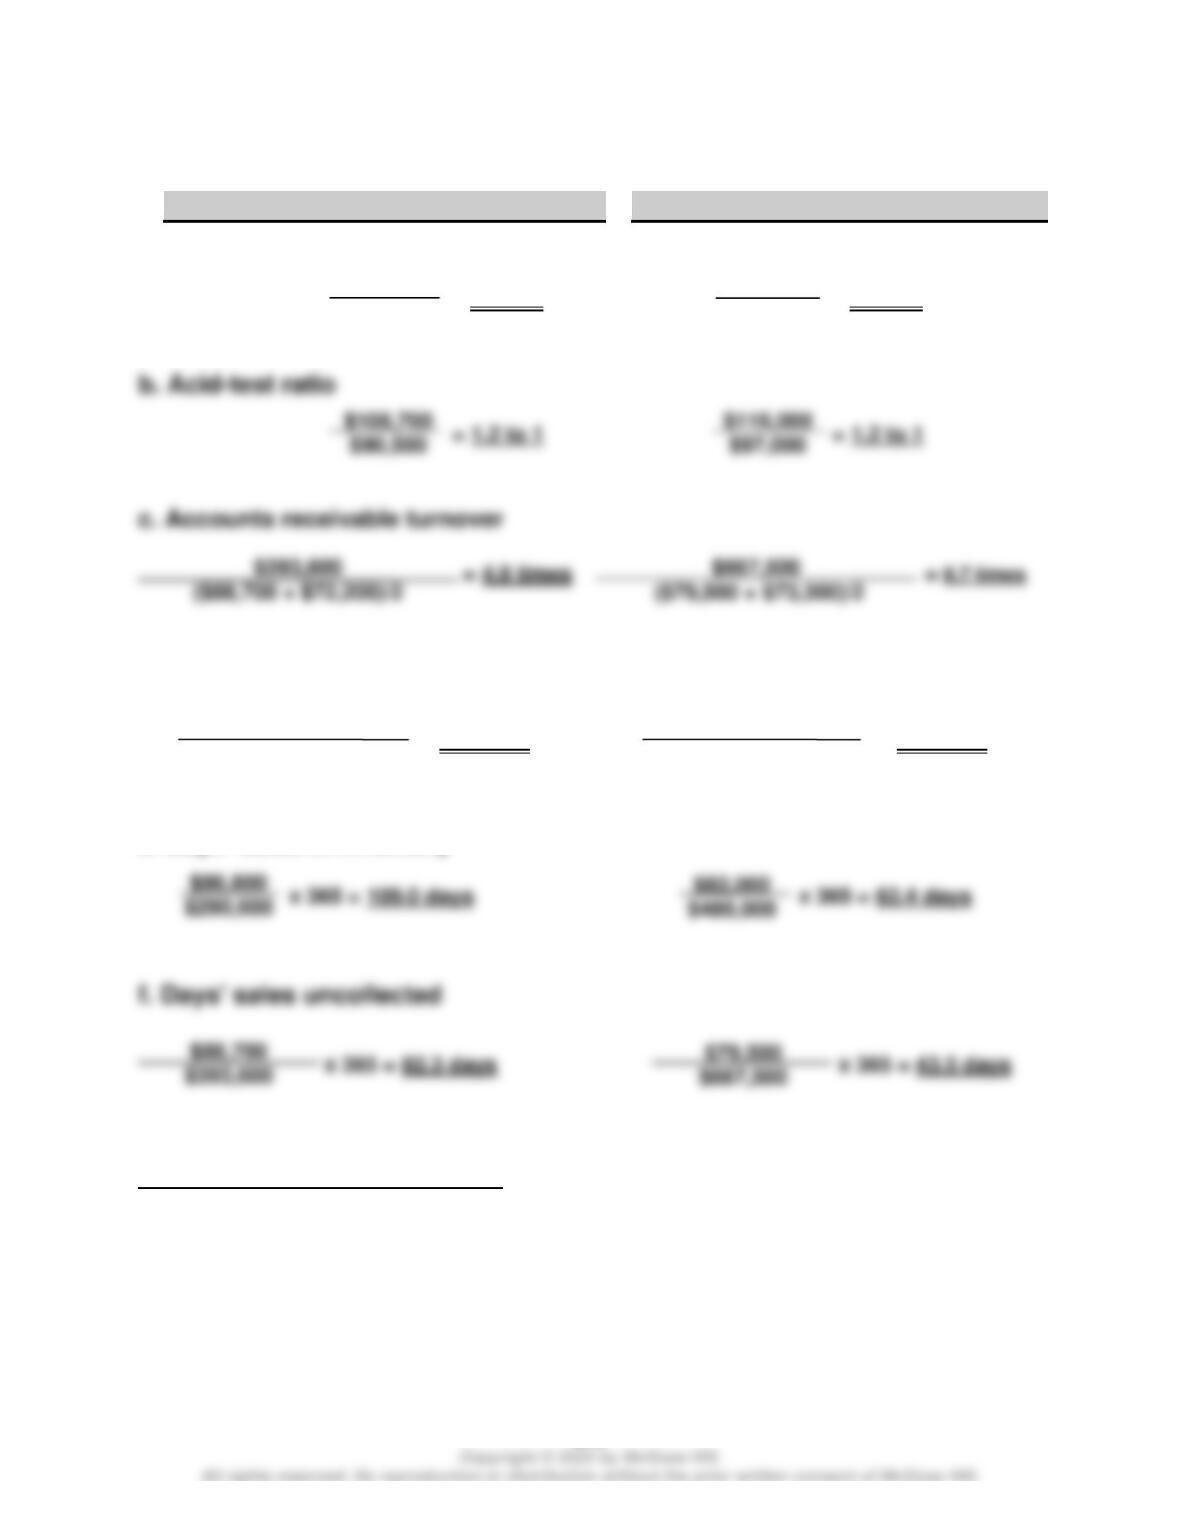
a. Current ratio
= 2.3 to 1
= 2.1 to 1
$393,600
$667,500
d. Inventory turnover
= 3.0 times = 5.9 times
e. Days’ sales in inventory
Short-term credit risk analysis: Fargo and Ball have nearly equal current
ratios and equal acid-test ratios. However, Ball both turns its merchandise
and collects its accounts receivable much more rapidly than Fargo. On this
basis, Ball probably is the better short-term credit risk.
$290,600
($86,800 + $105,100)/2
$205,200
$90,500
$208,100
$97,000
$480,000
($82,000 + $80,500)/2
Wild and Shaw Financial and Managerial Accounting 9e Solutions Manual: Chapter 13
876
Problem 13-5B (Concluded)
Part 2
Fargo Company
Ball Company
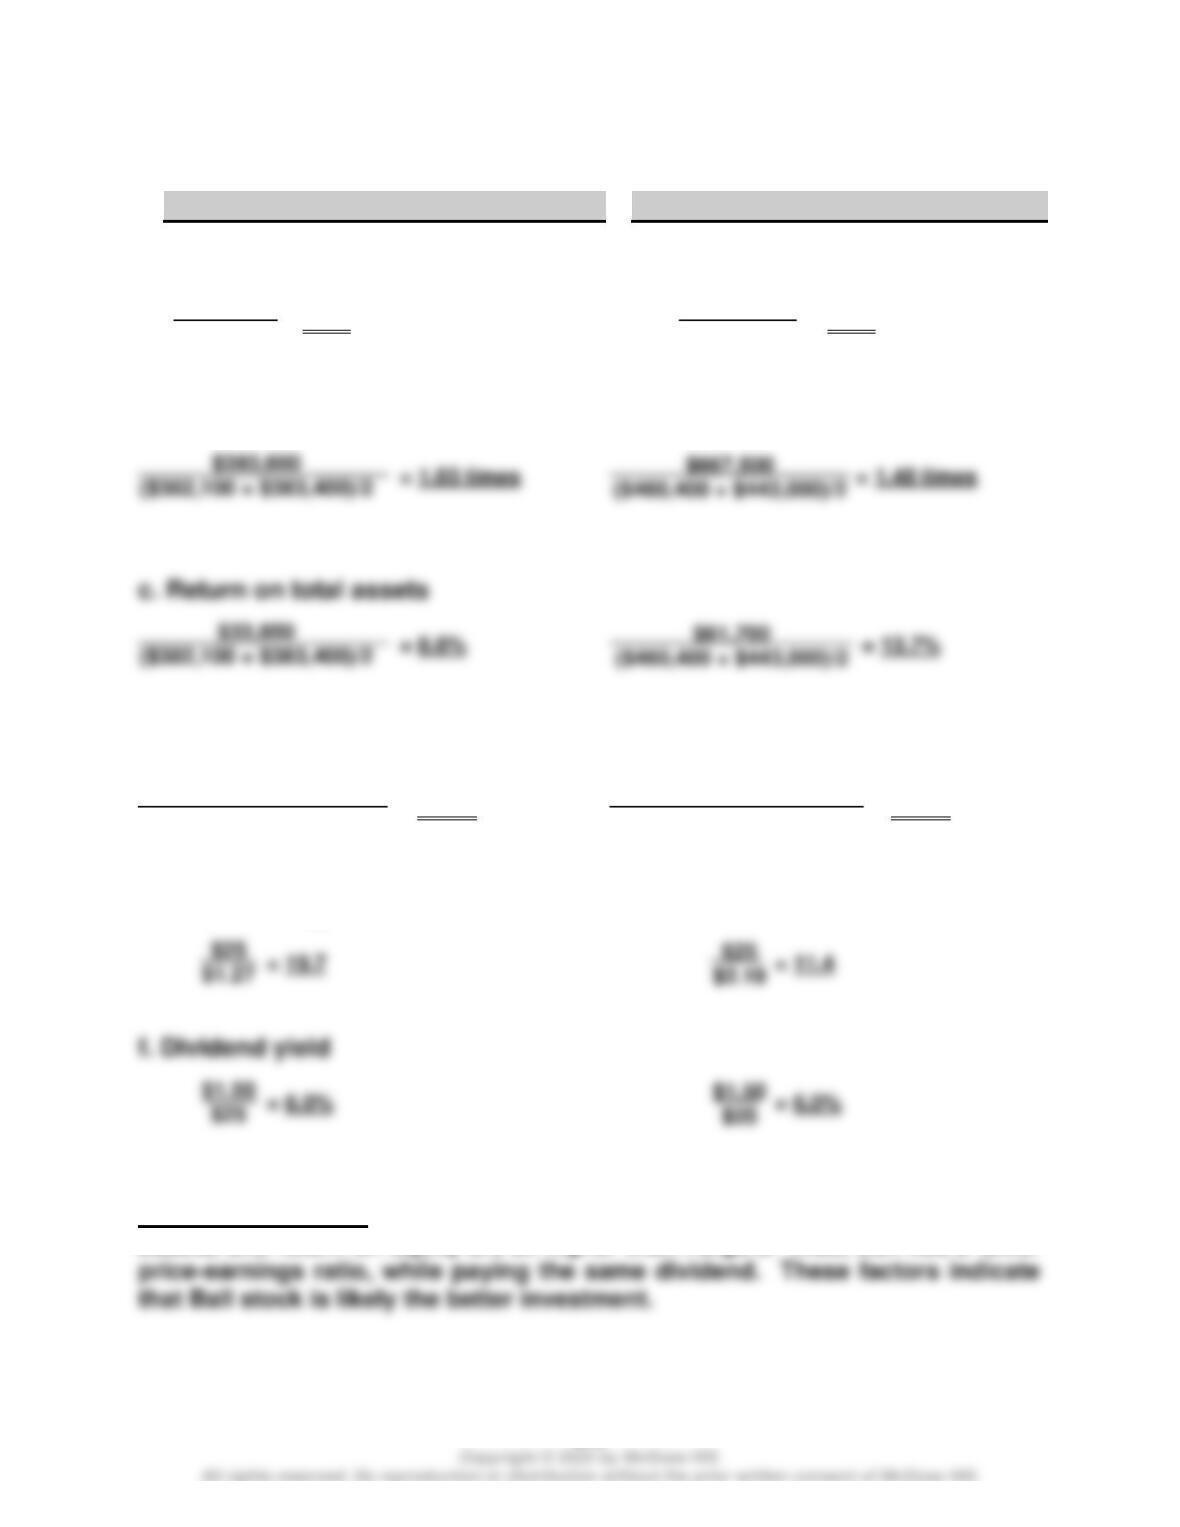
a. Profit margin ratio
= 8.6% = 9.2%
b. Total asset turnover
$33,850
($382,100 + $383,400)/2
d. Return on equity
= 17.8% = 23.7%
e. Price-earnings ratio
Investment analysis: Ball’s profit margin, total asset turnover, return on total
assets, and return on equity are all higher than Fargo‘s. Also, Ball has a lower
$33,850
$393,600
$33,850
($198,600 + $182,100)/2
$61,700
$667,500
$61,700
($270,100 + $250,700)/2
Wild and Shaw Financial and Managerial Accounting 9e Solutions Manual: Chapter 13
877
Problem 13–6BA (60 minutes)
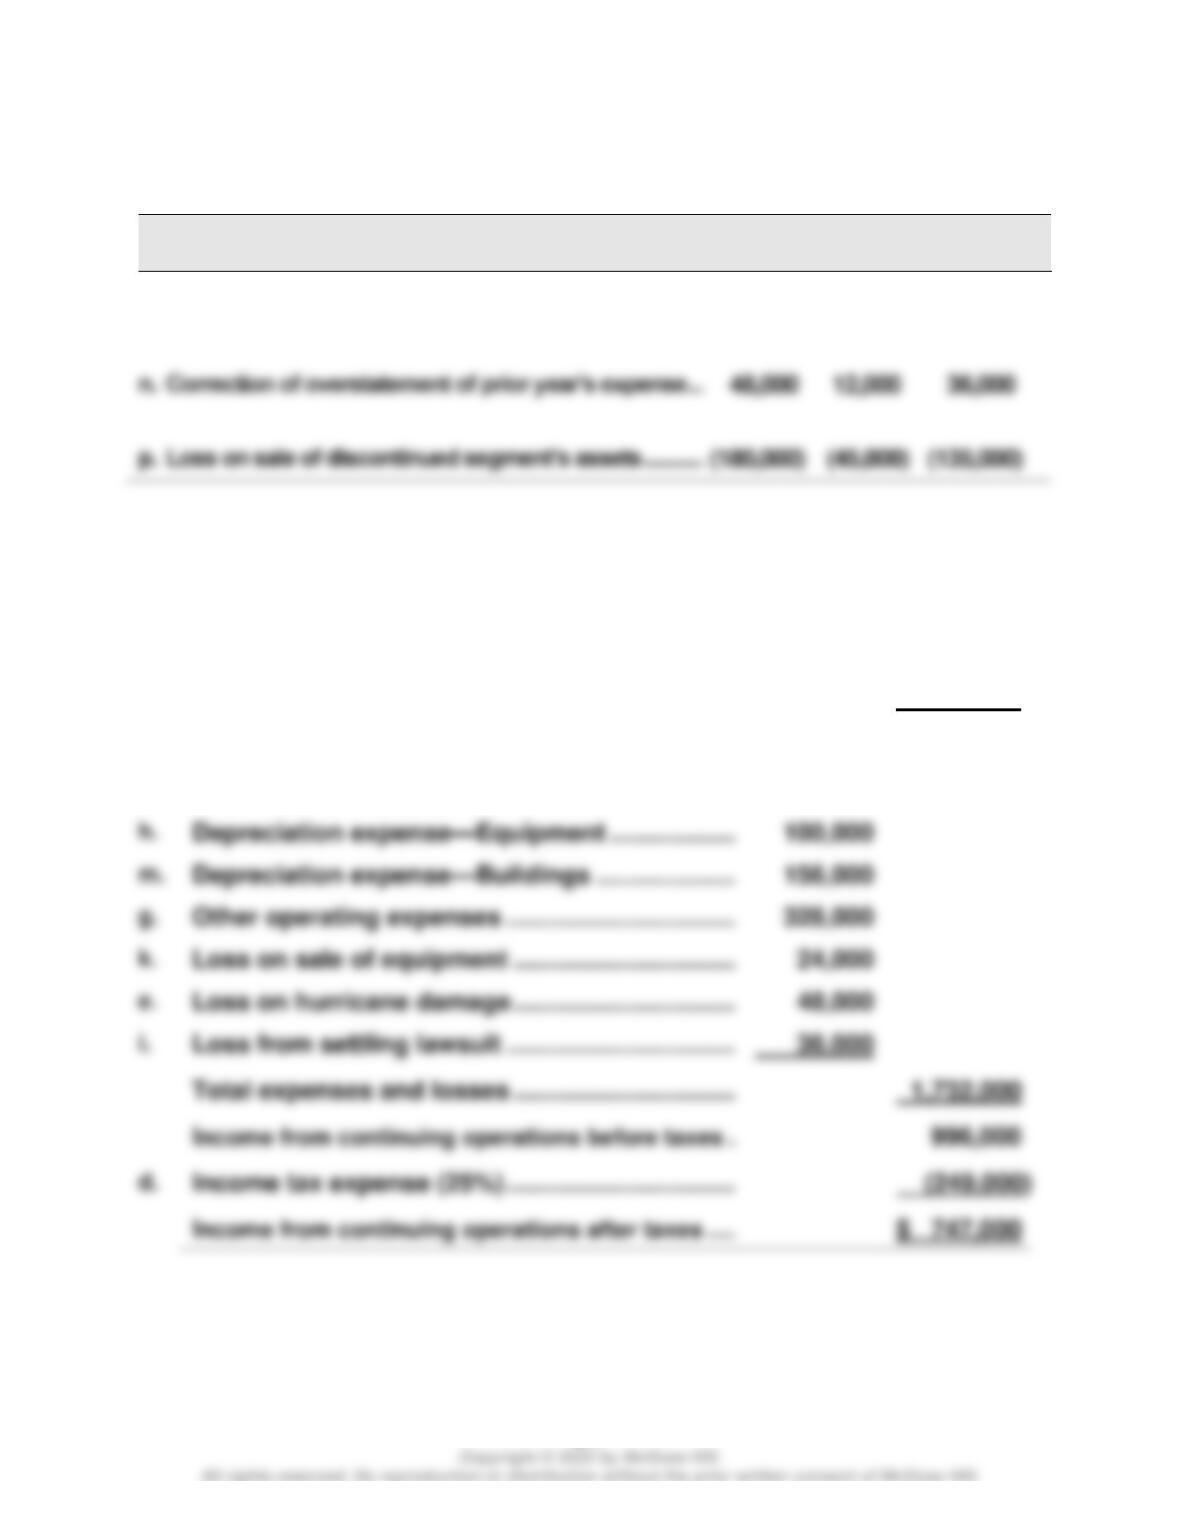
Part 1 Effect of income taxes (debits or losses in parentheses)
Pretax
25% Tax
Effect
After-Tax
l. Loss from operating a discontinued segment …………………….
(120,000)
(30,000)
(90,000)
12,000
Part 2 Income from continuing operations (and its components)
c.
Net sales ……………………………………………………….
$2,640,000
b.
Interest revenue …………………………………………………….
20,000
j.
Gain from settling lawsuit ………………………………………
68,000
Total revenues and gains ………………………………………
2,728,000
o.
Cost of goods sold …………………………..……………………
$1,040,000
h.
Depreciation expense—Equipment ………………………..
Depreciation expense—Buildings ………………………….
g.
Other operating expenses ……………………………………..
k.
i.
Total expenses and losses …………………………..………..
d.
Income tax expense (25%) ……………………………………..
Wild and Shaw Financial and Managerial Accounting 9e Solutions Manual: Chapter 13
878
Problem 13–6BA (Concluded)
Part 3 Income from discontinued segment
l.
Loss from operating a discontinued segment (after-tax) ………………
$ (90,000)
Part 4 Net income
Income from continuing operations after taxes …………………………..
$747,000
Income (loss) from discontinued segment …………………………..
Wild and Shaw Financial and Managerial Accounting 9e Solutions Manual: Chapter 13
SERIAL PROBLEM — SP 13
Serial Problem — Business Solutions (45 minutes)
1. Gross margin with services revenue
Gross margin = Total revenue – Cost of goods sold
Gross margin without services revenue
Gross margin = Net (goods) sales – Cost of goods sold
2. Current ratio = $95,568 / $875 = 109.2
Acid-test ratio = $90,924 / $875 = 103.9
4. Current assets are 79.4% of total assets ($95,568/$120,268)
Wild and Shaw Financial and Managerial Accounting 9e Solutions Manual: Chapter 13
Company Analysis — AA 13-1 (30 minutes)
1. Trend percents for selected income statement accounts
$ millions
Fiscal
2019
Fiscal
2018
Fiscal
2017
Net Sales ………………………………………………………
113.5%
115.9%
100.0%
$260,174
$265,595
$229,234
114.7%
116.1%
100.0%
$161,782
$163,756
$141,048
104.2%
115.6%
100.0%
65.8%
100.0%
66.6%
100.0%
114.3%
123.1%
100.0%
2. Common-size percents for asset categories and accounts
$ millions
2019
2018
Total current assets ………………………………………
48.1%
35.9%
$162,819
$131,339
Accounts receivable, net …………………………..
3. More liquid
Explanation: Using current assets as a percent of total assets to
881
1.
$ millions
Apple
Google
Cash and equivalents ………….
14.4%
$48,844
6.7%
$18,498
Accounts receivable, net …….
6.8%
22,926
9.2%
25,326
Retained earnings ………………
13.6%
152,122
2. Decrease
Explanation: If Google paid a dividend, it would reduce its retained
3. Google
Explanation: Apple’s cost of sales percent is higher at 62.2% compared
Wild and Shaw Financial and Managerial Accounting 9e Solutions Manual: Chapter 13
Extended Analysis — AA 13-3 (20 minutes)
1.
$ millions
Samsung
Cash and equivalents ………………………………….
7.6%
$ 23,069
Accounts receivable, net ……………………………..
7.6%
Retained earnings ……………………………………….
Revenues ……………………………………………………
2. 36.1%
Explanation: Samsung’s cost of sales percent is 63.9%. This implies that
3. Outperform
Explanation: Samsung’s gross margin ratio exceeds the industry
Wild and Shaw Financial and Managerial Accounting 9e Solutions Manual: Chapter 13
DISCUSSION QUESTIONS
1. Financial reporting includes the entire process of preparing and issuing financial
2. With comparative statements, financial statement items for two or more successive
accounting periods are placed side by side on a single statement, with the change in
3. Total assets (or equivalently, the total of liabilities plus equity) are assigned a value of
4. The nature of a company’s business, the composition of its current assets, and the
turnover of its current assets are three important factors that should be considered in
deciding whether a current ratio is good or bad.
5. A 2-to-1 current ratio may not be adequate if the company’s current assets consist of
6. Adequate working capital enables a company to carry sufficient inventories, meet
7. When evaluated in light of a company’s credit terms, the number of days‘ sales
8. A high accounts receivable turnover implies that accounts are collected quickly,
thereby providing cash that can be used to meet obligations. A high turnover also
9. Users are interested in the capital structure of a company, as measured by debt and
equity ratios, for at least two reasons. First, as a company includes more debt in its
10. Inventory turnover reflects on the efficiency of inventory management. That is, a high
inventory turnover means that a given sales volume can be supported with a smaller
Wild and Shaw Financial and Managerial Accounting 9e Solutions Manual: Chapter 13
11. Since management is responsible for a company‘s performance, all ratios that are
useful in evaluating a company are of some usefulness in assessing management
12. Almost all companies have some liabilities. Since total assets equals total liabilities
plus equity, total assets are almost always higher than total equity. Thus, the
13. This gain is considered to be unusual but not infrequent. It would be included in the
calculation of income from continuing operations, with other unusual or infrequent
Wild and Shaw Financial and Managerial Accounting 9e Solutions Manual: Chapter 13
885
Ethics Challenge — BTN 13-1
1. The CEO appears to have selectively chosen from the 11 available
ratios to present only the ones that show trends that are favorable to
2. The consequences of this action by the CEO might be mixed. It is likely
that the analysts will ask other questions that may reveal some
negative trends such as the trends in return and profit margins. The
CEO’s actions may become transparent to the analysts as they
discover the presence of less favorable trends through their questions.
Communicating in Practice — BTN 13-2
There is no set solution to this activity. Each team’s memorandum will
vary based on the industry and companies chosen for analysis.
Wild and Shaw Financial and Managerial Accounting 9e Solutions Manual: Chapter 13
886
Taking It to the Net — BTN 13-3
($ thousands)
As of 12/31/2018
As of 12/31/2017
1. Profit margin ratio ……………..
$1,177,562/$7,791,069= 15.1%
$782,981/$7,515,426 = 10.4%
2. Gross profit ratio ………………
$3,575,325/$7,791,069 = 45.9%
$3,455,376/$7,515,426 = 46.0%
Analysis and Interpretation: Hershey’s performance generally improved in
all areas evaluated for the profitability metrics reported in the table above
with the exception of gross profit.
Teamwork in Action — BTN 13-4
Part 1
Team reports should look something like the following:
Horizontal Analysis
Horizontal analysis is comparing a company’s financial statement amounts
across time. We compare data from comparative statements that are
horizontally aligned; that is, we compare the same items from one period to
Example: Assume that prior year sales equal $240,000, and current year
sales equal $300,000. Horizontal analysis of sales yields a $60,000 increase
Wild and Shaw Financial and Managerial Accounting 9e Solutions Manual: Chapter 13
887
Teamwork in Action (Concluded)
If a horizontal comparison is made over a number of periods, the
comparisons are made to corresponding amounts in a selected period
called the base period. Each subsequent period’s amount is compared to
the base period. The change is expressed as a percent of the base period.
This is commonly referred to as trend analysis.
Vertical Analysis
Vertical analysis is comparing a company’s financial statement amounts to
a base amount. Usually this base amount is a total or aggregate amount.
Part 2
Explanations of the four categories or areas of ratio analysis follow:
a. Liquidity analysis measures the availability of resources to meet short–
term cash requirements. Efficiency analysis measures how productive a
company is in using its assets.
Part 3
Each team member presents results to the entire team.
Wild and Shaw Financial and Managerial Accounting 9e Solutions Manual: Chapter 13
888
Entrepreneurial Decision — BTN 13-5
1. No. Although the current ratio improved over the three-year period, the
acid-test ratio declined and accounts receivable and merchandise
2. No. The decreasing turnover of accounts receivable indicates the
company is collecting its receivables more slowly.
3. No. Sales are increasing and accounts receivable are turning more
slowly. Either or both of these trends would produce an increase in
accounts receivable, even if the other remained unchanged.
6. The dollar amount of selling expenses increased in 2020 and decreased
sharply in 2021. Again assuming sales figures of $100 in 2019, $125 in