1.
1.
1.
Chapter 13, SE 2.
b
CHAPTER 13—Solutions
FINANCIAL PERFORMANCE MEASUREMENT
Chapter 13, SE 1.
c
Chapter 13, SE 3.
a; LIFO is more conservative.
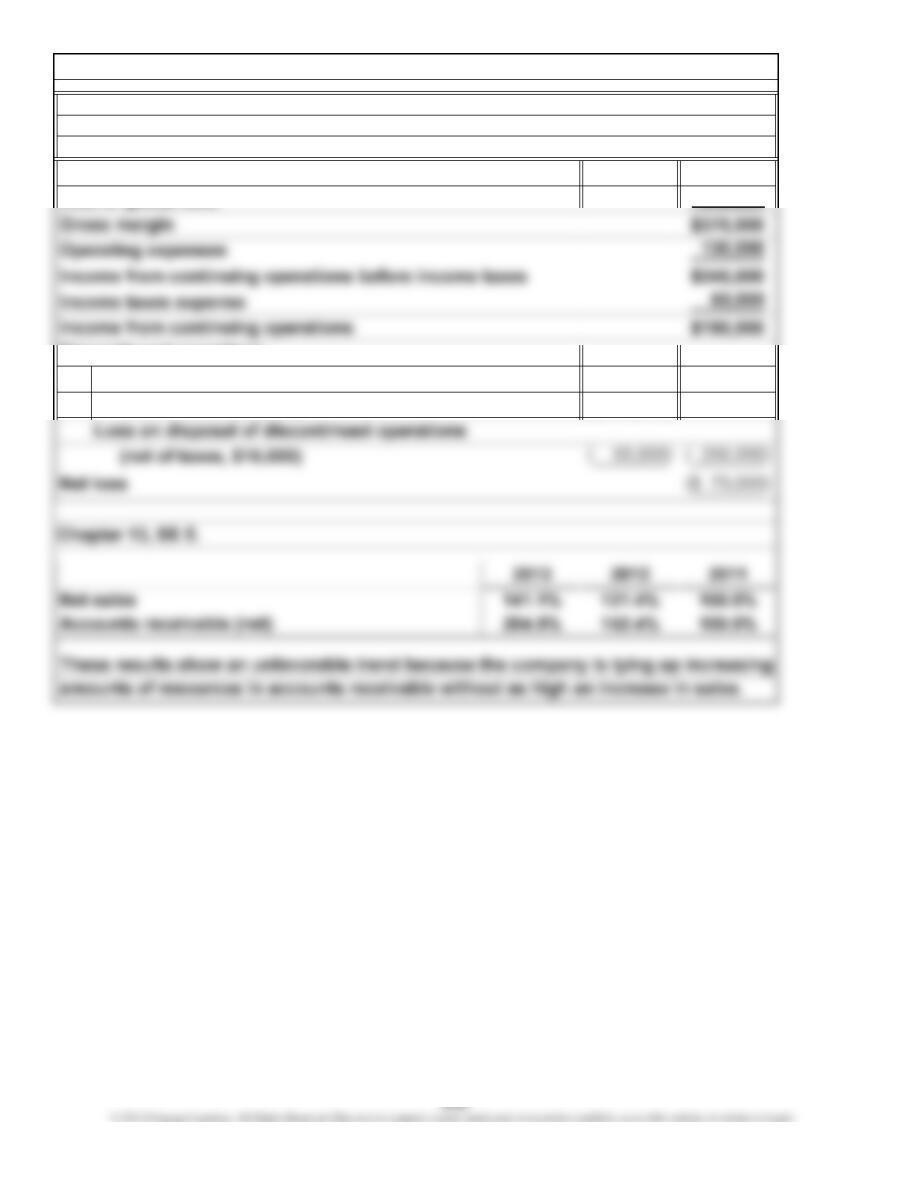
$720,000
350,000
($200,000)
Net sales
Cost of goods sold
Discontinued operations
Chapter 13, SE 4.
Lincoln Company
Income Statement
For the Year Ended June 30, 2012
Loss from discontinued operations
(net of taxes, $70,000)
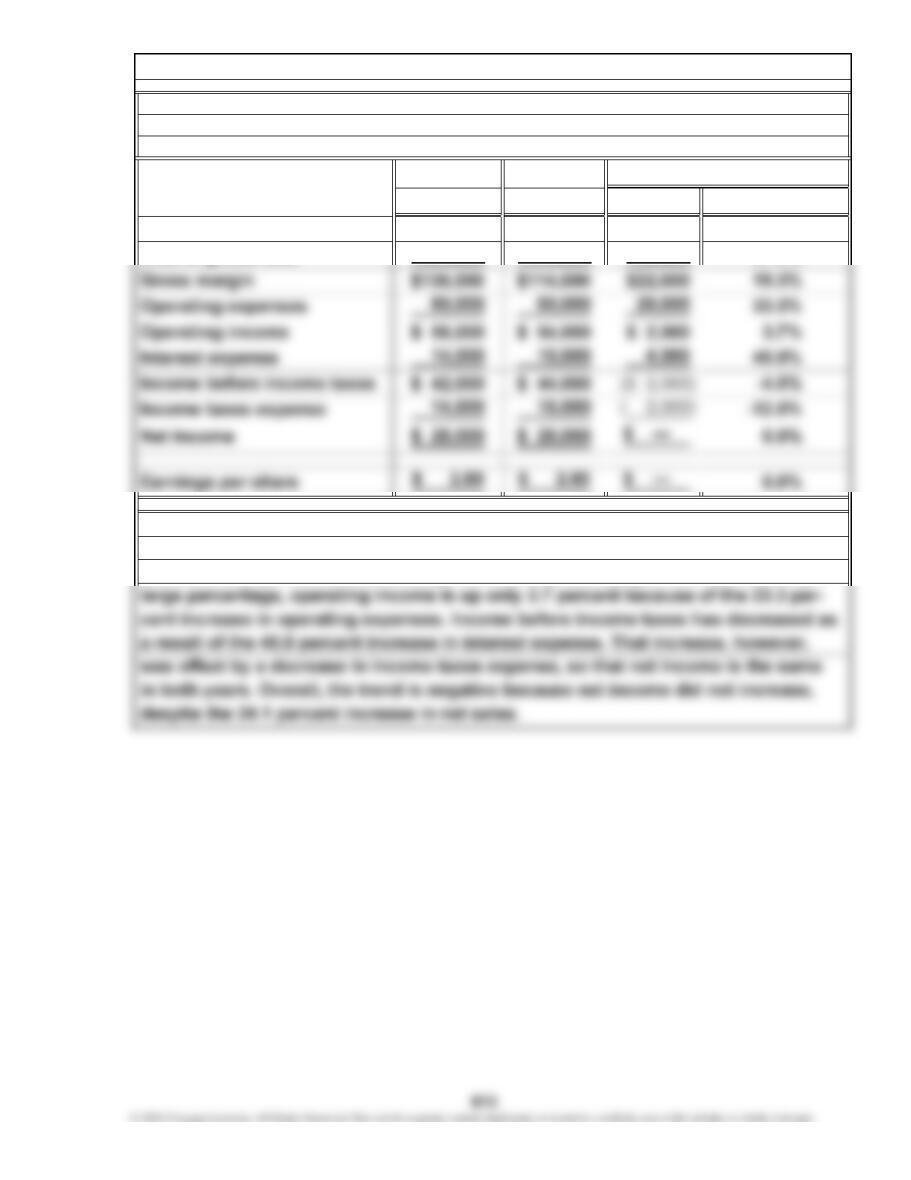
2012 2011 Amount
$360,000 $290,000 $70,000
224,000 176,000 48,000
24.1%
27.3%
limited to 19.3 percent. Also, although sales and gross margin have increased by a
Cost of goods sold
Net sales
Percentage
Increase or Decrease
Chapter 13, SE 6.
Otis, Inc.
The percentage increase in cost of goods sold was greater than the increase in net
sales (27.3 percent versus 24.1 percent). As a result, the increase in gross margin is
Comparative Income Statements
For the Years Ended December 31, 2012 and 2011
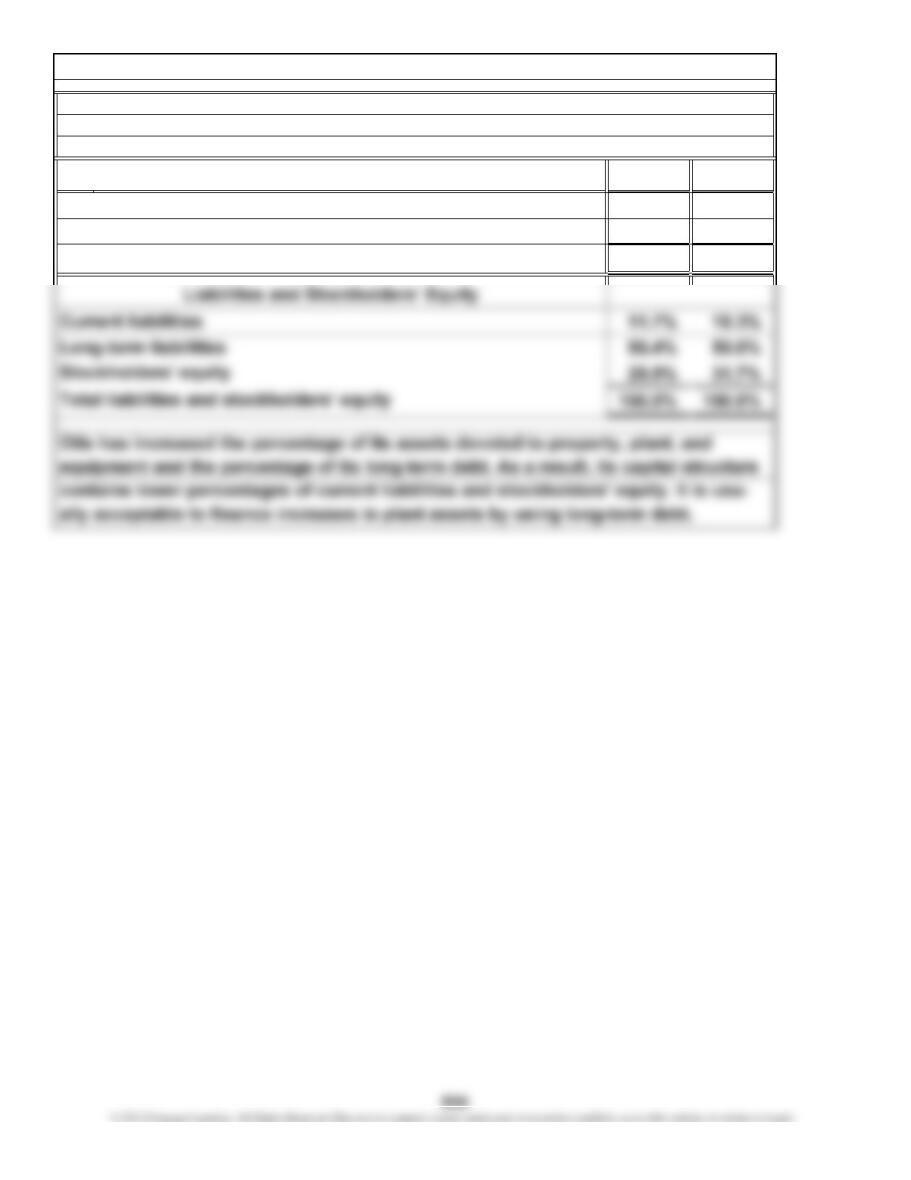
2012 2011
15.6% 16.7%
84.4% 83.3%
100.0% 100.0%
Otis, Inc.
Chapter 13, SE 7.
Common-Size Balance Sheets
December 31, 2012 and 2011
Current assets
Property, plant, and equipment (net)
Assets
Total assets
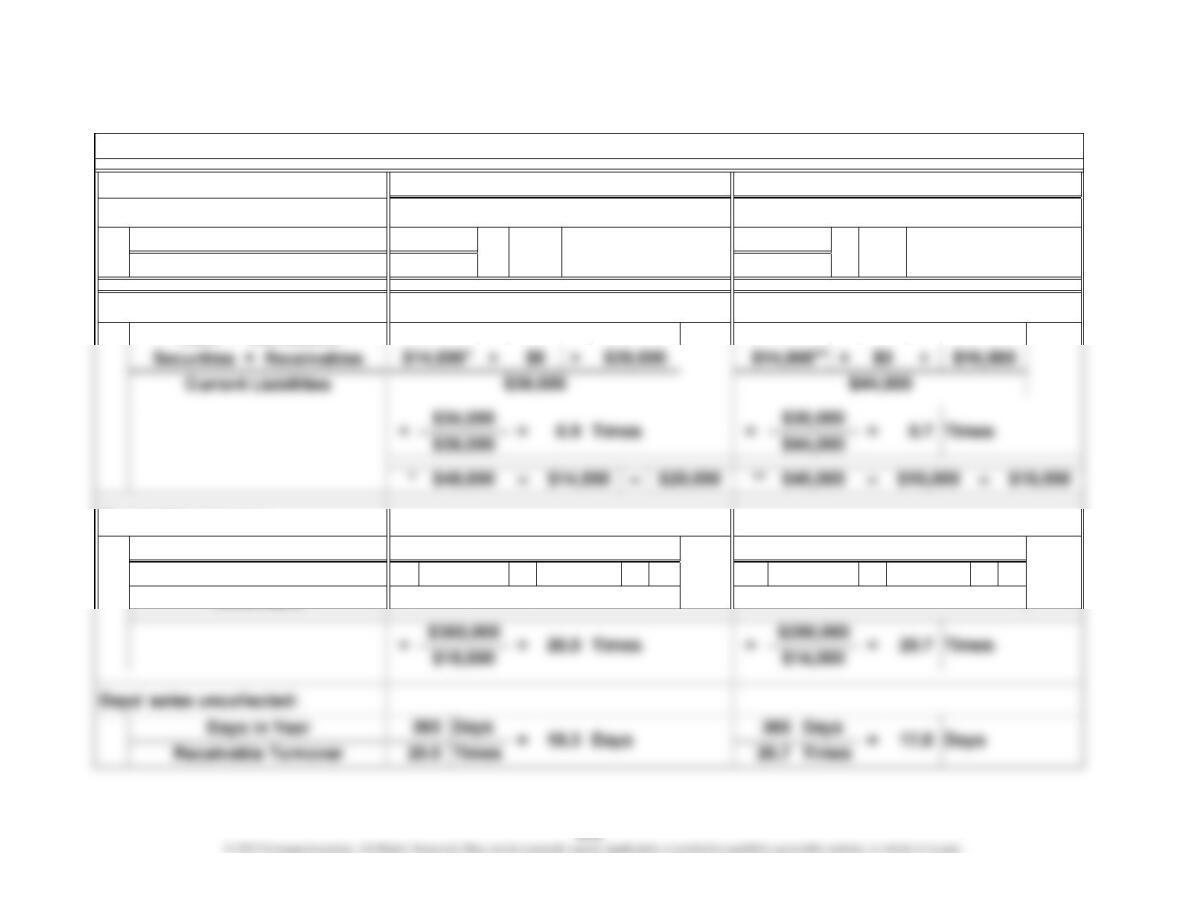
Current Assets
Current Liabilities
Cash + Marketable
Net Sales
Average Accounts ( + ) ÷ 2 ( + ) ÷ 2
Receivable
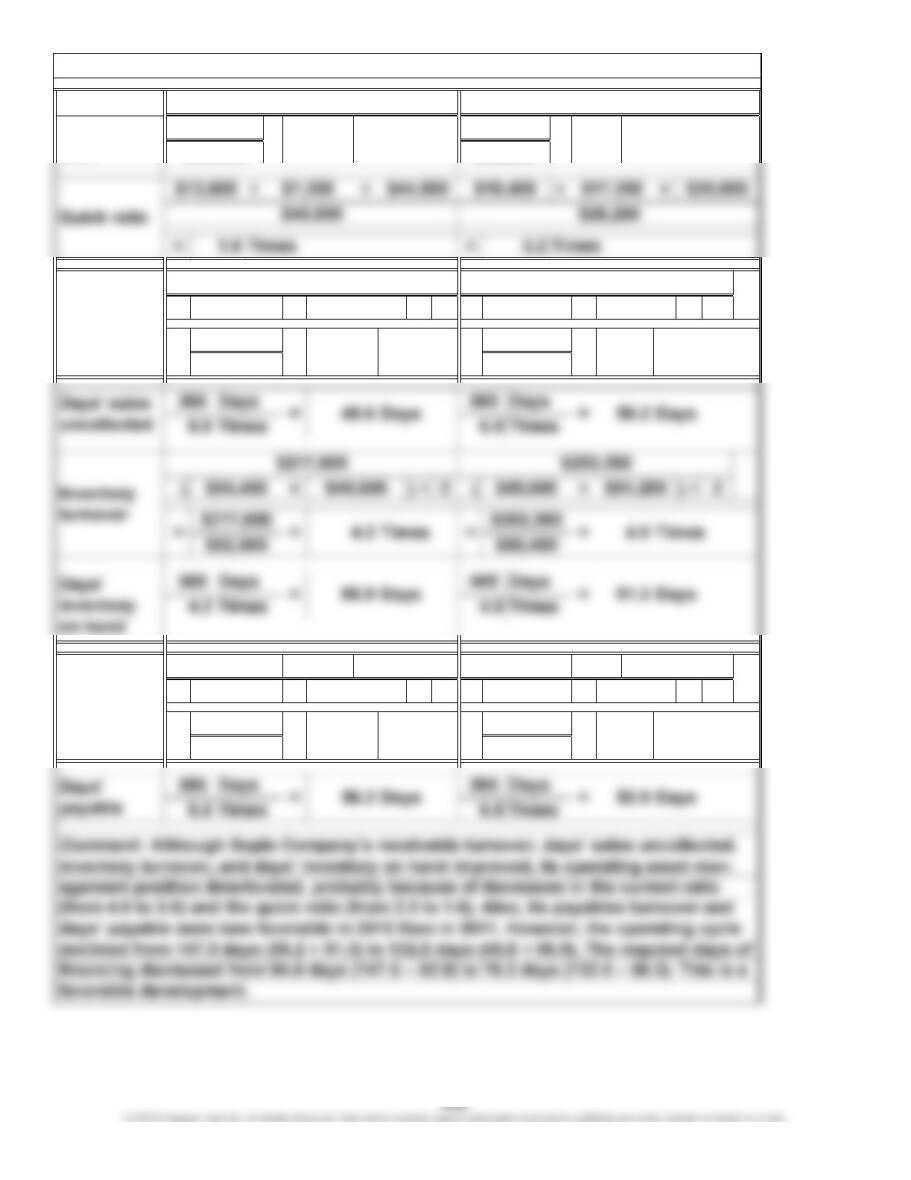
Receivable turnover:
$16,000
Quick ratio:
$20,000
$40,000
$360,000
$16,000 $12,000
$290,000
Chapter 13, SE 8.
20112012
=$44,000
1.3 0.9Times = Times
Current ratio:
$48,000
$36,000
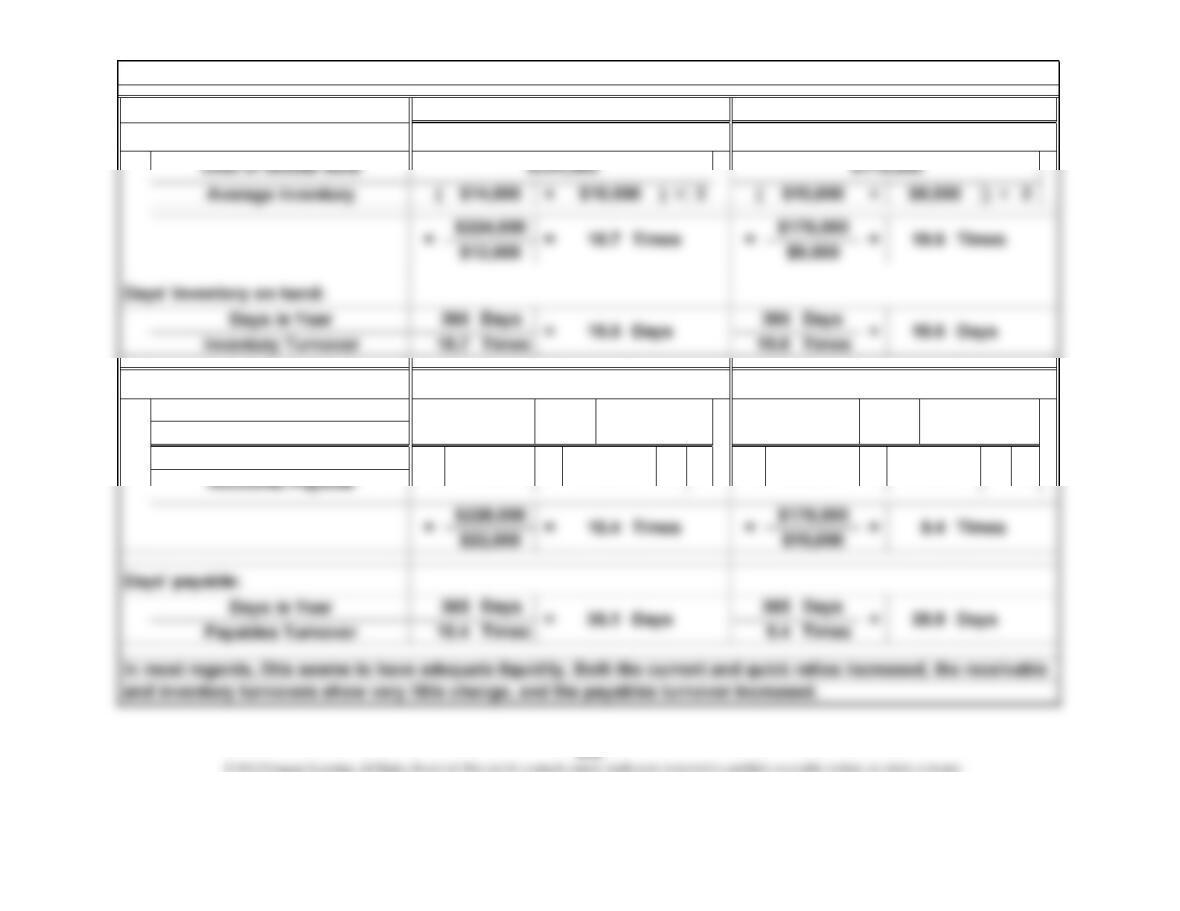
Payables turnover:
Cost of Goods Sold +/–
Change in Inventories
Average
+
$224,000
+( $24,000 2 $18,000
) ÷
$4,000
$20,000
2( $20,000 ) ÷+
+$176,000 $2,000
Inventory turnover:
2012
Chapter 13, SE 8. (Continued)
2011
616
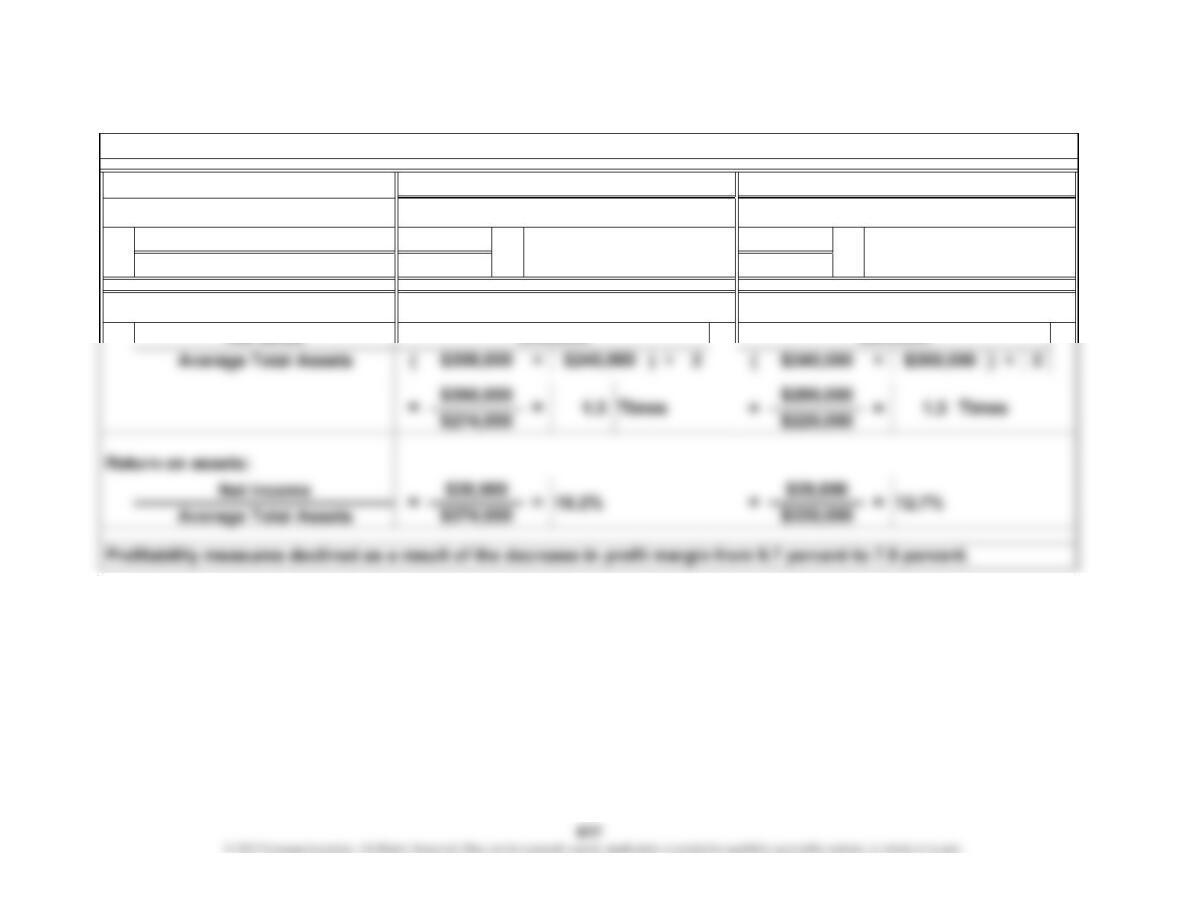
Net Income
Net Sales
Asset turnover:
Net Sales
Profit margin:
$360,000 $290,000
Chapter 13, SE 9.
=
$28,000
$360,000 7.8%
2012
$290,000
2011
9.7%
$28,000 =
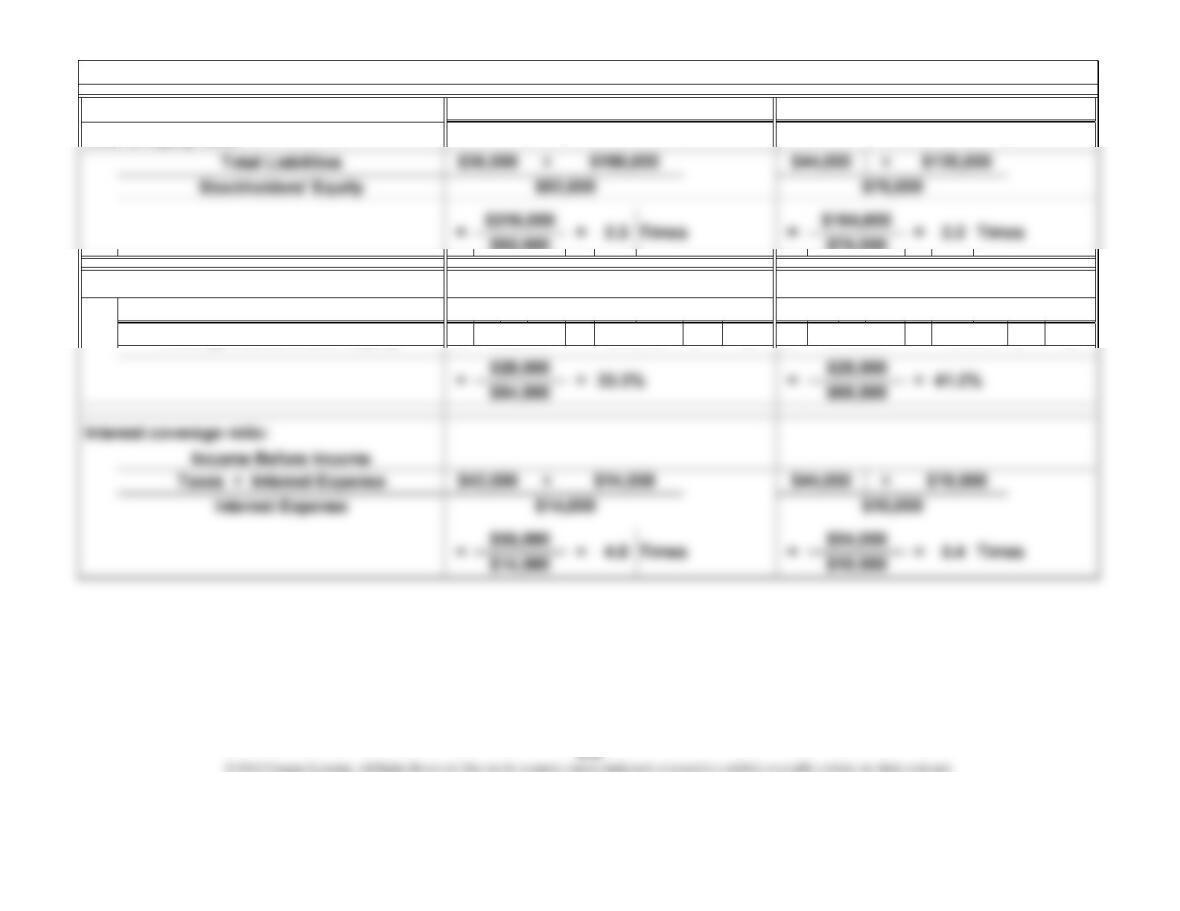
Net Income
Average Stockholders’ Equity ( + ) ÷ 2 ( + ) ÷ 2
$28,000
$92,000 $76,000
Return on equity:
$28,000
$76,000 ######
$92,000
2011
Debt to equity ratio:
2012
Chapter 13, SE 10.
$76,000

Chapter 13, SE 10.
Otis carries a large amount of debt in relation to stockholders’ equity, as shown by
the debt to equity ratio. Return on equity remains high because of the large amount
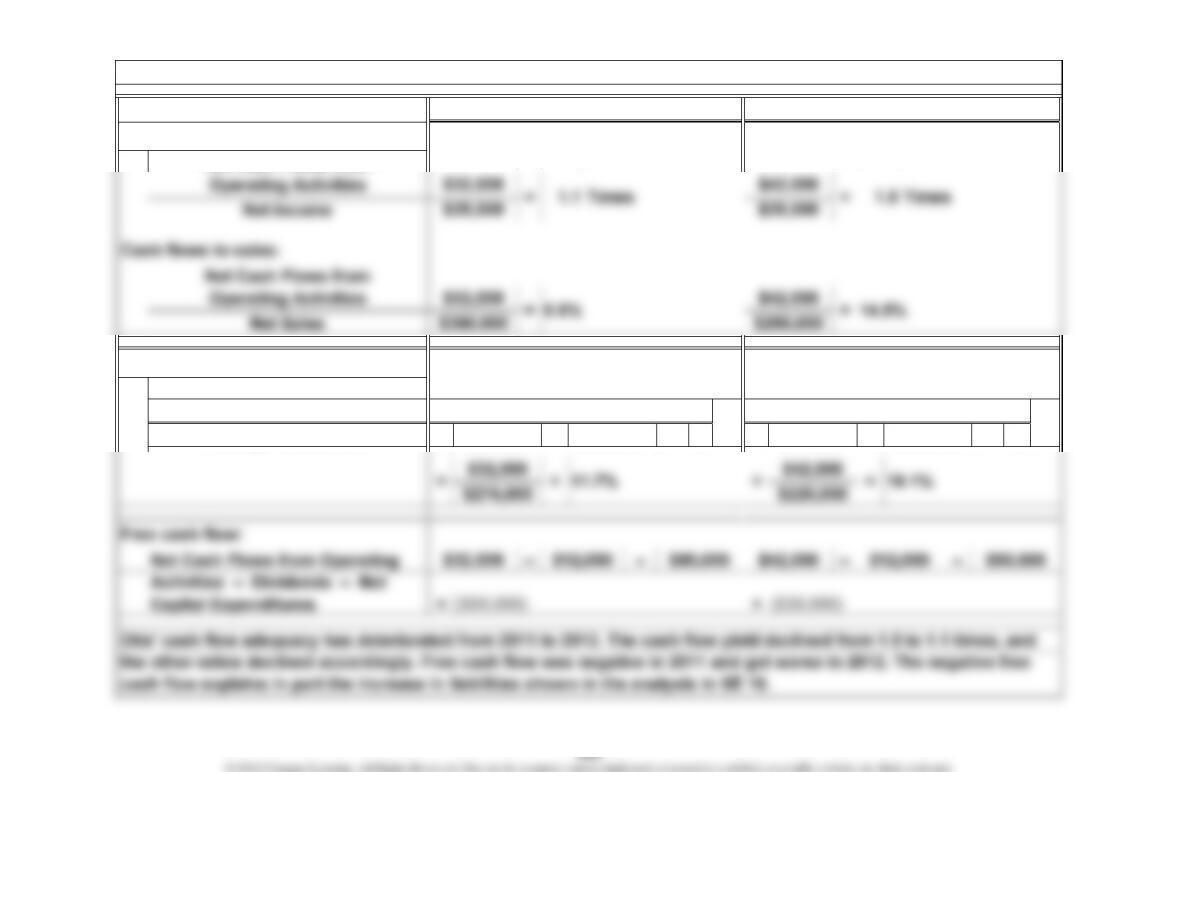
Net Cash Flows from
Net Cash Flows from
Operating Activities
Average Total Assets ( + ) ÷ 2 ( + ) ÷ 2
$240,000$308,000
Cash flow yield:
$42,000
$240,000 $200,000
20112012
Chapter 13, SE 11.
Cash flows to assets:
$32,000
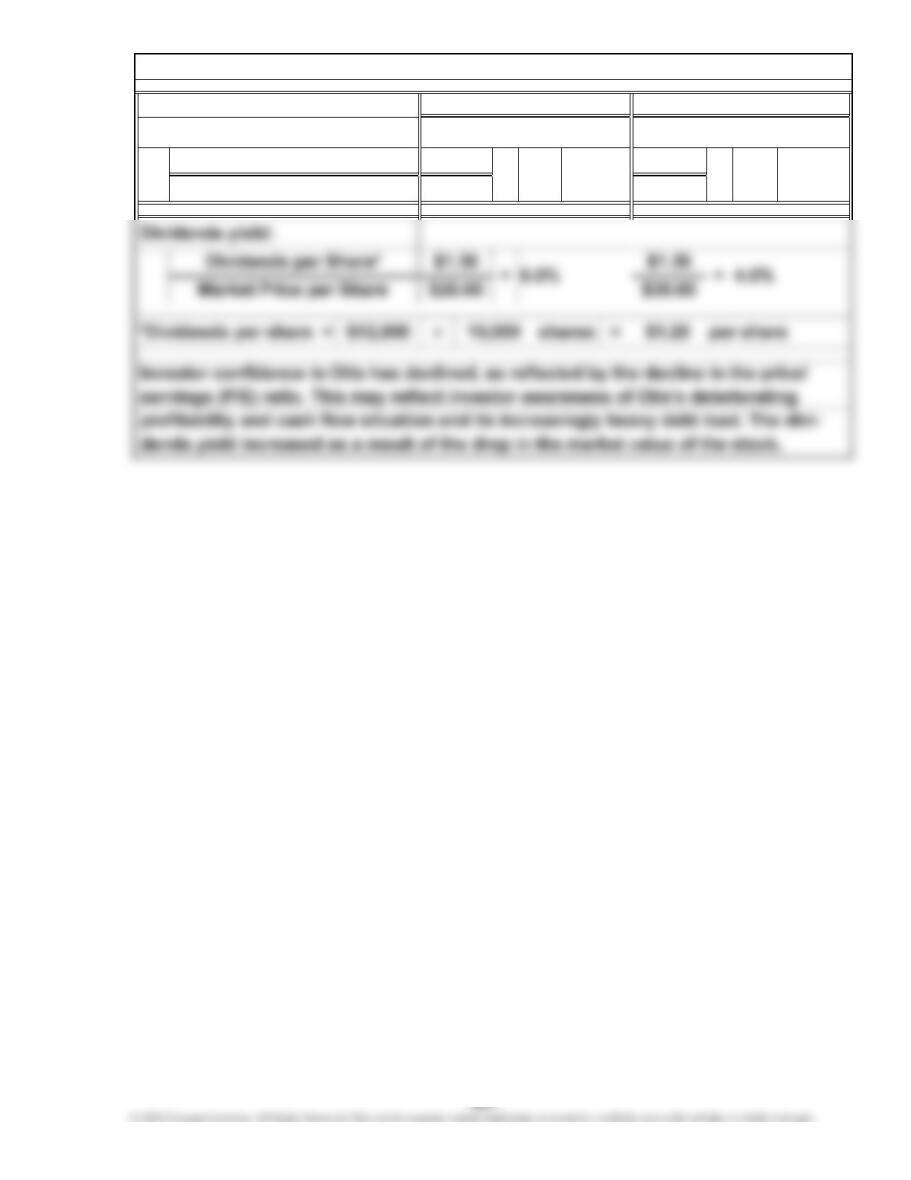
$2.80 =
2011
= 7.1 10.7 Times
$2.80
Times $30.00$20.00
Price/earnings (P/E) ratio:
2012
Earnings per Share
Chapter 13, SE 12.
Market Price per Share
1.
2.
1.
2.
3.
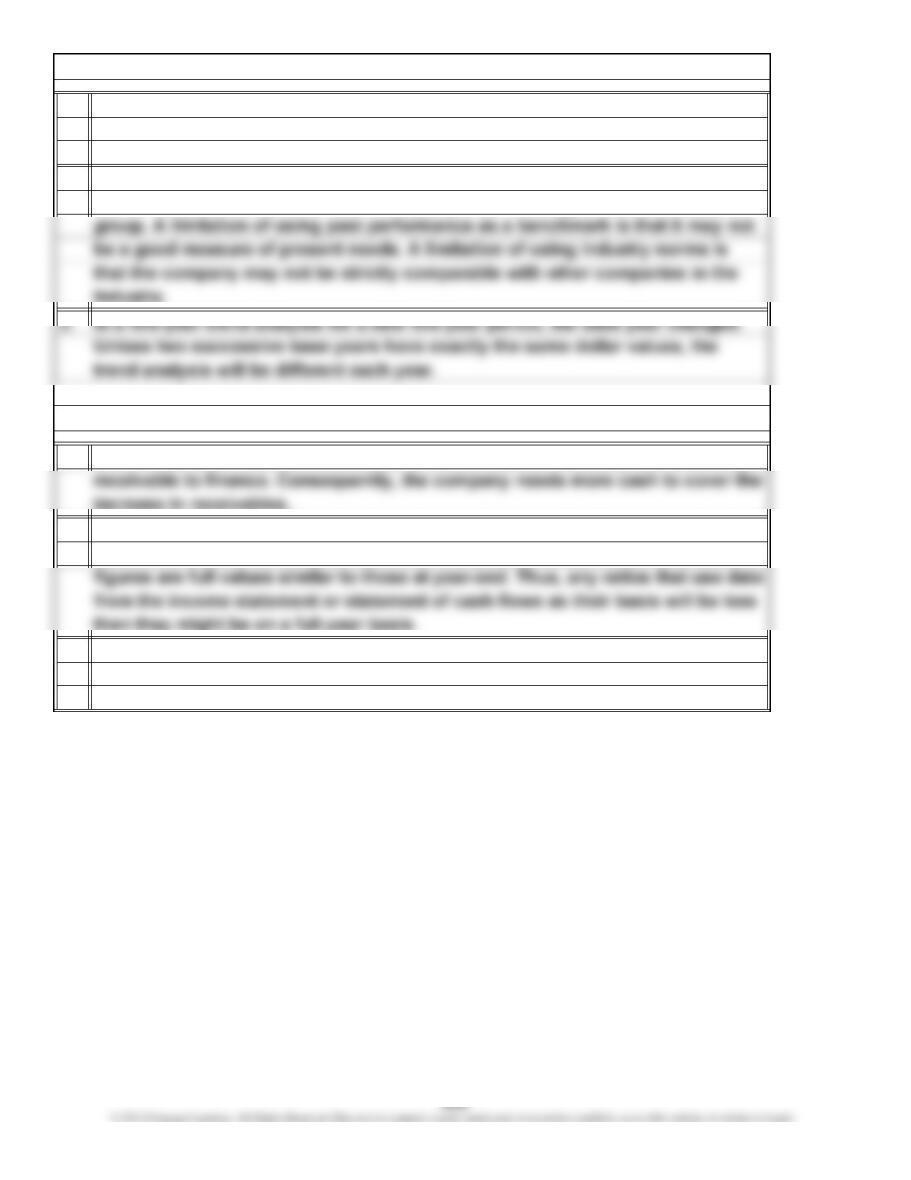
A limitation of free cash flows is that it takes into account the use of cash flows
from operating activities only for capital expenditures and dividends. It does not
consider such other uses as treasury stock or repayment of debt.
ing managers’ compensation to financial targets encourages managers to act in
their own and the owners’ best interests.
but industry norms tell how well a company is performing in relation to its peer
Chapter 13, E 1.
If the overall financial plan is expected to increase the owners’ wealth, then link-
Chapter 13, E 2.
A company’s past performance indicates whether performance is improving,
When receivable turnover decreases, it means that the company has more days’
On quarterly financial statements, all numbers on the income statement and
statement of cash flows are for less than one year, whereas the balance sheet
1. 5.
4. 8.
$68,000
$68,000
3.
c
d
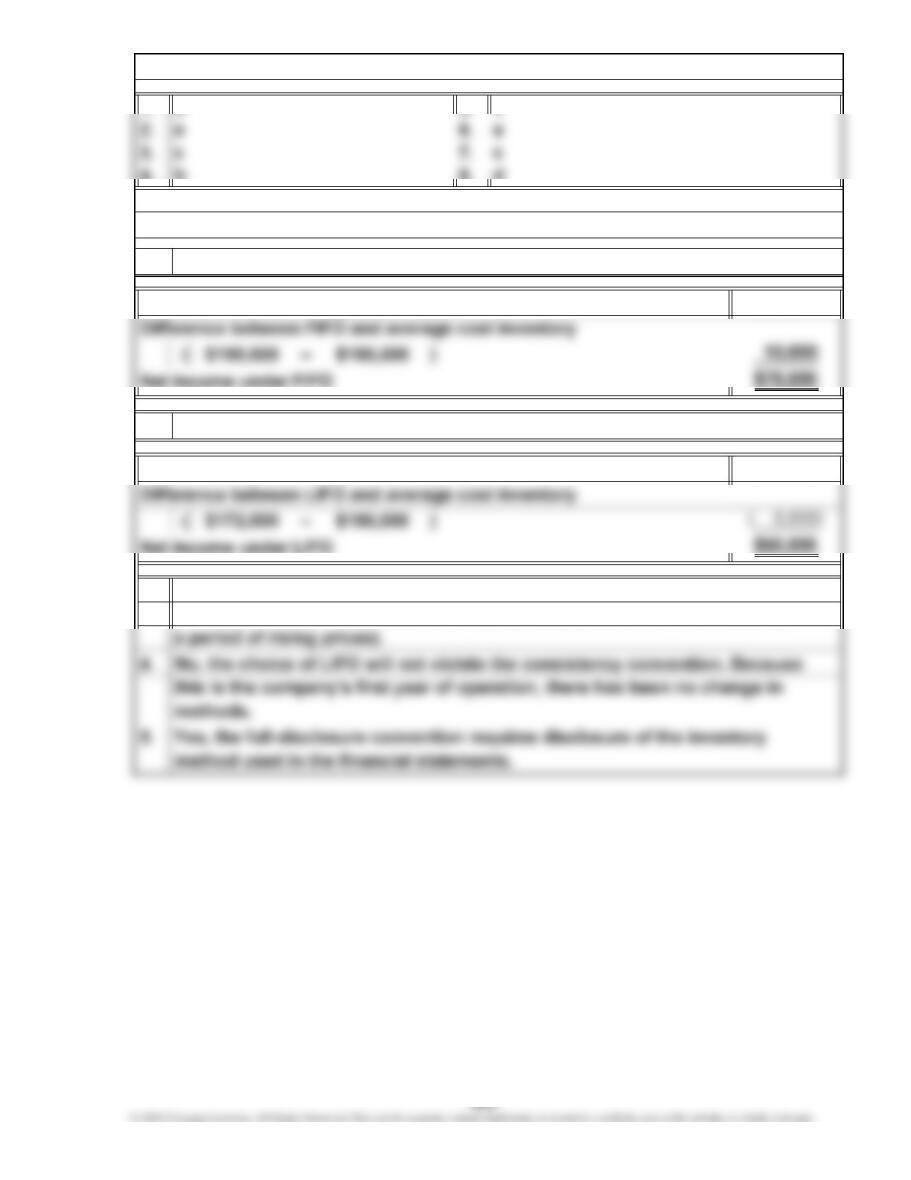
Most accountants would consider the LIFO method the more conservative
b
b
Net income determined under LIFO
Net income under average cost method
procedure because it yields a lower asset value and a lower net income (in
2.
1. Net income determined under FIFO
Net income under average cost method
Chapter 13, E 3.
Chapter 13, E 4.
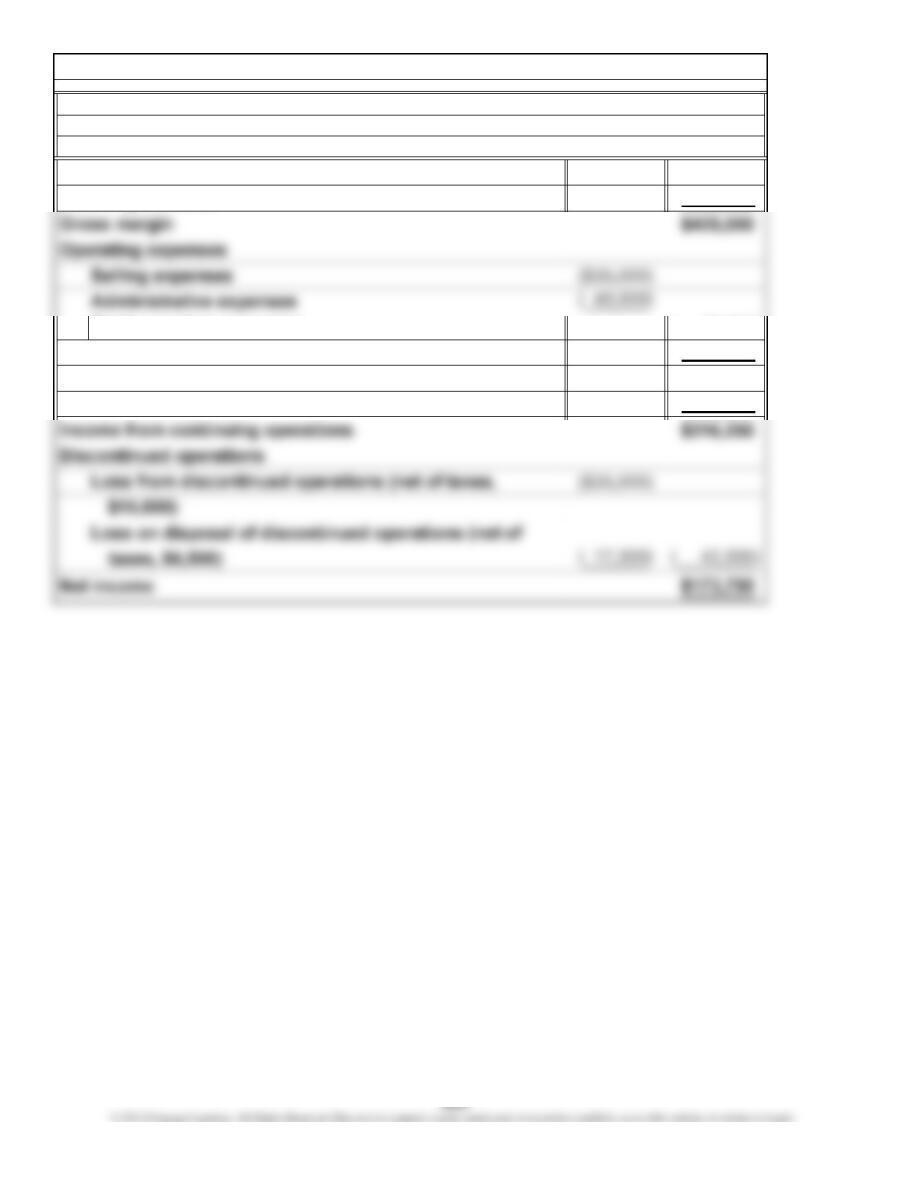
$950,000
525,000
( 65,000)
6,250
$366,250
150,000
Total operating expenses
Gain on sale of equipment
Chapter 13, E 5.
Net sales
Income taxes expense
Hugo Corporation
Income Statement
For the Year Ended June 30, 2011
Cost of goods sold
Income from continuing operations before income taxes
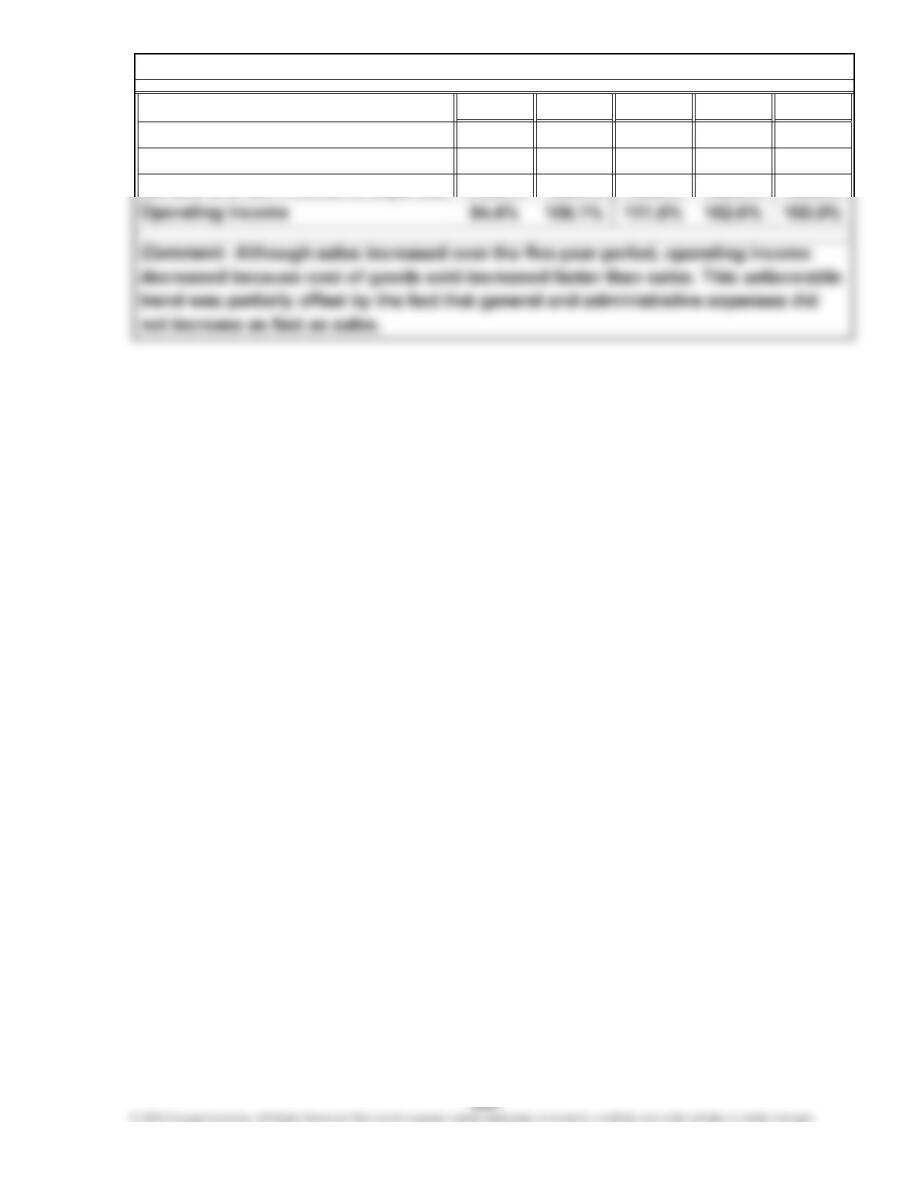
2012 2011 2010 2009 2008
113.7% 109.0% 110.0% 104.0% 100.0%
123.0% 110.0% 111.0% 105.0% 100.0%
110.0% 108.0% 106.0% 102.0% 100.0%
Net sales
Cost of goods sold
General and administrative expenses
Chapter 13, E 6.
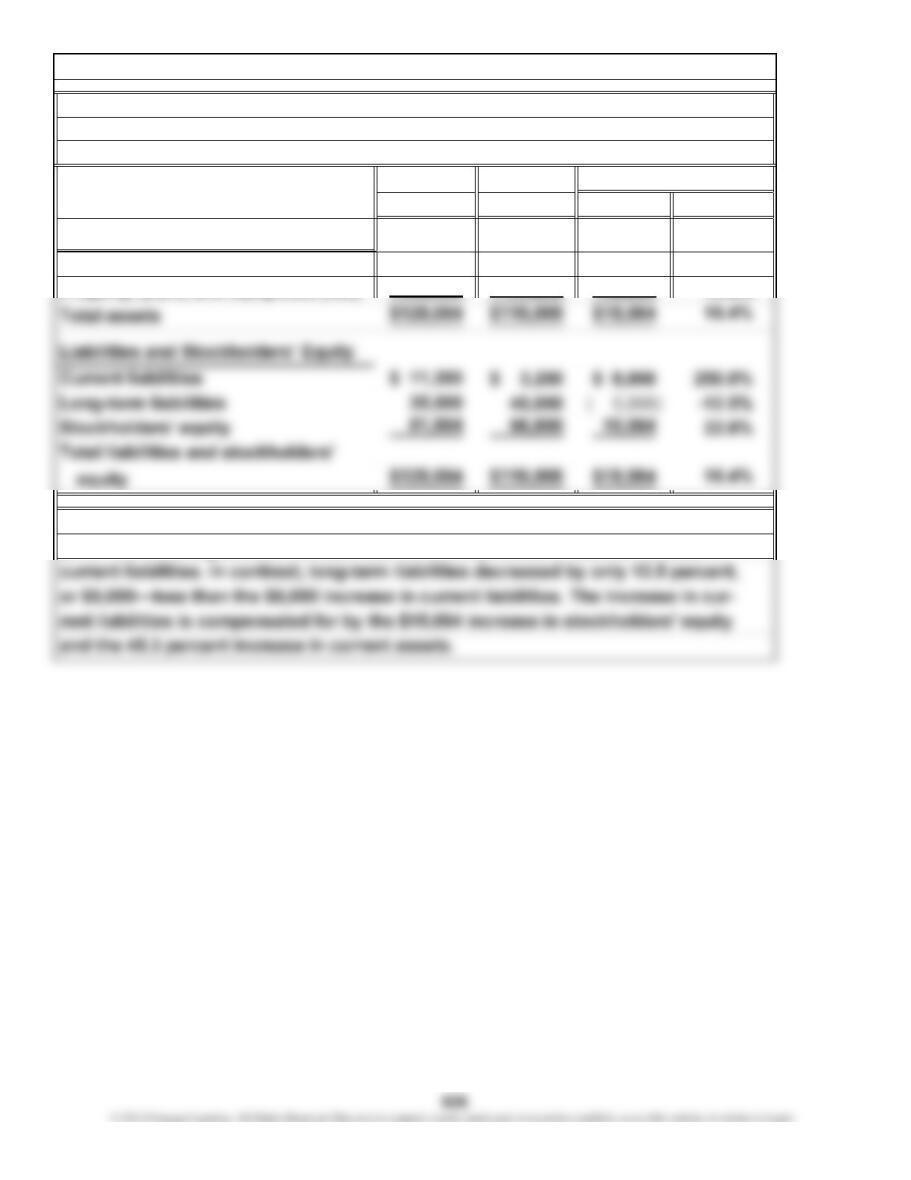
2011 Amount Percentage
$ 12,800 $ 5,800 45.3%
97,200 12,264 12.6%
Current assets $ 18,600
Property, plant, and equipment (net)
109,464
Assets
2012
Increase or Decrease
Comment: All asset categories and stockholders’ equity increased from 2011 to
2012. The most significant increase was the 250.0 percent, or $8,000, increase in
Davis Company
Comparative Balance Sheets
December 31, 2012 and 2011
Chapter 13, E 7.
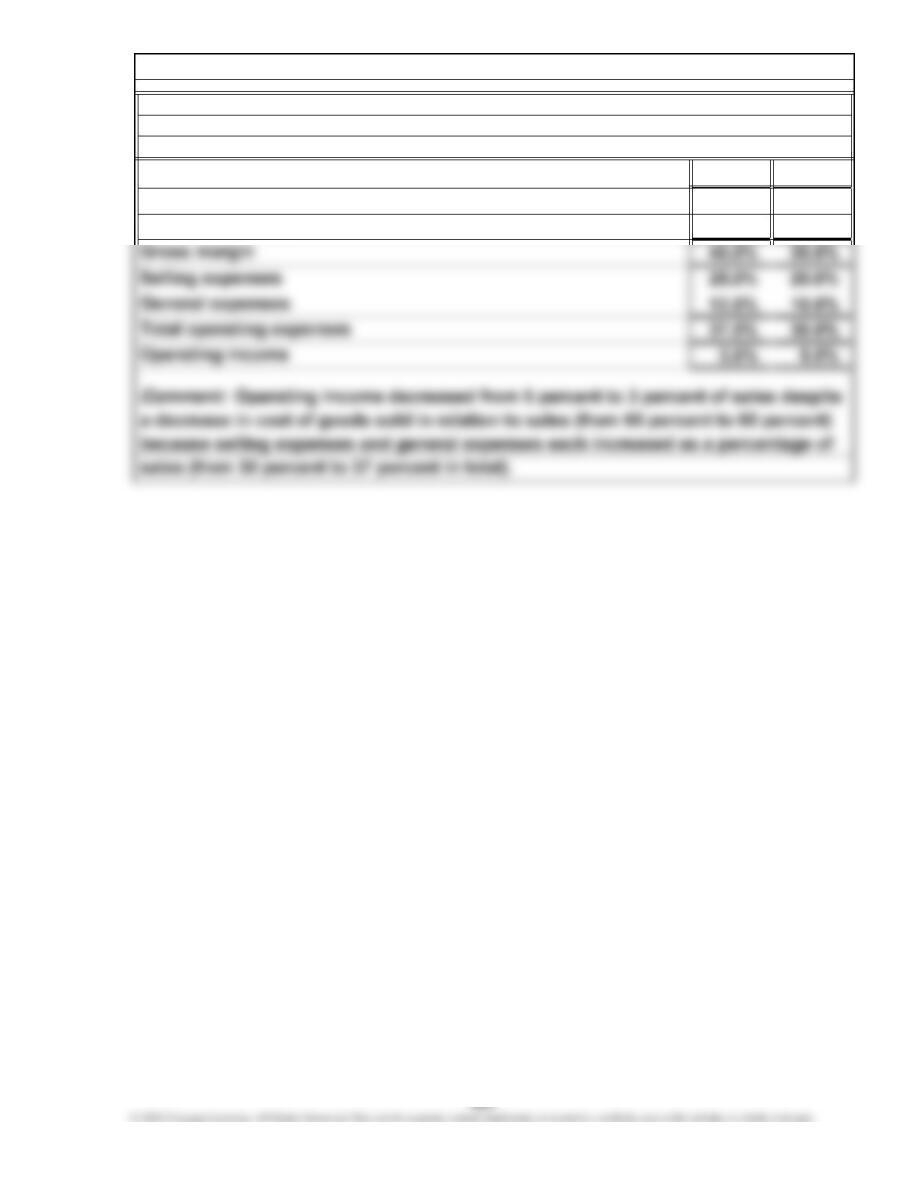
2012 2011
100.0% 100.0%
60.0% 65.0%
Chapter 13, E 8.
Davis Company
Common-Size Income Statements
For the Years Ended December 31, 2012 and 2011
Net sales
Cost of goods sold
( + ) ÷ 2 ( + ) ÷ 2
( + ) ÷ 2 ( + ) ÷ 2
3.0
Times8.0
$35,600
=
$112,800
$28,200 4.0
Payables
turnover
6.5
$28,200
$4,800+
$217,600
Times
$28,200
$203,360
$40,000
=$29,400
$201,760 =
=$222,400 =
$34,100
$30,600
–
Current
ratio
2012
Times Times
$120,000
$40,000
6.9
= 6.5
Chapter 13, E 9.
2011
=
Receivable
turnover
$44,800
$322,560
$40,200
=
$35,600
$220,720
$34,000 =
$322,560
Times
$32,400
=
$220,720
$1,600
Times
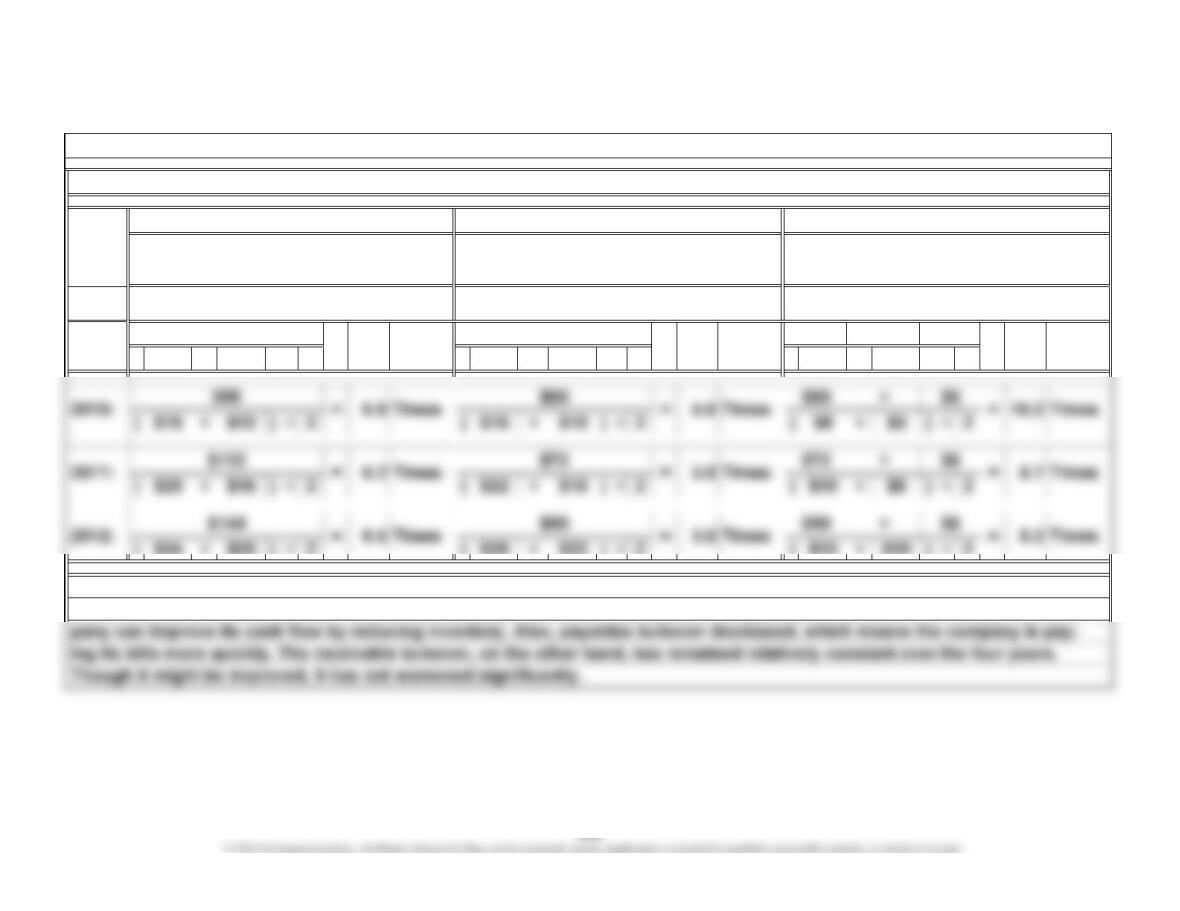
Year
( $12 + $11 ) ÷ 2 ( $10 + $11 ) ÷ 2 ( $5 + $4 ) ÷ 2
( $24 + $20 ) ÷ 2 ( $28 + $22 ) ÷ 2 ( $13 + $10 ) ÷ 2
$48
Times
Inventory TurnoverReceivable Turnover
Average Accounts Receivable
Net Sales
2009:
10.47.0 Times= 4.6 =
$1$48
Cost of Goods Sold
–
Average Inventory
Times
Average Accounts Payable
Chapter 13, E 10.
$80
Cost of Goods Sold +/–
Change in Inventory
Payables Turnover
=
(amounts in thousands)
from 4.6 times to 3.6 times, which means the company has been investing increasing amounts of cash in inventory. The com-
Clearly, Ike Tuxedo Rental is carrying too much inventory for its level of business. The inventory turnover ratio has declined
629
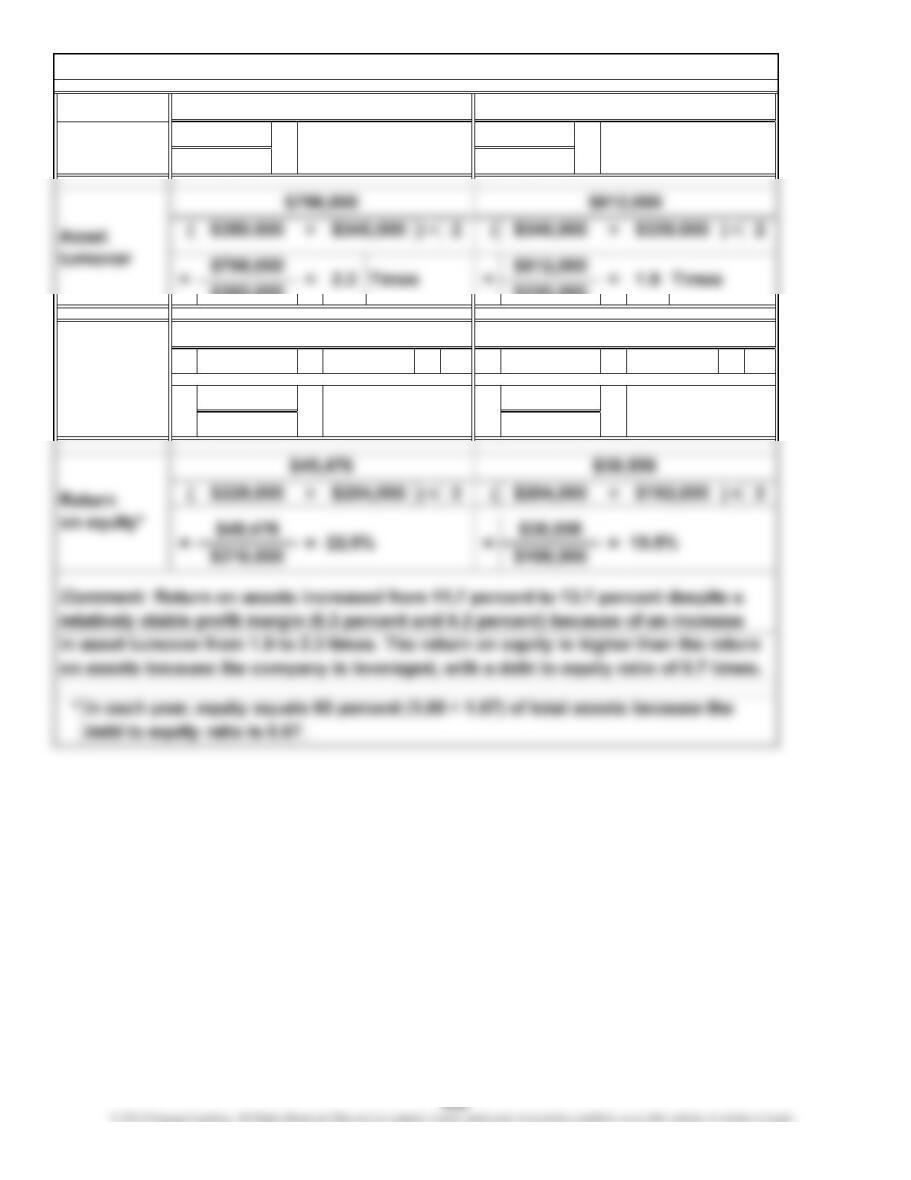
(+) ÷2(+) ÷2
13.7% = =
$320,000
=
$49,476
$360,000
$38,556
$340,000
$360,000 $330,000 11.7%
Chapter 13, E 11.
2012
$49,476
$798,000 =
$612,000
$38,556
2011
6.3%
$38,556
Profit
margin
6.2%
$340,000
$330,000
=$49,476
Return
on assets
$380,000
=