Chapter 13 – Analyzing Financial Statements
13-1
CHAPTER 13
ANALYZING FINANCIAL STATEMENTS
Learning Objectives and Related Assignment Materials
Learning Objectives
Mini-
Exercises
Exercises
Problems
Alternate
Problems
Cases and
Projects
13-1 Explain how a company’s business
strategy affects financial statement
analysis.
1, 2, 3, 4
1
1
4
statements.
13-3 Compute and interpret component
1, 2
1, 2, 3, 4,
1, 4, 5, 6
1, 5, 6
7
ratios.
13-5 Compute and interpret asset
turnover ratios.
5, 10
1, 2, 3, 4,
6, 7, 8,
2, 3, 4, 6,
8, 9
2, 3, 4, 6
1, 2, 3, 4,
5, 7
13-6 Compute and interpret liquidity
6, 7, 10
1, 2, 3, 4,
1, 2, 3, 4,
1, 2, 3, 4,
1, 2, 3, 6,
ratios.
ratios.
13-2 Discuss ways to analyze financial
1, 2, 3, 4
1, 2
1, 2
3
Synopsis of Chapter Revisions
Focus Company: The Home Depot
• Focus company data updated.
• New analyst reports highlighting professional analysts’ assessment of The Home Depot.
Chapter 13 – Analyzing Financial Statements
13-2
PowerPoint Slides
Learning Objectives
PowerPoint® Slides
13-1 Explain how a company’s business strategy affects financial statement
analysis.
13-5 through 13-7
13-2 Discuss ways to analyze financial statements.
13-8 through 13-9
13-5 Compute and interpret asset turnover ratios.
13-7 Compute and interpret solvency ratios.
13-8 Compute and interpret market ratios.
Chapter Take-Aways
13-1 Explain how a company’s business strategy affects financial statement analysis.
Financial statements reflect transactions. Transactions are the result of a company carrying out its
13-2 Discuss ways to analyze financial statements.
Analysts use financial statements to understand a company’s current and past performance, as well
13-3 Compute and interpret component percentages.
Component percentages express each item on a financial statement as a percentage of a single base
13-4 Compute and interpret profitability ratios.
Profitability ratios focus on income and how it compares to other amounts reported on the financial
13-5 Compute and interpret asset turnover ratios.
Asset turnover ratios focus on capturing how effectively a company uses its assets. Exhibit 13.3 lists
Chapter 13 – Analyzing Financial Statements
13-3
Chapter Take-Aways (continued)
13-6 Compute and interpret liquidity ratios.
Liquidity ratios focus on evaluating a company’s ability to meet its short-term obligations. Exhibit
13-7 Compute and interpret solvency ratios.
Solvency ratios focus on evaluating a company’s ability to meet its long-term obligations. Exhibit
13-8 Compute and interpret market ratios.
Market ratios relate the current price per share of a company’s stock to the return that accrues to
Finding Financial Information
Balance Sheet
Ratios are not reported on the balance sheet.
Analysts do, however, use balance sheet
Income Statement
Earnings per share is the only ratio that is
required to be reported on the financial
Notes
Under Summary of Significant Accounting Policies
This note describes a company’s accounting policies. Understanding a company’s accounting
Chapter 13 – Analyzing Financial Statements
Chapter Outline
Teaching Notes
LO 1 – Explain how a company’s business strategy affects financial statement analysis.
I. The Investment Decision
A. Investors
1. Investors are the largest single group of users of financial
statements
recommendations, which may vary widely
3. Investors should evaluate the company’s future income
and growth potential on the basis of three factors:
evaluating its financial statements
2. Individual investors use analysts’ reports and
II. Understanding a Company’s Strategy
B. Businesses can earn a high rate of return by following
different strategies
1. Product differentiation
2. Cost differentiation
a. Under this strategy, companies offer products with
unique benefits, such as high quality or unusual style
LO 2 – Discuss ways to analyze financial statements.
III. Financial Statement Analysis
Background information for
A. Basis of Comparison
Home Depot provided in
1. Analyzing financial data without a basis for comparison
is impossible
Exhibit 13.1
judgment and is not always easy
1. Comparing across time
Chapter 13 – Analyzing Financial Statements
13-5
2. Comparing with similar companies
a. Often called “cross-sectional analysis”; information
for multiple companies is compared at a point in time;
finding comparable companies is often very difficult
American Industry Classification System (NAICS) for
use in reporting economic data
3. These data should be used with great care
are very similar instead of using industry-wide
a. Because of the diversity of companies included in any
given industry classification, and the potential
comparisons
LO 3 – Compute and interpret component percentages.
IV. Component Percentages and Ratio Analysis
A. Popular tools to analyze a company’s financial statements
include:
particular financial statement as a percentage of a single
proportional relationship between two financial statement
1. Component percentage––express each item on a
B. Component Percentages
Illustrated in Exhibit 13.2
compute component percentages on the income
compute component percentages on the balance sheet,
1. The base amount on the income statement is net sales; to
C. Ratio Analysis
1. Component percentages are a type of ratio; ratios simply
average of the beginning and ending balances
2. When computing ratios, remember that balance sheet
amounts relate to a moment in time while income
Chapter 13 – Analyzing Financial Statements
13-6
balance sheet amounts
b. In practice, some analysts simply use the ending
Text always uses average
LO 4 – Compute and interpret profitability ratios.
D. Profitability Ratios––ratios that compare income with one or
more primary activities
b. Relates income earned to the investment made by a
Summarized in Exhibit 13.3
Ratios are numbered to
correspond to those used in
text
1. Return on Equity (ROE)
a. ROE = Net Income ÷ Average Total Stockholders’
2. Return on Assets (ROA)
Enrichment Activity #2
a. ROA = Net Income ÷ Average Total Assets
b. Compares income to the total assets used to generate
the income
3. Gross Profit Percentage
a. Gross Profit Percentage = Gross Profit ÷ Net Sales
Revenue
b. Reflects gross profit as a percentage of sales
4. Net Profit Margin
a. Net Profit Margin = Net Income ÷ Net Sales Revenue
b. Reflects net income as a percent of sales
earn income
d. It is very difficult to compare profit margins for
companies in different industries
5. Earnings per Share (EPS)
Shares of Common Stock Outstanding
b. A measure of return on investment that is based on the
number of shares outstanding
a. EPS = Net Income ÷ Weighted Average Number of
Chapter 13 – Analyzing Financial Statements
13-7
6. Quality of Income
a. Quality of Income = Cash Flows from Operating
Activities ÷ Net Income
flows
ii. A ratio that is below 1 represents lower-quality
Refer students to Pause for
b. Most financial analysts are concerned about the
quality of a company’s earnings because some
earnings
Feedback – Self-Study Quiz
LO 5 – Compute and interpret asset turnover ratios.
E. Asset Turnover Ratios–– Ratios that capture how efficiently
a company uses its assets
Summarized in Exhibit 13.3
Use Supplemental
7. Total Asset Turnover
Enrichment Activity #1
Enrichment Activity #2
8. Fixed Asset Turnover Ratio
a. Fixed Asset Turnover Ratio = Net Sales Revenue ÷
Average Net Fixed Assets
c. Focuses more narrowly on how well a company uses
9. Receivable Turnover Ratio
a. Receivable Turnover Ratio = Net Credit Sales ÷
Average Net Receivables
i. If credit sales are not reported separately (which is
typically the case), total net sales is used instead
during a year
cause lost sales and profits
i. Average Days to Collect Receivables = Days in a
Year ÷ Receivable Turnover Ratio
b. A high receivable turnover ratio suggests that a
Chapter 13 – Analyzing Financial Statements
13-8
ii. Converts the receivable turnover ratio to a time
basis
card and cash sales
10. Inventory Turnover Ratio
a. Inventory Turnover Ratio = Cost of Goods Sold ÷
Average Inventory
b. Measure operating efficiency
time inventory is sold, an increase in this ratio is
usually favorable
indication that sales were lost because desired
items were not in stock
iii. A company must balance the cost of holding
inventory with the potential cost of losing a sale
i. Because a company normally realizes profit each
c. Turnover ratios vary significantly from one industry to
the next
d. Average Days to Sell Inventory
i. Average Days to Sell Inventory = Days in a Year ÷
Inventory Turnover Ratio
ii. Converts the inventory turnover ratio to a time
basis
e. The operating cycle for most companies involves three
distinct phases: the acquisition of inventory, the sale
of the inventory, and the collection of cash from the
customer
i. Accounts Payable Turnover Ratio = Cost of Goods
Sold ÷ Average Accounts Payable
ii. Average Days to Pay Payables = Days in a Year ÷
Payable Turnover Ratio
iii. The number of days it takes a company to complete
each phase of its operating cycle is comprised of
the following ratios:
• Average Days to Pay Payables
• Average Days to Sell Inventory
• Average Days to Collect Receivables
iv. Companies prefer to minimize the time between
Chapter 13 – Analyzing Financial Statements
13-9
F. Financial Analysis: The DuPont Model
Financial Leverage = Average Total Assets ÷ Average Total
1. The following equations are used in the DuPont Model:
ROE = Net Income ÷ Average Total Stockholders’ Equity
2. The model is: ROE = Net Profit Margin ×
Total Asset Turnover × Financial Leverage
3. Examining the additional information on the right side of
the DuPont model allows an analyst to tell a much richer
story about a company’s profitability than can be told by
examining just ROE
profit margin or by increasing the revenue it generates
in such a way that the return exceeds the cost of
LO 6 – Compute and interpret liquidity ratios.
G. Liquidity Ratios–– ratios that measure a company’s ability to
meet its currently maturing obligations
Summarized in Exhibit 13.3
Use Supplemental
11. Current Ratio
Enrichment Activity #1
a. Current Ratio = Current Assets ÷ Current Liabilities
Use Supplemental
b. Measures to what extent a company’s total current
assets cover its total current liabilities on a specific
Enrichment Activity #2
Chapter 13 – Analyzing Financial Statements
13–10
current ratio is desirable
12. Quick Ratio (sometimes referred to as the Acid Test)
a. Quick Ratio = Quick Assets ÷ Current Liabilities
i. Quick assets include cash, short-term investments,
and net accounts receivable
ii. Inventory is omitted because of the uncertainty of
the timing of cash flows from its sale
are sufficient to cover current liabilities
13. Cash Ratio
a. Cash Ratio = (Cash + Cash Equivalents) ÷ Current
Liabilities
productive assets or reduce debt.
Refer students to Pause for
LO 7 – Compute and interpret solvency ratios.
H. Solvency Ratios––ratios that measure a company’s ability to
meet its long-term obligations
Summarized in Exhibit 13.3
Use Supplemental
Enrichment Activity #1
Use Supplemental
Enrichment Activity #2
14. Times Interest Earned
a. Times Interest Earned = (Net Income + Interest
Expense + Income Tax Expense) ÷ Interest Expense
cash coverage ratio.
15. Cash Coverage Ratio
Activities ÷ Interest Paid
interest paid for the period
taxes paid
a. Cash Coverage Ratio = Cash Flows from Operating
16. Debt-to-Equity Ratio
c. Equity capital is usually considered much less risky
than debt
a. Debt-to-Equity Ratio = Total Liabilities ÷ Total
Chapter 13 – Analyzing Financial Statements
13–11
i. Debt is risky for a company because specific
interest payments must be made even if company
has not earned sufficient income to pay them
ii. In contrast, dividends are always at the company’s
are declared by the board of directors
resources from creditors because of the advantages
of borrowing money discussed earlier
in companies using a mix of debt and equity
LO 8 – Compute and interpret market ratios.
I. Market Ratios––ratios that relate the current price per share
of a company’s stock to the return that accrues to
stockholders
Summarized in Exhibit 13.3
Use Supplemental
Enrichment Activity #1
Use Supplemental
Enrichment Activity #2
17. Price/Earnings (P/E) Ratio
a. Price/Earnings (P/E) Ratio = Market Price per Share ÷
Earnings per Share
price of a stock and its earnings per share
c. Reflects the stock market’s assessment of a company’s
d. A high ratio indicates that earnings are expected to
prospects are considered favorable, there are risks
b. Measures the relationship between the current market
18. Dividend Yield Ratio
a. Dividend Yield Ratio = Dividends per Share ÷ Market
Price per Share
c. The dividend yield for most stocks is not high
compared to alternative investments
d. Stock with low growth potential tend to offer much
higher dividend yields than do stocks with high
b. Reflects the return on investment absent any capital
Chapter 13 – Analyzing Financial Statements
13–12
growth potential
Feedback – Self-Study Quiz
V. Interpreting Ratios and Other Analytical Considerations
Refer students to Guided
Help 13-1
A. Background
1. Except for EPS, the computation of financial ratios has
not been standardized by the accounting profession.
compute them based on their decision objective
careful to note how each ratio is computed
2. Considerations:
a. Ratios can be interpreted only by comparing them to
other ratios or to a benchmark value
analysis cannot uncover obscured problems
its ratios
b. Because ratios are based on the aggregation of
B. Other Financial Information
1. Factors that could affect analysis:
a. Rapid growth
i. Growth in total sales volume does not always
indicate that a company is successful
as a result of a company opening new stores
b. Uneconomical expansion
i. In the pursuit of growth, some companies will open
stores in less desirable locations
ii. These poor locations can cause a company’s
average productivity to decline
is sales volume per square foot of selling space
c. Subjective factors
i. Analyzing a company involves much more than
simply analyzing its financial statements and ratios
stores and perhaps talk to customers and suppliers
future performance

Chapter 13 – Analyzing Financial Statements
13–13
Supplemental Enrichment Activities
Note: These activities would be suitable for individual or group activities.
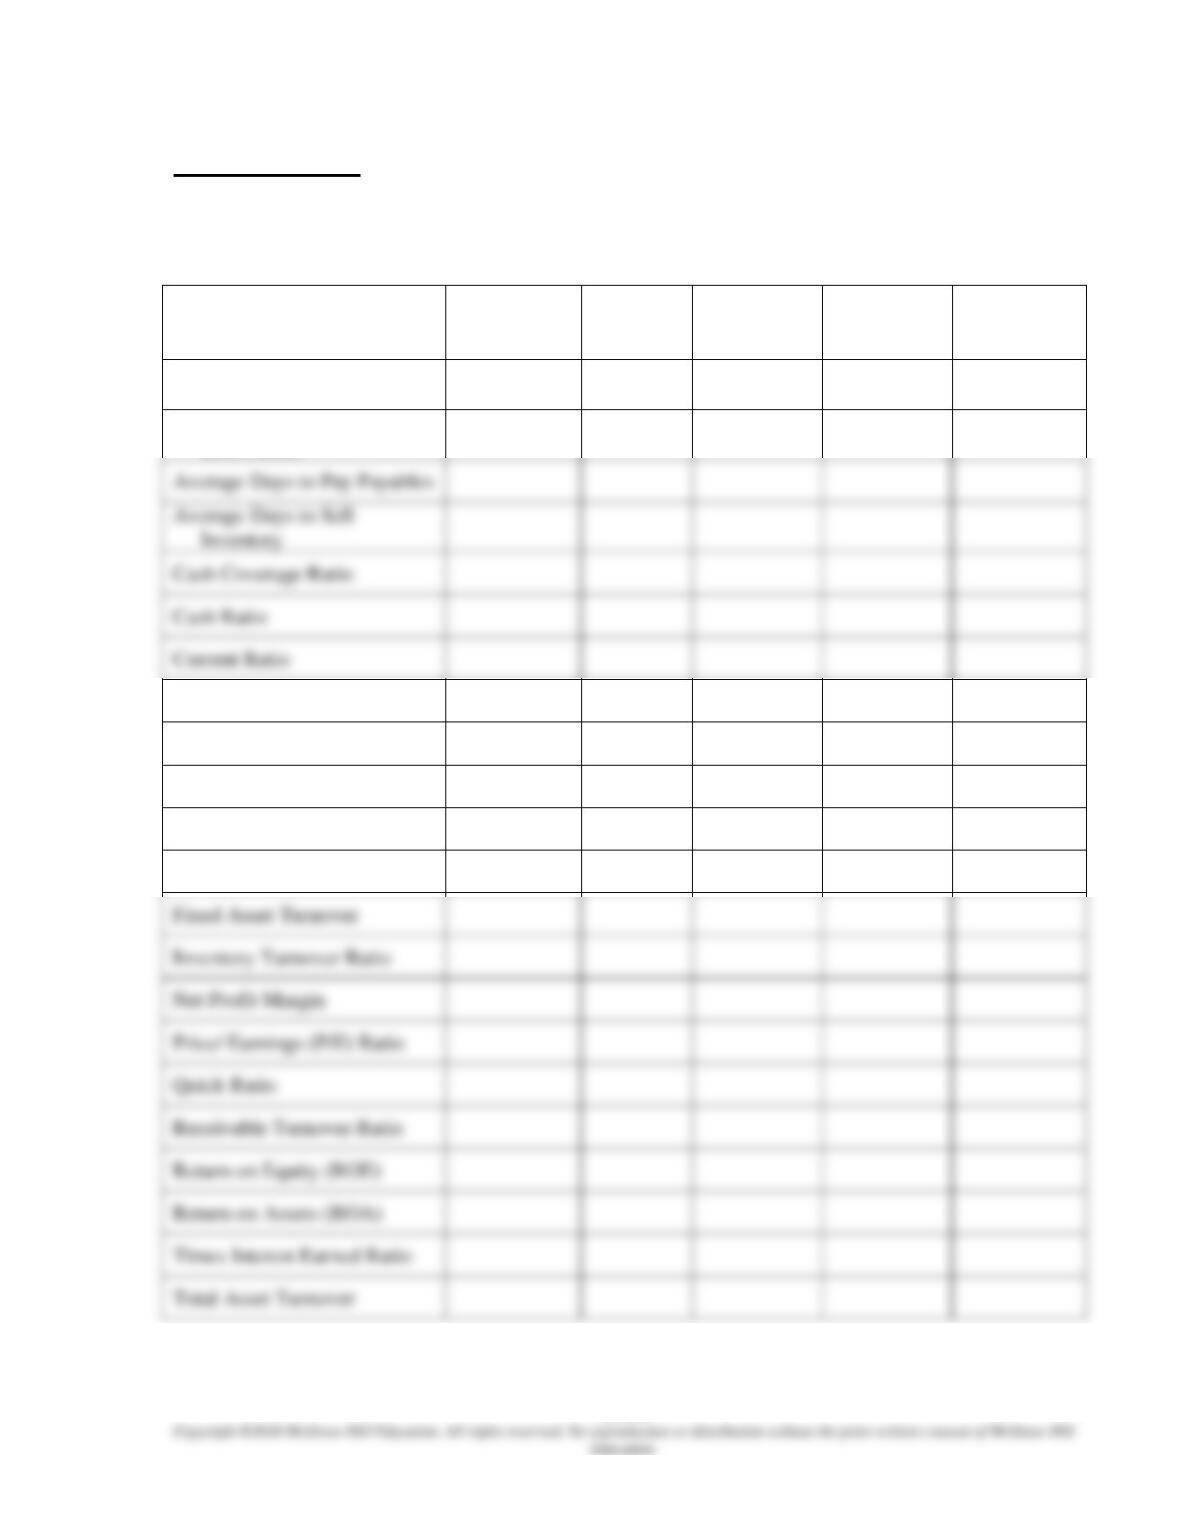
1. Handout 13-1
Use Handout 13- for an in-class activity designed to review the classification of financial ratios. The
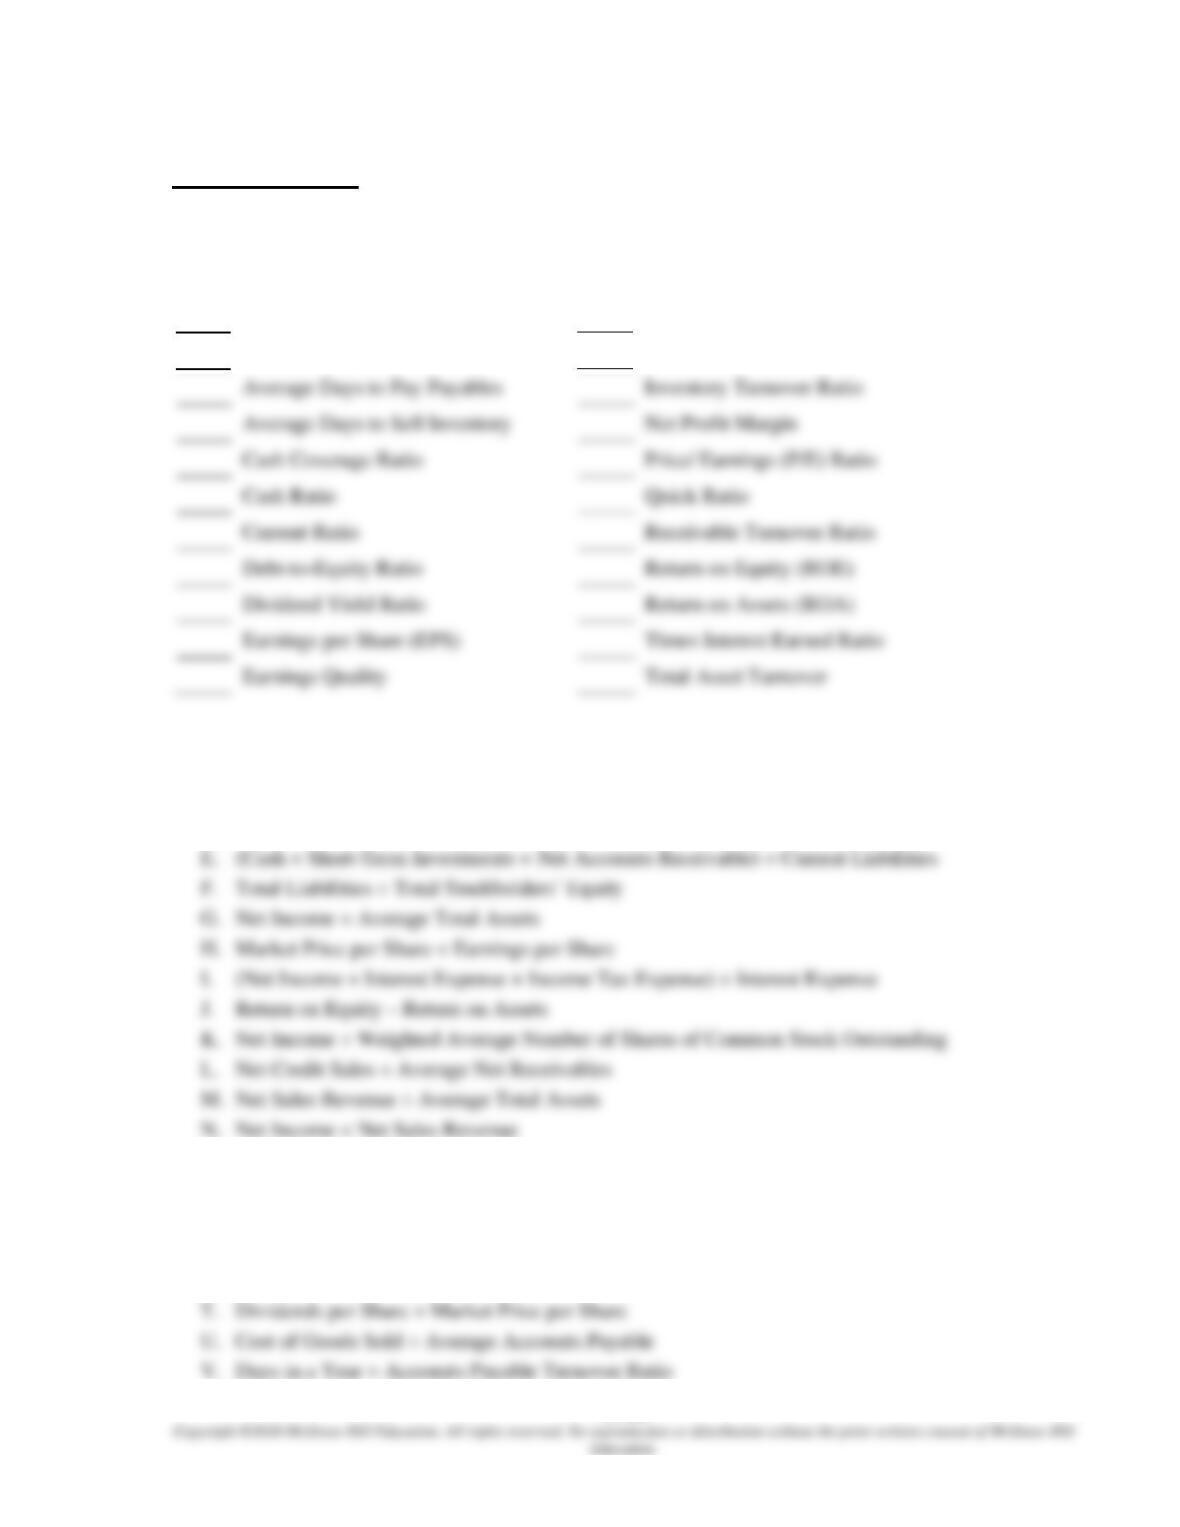
2. Handout 13-2
Use Handout 13-2 for an in-class activity designed to review the formulas of financial ratios. The
Chapter 13 – Analyzing Financial Statements
13–14
HANDOUT 13 – 1
CLASSIFICIATON OF FINANCIAL RATIOS
Classify each of the following financial ratios by type.
Financial Ratios
Profitability
Ratios
Asset
Turnover
Ratios
Liquidity
Ratios
Solvency
Ratios
Market
Ratios
Accounts Payable Turnover
Ratio
Average Days to Collect
Receivables
Average Days to Pay Payables
Average Days to Sell
Cash Ratio
Debt-to-Equity Ratio
Dividend Yield Ratio
Earnings per Share (EPS)
Earnings Quality
Financial Leverage Percentage
Fixed Asset Turnover
Inventory Turnover Ratio
Net Profit Margin
Price/ Earnings (P/E) Ratio
Quick Ratio
Receivable Turnover Ratio
Return on Equity (ROE)
Return on Assets (ROA)
Times Interest Earned Ratio
Total Asset Turnover
Chapter 13 – Analyzing Financial Statements
13–15
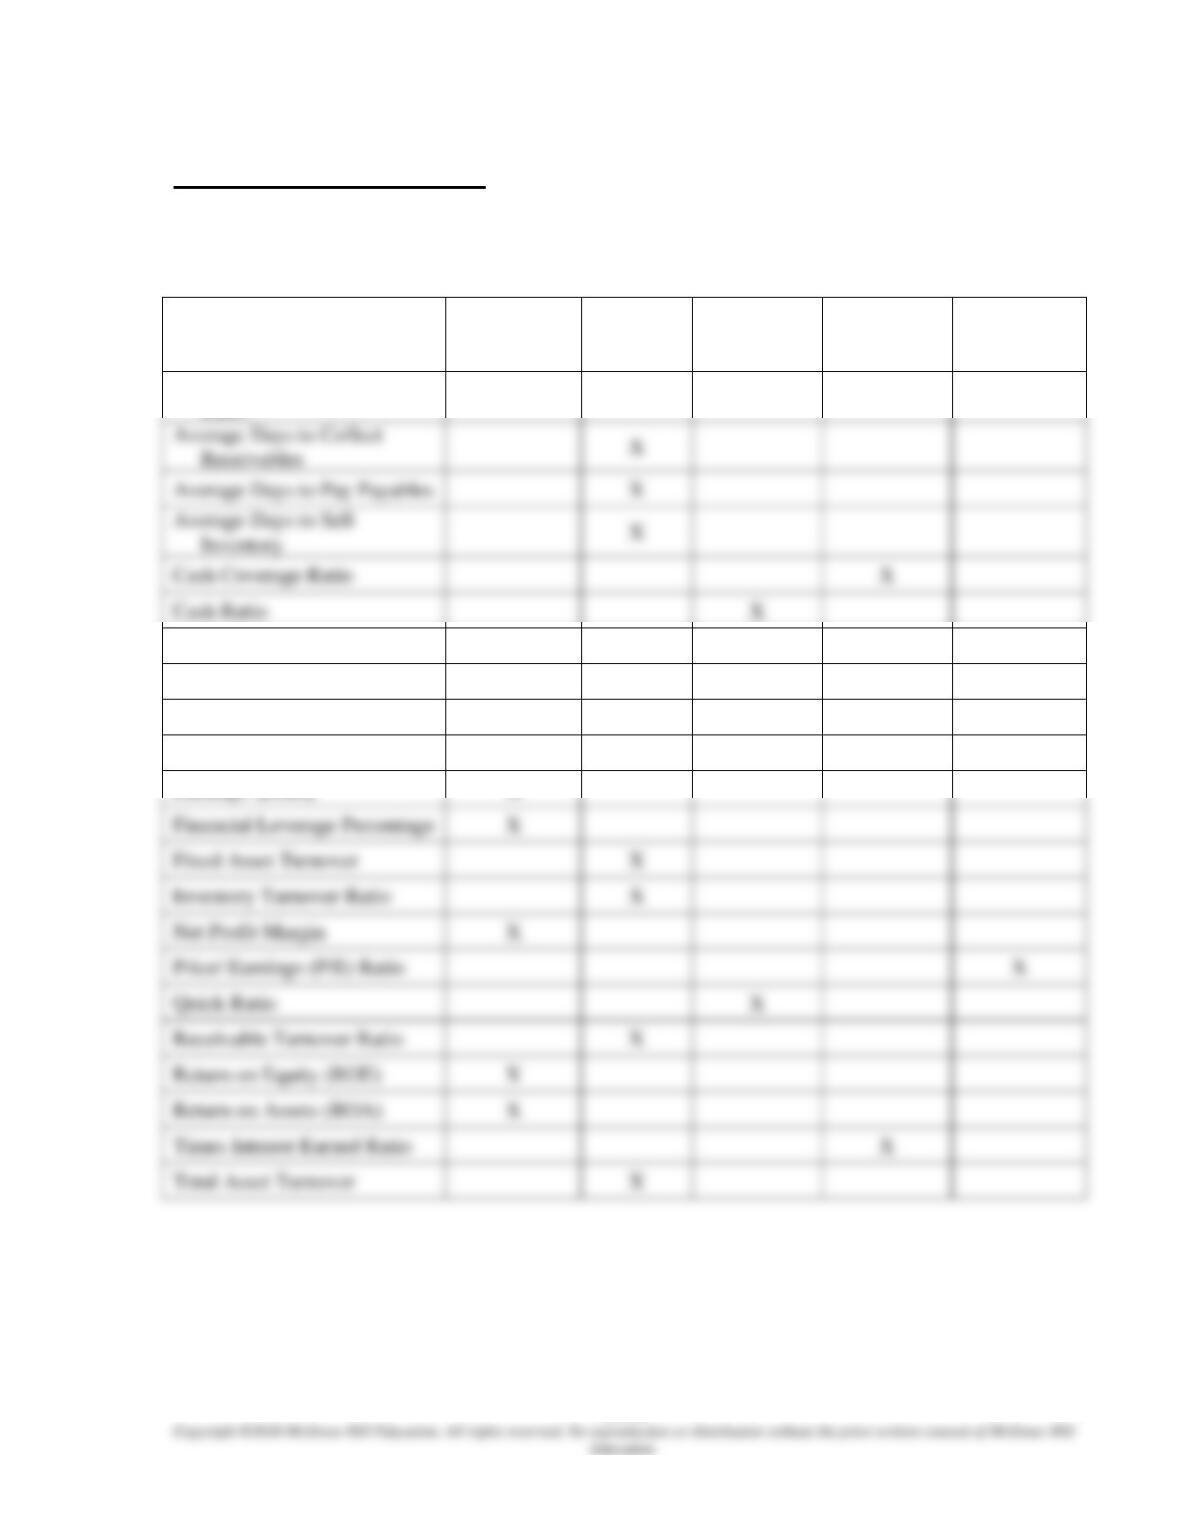
HANDOUT 13 – 1 SOLUTION
CLASSIFICIATON OF FINANCIAL RATIOS
Classify each of the following financial ratios by type.
Financial Ratios
Profitability
Ratios
Asset
Turnover
Ratios
Liquidity
Ratios
Solvency
Ratios
Market
Ratios
Accounts Payable Turnover
Ratio
X
Average Days to Collect
Receivables
X
Average Days to Pay Payables
Average Days to Sell
X
X
X
Current Ratio
X
Debt-to-Equity Ratio
X
Dividend Yield Ratio
X
Earnings per Share (EPS)
X
Earnings Quality
X
Inventory Turnover Ratio
Net Profit Margin
X
Price/ Earnings (P/E) Ratio
X
Quick Ratio
X
Times Interest Earned Ratio
X
Total Asset Turnover
Chapter 13 – Analyzing Financial Statements
13–16
HANDOUT 13 – 2
FINANCIAL RATIO FORMULAS
Match each of the following financial ratios with its formula:
Accounts Payable Turnover Ratio
Financial Leverage Percentage
Average Days to Collect Receivables
Fixed Asset Turnover
Average Days to Pay Payables
Inventory Turnover Ratio
Average Days to Sell Inventory
Net Profit Margin
Cash Ratio
Quick Ratio
Current Ratio
Receivable Turnover Ratio
Return on Equity (ROE)
Dividend Yield Ratio
Return on Assets (ROA)
Earnings per Share (EPS)
Times Interest Earned Ratio
Earnings Quality
Total Asset Turnover
A. Cost of Goods Sold ÷ Average Inventory
B. (Cash and Cash Equivalents) ÷ Current Liabilities
C. Cash Flows from Operating Activities ÷ Interest Paid
D. Cash Flows from Operating Activities ÷ Net Income
O. Days in a Year ÷ Inventory Turnover Ratio
P. Days in a Year ÷ Receivable Turnover Ratio
Q. Current Assets ÷ Current Liabilities
R. Net Income ÷ Average Total Stockholders’ Equity
S. Net Sales Revenue ÷ Average Net Fixed Assets
Chapter 13 – Analyzing Financial Statements
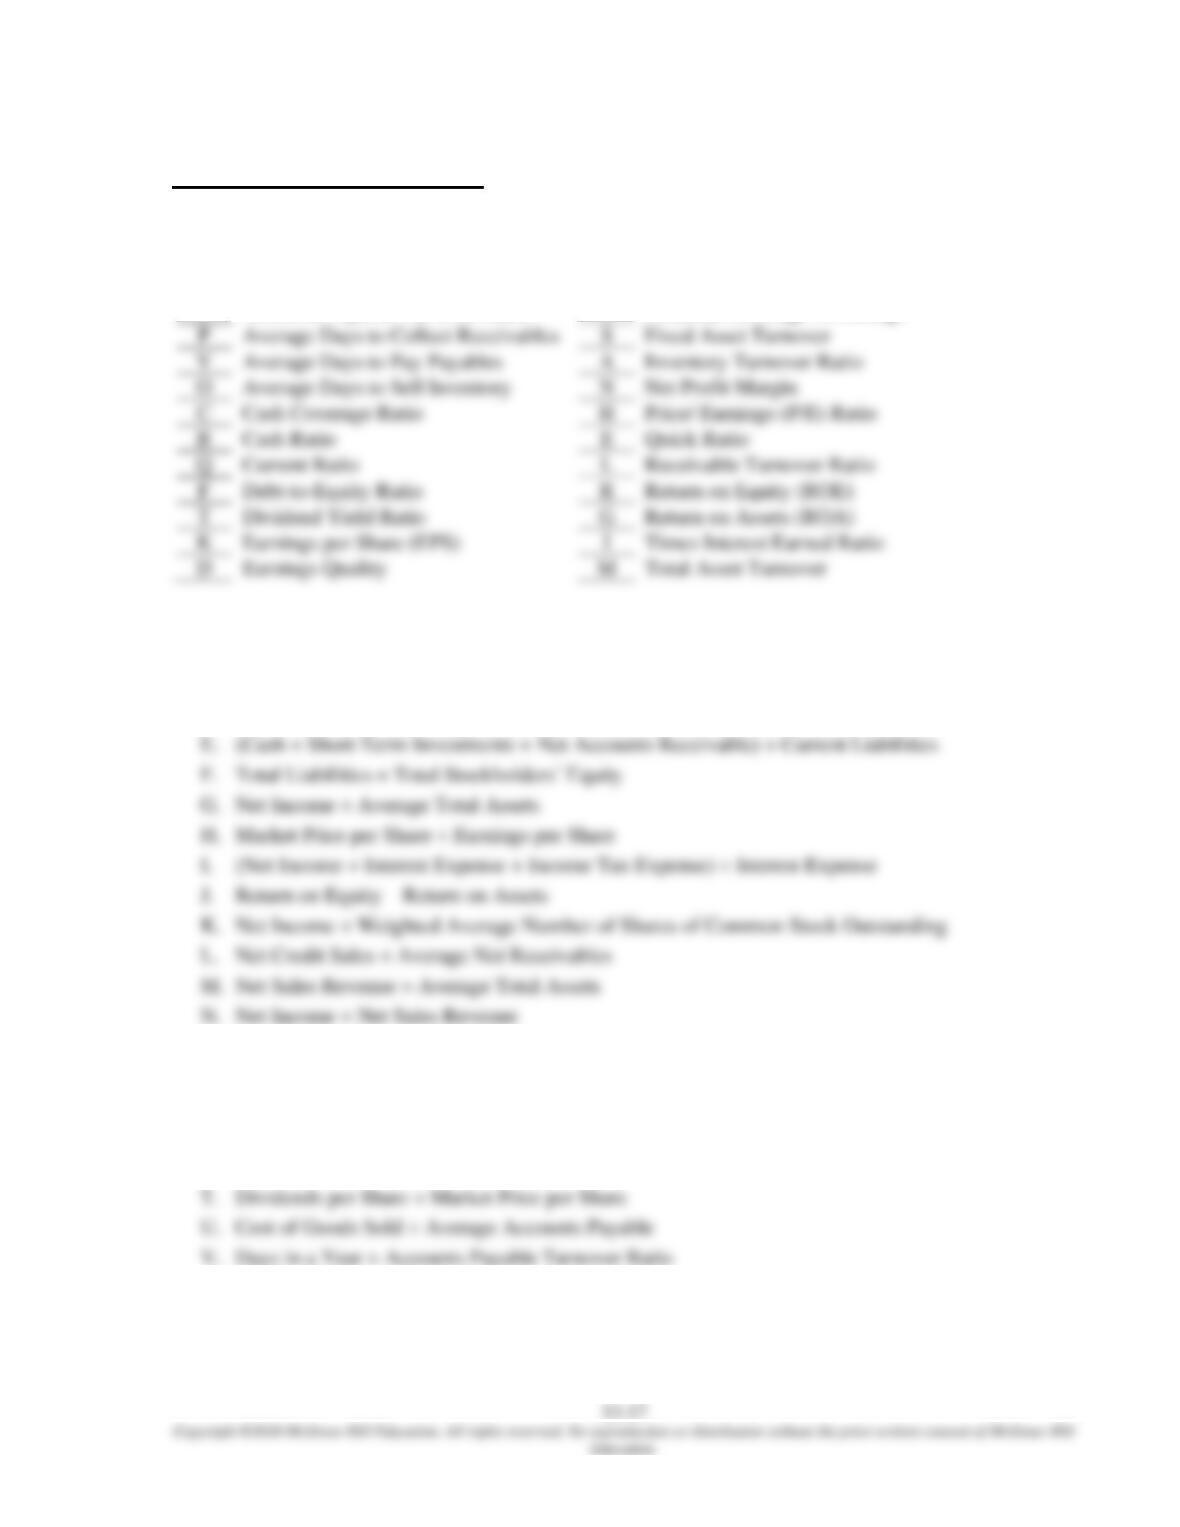
HANDOUT 13 – 2 SOLUTION
FINANCIAL RATIO FORMULAS
Match each of the following financial ratios with its formula:
U
Accounts Payable Turnover Ratio
J
Financial Leverage Percentage
O
Average Days to Sell Inventory
N
Net Profit Margin
K
Earnings per Share (EPS)
I
Times Interest Earned Ratio
A. Cost of Goods Sold ÷ Average Inventory
B. (Cash and Cash Equivalents) ÷ Current Liabilities
C. Cash Flows from Operating Activities ÷ Interest Paid
D. Cash Flows from Operating Activities ÷ Net Income
O. Days in a Year ÷ Inventory Turnover Ratio
P. Days in a Year ÷ Receivable Turnover Ratio
Q. Current Assets ÷ Current Liabilities
R. Net Income ÷ Average Total Stockholders’ Equity
S. Net Sales Revenue ÷ Average Net Fixed Assets