Chapter 13
Analyzing Financial Statements
ANSWERS TO QUESTIONS
1. Published financial statements are designed primarily to meet the needs of
3. Under a product differentiation strategy, companies offer products with unique
4. The two general methods are comparing across time and comparing across
5. Component percentages express each item on a financial statement as a
percentage of a single base amount. The base amount on the income
6. Ratios express the proportionate relationship between two amounts. Ratio
7. Profitability ratios focus on income and how it compares to other amounts
reported on the financial statements. Return on equity, return on assets,
8. Turnover ratios focus on capturing how effectively a company uses its assets.
9. Liquidity ratios focus on assessing a company’s ability to meet its short-term
10. Solvency ratios focus on assessing a company’s ability to meet its long-term
11. Market ratios focus on the relationship between the current price per share of
12. Accounting policy choices influence ratios This is important because different
companies rarely use exactly the same accounting policies. For example, two
13. Total sales can increase as a result of a company selling more at its existing
ANSWERS TO MULTIPLE CHOICE
Financial Accounting, 10/e 13–3
Authors’ Recommended Solution Time
(Time in minutes)
Mini-exercises
Exercises
Problems
Alternate
Problems
Cases and
Projects
No.
Time
No.
Time
No.
Time
No.
Time
No.
Time
1
5
1
15
1
20
1
20
1
50
2
5
2
15
2
20
2
20
2
50
3
5
3
15
3
40
3
40
3
60
4
5
4
15
4
60
4
60
4
45
5
5
5
20
5
5
5
20
6
5
6
20
6
6
6
7
5
7
15
7
7
8
5
8
15
8
30
9
5
9
15
9
10
5
10
10
15
11
15
13
10
* Due to the nature of this project, it is very difficult to estimate the amount of time
students will need to complete the assignment. As with any open-ended project,
it is possible for students to devote a large amount of time to these assignments.
MINI-EXERCISES
M13–1.
Sales – Cost of Goods Sold = Gross Profit
Cost of Goods Sold = $932,400
An alternate way to solve this problem is :
M13–2.
Sales – Cost of Goods Sold = Gross Profit
M13–3.
M13–4.
M13–5.
The inventory turnover ratio will increase. The numerator of the ratio, Cost of
M13–6.
Total Assets – Noncurrent Assets = Current Assets
M13–7.
Current Ratio
=
Current Assets
Current Liabilities
=
Current Liabilities
M13–8.
Times Interest Earned =
M13–9.
Dividend Yield = Dividends per Share ÷ Market Price per Share
M13–10.
All else equal, if prices have been increasing then the most expensive
inventory is the newest inventory. Switching from FIFO to LIFO will result in
higher costs being transferred to cost of goods sold. This will result in lower
costs remaining in inventory, and hence, a lower inventory amount on the
balance sheet. In summary, switching from FIFO to LIFO will:
The ratio effects are:
• Net Profit Margin: Numerator will decrease. Denominator will
stay the same. Overall effect is that the ratio will decrease.
EXERCISES
E13–1.
1. COMPANY 1: Car manufacturer (d)
2. COMPANY 2: Wholesale candy company (c)
3. COMPANY 3: High-end clothing store (a)
Key indicators: High inventory; low inventory turnover; high gross profit
E13–2.
2. COMPANY 2: Travel agency (a)
3. COMPANY 3: Hotel (b)
4. COMPANY 4: Drug company (d)
E13–3.
1. COMPANY 1: Cable TV Company (a)
2. COMPANY 2: Accounting firm (c)
3. COMPANY 3: High-end jewelry store (d)
High inventory; low inventory turnover; high gross profit
E13–4.
1. COMPANY 1: Restaurant (d)
Key indicators: High inventory turnover; high property & equipment
Financial Accounting, 10/e 13–9
E13–5.
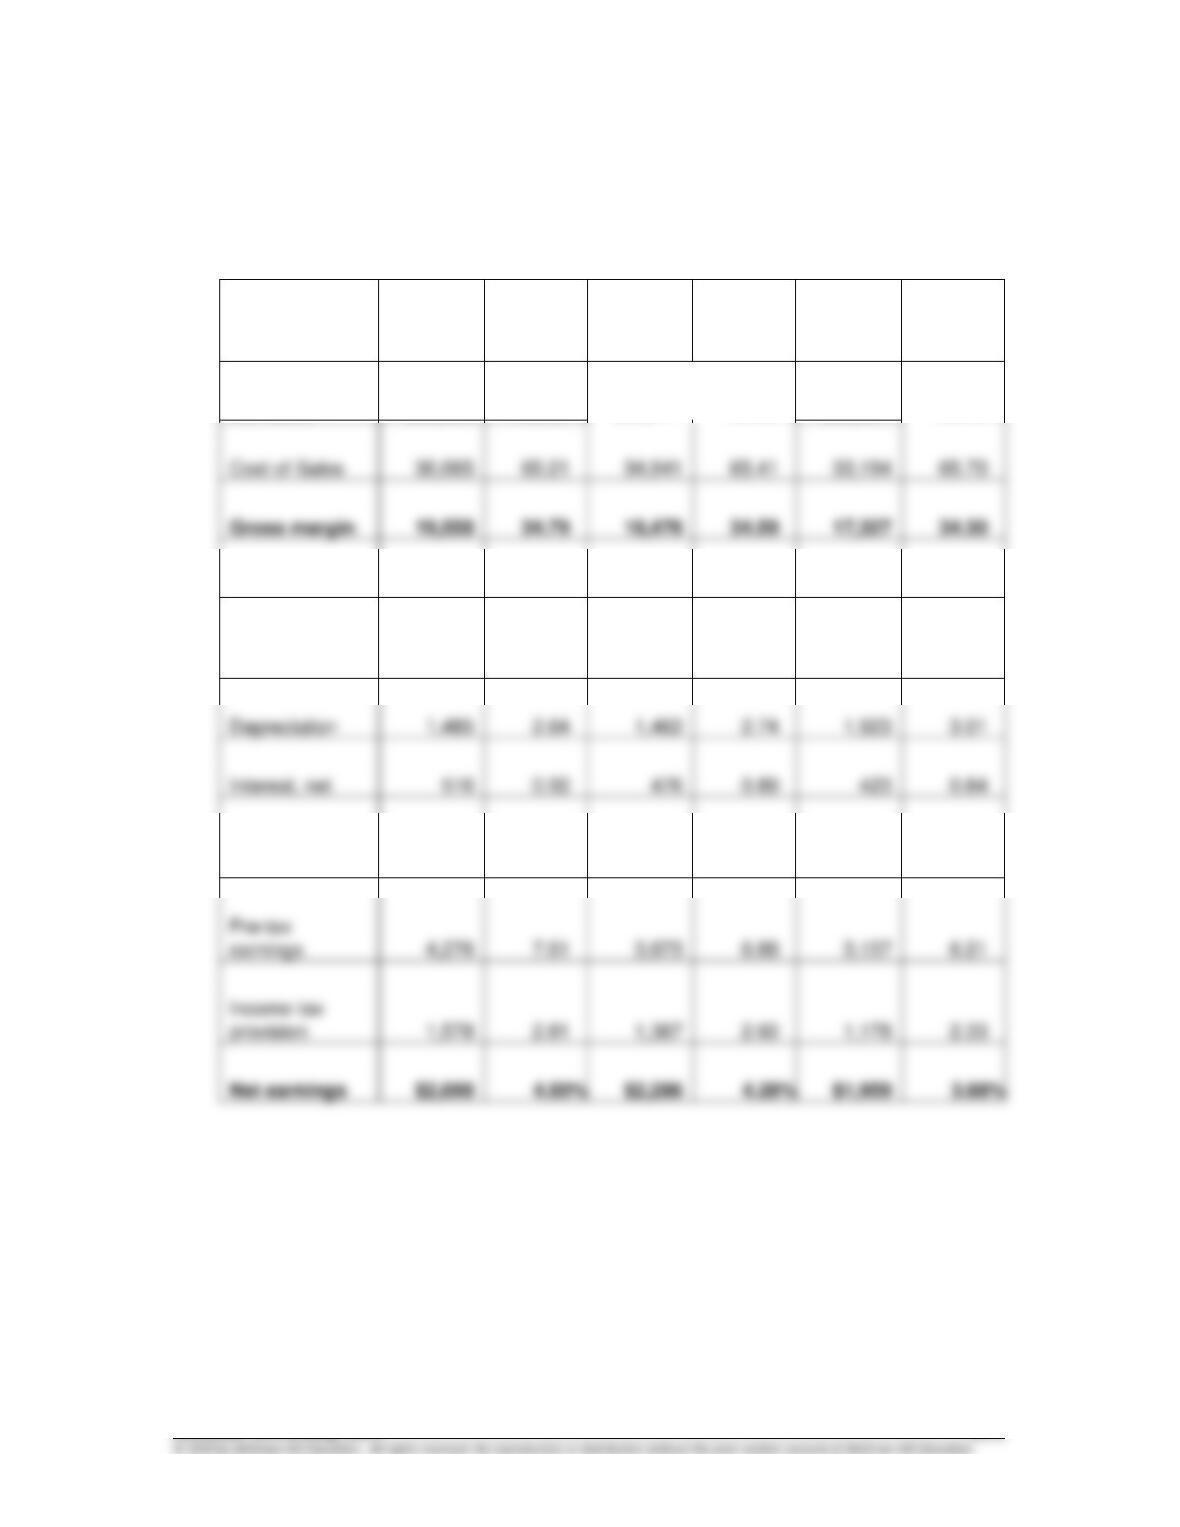
TRIXY MAGIC, INC.
Consolidated Statements of Earnings
(in millions)
Fiscal
2018
% Sales
Fiscal
2017
% Sales
Fiscal
2016
% Sales
Net sales
$56,223
100.00%
$53,417
100.00%
$50,521
100.00%
Cost of Sales
36,665
65.21
34,941
65.41
33,194
65.70
Gross margin
19,558
34.79
18,476
34.59
17,327
34.30
Expenses:
Selling, general
& administrative
13,281
23.62
12,865
24.08
12,244
24.24
Depreciation
Interest, net
Total
expenses
15,282
27.18
14,803
27.71
14,190
28.09
Pre-tax
earnings
Income tax
provision
Net earnings
$2,698
$2,286
$1,959
E13–6.
1.
A
Net profit margin
2.
G
Inventory turnover ratio
3.
B
Average days to collect receivables
4.
K
Dividend yield ratio
5.
C
Return on equity
6.
F
Current ratio
7.
8.
Price/earnings ratio
9.
H
Receivable turnover ratio
Average days to sell inventory
M
Return on assets
E
Quick ratio
Times interest earned ratio
Cash coverage ratio
Fixed asset turnover ratio
E13–7.
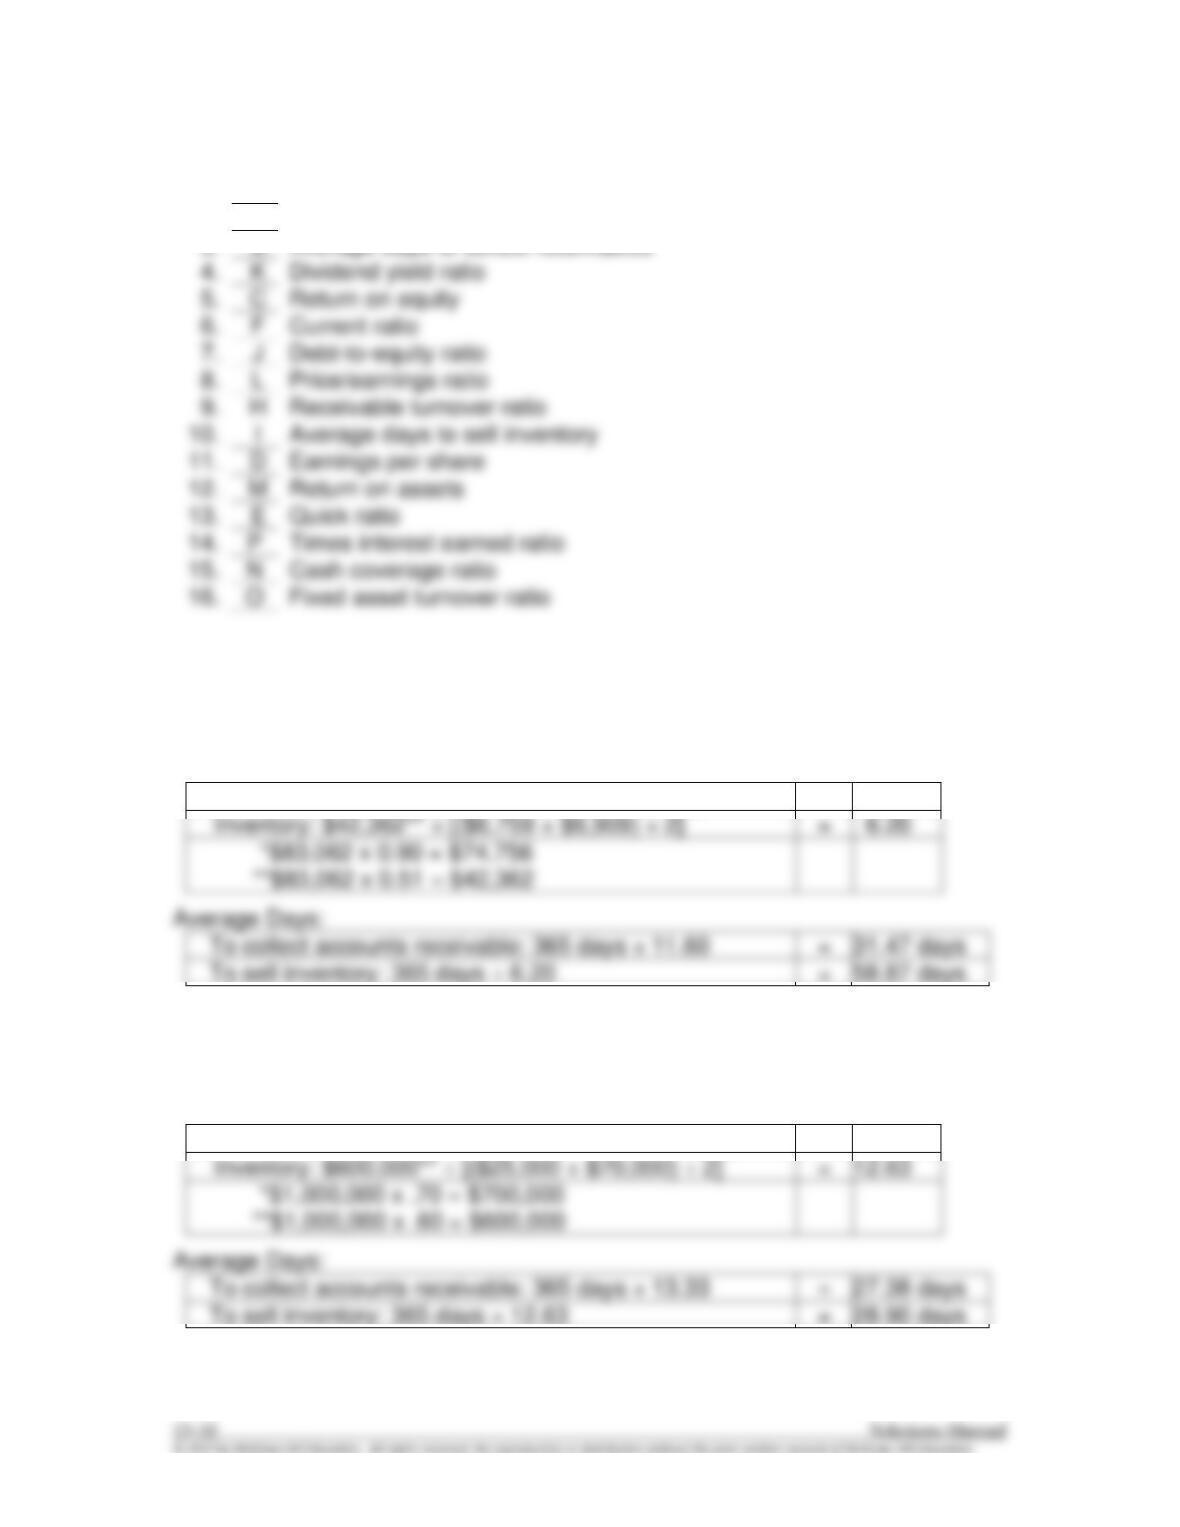
Turnover Ratios:
Receivable: $74,756* ÷ [($6,386 + $6,508) ÷ 2]
=
11.60
Inventory: $42,362** ÷ [($6,759 + $6,909) ÷ 2]
=
To collect accounts receivable: 365 days ÷ 11.60
=
31.47 days
To sell inventory: 365 days ÷ 6.20
=
58.87 days
E13–8.
Turnover Ratios:
Receivable: $700,000* ÷ [($60,000 + $45,000) ÷ 2]
=
13.33
Inventory: $600,000** ÷ [($25,000 + $70,000) ÷ 2]
=
12.63
=
27.38 days
=
28.90 days
Financial Accounting, 10/e 13–11
E13–9.
Current Assets
(1)
Current Liabilities
(2)
Current
Ratio
(1 ÷ 2)
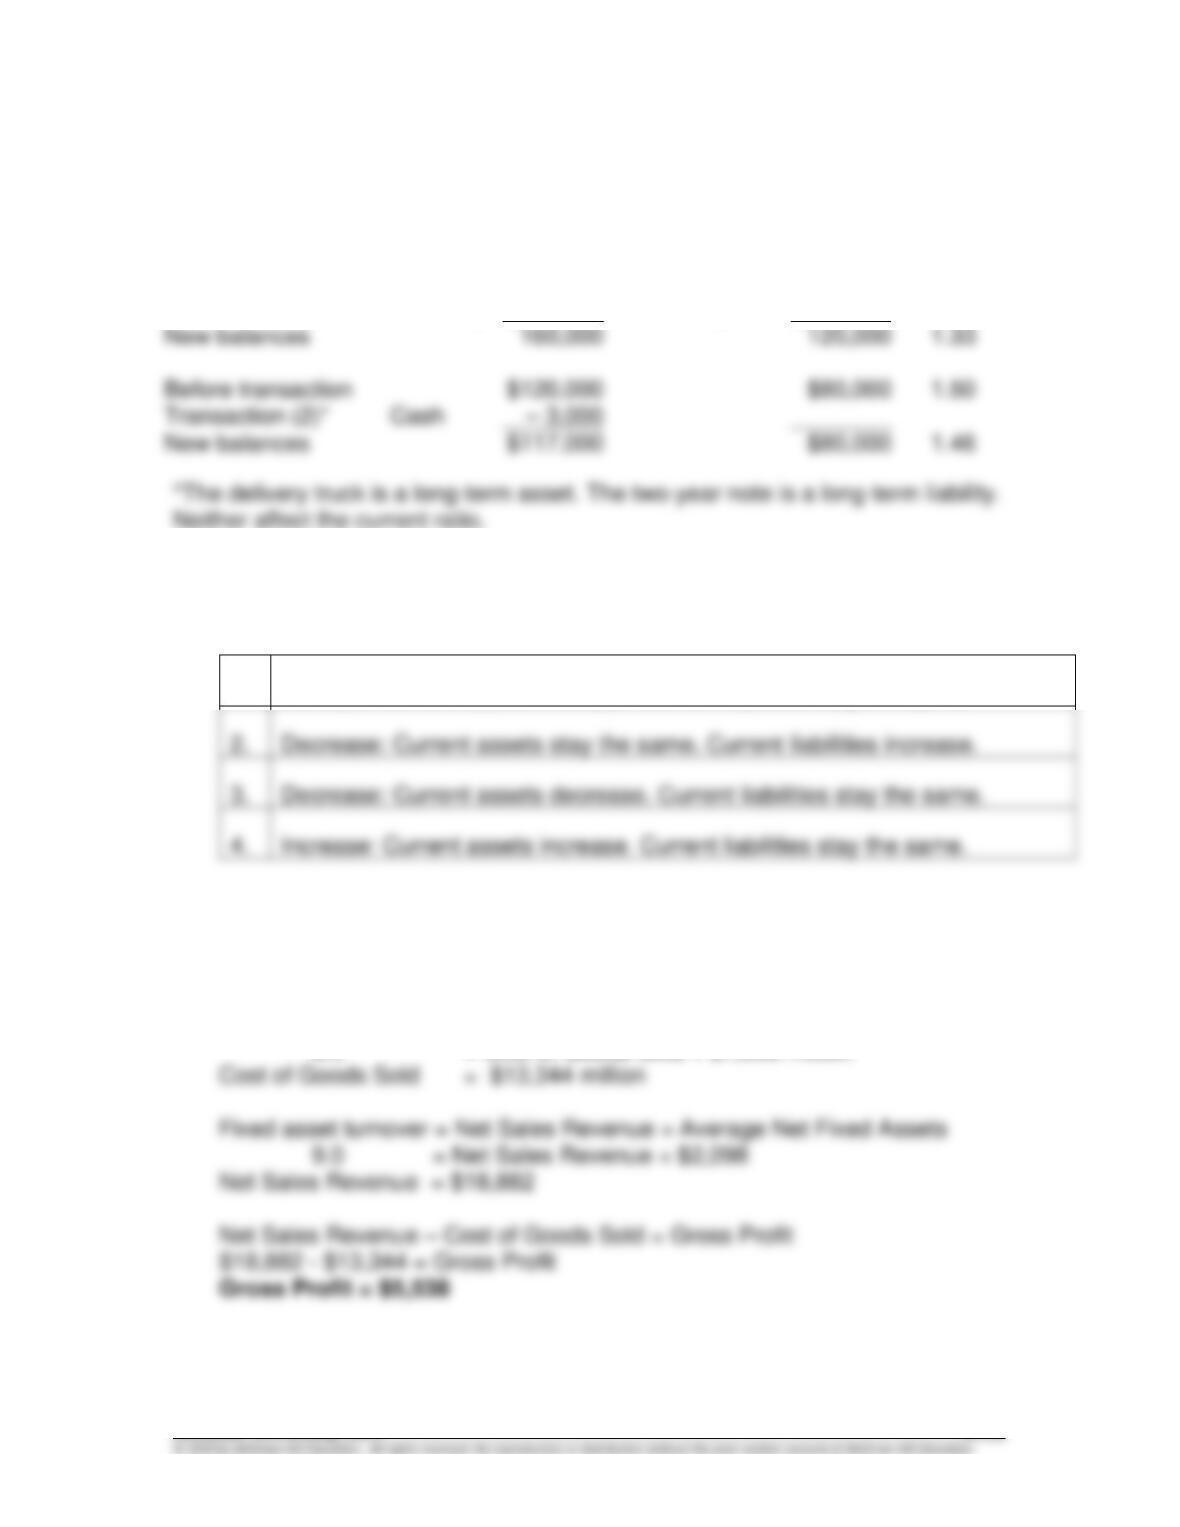
Before transaction
$120,000
($120,000 ÷ 1.5)
$80,000
1.50
Transaction (1)
Inventory
+ 40,000
Accts. Pay.
+ 40,000
New balances
1.33
Before transaction
$120,000
Transaction (2)*
Cash
New balances
$117,000
$80,000
E13–10.
Effect on Current Ratio:
1.
Increase: Current assets increase. Current liabilities stay the same.
2.
Decrease: Current assets stay the same. Current liabilities increase.
3.
Decrease: Current assets decrease. Current liabilities stay the same.
4.
Increase: Current assets increase. Current liabilities stay the same.
E13–11.
Inventory turnover ratio = Cost of Goods Sold ÷ Average Inventory
8.0 = Cost of Goods Sold ÷ $1,668 million
E13–12.
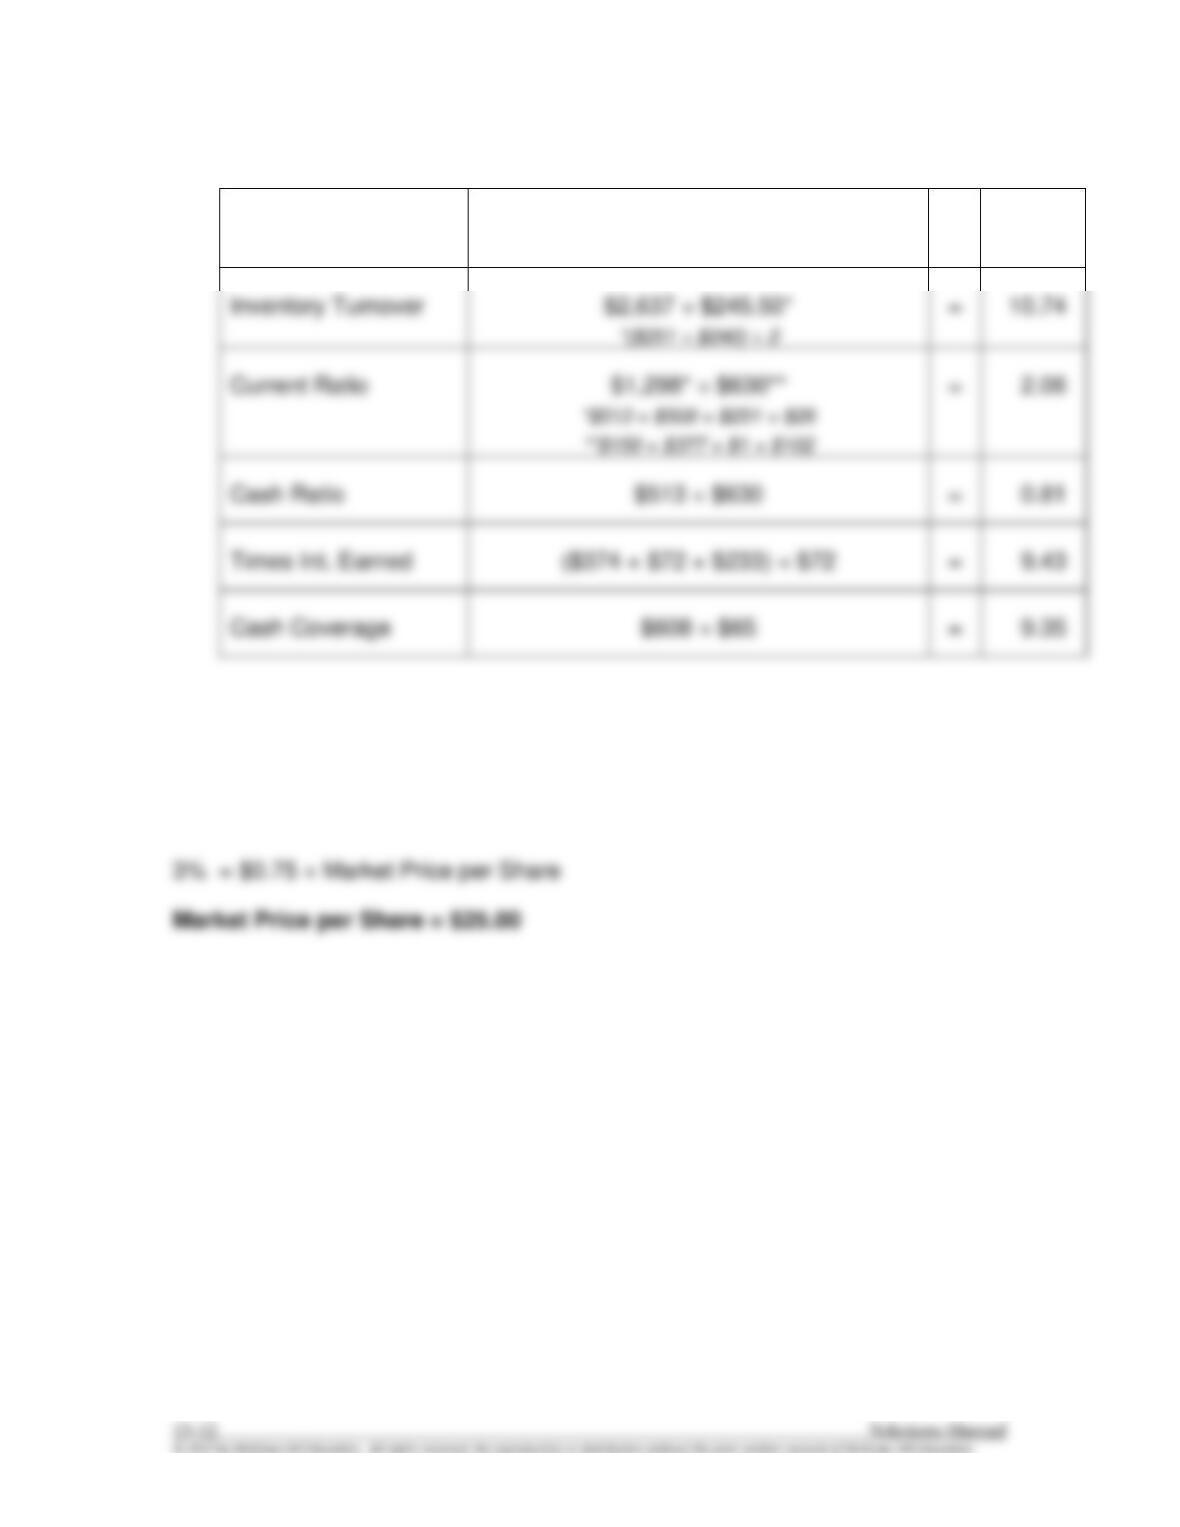
Receivable Turnover
$4,552 ÷ $506.50*
*($508 + $505) ÷ 2
=
8.99
Inventory Turnover
$2,637 ÷ $245.50*
=
E13–13.
Dividend Yield = Dividends per Share ÷ Market Price per Share
PROBLEMS
P13–1.
Based on the ratios provided, Company Y appears to be the better
investment. Company Y has a higher gross profit percentage, which means
that it makes more gross profit on each dollar of sales than does Company
P13–2.
Company A dominates Company B in all ratios. It is important to note that
P13–3.
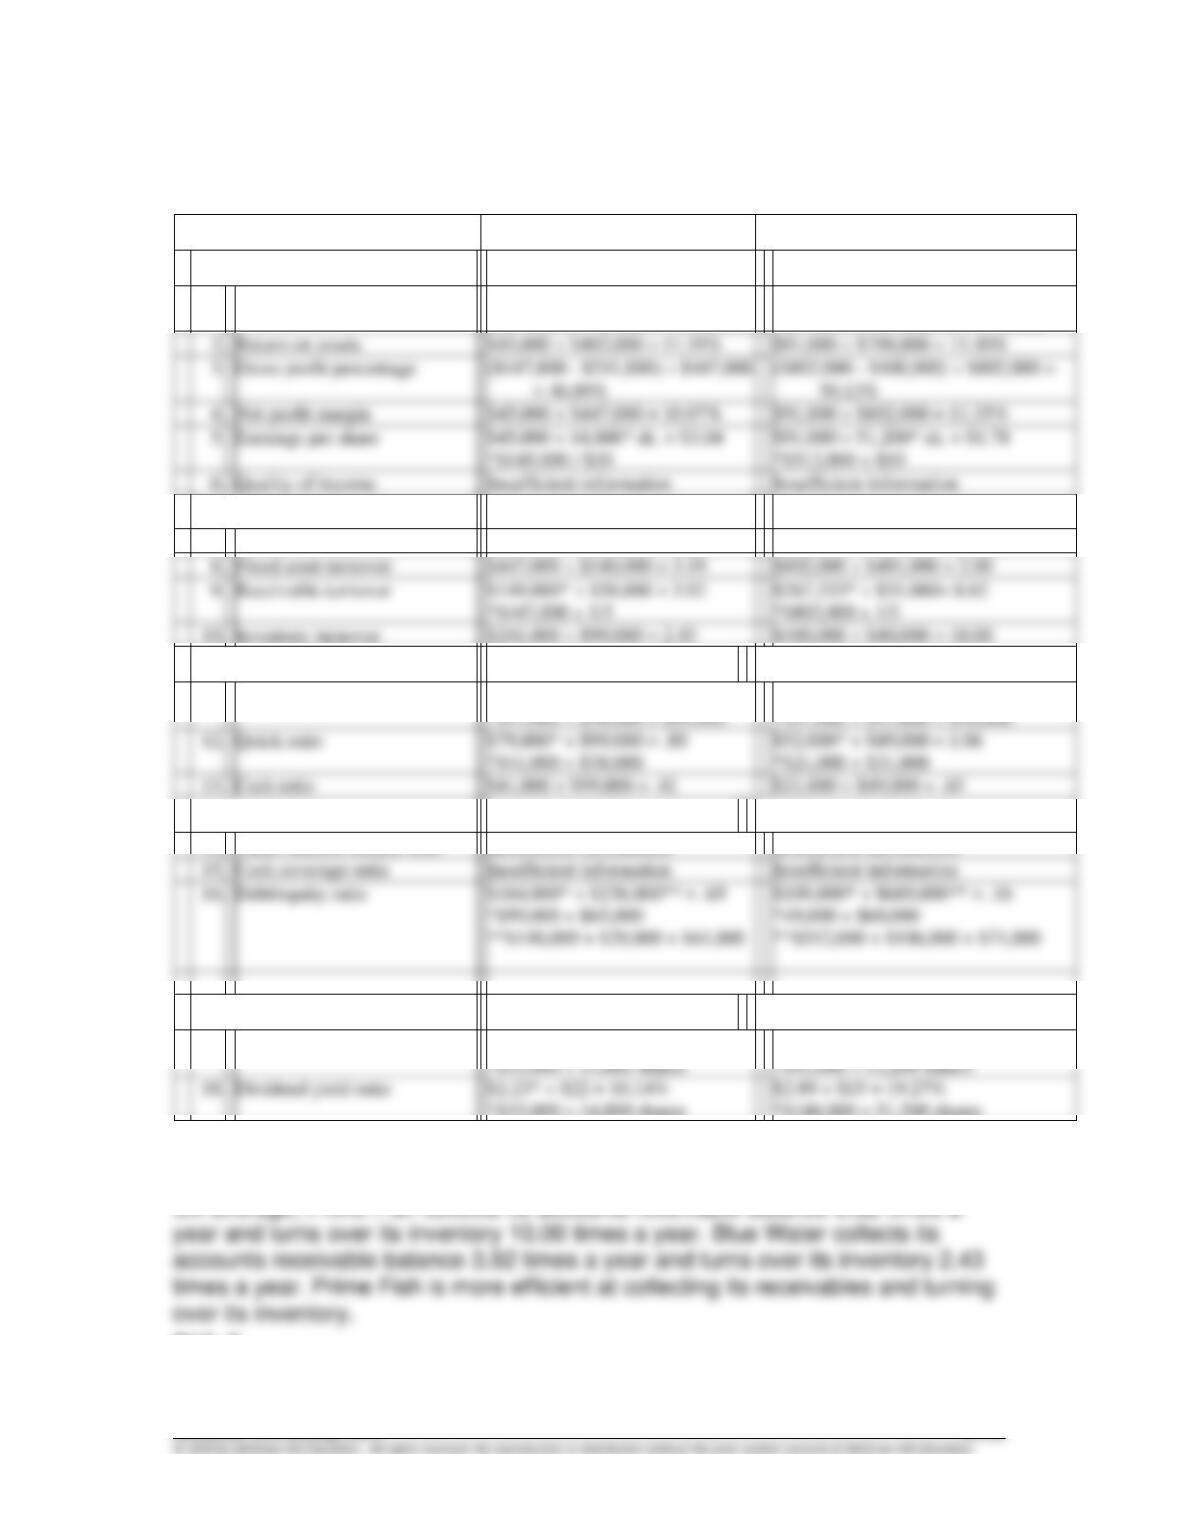
Return on equity
$8,630 ÷ $2,894*
*($4,333 + $1,454) ÷ 2
=
298.25%
Return on assets
Total asset turnover
=
$8,630 ÷ $43,748*
=
19.73%
Financial Accounting, 10/e 13–15
P13–4.
Req. 1
Ratio
Blue Water Company
Prime Fish Company
Profitability ratios:
1.
Return on equity
$45,000 ÷ $238,000* = 18.91%
*($148,000 + $29,000 + $61,000)
$91,000 ÷ $689,000* = 13.21%
*($512,000 + $106,000 + $71,000)
Return on assets
$45,000 ÷ $402,000 = 11.19%
Gross profit percentage
($447,000 – $241,000) ÷ $447,000
($802,000 – $400,000) ÷ $802,000 =
4.
Net profit margin
$45,000 ÷ $447,000 = 10.07%
$91,000 ÷ $802,000 = 11.35%
Earnings per share
$45,000 ÷ 14,800* sh. = $3.04
*$148,000 / $10
$91,000 ÷ 51,200* sh. = $1.78
*$512,000 ÷ $10
6.
Quality of income
Insufficient information
Insufficient information
Asset turnover ratios:
7.
Total asset turnover
$447,000 ÷ $402,000 = 1.11
$802,000 ÷ $798,000 = 1.01
*$447,000 x 1/3
*$802,000 x 1/3
Liquidity ratios:
11.
Current ratio
*$41,000 + $38,000 + $99,000
*$21,000 + $31,000 + $40,000
*$41,000 + $38,000
*$21,000 + $31,000
$178,000* ÷ $99,000 = 1.80
$92,000* ÷ $49,000 = 1.88
Solvency ratios:
14.
Times interest earned ratio
Insufficient information
Insufficient information
15.
Cash coverage ratio
Insufficient information
Insufficient information
Market ratios:
17.
Price/earnings ratio
*$45,000 ÷ 14,800 shares
*$91,000 ÷ 51,200 shares
$22 ÷ $3.04* = 7.24
$15 ÷ $1.78* = 8.43
*$33,000 ÷ 14,800 shares
*$148,000 ÷ 51,200 shares
Req. 2
P13–5.
Req. 1
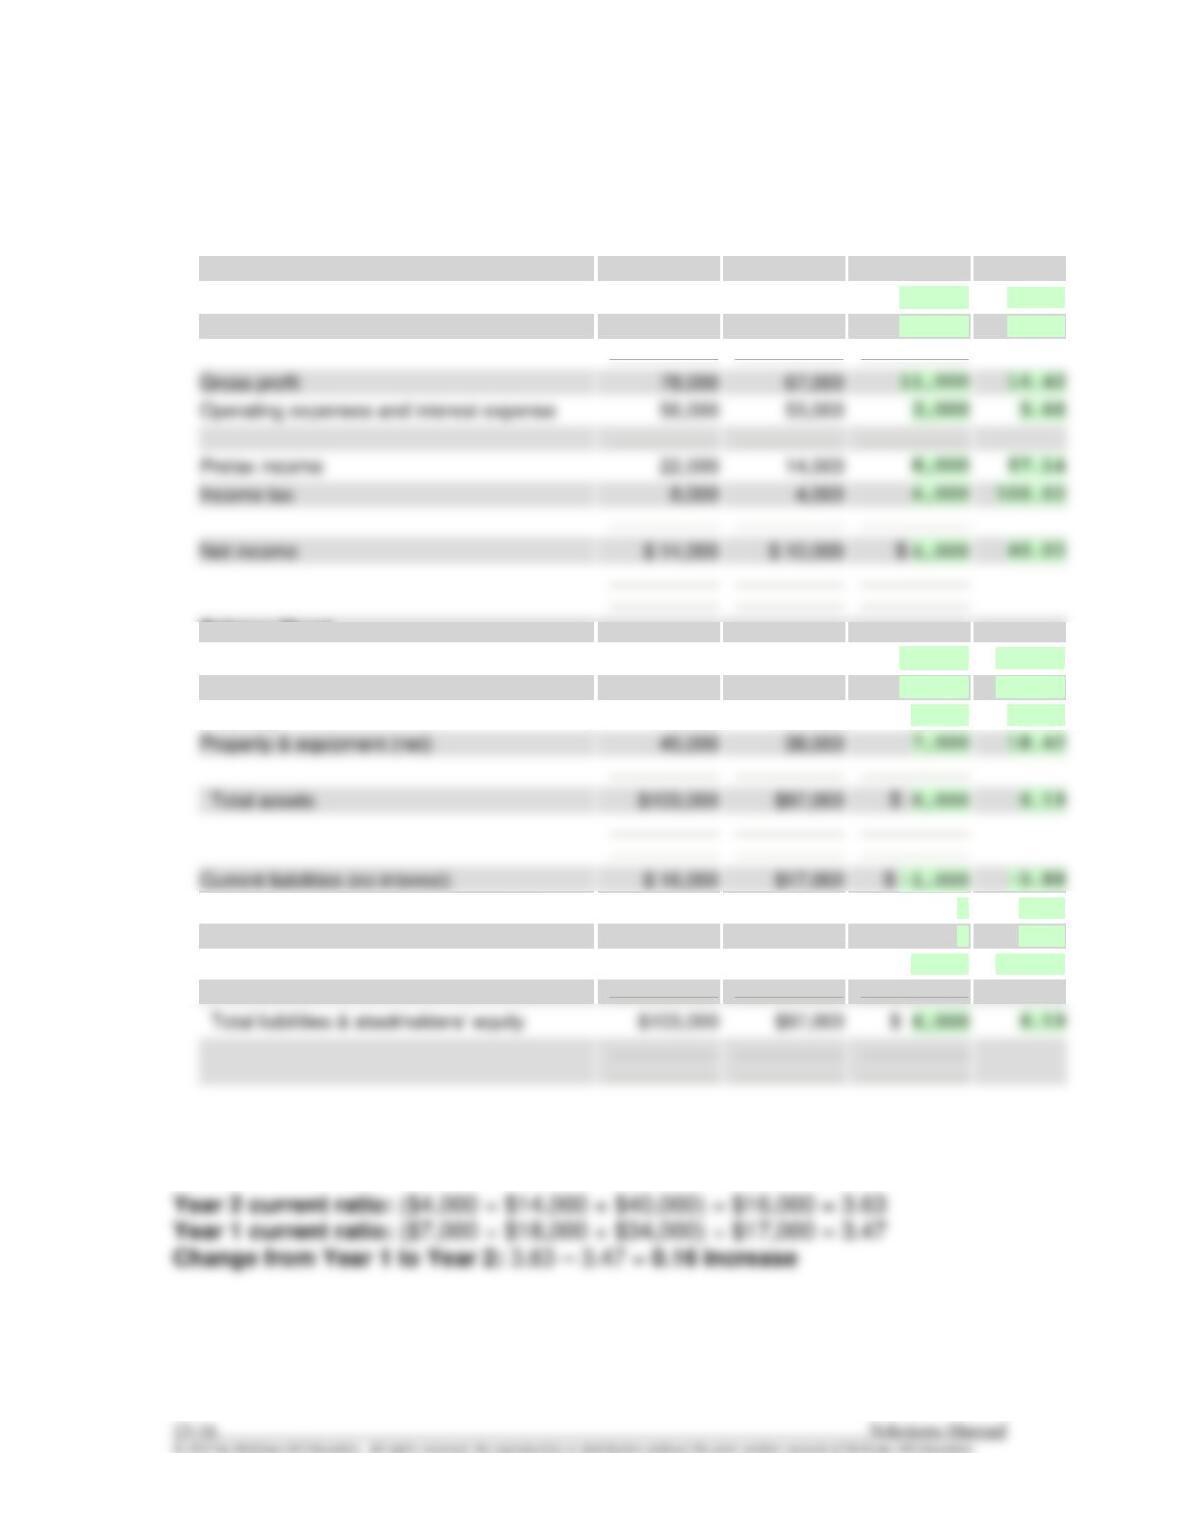
Increase (Decrease)
from Year 1 to Year 2
Income Statement
Year 2
Year 1
Amount
Percent
Sales revenue
$190,000
$167,000
$ 23,000
13.77
Cost of goods sold
112,000
100,000
12,000
12.00
Gross profit
78,000
67,000
11,000
16.42
Operating expenses and interest expense
56,000
53,000
3,000
5.66
Income tax
8,000
4,000
4,000
100.00
Net income
Balance Sheet
Cash
$ 4,000
$ 7,000
$ -3,000
-42.86
Accounts receivable (net)
14,000
18,000
-4,000
-22.22
Inventory
40,000
34,000
6,000
17.65
Property & equipment (net)
45,000
38,000
7,000
18.42
Total assets
$103,000
Current liabilities (no interest)
$ -1,000
Long-term liabilities (interest rate: 10%)
45,000
45,000
0
0.00
Common stock ($5 par value)
30,000
30,000
0
0.00
Retained earnings
12,000
5,000
7,000
140.00
Total liabilities & stockholders’ equity
Req. 2
P13–6.