that in its restructuring, the company sold off profitable operations rather than im-
Chapter 13, C 2. (Continued)
2. User Insight: Restructuring plan assessed
Dash Corporation’s operations have not improved, although the contrary might be
inferred from the year’s change in net income or earnings per share. It is apparent
2010 2009 2008 2007 2006
121.4% 115.8% 114.4% 104.1% 100.0%
120.7% 116.1% 112.3% 101.1% 100.0%
93.5% 107.4% 115.3% 105.4% 100.0%
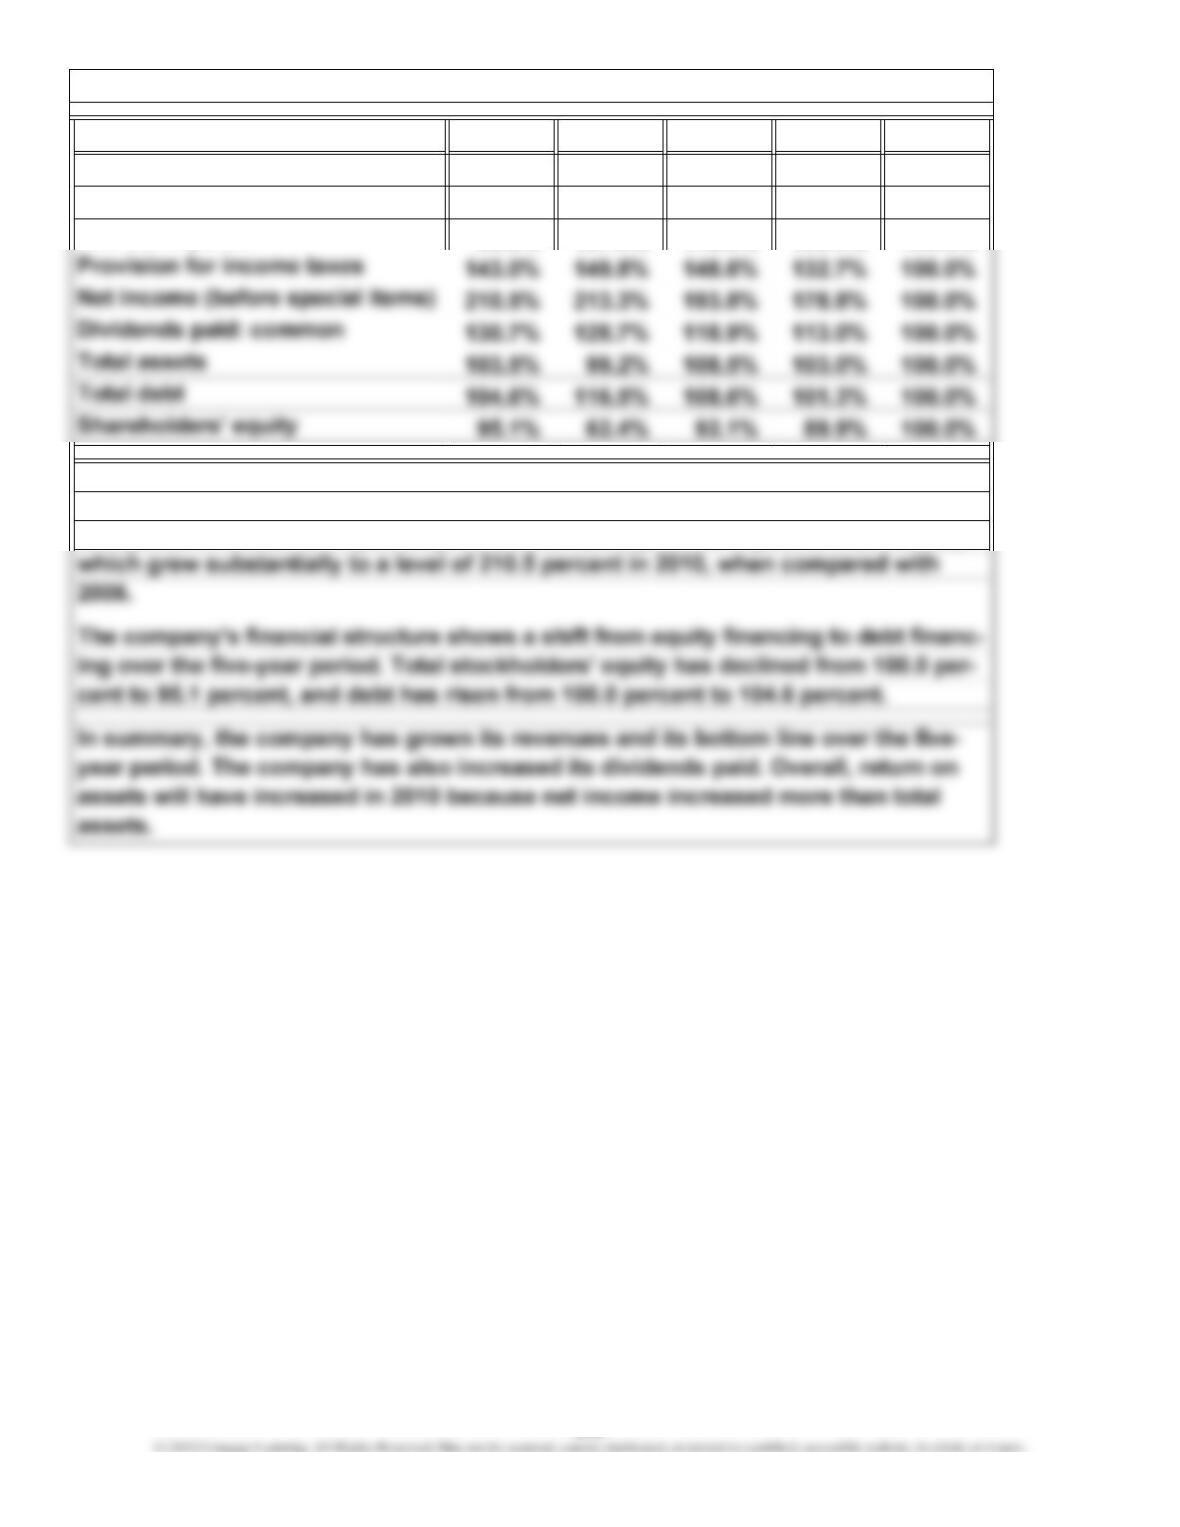
ucts sold and interest expense have grown slower than sales (120.7 percent and
Chapter 13, C 3.
Heinz’s five-year trend reveals that although there is some variation, cost of prod-
Summary of operations
Cost of products sold
Interest expense
Sales
93.5 percent versus 121.4 percent). This trend had a positive impact on net income,
666
( + ) ÷ 2 ( + ) ÷ 2
==
( + ) ÷ 2 ( + ) ÷ 2
146.0Days Days
1.1 Times
331.8
==
Roche
4.9 Times
SF 9,755
SF 49,051
SF 10,461
Payables
turnover
5.5= $16,910
$3,061
SF 14,433
$1,751 SF 2,300
=
$50,009
$4,370
Receivable
turnover
Times 6.7 Times
SF 2,159
=
Days’ inventory
on hand
$8,888 + SF 14,615
Times
Pfizer
Times
4.2
$14,645 $8,958
Days =Days
365
2.5
-SF 182+$8,022
SF 2,017
Chapter 13, C 4.
365
667
tant than the fact that they come from different countries. The pharmaceutical in-
The fact that these companies are in the pharmaceutical industry is more impor-
Chapter 13, C 4. (Continued)
668
( + ) ÷ 2 ( + ) ÷ 2
Chapter 13, C 5.
Profitability and total asset management ratios and analysis of CVS (in millions)
All computations are for the years ended December 31, 2009, and December 31, 2008.
$98,729
Asset
turnover $98,729 =
2009
2008
=
$54,722
$61,301 1.6
Times
$61,641 $60,960 $60,960
$98,729
$87,472
1.5
=
$87,472
$57,841
=$87,472 Times
669
( + ) ÷ 2 ( + ) ÷ 2
$54,722
$3,947
$60,960$61,641
6.8%=
$57,841
$3,947
Chapter 13, C 5. (Continued)
Times
$3,696
1.1
$4,035
Liquidity ratios and analysis of CVS (in millions)
=
Times
$3,947
=
1.2
2008
Cash flow
yield
2009
$3,212
$60,960
=
$4,035
$4,035
$61,301
= 6.6%
Cash flows
to assets
=
670
( + ) ÷ 2 ( + ) ÷ 2
( + ) ÷ 2 ( + ) ÷ 2
++ +
$3,560 $3,801
$3,801
$3,593
2008
$87,472
$5,384 $4,580
2009
$98,729
Receivable
+$78,349
Chapter 13, C 5. (Continued)
Operating asset management ratios and analysis of CVS (in millions)
+$69,182
$5,384
$1,145
Payables
$1,190
$5,457
$78,349
$69,182
$1,086 $5 $5,457
$1,352 $5,384
Times $16,526 = 1.2 Times
$13,490
Current ratio $17,537 = 1.4
$12,300
671
++
=
2008
0.7 0.8
Debt to
equity
ratio
$35,768
Chapter 13, C 5. (Continued)
2009
Financial risk ratios and analysis of CVS (in millions)
$25,873 Times
= Times
$34,574
$26,386
Interest
$5,913 $5,537 11.9Times
$509$525
672
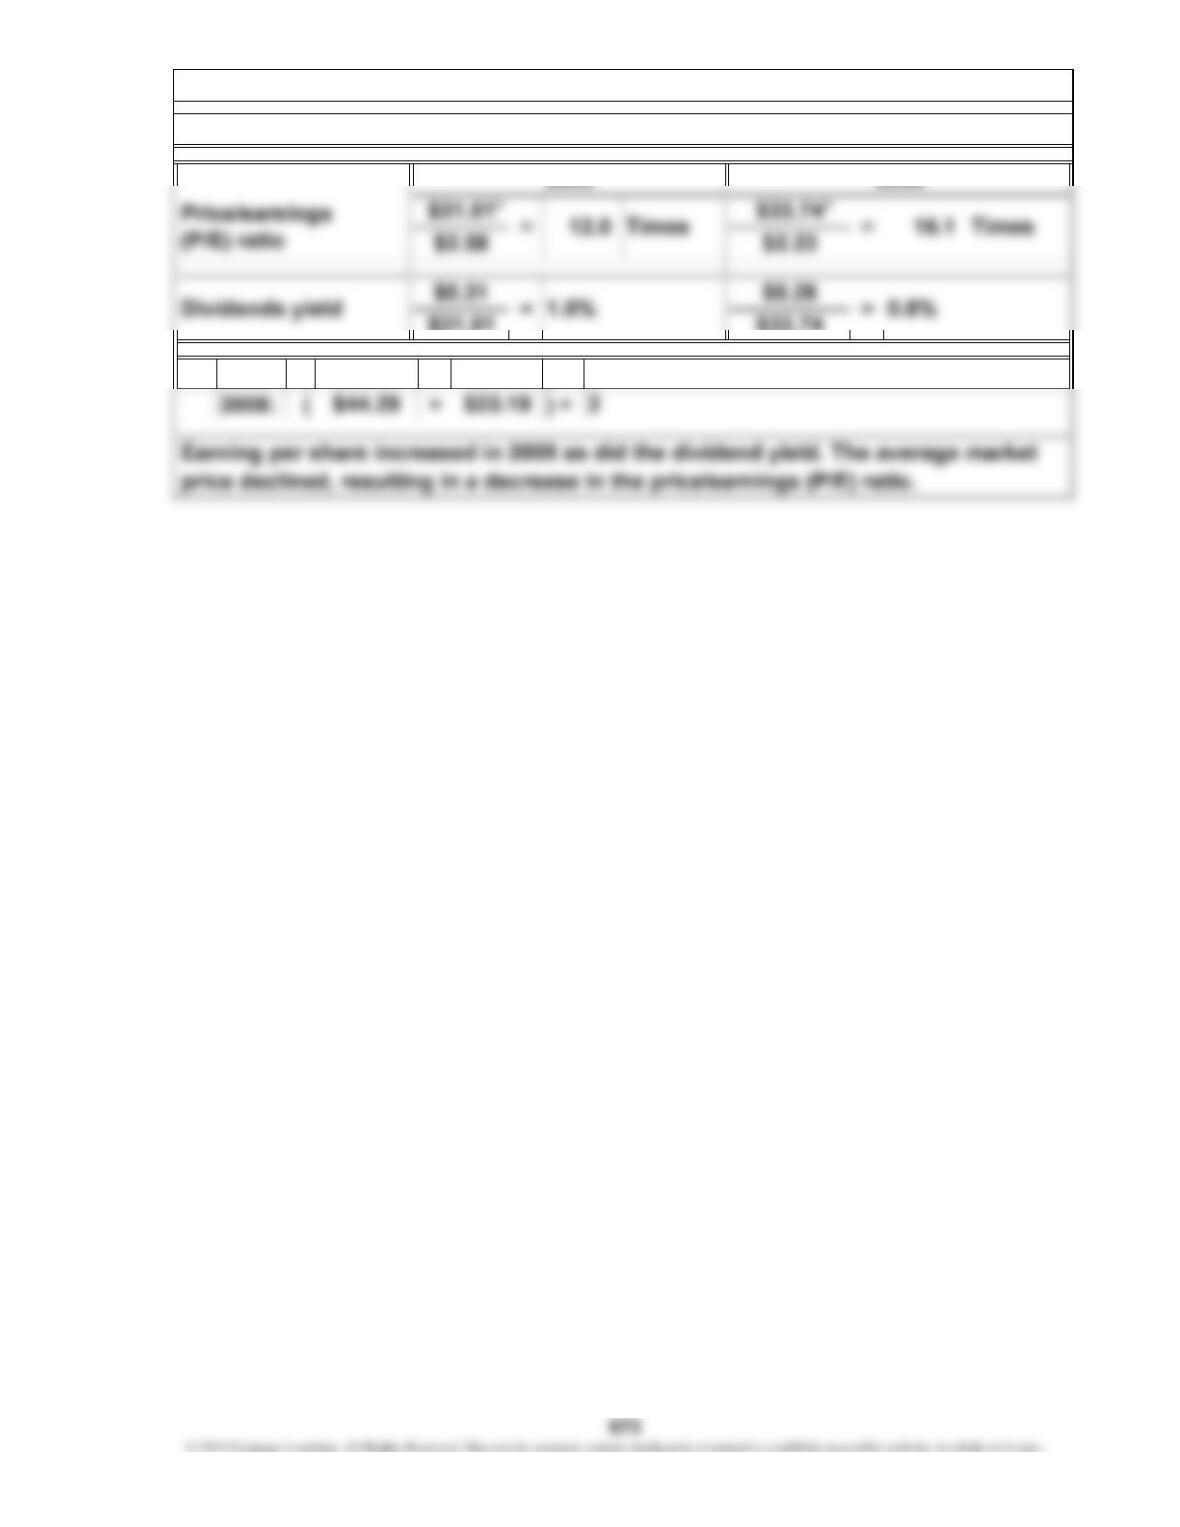
* 2009: ( + ) ÷
$31.01
Chapter 13, C 5. (Continued)
Market strength ratios and analysis of CVS
$33.74 =
$38.27 $23.74
2
Profit margin
Chapter 13, C 6.
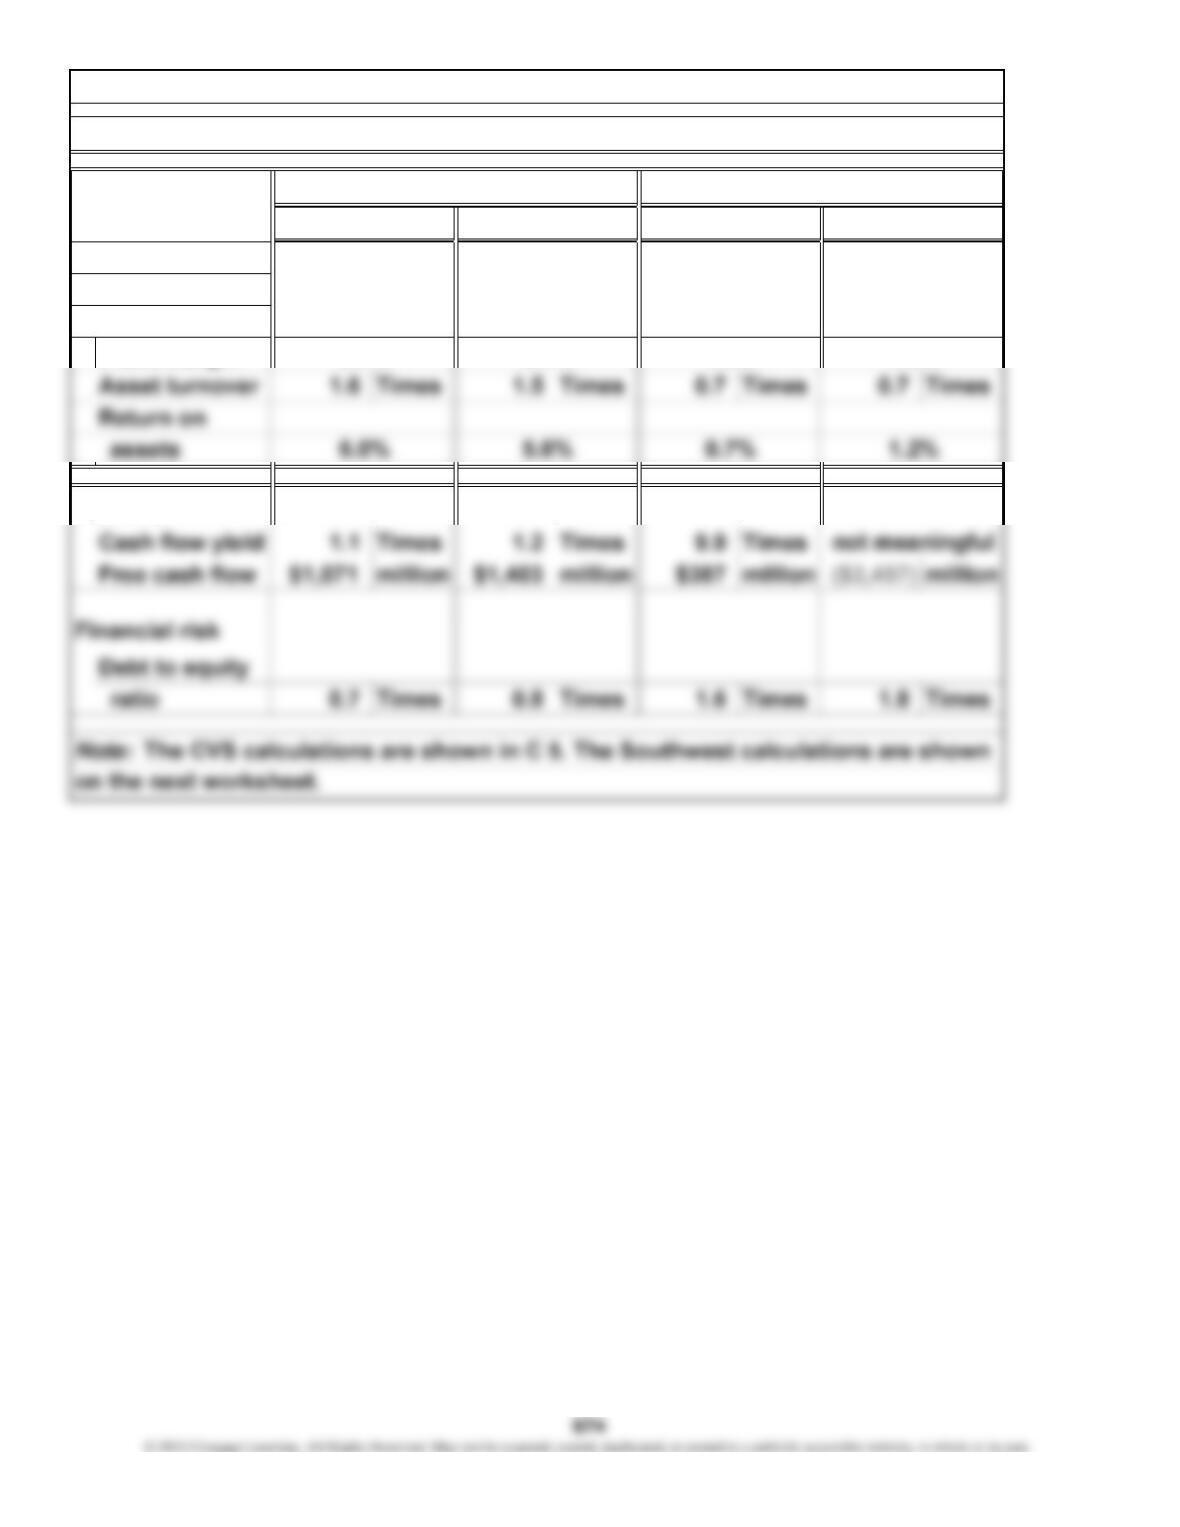
CVS and Southwest compared across key financial performance measures
CVS Southwest
2009 2008 2009
3.7% 3.7% 1.0%
2008
1.6%
Profitability and
total asset
management
Liquidity
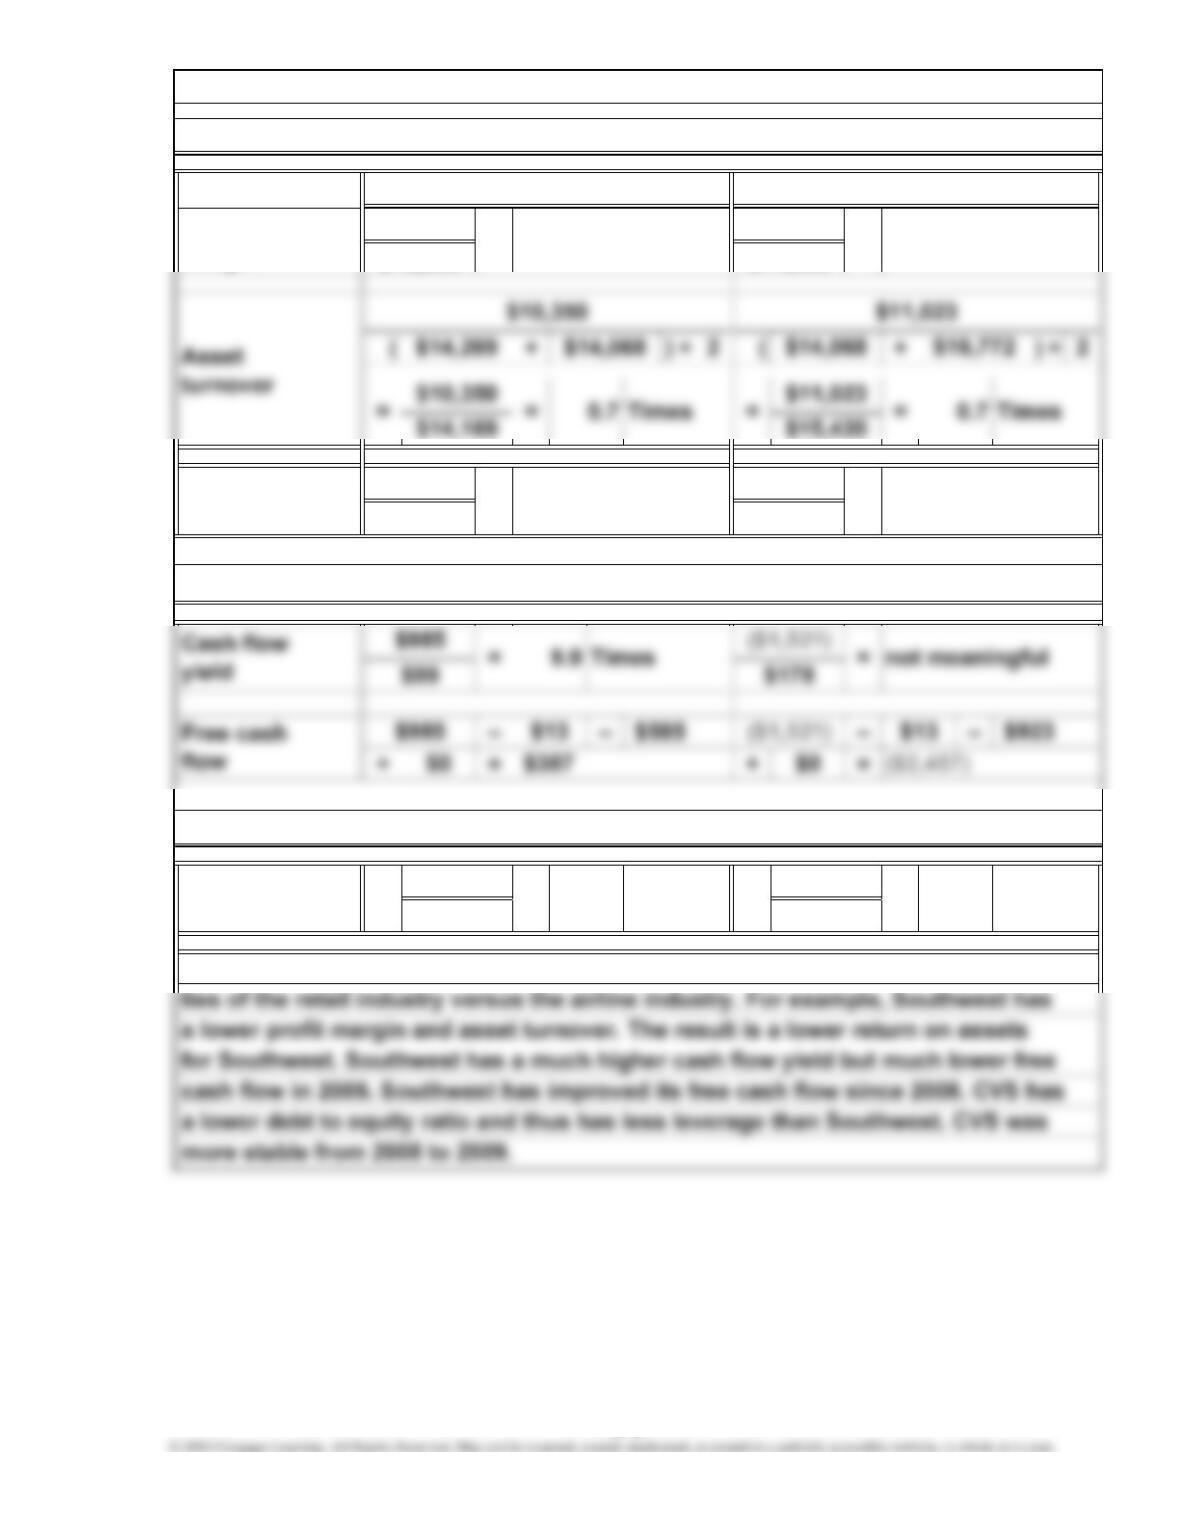
The analysis of CVS and Southwest shows some of the differences and similari-
$5,466 1.6 $9,115
$4,953
Times
$8,803
Financial risk ratio of Southwest (in millions)
Liquidity ratios of Southwest (in millions)
Return on
assets =
1.2%
1.6%
Chapter 13, C 6. (Continued)
Profit
margin =
$178
1.0%
Profitability and total asset management ratios of Southwest (in millions)
$11,023
$99
$10,350 =
0.7%
2008
1.8= = Times
2009
$99
$14,169 $15,420 =
$178
=
Debt to
equity ratio =
675
100.0% 100.0%
36.0% 40.0%
Gross margin 64.0% 60.0%
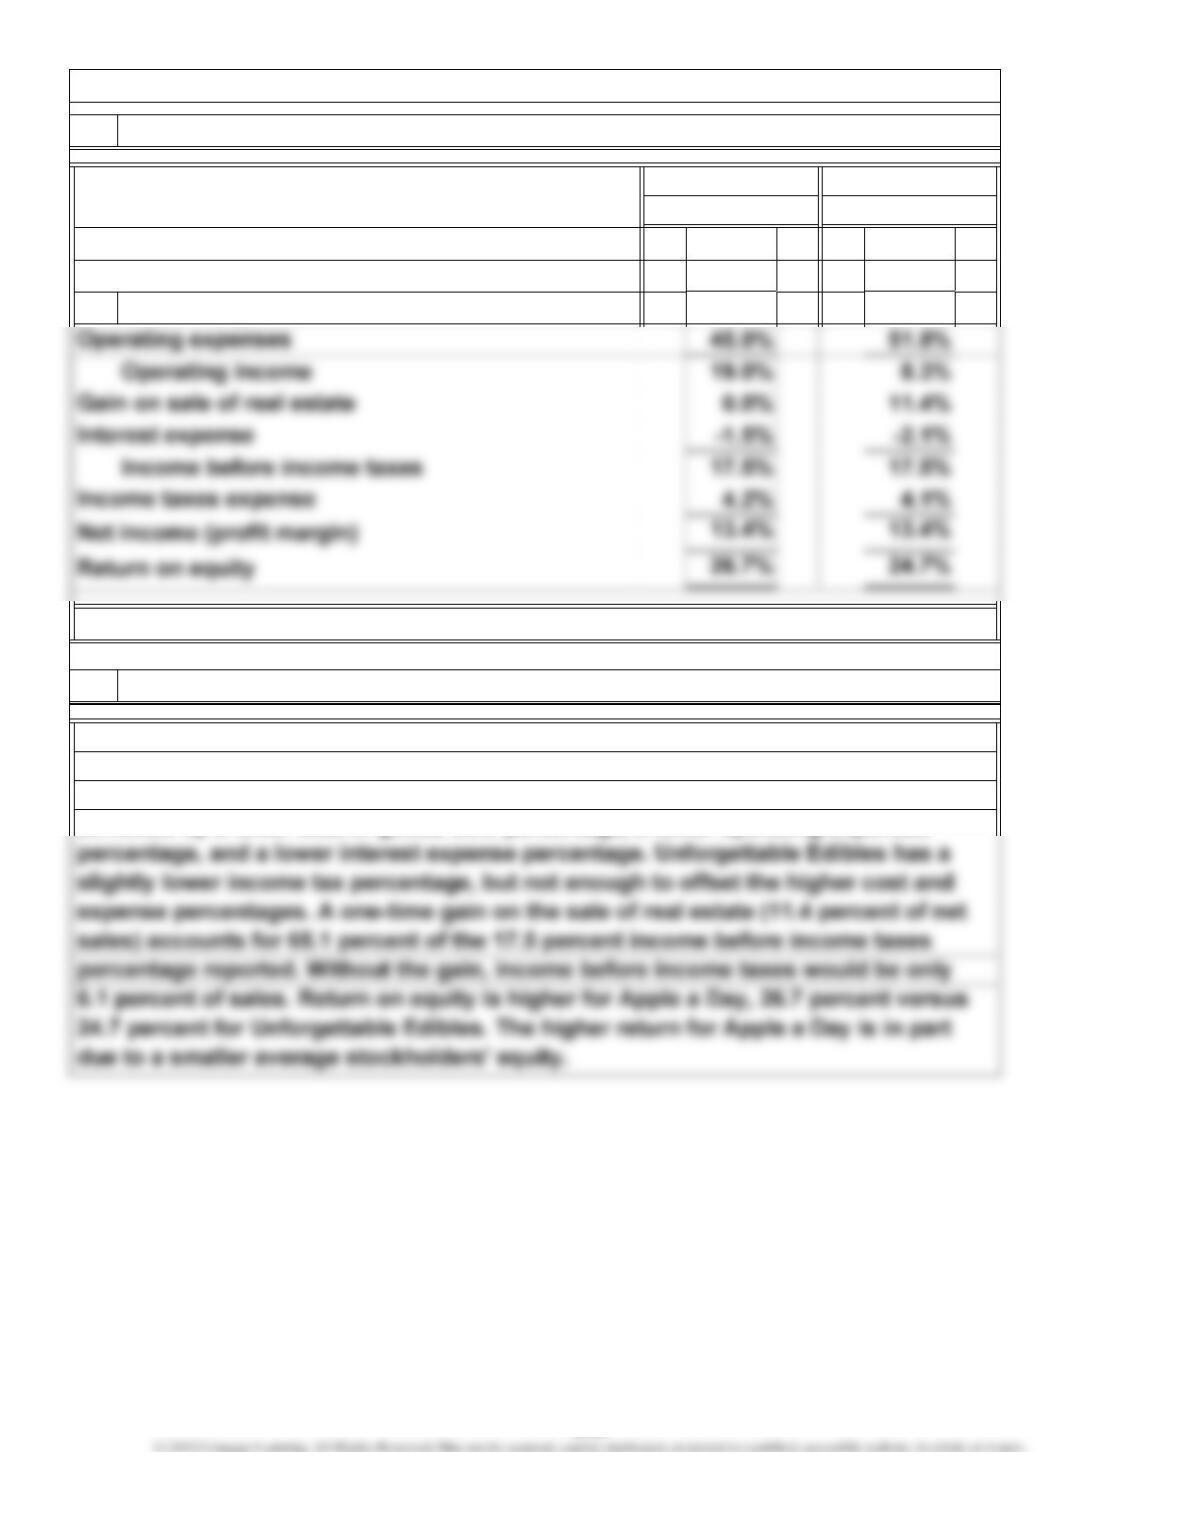
income statement reveals that Apple a Day has a lower cost structure overall, as
exhibited by a lower cost of goods sold percentage, a lower operating expenses
It is true that both firms have comparable profit margins. Both Apple a Day and Un-
forgettable Edibles earned 13.4 percent profit margins. However, the common-size
2. Results discussed
Net sales
Cost of goods sold
Apple a Day*
Unforgettable
Edibles*
1. Common-size income statements, profit margin, and return on equity
*Additions and subtractions of percentages are inexact due to rounding.
Chapter 13, C 7.
676
through use of a one-time gain rather than by excellent management of the catering
special items, the managers at Unforgettable Edibles might have earned a bonus
Chapter 13, C 7. (Continued)
Unless the actual profit margin and return on equity are adjusted for one-time
677