Financial and Managerial Accounting, 8e
13–1
CHAPTER 13
ANALYSIS OF FINANCIAL STATEMENTS
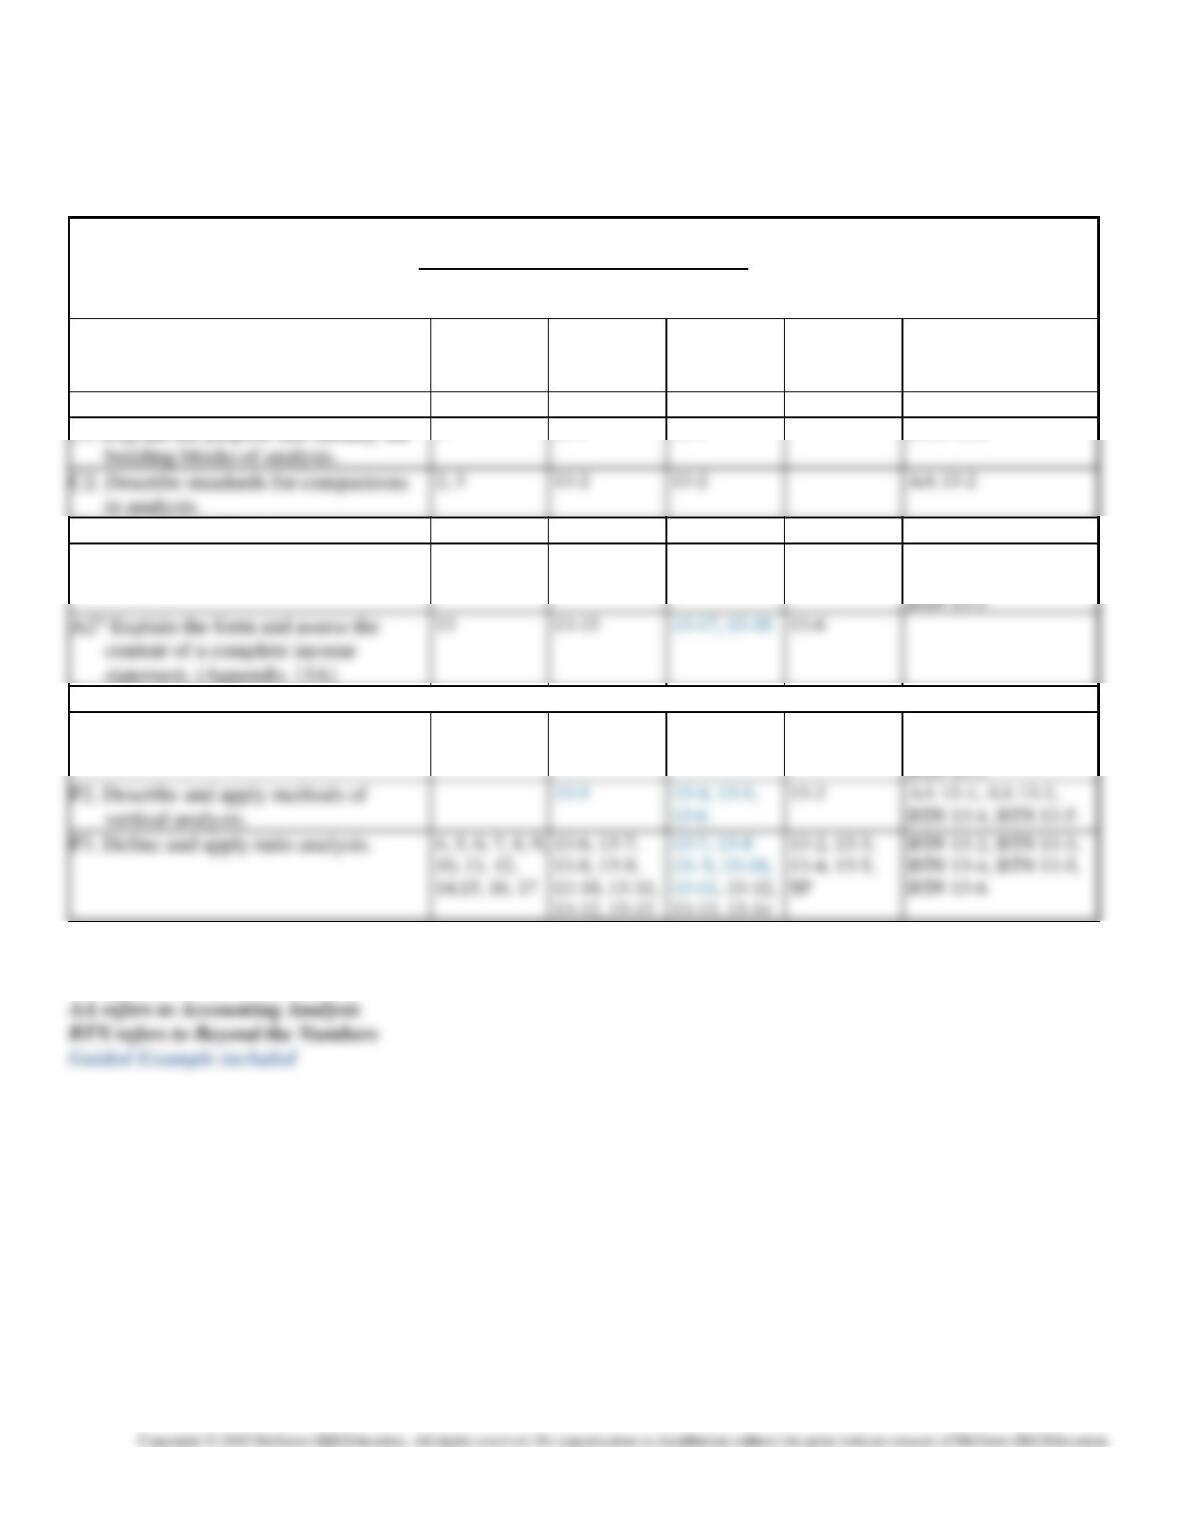
Related Assignment Materials
Student Learning Objectives
Questions
Quick
Studies*
Exercises*
Problems*
AA and
BTN
Conceptual objectives:
2, 3
13-2
13-2
AA 13-2
C1. Explain the purpose and identify the
1
13-1
13-1
BTN 13-6
Analytical objectives:
A1 Summarize and report results of
analysis.
13
13-14
13-15
AA 13-1, AA 13-3,
BTN 13-1, BTN 13-2,
Procedural objectives:
P1. Explain and apply methods of
horizontal analysis.
13-3, 13-4
13-3, 13-5
13-1, 13-2
13-2
AA 13-1, AA 13-2,
14,15, 16, 17
13-10, 13-11,
BTN 13-6
AA 13-1,
BTN 13-4,
*See additional information on next page that pertains to these quick studies, exercises and problems.
SP refers to the Serial Problem
Horizontal Analysis
2:05
Computation of Dollar Changes
1:22
Computation of Percent Changes
0:45
Trend Analysis – Part 1
1:07
Trend Analysis – Part 2
0:37
P2
Describe and apply methods of vertical analysis.
Vertical Analysis
0:37
Financial and Managerial Accounting, 8e
Additional Information on Related Assignment Material
See Chapter 1 of the Instructor’s Resource Manual for more information on materials for this text available in
Connect.
Connect
Available on the instructor’s course-specific website, Connect:
• All numerical Quick Studies, all Exercises and Problems Set A.
Hints/Guided Examples
Please note that the Guided Examples are labeled as “Hints” in Connect assignments. The animated PowerPoints without
Need-to-Know Videos
LO
Need–to-Know
Title
Time
P1
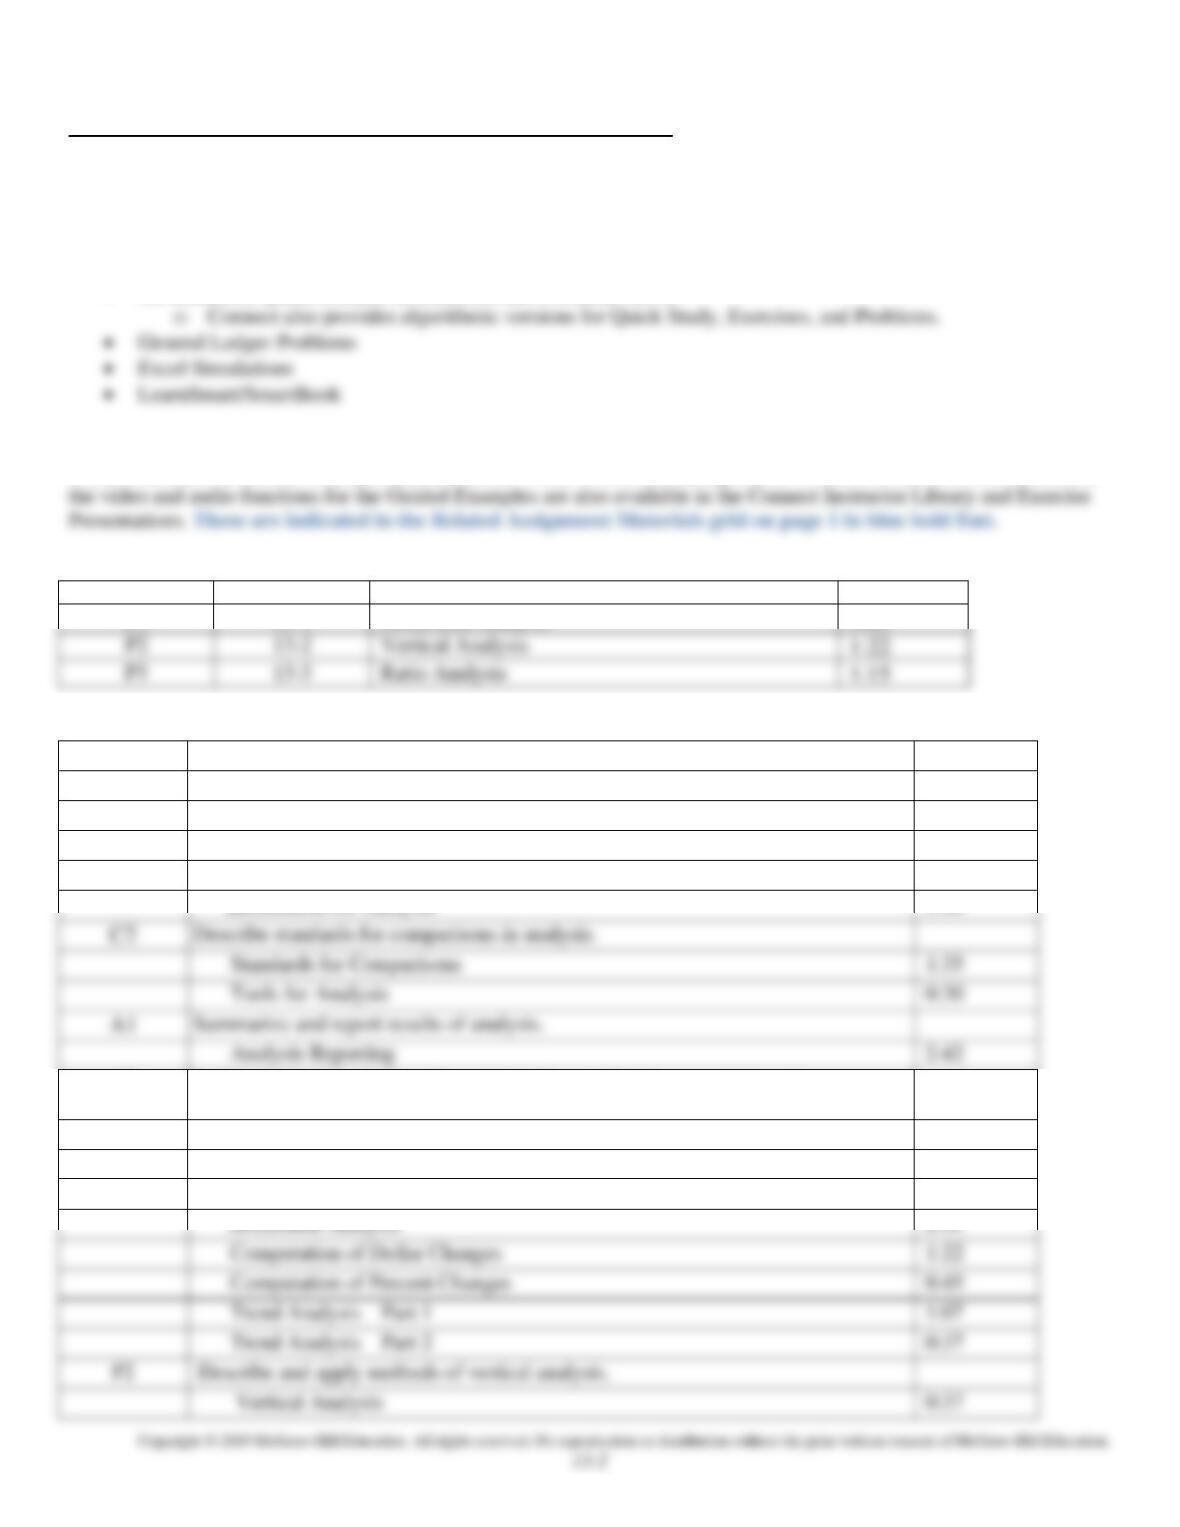
13-1
Horizontal Analysis
2:03
P2
13-2
Vertical Analysis
1:22
P3
13-3
Ratio Analysis
1:15
Concept Overview Videos
LO
Title
Time
C1
Explain the purpose and identify the building blocks of analysis.
Financial Statement Analysis
0:35
Purpose of Analysis
1:08
Building Blocks of Analysis
1:27
1:35
0:30
Analysis Reporting
2:42
Information for Analysis
1:00
A2
Explain the form and assess the content of a complete income statement.
(Appendix 13A)
Complete Income Statement
3:34
Changes in Accounting Principles
1:25
P1
Explain and apply methods of horizontal analysis.
Financial and Managerial Accounting, 8e
13–3
Common-Size Statements
1:30
Computation of Common-Size Percent
0:24
Common-Size Graphics
0:29
P3
Define and apply ratio analysis.
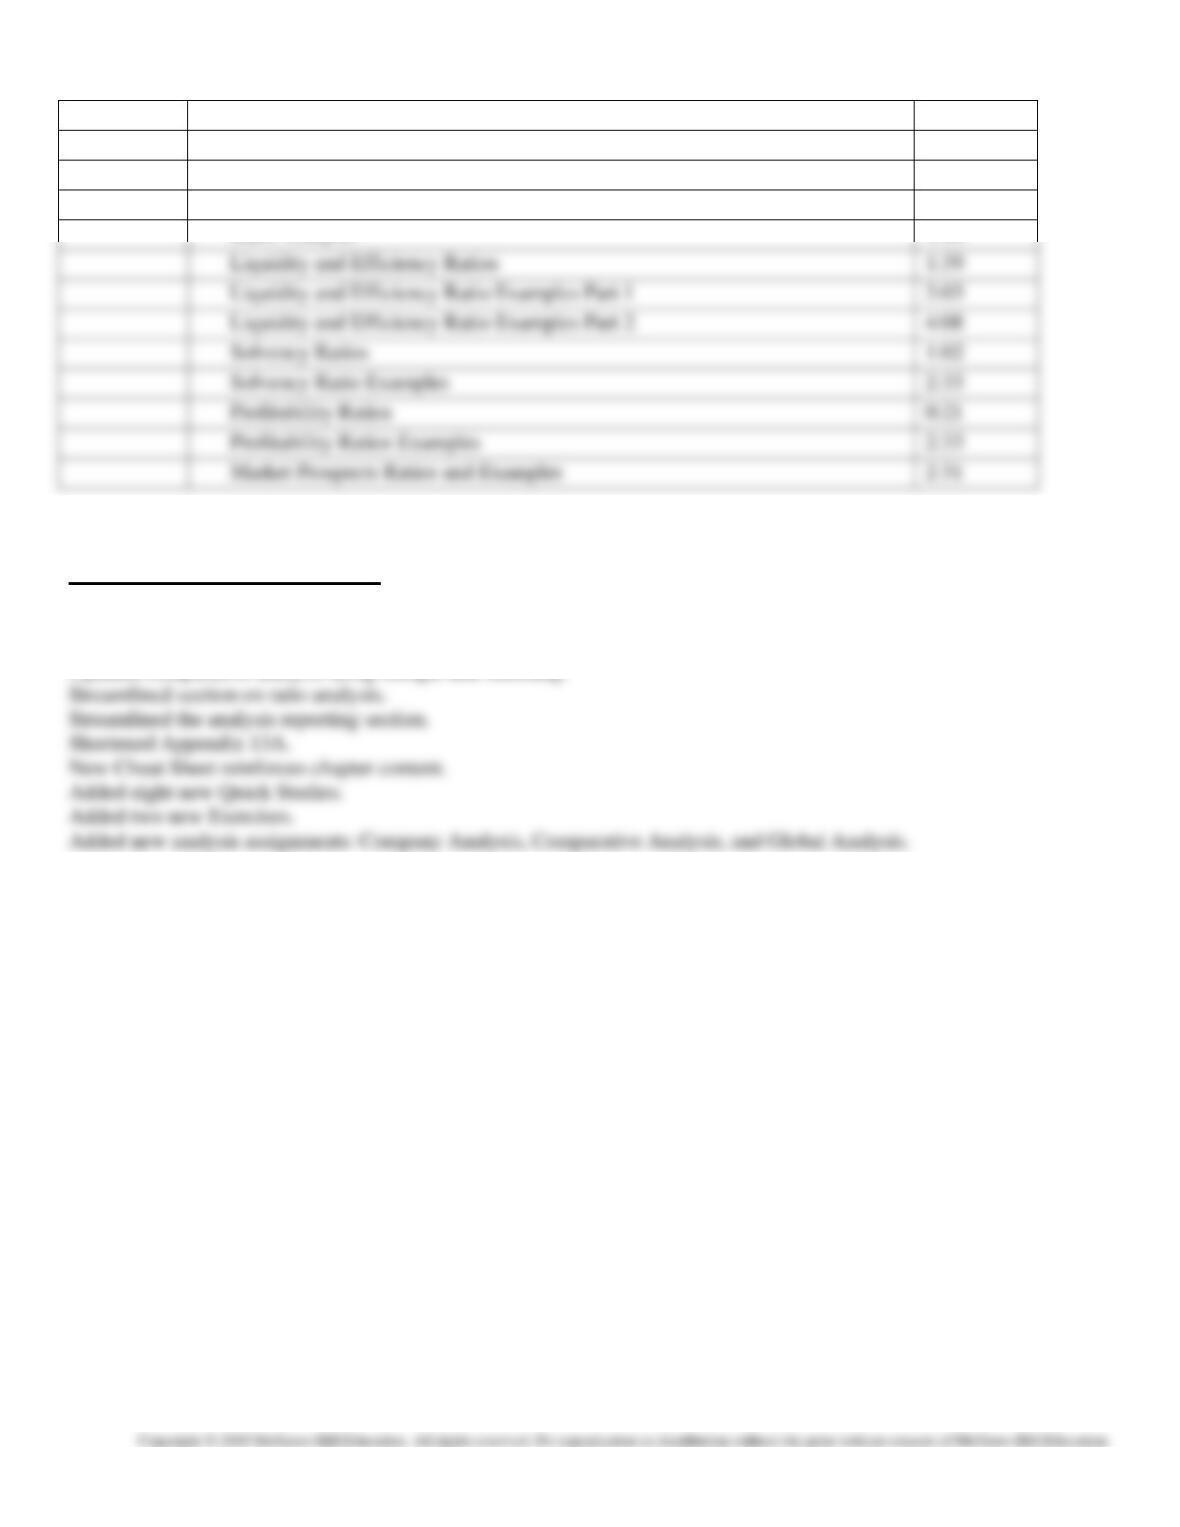
Ratio Analysis
1:44
Liquidity and Efficiency Ratios
1:39
Liquidity and Efficiency Ratio Examples Part 1
3:03
Liquidity and Efficiency Ratio Examples Part 2
4:08
Solvency Ratios
1:02
Solvency Ratio Examples
2:33
Profitability Ratios
0:21
Profitability Ratios Examples
2:33
Market Prospects Ratios and Examples
2:31
Synopsis of Chapter Revisions
Updated opener—Morgan Stanley and entrepreneurial assignment.
Updated data for all analyses of Apple using horizontal, vertical, and ratio analysis.
Updated comparative analysis using Google and Samsung.
Financial and Managerial Accounting, 8e
Chapter Outline
I. Basics of Analysis—Transforming data into useful information.
A. Purpose of Analysis
To help users (both internal and external) make better business decisions.
make informed decisions in pursuing their own goals.
1. Internal users (managers, officers, internal auditors, consultants, budget officers, and market
researchers) make the strategic and operating decisions of a company. Purposes for these users
B. Building Blocks of Analysis
The four areas of inquiry or building blocks are:
2. Solvency—ability to generate future revenues and meet long-term obligations.
4. Market prospects—ability to generate positive market expectations.
C. Information for Analysis
Most users conduct analysis using general purpose financial statements that include:
6. Other useful financial data—10K/other SEC filings, news releases, shareholders’ meetings,
1. Income statement
2. Balance sheet
D. Standards for Comparisons
We need standards (benchmarks) can include the following types of comparisons:
4. Guidelines (rules-of-thumb)—standards of comparisons developed from experience.
1. Intracompany—based on prior performance and relations between its financial items.
E. Tools of Analysis
3. Ratio analysis
1. Horizontal analysis
II. Horizontal Analysis—Tool to evaluate changes in financial statement data across time. This analysis
utilizes:
A. Comparative Statements
1. Reports where financial amounts for more than one period are placed side by side in columns on
a single statement.
Financial and Managerial Accounting, 8e
13–5
2. Dollar changes and percentage changes—usually shown in line items.
a. Dollar change = Analysis period amount minus Base period amount.
3. Comparative Balance Sheets—balance sheets from two or more periods arranged side-by-side.
Dollar and percentage changes are often shown. Analysis focuses on large changes.
4. Comparative Income Statements—also compares two or more periods presented side-by side
with dollar and percentage changes.
B. Trend analysis (also called trend percent analysis or index number trend analysis)
3. Often aided by graphical depiction.
1. A form of horizontal analysis used to reveal patterns in data across successive periods.
III. Vertical Analysis—(also called common-size analysis) Comparing financial condition and performance
to a base amount. The analysis tools include:
A. Common-Size Statements—reveal changes in the relative importance of each financial statement
item by redefining each in terms of common-size percents.
3. Common-size percentage equals (Analysis amount divided by Base amounts) multiplied by 100.
comparison information.
B. Common-Size Graphics
IV. Ratio Analysis—widely used in financial analysis because they help to uncover conditions and trends
difficult to detect by inspecting individual amounts. Ratios are organized into the four (A to D below)
building blocks of analysis:
A. Liquidity and Efficiency
1. Liquidity refers to the availability of resources to meet short-term cash requirements.
3. Ratios in this block:
a. Working capital—the excess of current assets less current liabilities.
Financial and Managerial Accounting, 8e
13–6
d. Accounts receivable turnover—net sales or credit sales divided by average accounts
receivable; a measure of how long it takes a company to collect its accounts.
B. Solvency
stockholders.
1. Solvency refers to a company’s long-run financial viability and its ability to cover long-term
obligations. Capital structure is one of the most important components of solvency analysis.
2. Capital structure refers to a company’s sources of financing.
C. Profitability
1. Profitability refers to a company’s ability to generate an adequate return on invested capital.
2. Return is judged by assessing earnings relative to the level and sources of financing.
3. Profitability is also relevant to solvency.
D. Market Prospects
3. Ratios in this block:
1. Market measures are useful for analyzing corporations with publicly traded stock.
E. Summary of Ratios
Exhibit 13.16 in the text sets forth the names of each of the common ratios by category, and includes
Financial and Managerial Accounting, 8e
13–7
the formula and a description of what is measured by each ratio.
V. Decision Analysis—Analysis Reporting
5. Key factors
Goal of financial statement analysis report is to reduce uncertainty through rigorous and sound
evaluation. A good analysis report usually consists of six sections:
1. Executive summary
VI. Sustainable Income—Appendix 13A
When a revenue and expense transactions are from normal, continuing operations, a simple income
statement is adequate. When activities include events that are not normal, it must disclose this
information by separating the income statement into different sections as follows (A-D):
B. Discontinued Segments
1. A business segment is a part of a company’s operations that serves a particular line of business or
C. Earnings per Share –
1. Final section of income statement
2. Reported for both continuing operations and discontinued segments (where both exist).
D. Changes in Accounting Principles
1. The consistency principle directs a company to apply the same accounting principle across
Financial and Managerial Accounting, 8e
13–8
Chapter 13 Alternate Demonstration Problem
Following are data from the statements of two companies selling similar products:
Current Year-End Balance Sheets
Sled
Company
Zip
Company
Cash ………………………………………………………………
$ 11,900
$ 20,000
Notes receivable—short-term …………………………
7,700
3,200
Accounts receivable, net ………………………………..
42,000
64,000
58,800
87,680
Total assets ……………………………………………………
$354,200
$452,800
Current liabilities ……………………………………………
$ 56,000
$ 80,000
Mortgage payable …………………………………………..
70,000
80,000
Common stock, $10 par value …………………………
140,000
160,000
Retained earnings ………………………………………….
$354,200
$452,800
Data from the Current Year’s Income Statement
Sales ……………………………………………………………..
$672,000
$880,000
Cost of goods sold …………………………………………
528,080
699,840
4,200
5,600
Net income …………………………………………………….
23,373
28,896
$ 85,120
Total assets ……………………………………………………
345,800
443,200
217,000
285,120
Required:
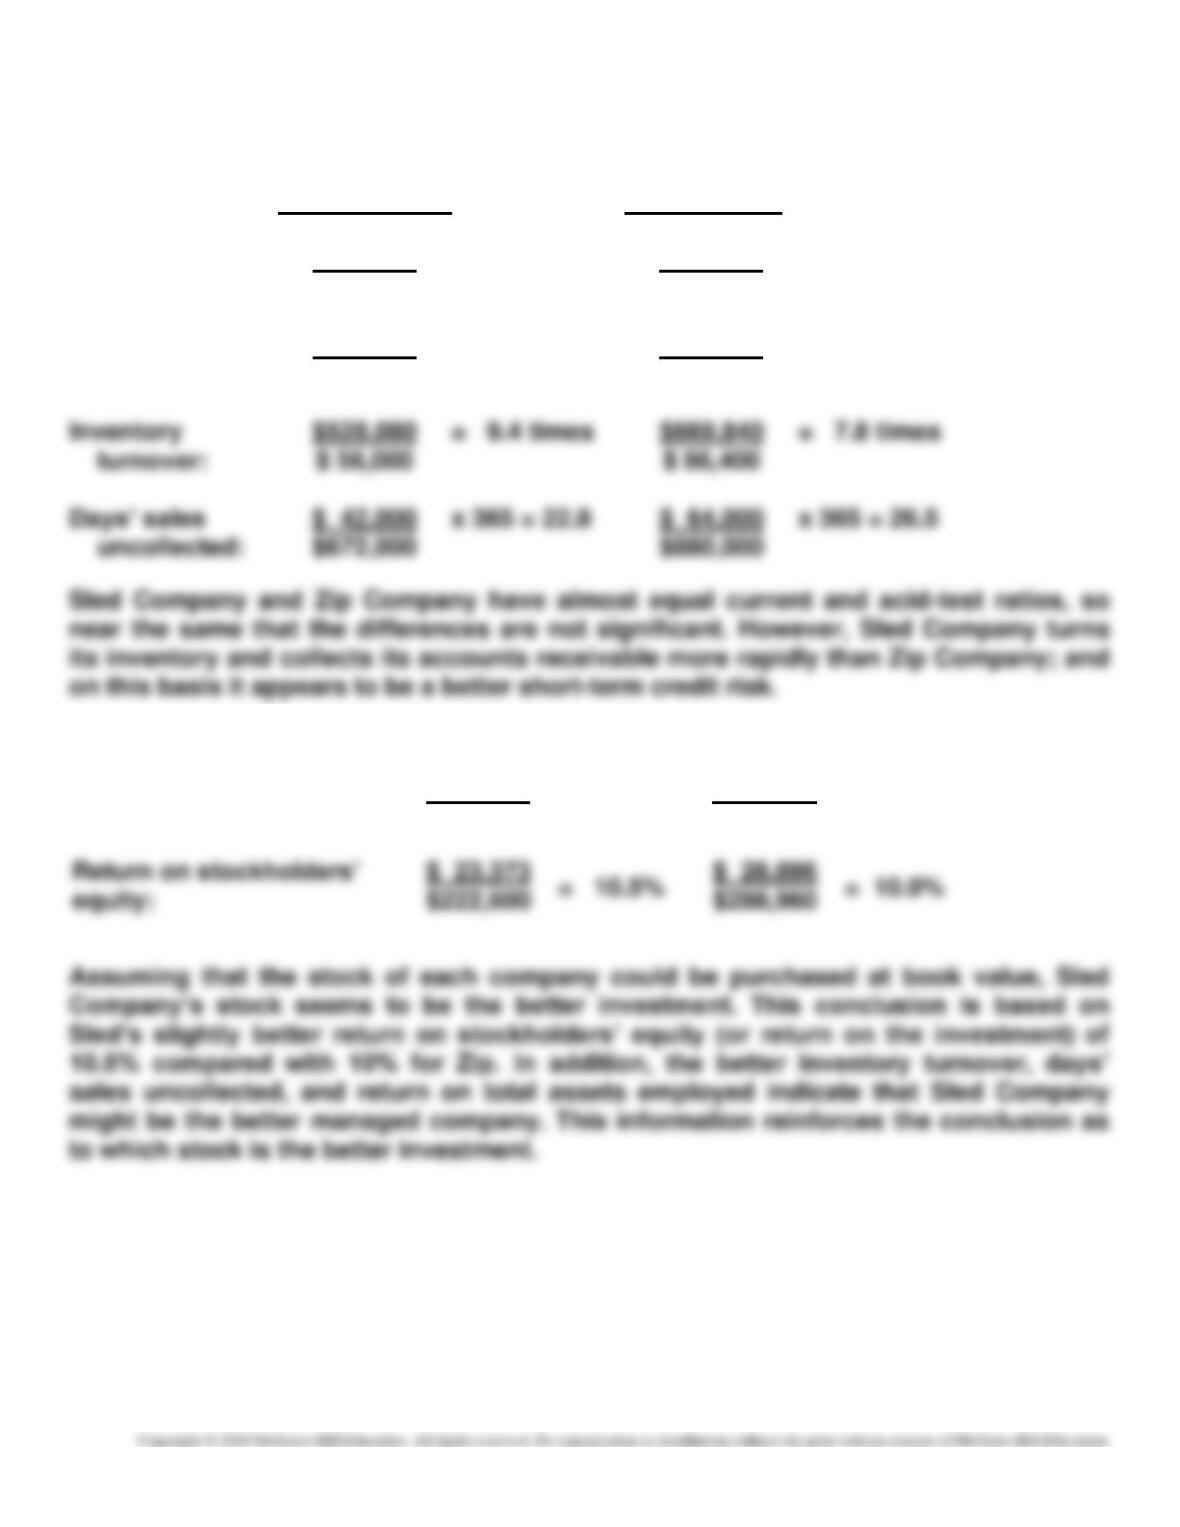
1. Calculate current ratios, acid–test ratios, inventory turnovers, and days’ sales
2. Calculate return on total assets employed and return on stockholders’ equity. Then,
Financial and Managerial Accounting, 8e
13–9
Solution: Chapter 13 Alternate Demonstration Problem
Part 1
Sled Company
Zip Company
Current ratio:
$122,080
$ 56,000
= 2.18 to 1
$178,400
$ 80,000
= 2.23 to 1
Acid-test ratio:
$ 61,600
$ 56,000
= 1.10 to 1
$ 87,200
$ 80,000
= 1.09 to 1
$ 42,000
$ 64,000
Part 2
Return on total assets:
$ 23,373
$350,000
= 6.68%
$ 28,896
$448,000
= 6.45%
$ 23,373
$222,600
= 10.5%
$ 28,896
$288,960
= 10.0%