+$0 + $0
++
++ + +
++ + +
$552,800
= 2.8 Times
$1,520,400
$629,800 $54,400
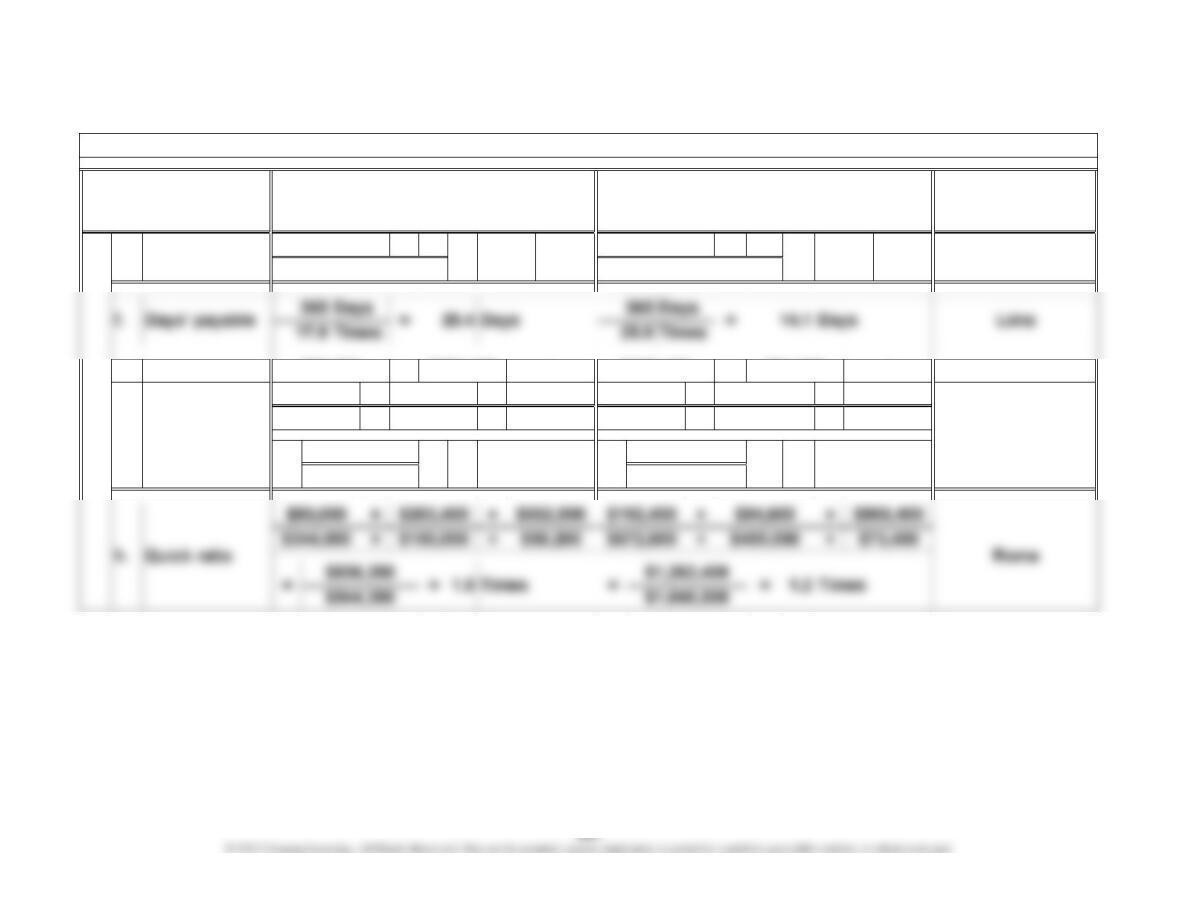
e. Payables
turnover
Chapter 13, P 5. (Continued)
Ratio Name Roma Lima
6. Company with
More Favorable
Ratio
$6,142,000 $14,834,000
$80,000 $203,400 +
$344,000 $50,200
Lima
$192,400 $84,600 +
$572,600 $73,400
$985,400
Roma
$150,000 $400,000
$1,253,400 $114,000
=
Times
$544,200 $1,046,000
=$2,629,800 = 2.5
$344,000 = 17.9 Times = 25.9 Times
$572,600
g. Current ratio
6. Company
with More
Favorable
Ratio
Roma Lima
=
$4.31
$76.00 Times=
Chapter 13, P 5. (Continued)
5.
Ratio Name
7.5
$10.19 Roma
a.
Price/
earnings
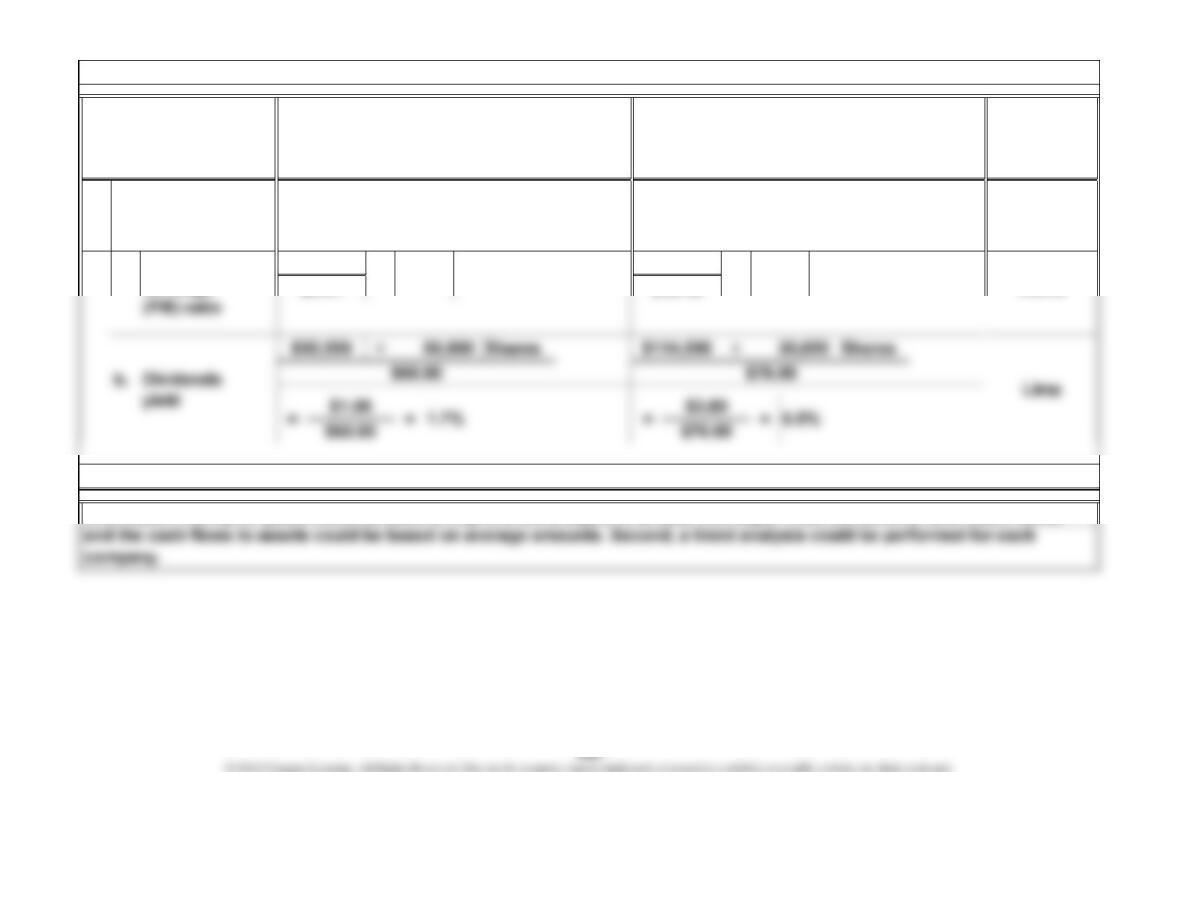
7. Use of information from prior years
Information from prior years could be used to improve the analysis in at least two ways. First, the turnover and return ratios
Market
strength
analysis
13.9 Times
$60.00
$450,000
$357,600
$ 70,000
$450,000
$118,450
Income Statement Using LIFO
and Double-Declining-Balance Methods
Less ending inventory
Income Statement Using FIFO
and Straight-Line Methods
Goods available for sale
Net sales
Cost of goods sold
Net sales
Salaries expense
For the Year Ended December 31, 2012
Cost of goods sold
Gross margin
Operating expenses
Chapter 13, P 6.
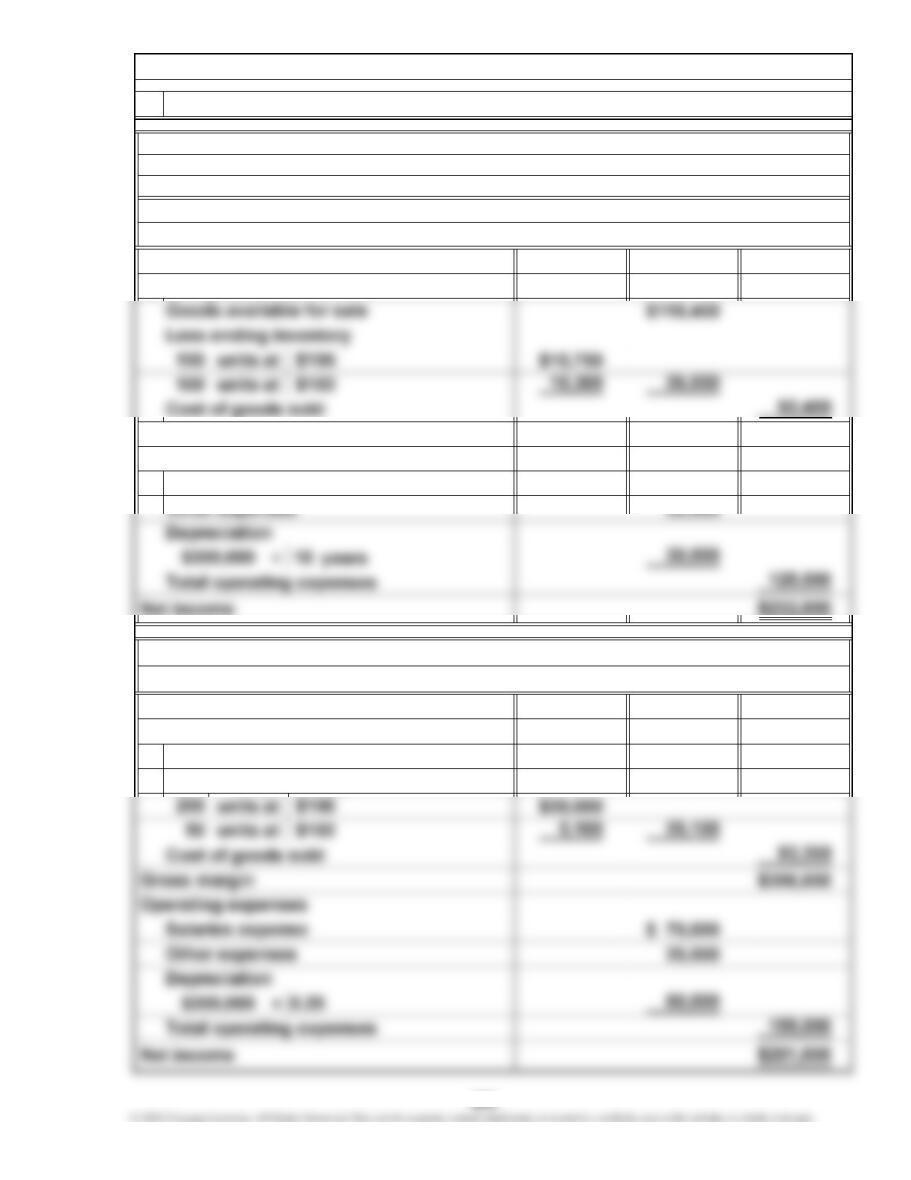
1. Alternative income statements prepared
Zeigler Corporation
Alternative Income Statements
$92,400 $93,350
FIFO Method
=
LIFO Method
Net income using FIFO and straight-line methods
balance methods
Inventory Turnover
201,650
$232,600
User insight: Inventory turnover computed and discussed
Difference in net income
Net income using LIFO and double-declining-
Zeigler Corporation
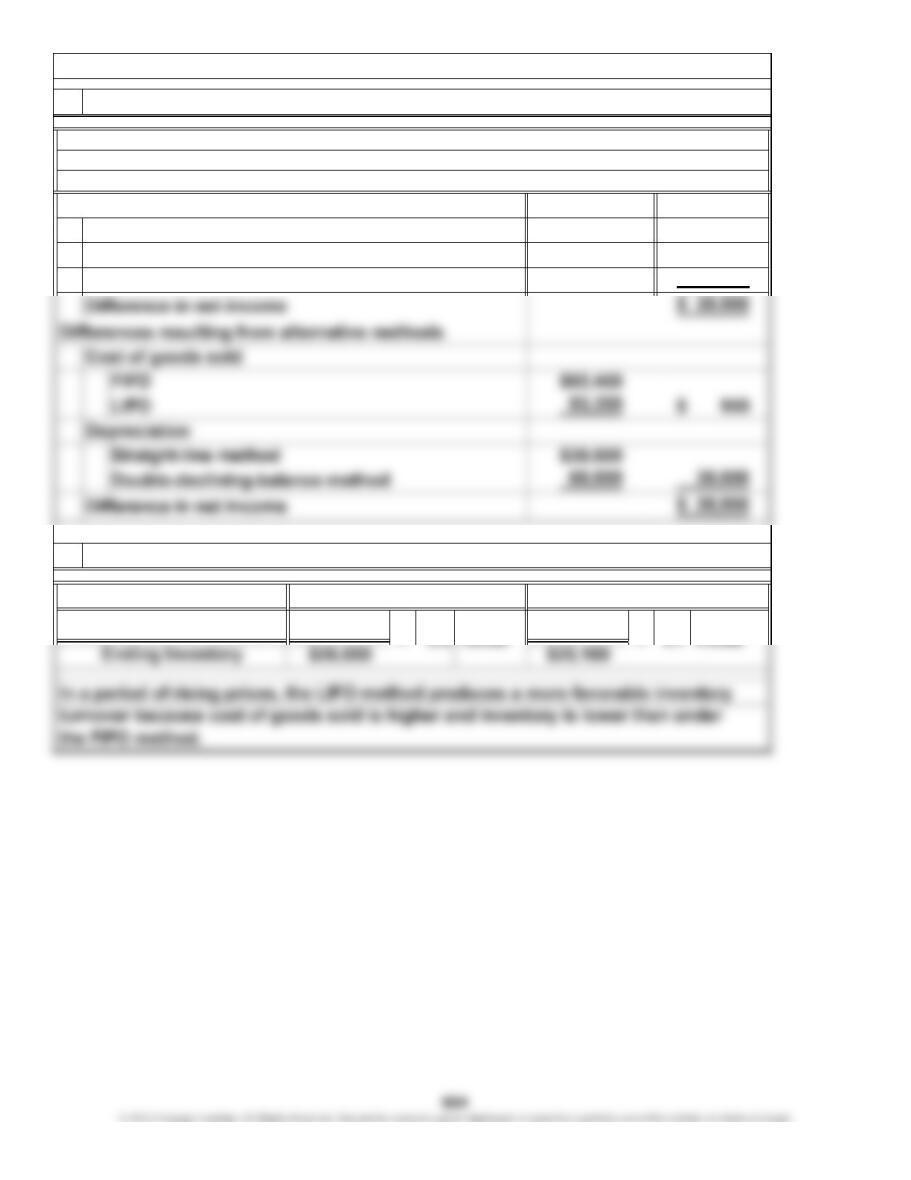
Schedule of Differences in Net Income
For the Year Ended December 31, 2012
Chapter 13, P 6. (Continued)
2. Schedule prepared
3.
Cost of Goods Sold 3.7Times3.5 = Times
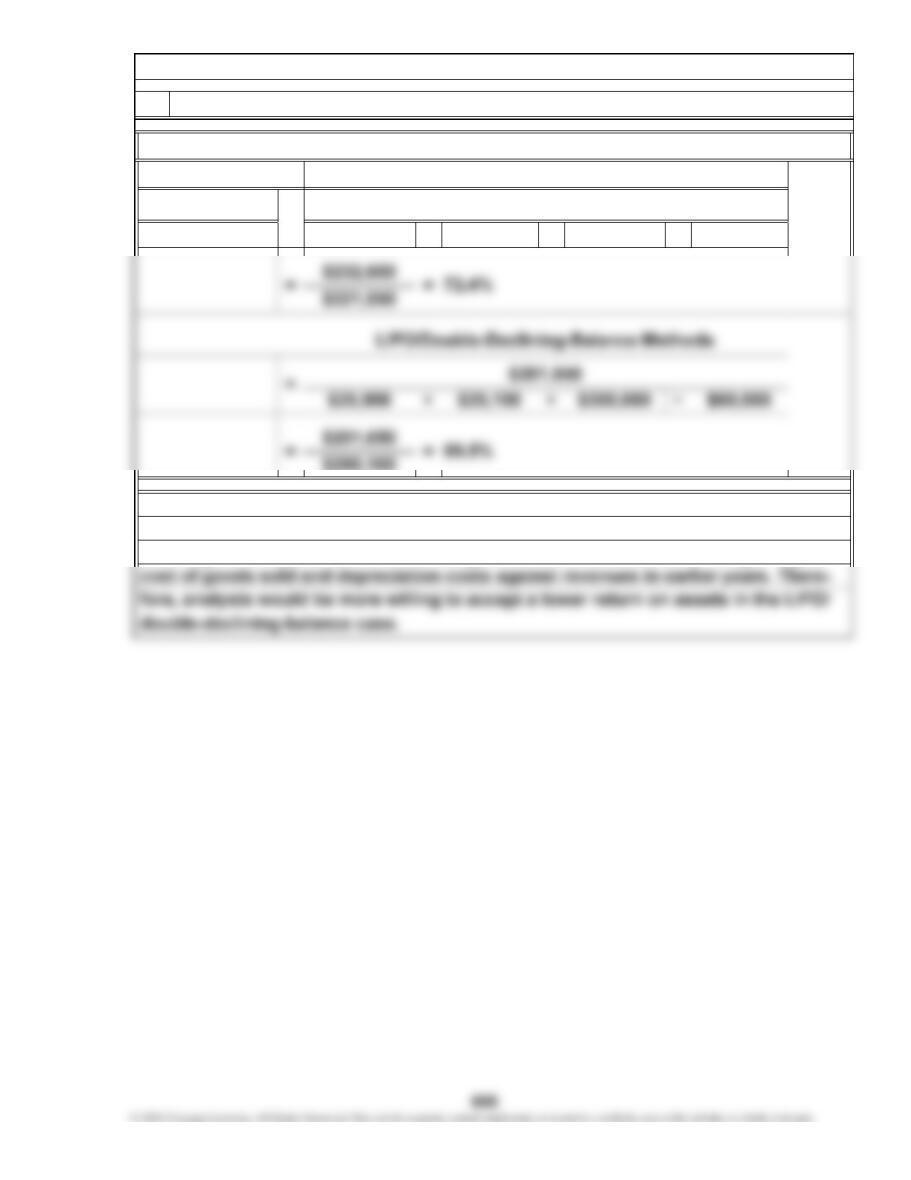
$25,000 + $26,050 + $300,000 −$30,000
$290,100
The LIFO and double-declining-balance methods produce a lower return on assets.
This combination of accounting methods produces a more conservative net in-
FIFO/Straight-Line Methods
=
Net Income
Total Assets
$232,600
come figure compared to the FIFO/straight-line methods because it charges higher
Chapter 13, P 6. (Continued)
4. User insight: Return on assets computed and discussed
Return on Assets

Ratio Increase Decrease None
a. Issued common stock
for cash. Asset turnover x
b. Declared cash dividend. Current ratio x
c. Sold treasury stock. Return on equity x
d. Borrowed cash by issuing
note payable. Debt to equity ratio x
e. Paid salaries expense. Inventory turnover x
f. Purchased merchandise
Transaction
Effect
Chapter 13, P 7.
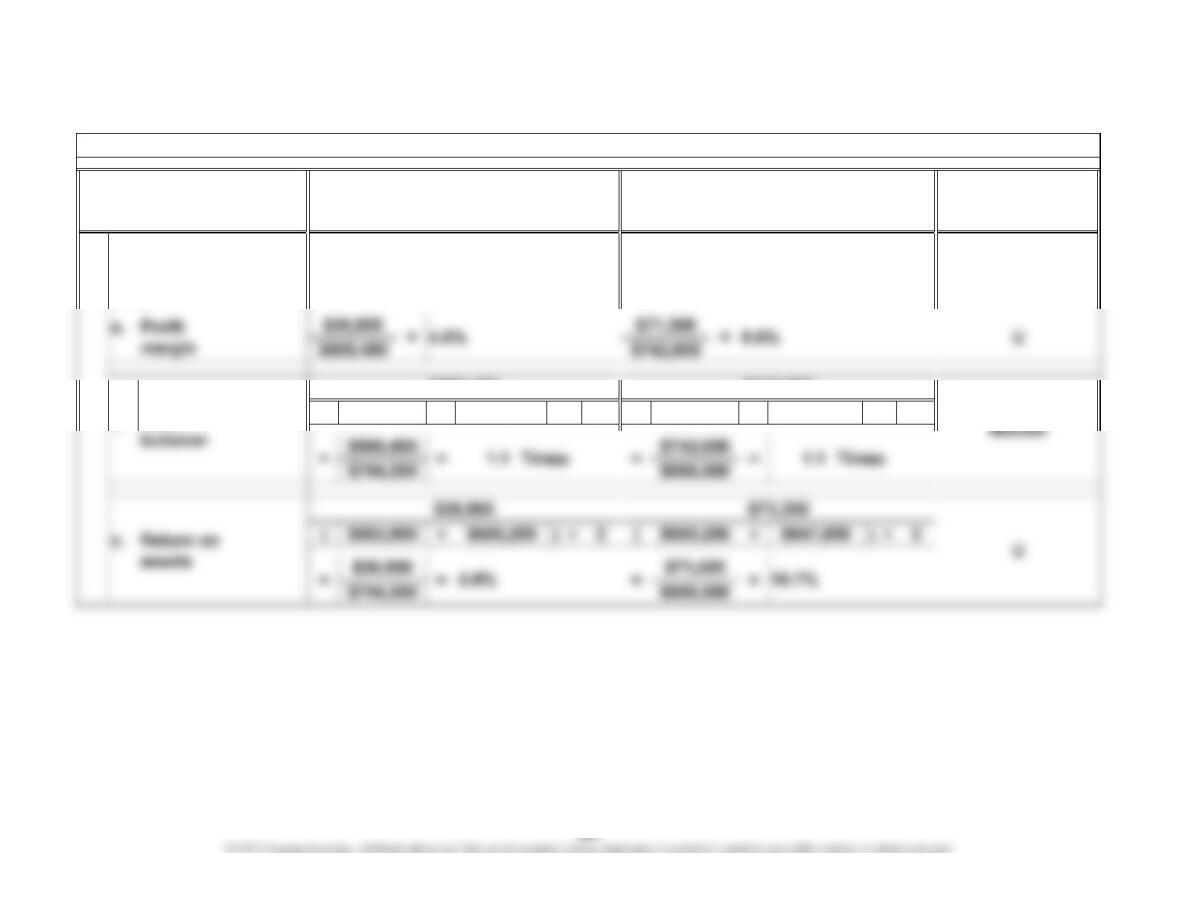
( + ) ÷ 2 ( + ) ÷ 2
$685,200
2012 2011
Asset
$803,900
b. $685,200
$800,400
6. Favorable (F) or
Unfavorable (U)
Change
$647,800
Chapter 13, P 8.
$742,600
Ratio Name
1. Profitability and total
asset management
analysis
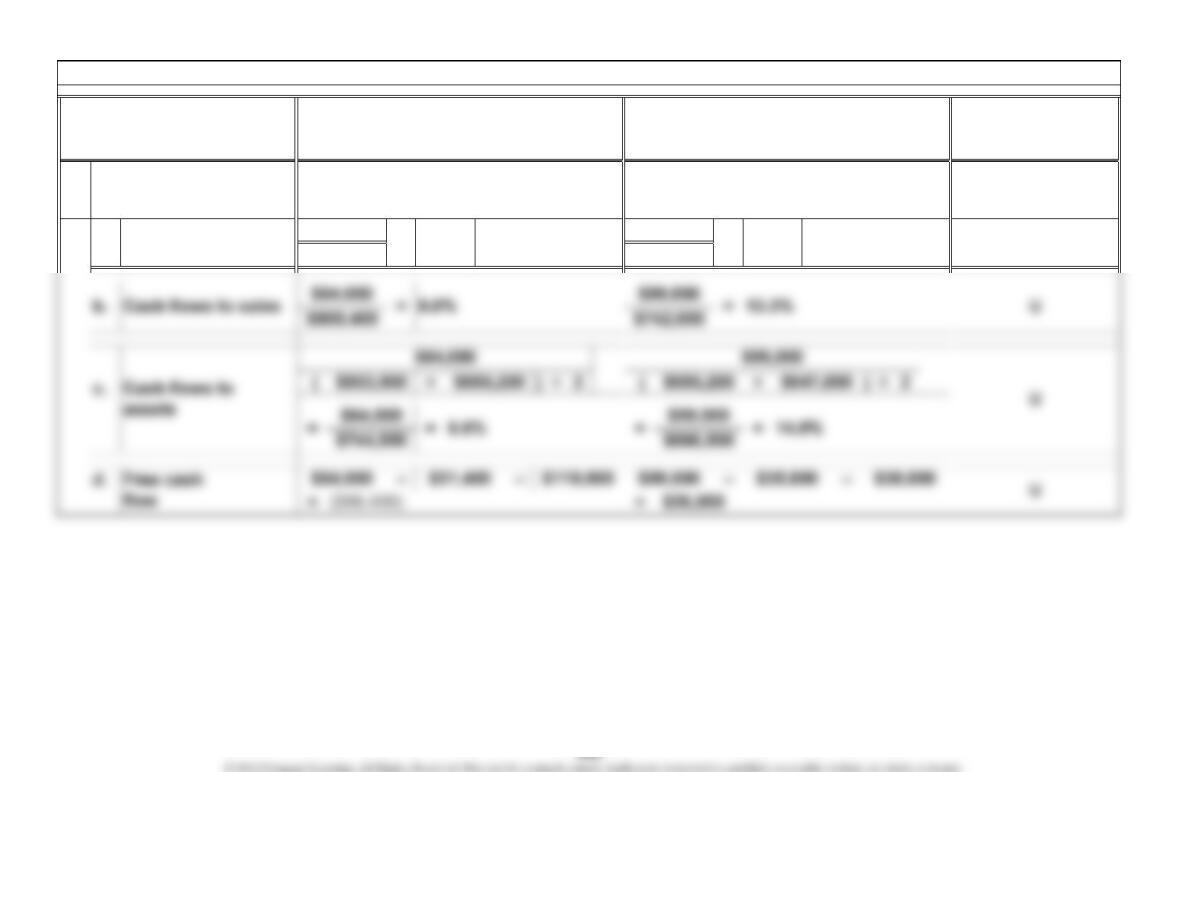
Ratio Name 2012 2011
6. Favorable (F) o
r
Unfavorable (U)
Change
a. Cash flow
yield =
Chapter 13, P 8. (Continued)
Liquidity
analysis
2.
$36,900
$64,000 F1.4 Times=1.7
Times $99,000
$71,300
658
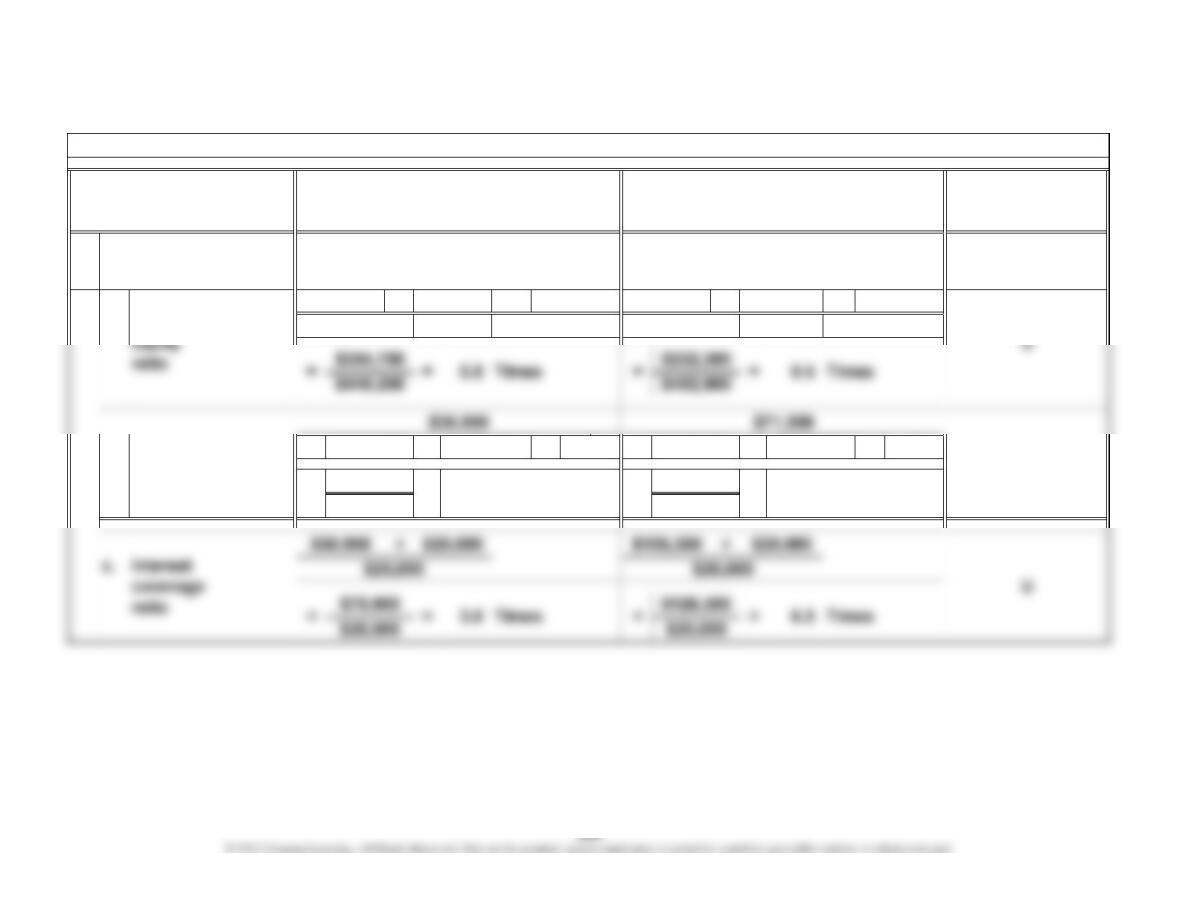
++ ++
( + ) ÷ ( + ) ÷
2
8.2%
$452,900 $376,600
=
+ $149,200
2012
6. Favorable (F) or
Unfavorable (U)
Change
$200,000
$104,700
Debt to
$300,000$300,000
$72,300$50,000 $50,000
Return on
equity
b.
3. Financial risk
analysis
$449,200
=
2011
U
+
2
17.2%
a.
Chapter 13, P 8. (Continued)
=
Ratio Name
$110,000
$152,900
$452,900
$451,050
$71,300
$414,750
=
$36,900
( + ) ÷ 2 ( + ) ÷ 2
( + ) ÷ 2 ( + ) ÷ 2
4. Operating asset
management analysis
$122,600 $107,800
$742,600
Chapter 13, P 8. (Continued)
2011
6. Favorable (F) or
Unfavorable (U)
ChangeRatio Name 2012
a. Neutral
$396,200
$107,800 $99,400
Inventory
$454,100
$800,400
$72,500 $42,700 $42,700 $52,700
c. Receivable
( + ) ÷ 2 ( + ) ÷ 2
+ $8,400
Days
Chapter 13, P 8. (Continued)
Ratio Name 2012 2011
6. Favorable (F) or
Unfavorable (U)
Change
$104,700 $72,300 $72,300
$454,100 + $14,800
= 61.9
365 Days
$64,800
$396,200
Days = 68.9 U
5.3 Times 5.9 Times
365 Days
f. Days’ payable
$2.38
6. Favorable (F) or
Unfavorable (U)
Change
F
2011
50.4
$120.00 Times
= 65.0
Chapter 13, P 8. (Continued)
Market
strength
analysis
=
Price/
earnings
(P/E) ratio
Times
Ratio Name
$80.00
a.
2012
$1.23
5.
Percentage
-82.0%
-6.3% [ ÷
3.2% ( ÷
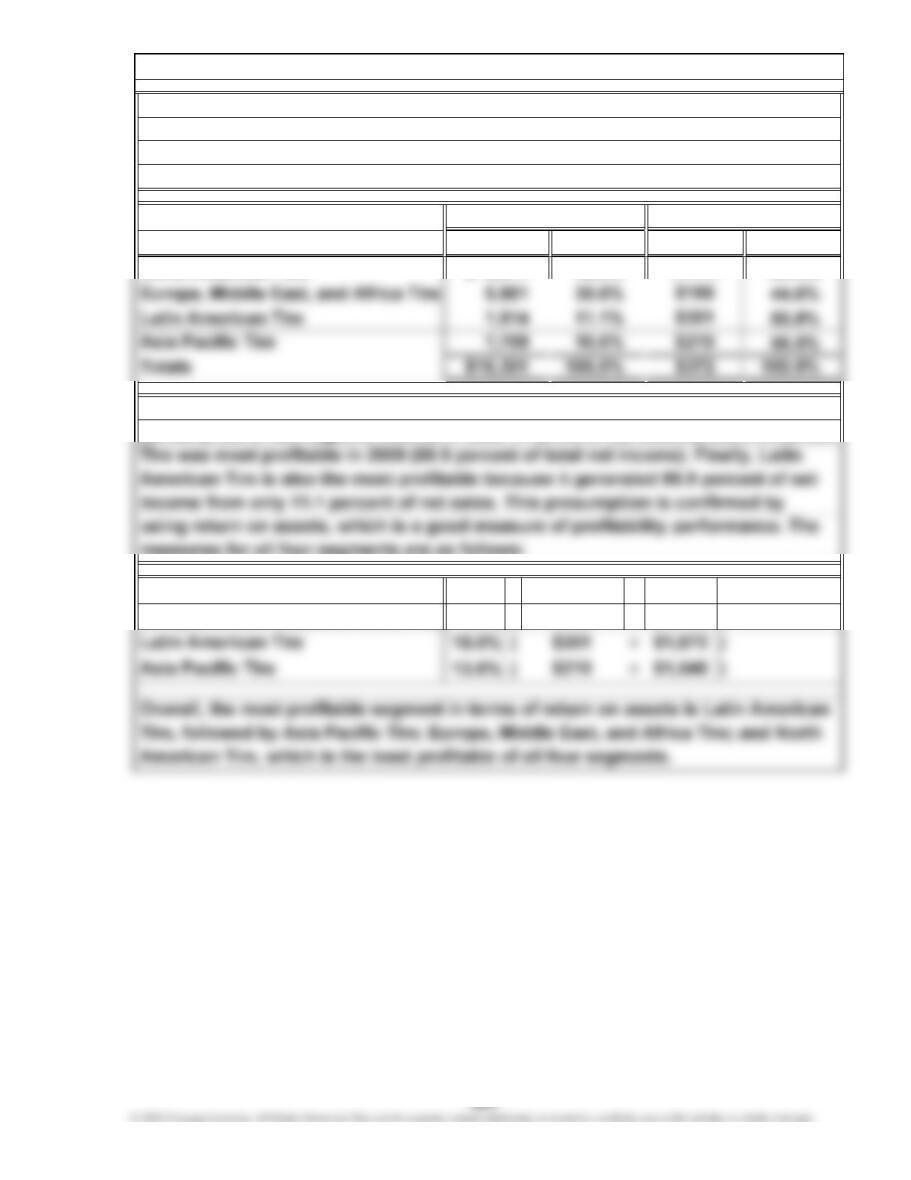
Europe, Middle East, and Africa Tire; Latin American Tire; and Asia Pacific Tire.
The relative size of each segment in terms of sales and income for 2009 is as
Sales
Percentage
)
($305)
Europe, Middle East, and Africa Tire $166
Amount
$5,144
($305)North American Tire
Income
Amount
$ 6,977
Segment
The North American Tire segment is the largest segment in terms of sales (42.8
percent), but it had negative income in 2009. In terms of net income, Latin American
]
42.8%
$4,836
measures for all four segments are as follows:
Chapter 13, C 1.
Based on Exhibit 13.1, Goodyear’s business segments are North American Tire;
follows (amounts in millions):
North American Tire
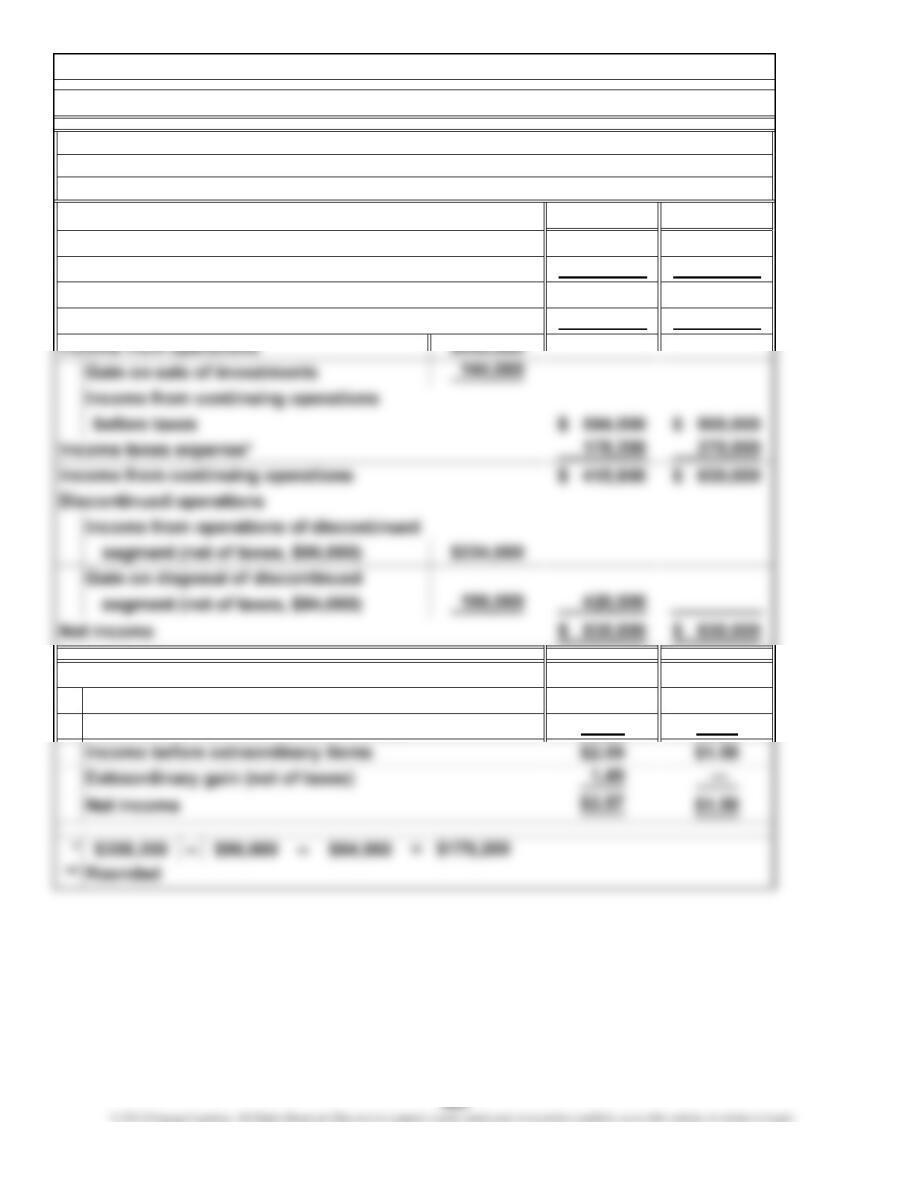
2012 2011
$2,000,000 $2,400,000
1,100,000 1,200,000
$ 900,000 $1,200,000
450,000 300,000
$1.04 $1.58
1.05 —
Earnings per common share:**
Income from continuing operations
Discontinued operations (net of taxes)
Chapter 13, C 2.
For the Years Ended December 31, 2012 and 2011
1. Multistep income statement
Net sales
Cost of goods sold
Gross margin
Operating expenses
Dash Corporation
Income Statements