Chapter 13
Analysis of Financial Statements
QUESTIONS
1. Financial reporting includes the entire process of preparing and issuing financial
information about a company. Financial statements are an important part of financial
reporting but they are less than the whole.
2. With comparative statements, financial statement items for two or more successive
accounting periods are placed side by side on a single statement, with the change in
each item expressed as both a dollar amount and a percent. Common-size
comparative statements express each financial statement item as a percent of some
base amount that is assigned a value of 100%.
3. Total assets (or equivalently, the total of liabilities plus equity) are assigned a value of
100% on a common-size balance sheet. Net sales (revenues) are assigned a value of
100% on a common-size income statement.
4. The nature of a company’s business, the composition of its current assets, and the
turnover of its current assets are three important factors that should be considered in
deciding whether a current ratio is good or bad.
9. Users are interested in the capital structure of a company, as measured by debt and
equity ratios, for at least two reasons. First, as a company includes more debt in its
capital structure, the risk that it will be unable to meet interest and principal
payments increases. Second, the existence of debt introduces financial leverage. If
the company can earn a rate of return on its investments that exceeds the rate of
interest paid to creditors, the debt will increase the rate of return to stockholders.
12. Almost all companies have some liabilities. Since total assets equals total liabilities
plus equity, total assets are almost always higher than common stockholders’
equity. Thus, the denominator in return on total assets is larger than common
stockholders’ equity. Since the numerator is the same for both, and return on total
assets has a larger denominator, it yields a smaller percent. [Instructor note: A more
complete measure of return on assets would add back (Interest Expense x {1 – Tax
Rate}) to net income in the numerator—reflecting the after-tax cost of debt. We leave
the rationale for this adjustment to advanced courses.]
13. This gain is considered to be unusual but not infrequent. It would be included in the
calculation of income from continuing operations, with other unusual or infrequent
gains and losses—in a category often labeled Other Gains and Losses.
14. Profit margin: Net Income / Sales ($ millions)
Fiscal 2017: $48,351 / $229,234 = 21.1%
Fiscal 2016: $45,687 / $215,639 = 21.2%
QUICK STUDY
Quick Study 13-1 (5 minutes)
a. Income statement
b. Balance sheet
√ c. Shareholders’ meetings
d. Financial statement notes
Quick Study 13-2 (10 minutes)
Quick Study 13-3 (15 minutes)
Current
Year
Prior
Year
Dollar
Change
Percent
Change
Short-term investments ………….
$374,634
$234,000
$140,634
60.1%
Accounts receivable ……………….
97,364
101,000
(3,636)
(3.6)%
Notes payable…………………………
0
88,000
(88,000)
(100.0)%
Quick Study 13-4 (5 minutes)
Trend percents
Current Year 177.0% ($801,810/ $453,000)
Prior Year 100.0% (the given base amount)
Quick Study 13-5 (5 minutes)
Common-size percents
Current Year 49.0% ($392,887 / $801,810)
Prior Year 29.6% ($134,088 / $453,000)
Quick Study 13-6 (15 minutes)
Quick Study 13-7 (15 minutes)
a.
Accounts Receivable Turnover: = 6.0 times
b.
Days’ sales uncollected: x 365 = 36.5 days
Quick Study 13-8 (15 minutes)
$40,000
$8,000
$40,000
$60,000
($14,000 + $6,000)/2
$6,000
$60,000
Quick Study 13-9 (10 minutes)
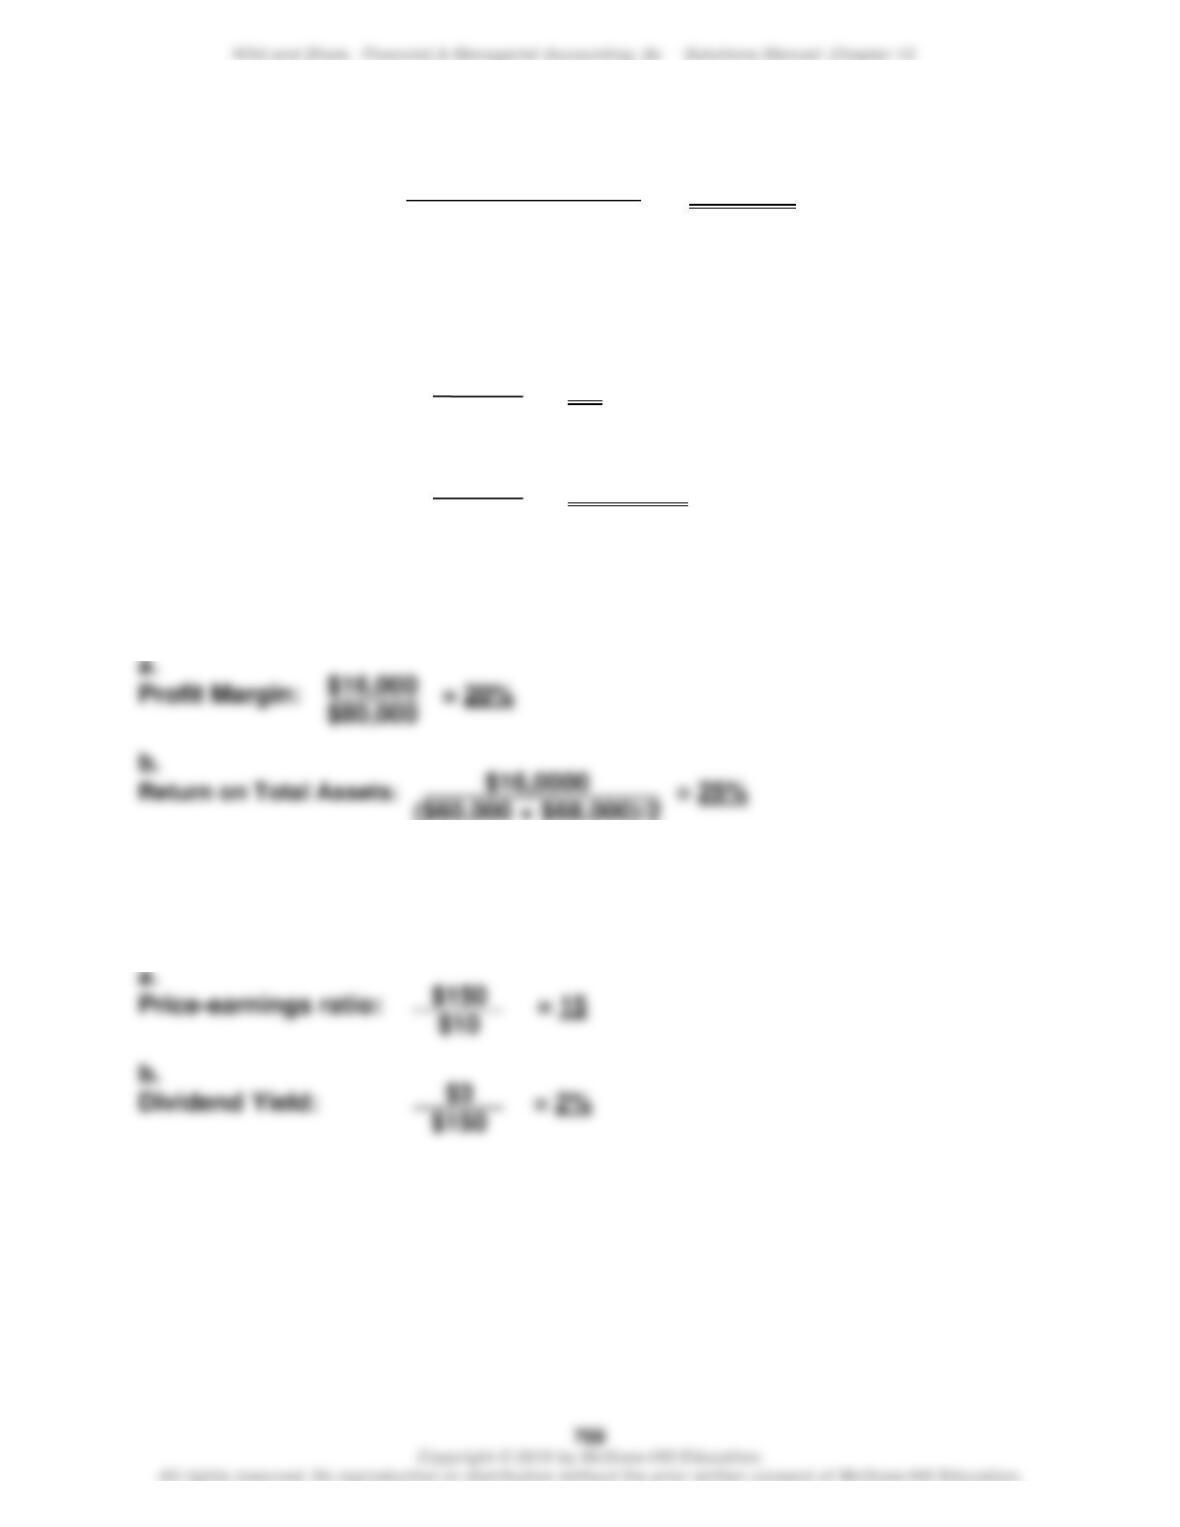
Total Asset Turnover: = 0.8 times
Quick Study 13-10 (15 minutes)
a.
Debt–to-equity Ratio: = 0.4
b.
Times Interest Earned: = 20.0 times
Quick Study 13-11 (15 minutes)
Quick Study 13-12 (15 minutes)
$80,000
($115,000 + $85,000)/2
$20,000
$50,000
$30,000
$1,500
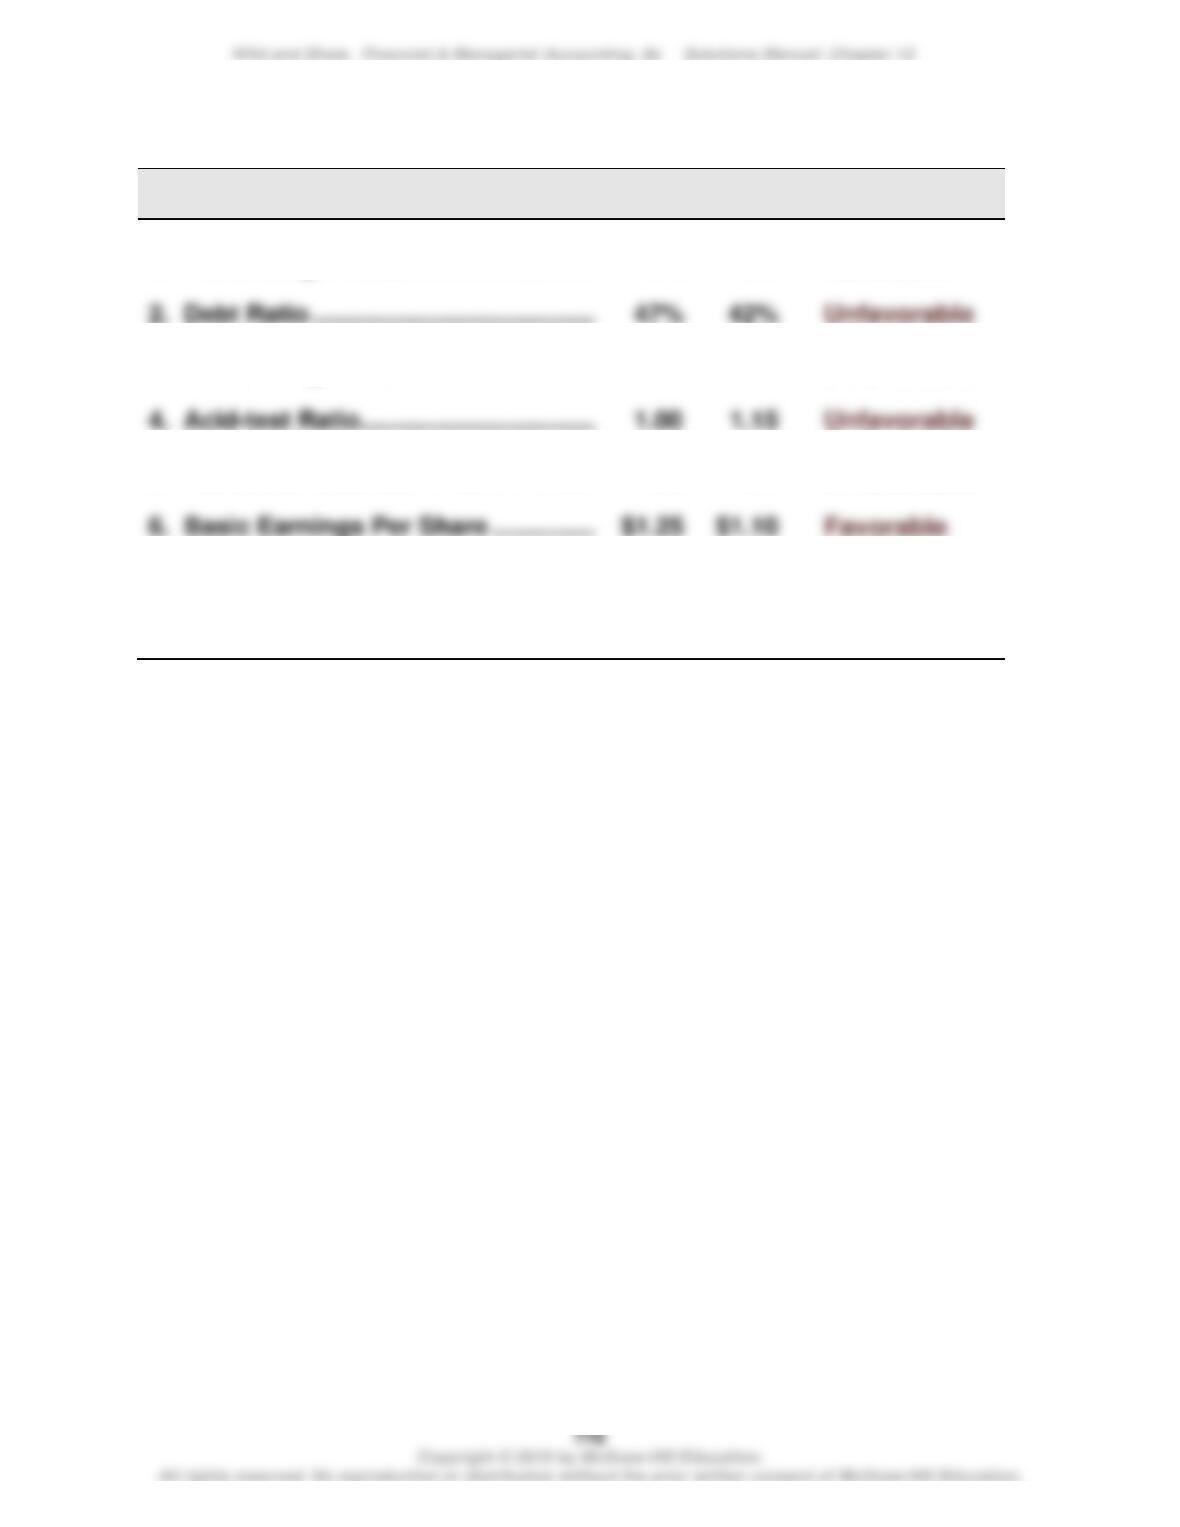
Quick Study 13–13 (10 minutes)
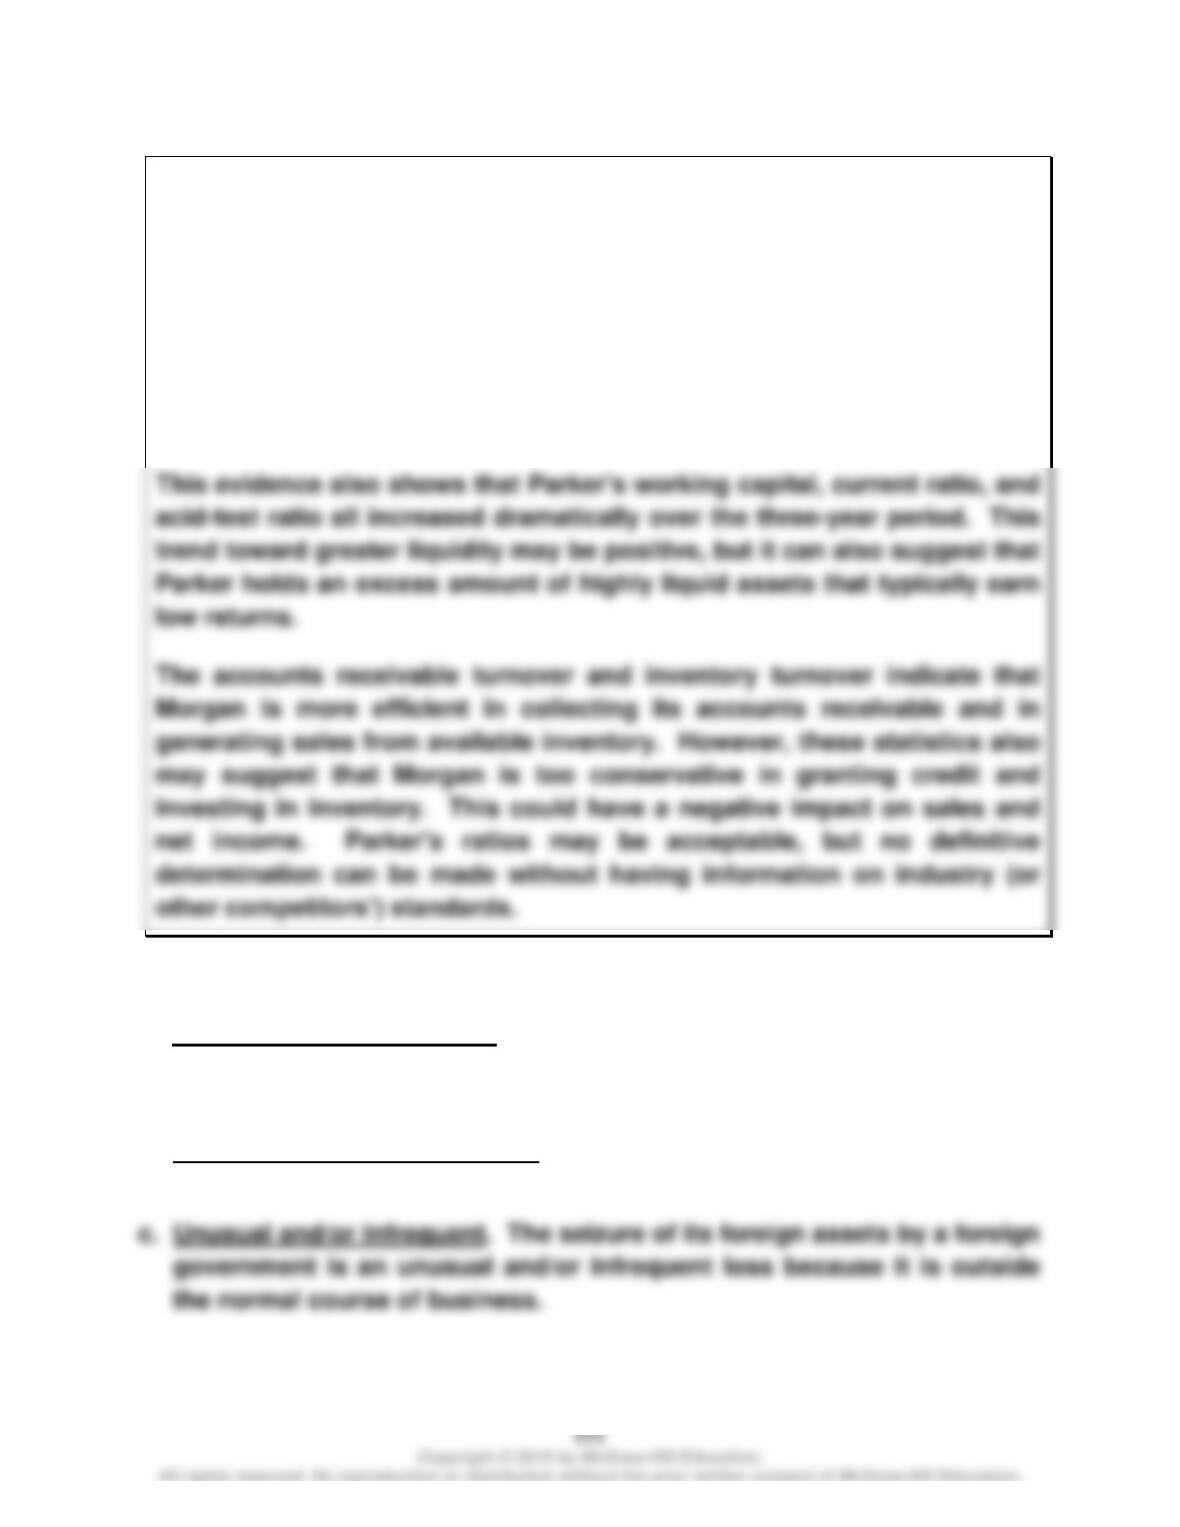
Ratio
Current
Year
Prior
Year
Change
1. Profit Margin Ratio …………………………..
9%
8%
Favorable
2. Debt Ratio ……………………………………….
Unfavorable
3. Gross Margin Ratio ………………………….
34%
46%
Unfavorable
4. Acid-test Ratio…………………………………
Unfavorable
5. Accounts Receivable Turnover ………..
5.5
6.7
Unfavorable
6. Basic Earnings Per Share ………………..
Favorable
7. Inventory Turnover ………………………….
3.6
3.4
Favorable
8. Dividend Yield …………………………………
2.0%
1.2%
Favorable
Wild and Shaw, Financial & Managerial Accounting, 8e Solutions Manual: Chapter 13
Quick-Study 13–14 (30 minutes)
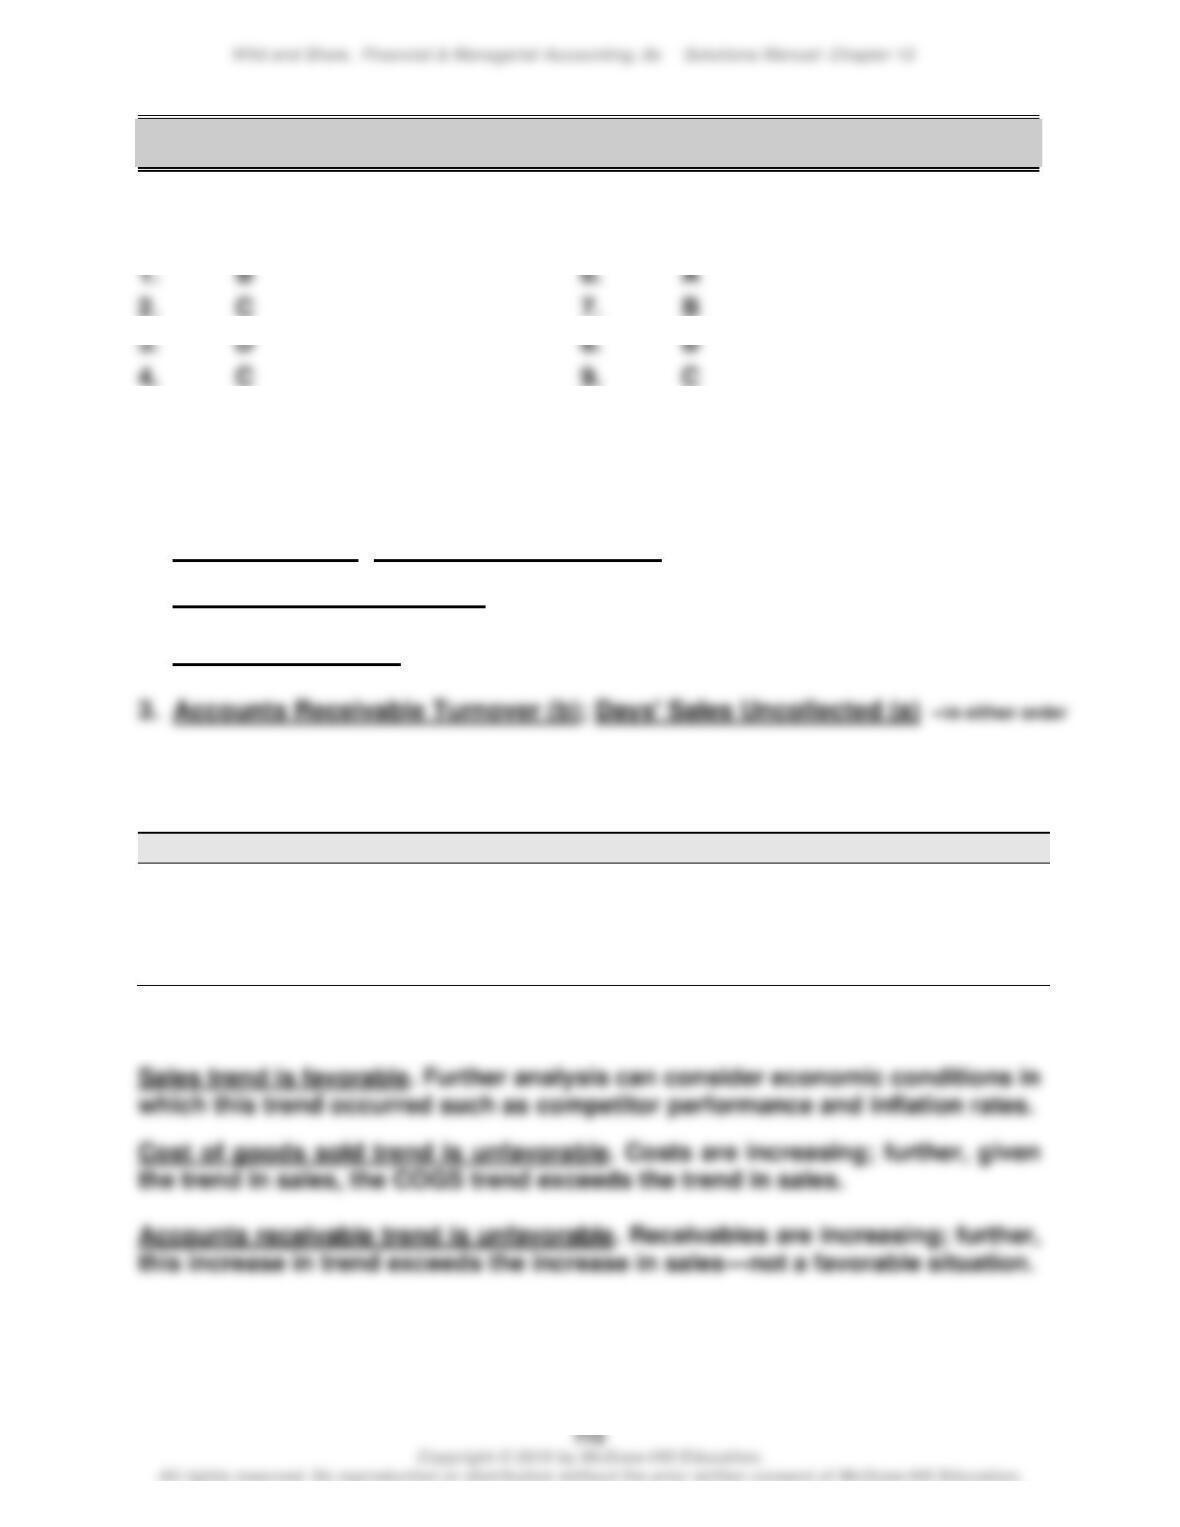
Parker has a greater amount of working capital. This by itself does not
indicate whether the company is more capable of meeting its current
obligations. However, support is provided by the current ratio and acid-
test ratio, which show Parker is in a more liquid position than Morgan.
This evidence does not mean that Morgan’s liquidity is inadequate. Such
a conclusion would require more information such as norms for the
industry or its other competitors. Notably, Morgan’s acid-test ratios
approximate the traditional rule of thumb (1 to 1).
Quick Study 13–15A (10 minutes)
a. Unusual and/or Infrequent. The destruction of rainwater tanks is an
unusual and/or infrequent loss because a hurricane is considered an
unusual and infrequent calamity (“act of God”).
b. Not Unusual and/or Infrequent. The sale of a delivery truck at a loss is
an ordinary loss on the sale of assets in the normal course of business.
EXERCISES
Exercise 13-1 (10 minutes)
1.
B
A
3.
D
B
5.
A
10.
A
Exercise 13-2 (5 minutes)
1. Profit Margin (f); Total Asset Turnover (e) —in either order
Return on Total Assets (d)
2. Working Capital (c) —also called net working capital
Exercise 13-3 (20 minutes)
2019
2018
2017
2016
2015
Sales ………………………………….
189
181
168
156
100
Cost of goods sold …………….
191
182
172
159
100
Accounts receivable …………..
201
192
182
169
100
Analysis:
Exercise 13-4 (25 minutes)
Current Yr
Prior Yr
Sales …………………………………………….
100.0%
100.0%
Cost of goods sold ……………………….
75.7
46.5
17.3
35.0
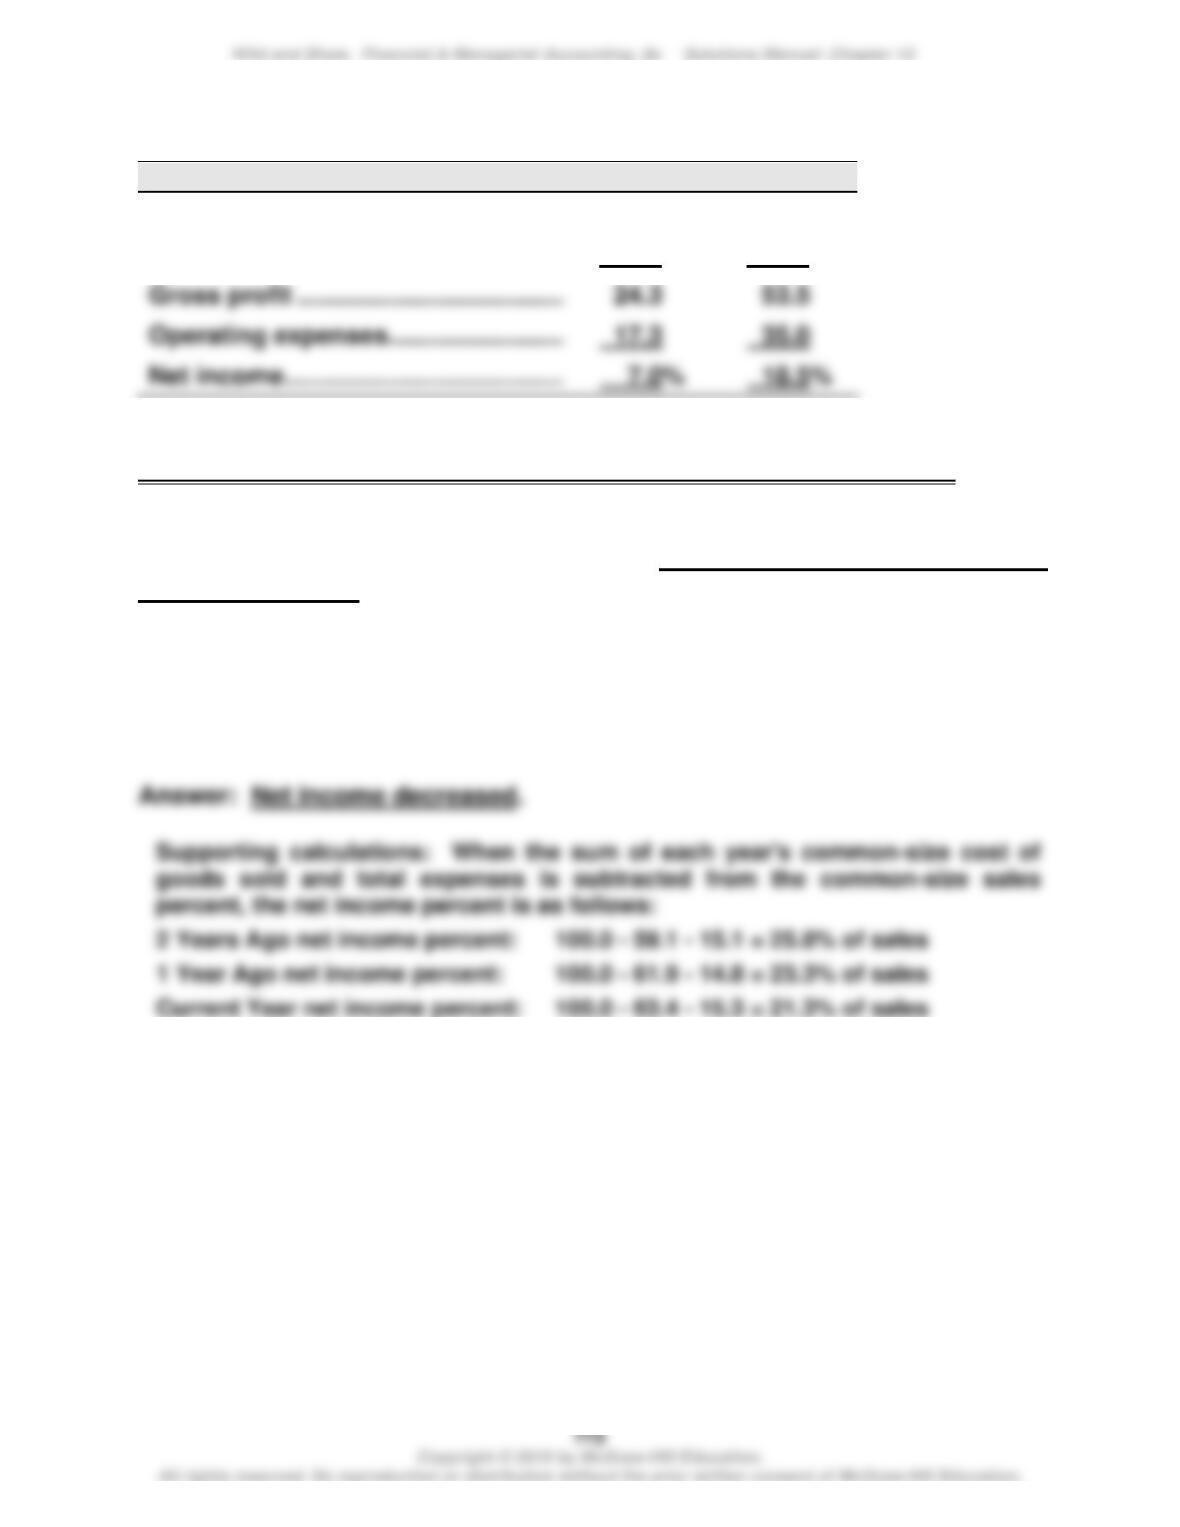
Analysis:
Cost of goods sold increase is most responsible for the income decline.
There is substantial decline in net income as a percent of sales for the current
year (7.0%) relative to the prior year (18.5%). The main culprit is the increase in
cost of goods sold as a percent of sales from 46.5% to 75.7%. The company
did not experience an increase in operating expenses as a percent of sales.
Also, from the actual numbers, we see that sales actually increased.
Exercise 13-5 (25 minutes)
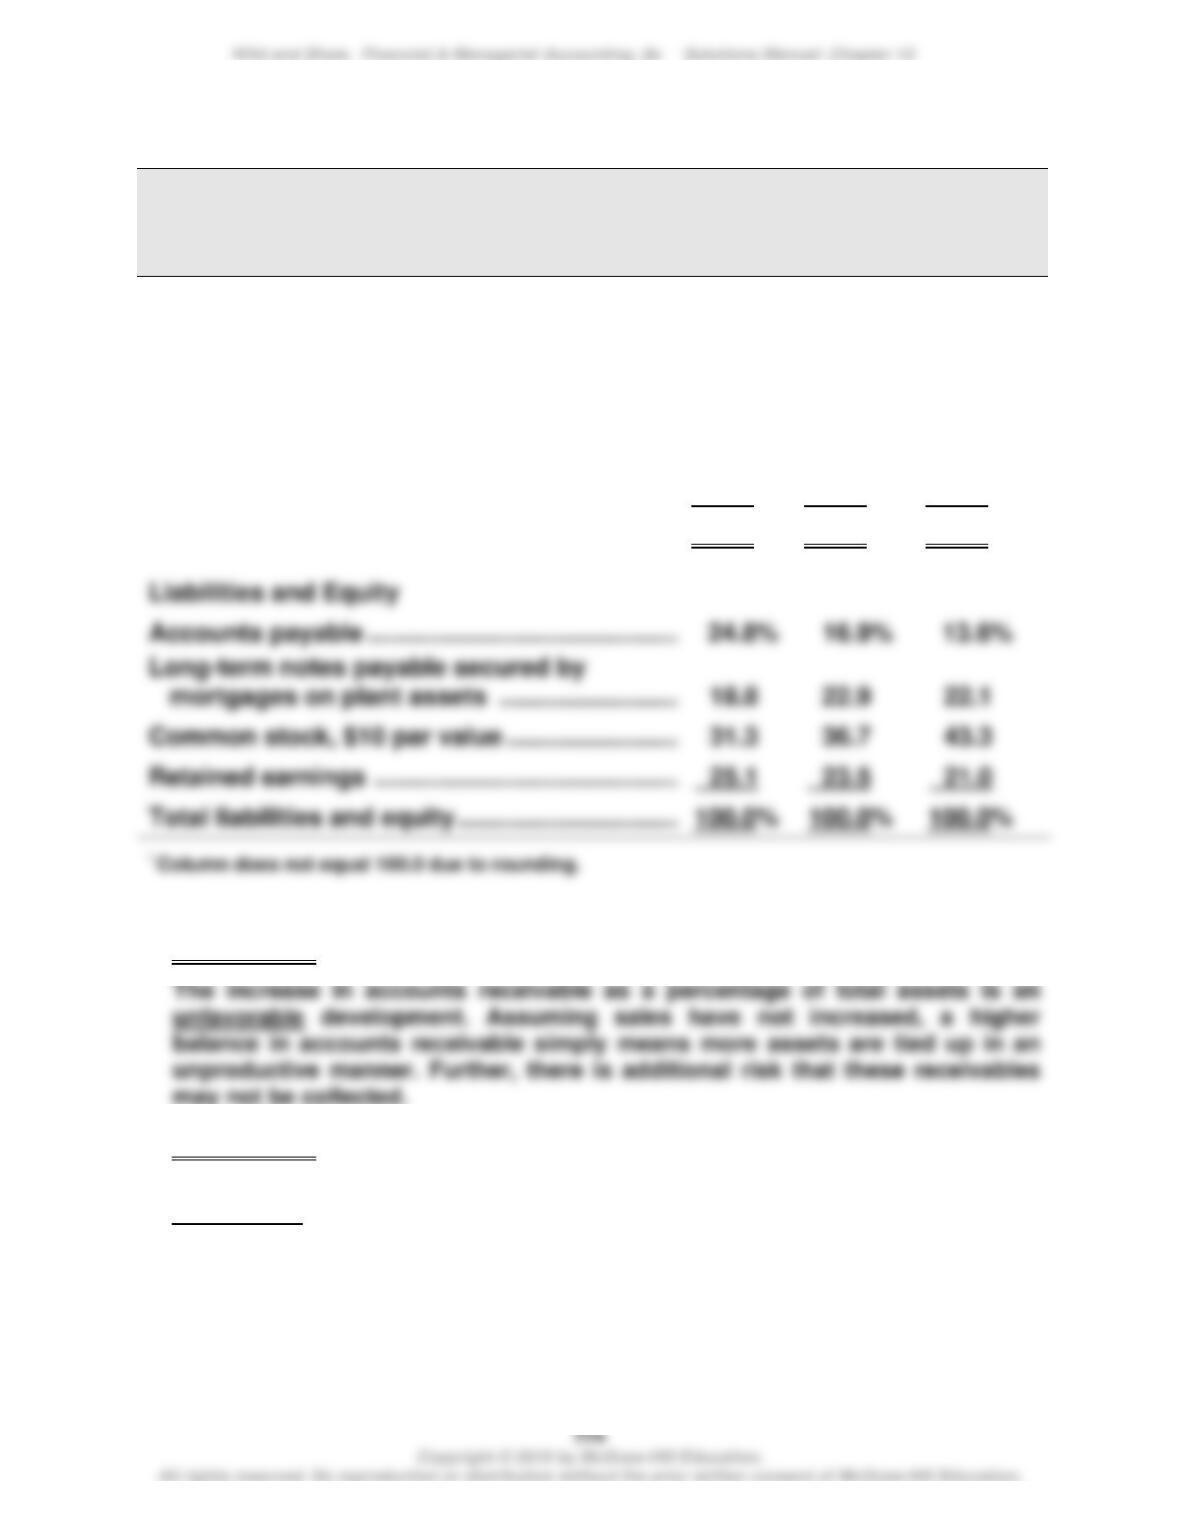
Next, if 2 Years Ago sales are assumed to be $100, then sales from 1 Year Ago
are $104.20 and the sales from the Current Year are $105.40. If the net income
percents for the three years are applied to these amounts, the net incomes are:
2 Years Ago net income: $100.00 x 25.8% = $25.80
1 Year Ago net income: $104.20 x 23.3% = $24.28
Current Year net income: $105.40 x 21.3% = $22.45
This shows that net income decreased over the three-year period.
Exercise 13-6 (20 minutes)
1.
Simon Company
Common-Size Comparative Balance Sheets
At December 31
Current
Year
1 Year
Ago*
2 Years
Ago
Assets
Cash ………………………………………………………….
6.1%
8.0%
10.0%
Accounts receivable, net …………………………….
17.1
14.0
13.3
Merchandise inventory ……………………………….
21.5
18.5
14.3
Prepaid expenses ……………………………………….
2.0
2.1
1.3
Plant assets, net ………………………………………..
53.3
57.3
61.1
Total assets ……………………………………………….
100.0%
100.0%
100.0%
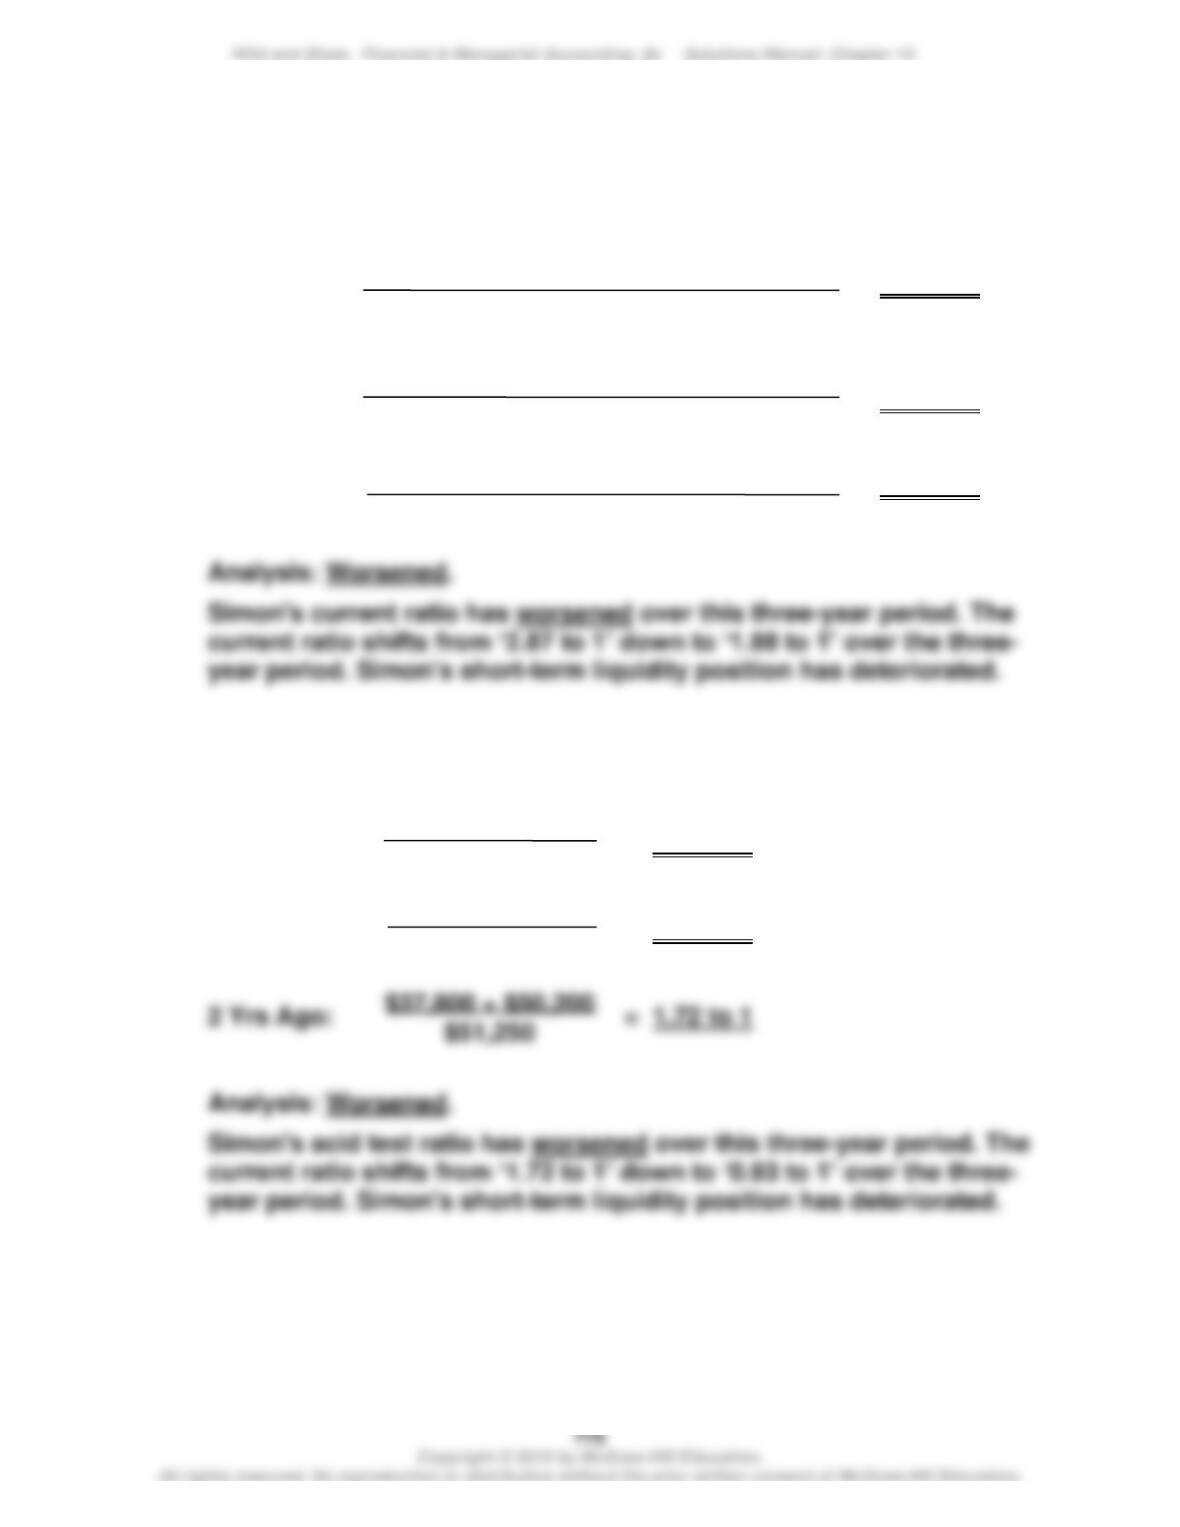
24.8%
13.6%
2. Unfavorable.
3. Unfavorable.
The increase in merchandise inventory as a percentage of total assets is an
unfavorable development. More inventory means more assets are tied up in an
unproductive manner.
Exercise 13-7 (25 minutes)
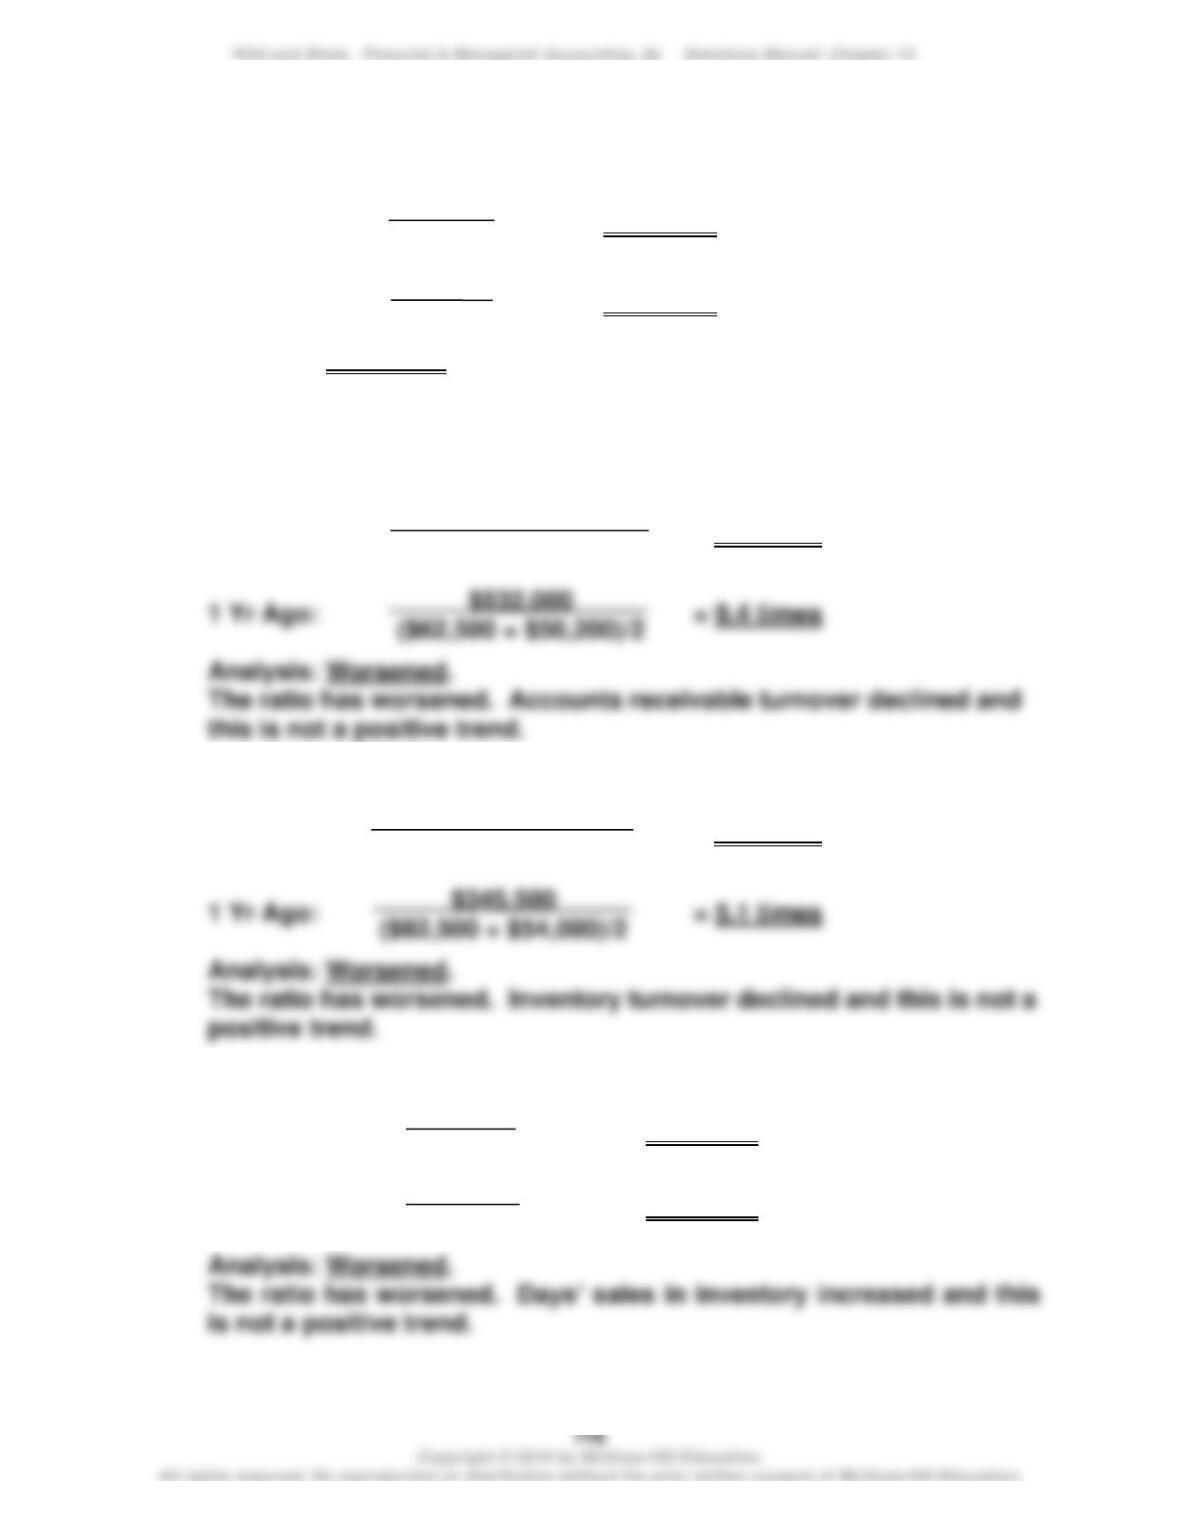
1. Current ratio
Current Yr: = 1.88 to 1
1 Yr Ago: = 2.52 to 1
2 Yrs Ago: = 2.87 to 1
2. Acid-test ratio
Current Yr: = 0.93 to 1
1 Yr Ago: = 1.30 to 1
$31,800 + $89,500 + $112,500 + $10,700
$129,900
$35,625 + $62,500 + $82,500 + $9,375
$75,250
$37,800 + $50,200 + $54,000 + $5,000
$51,250
$31,800 + $89,500
$129,900
$35,625 + $62,500
$75,250
Exercise 13-8 (25 minutes)
1. Days’ sales uncollected
Current Yr: x 365 = 48.5 days
1 Yr Ago: x 365 = 42.9 days
Analysis: Worsened.
The ratio has worsened. The number of days’ sales uncollected
increased and this is not a positive trend.
2. Accounts receivable turnover
Current Yr: = 8.9 times
$532,000
($62,500 + $50,200)/2
3. Inventory turnover
Current Yr: = 4.2 times
$345,500
($82,500 + $54,000)/2
4. Days’ sales in inventory
Current Yr: x 365 = 99.9 days
1 Yr Ago: x 365 = 87.2 days
$89,500
$673,500
$62,500
$532,000
$673,500
($89,500 + $62,500)/2
$411,225
($112,500 + $82,500)/2
$112,500
$411,225
$82,500
$345,500
Exercise 13-9 (25 minutes)
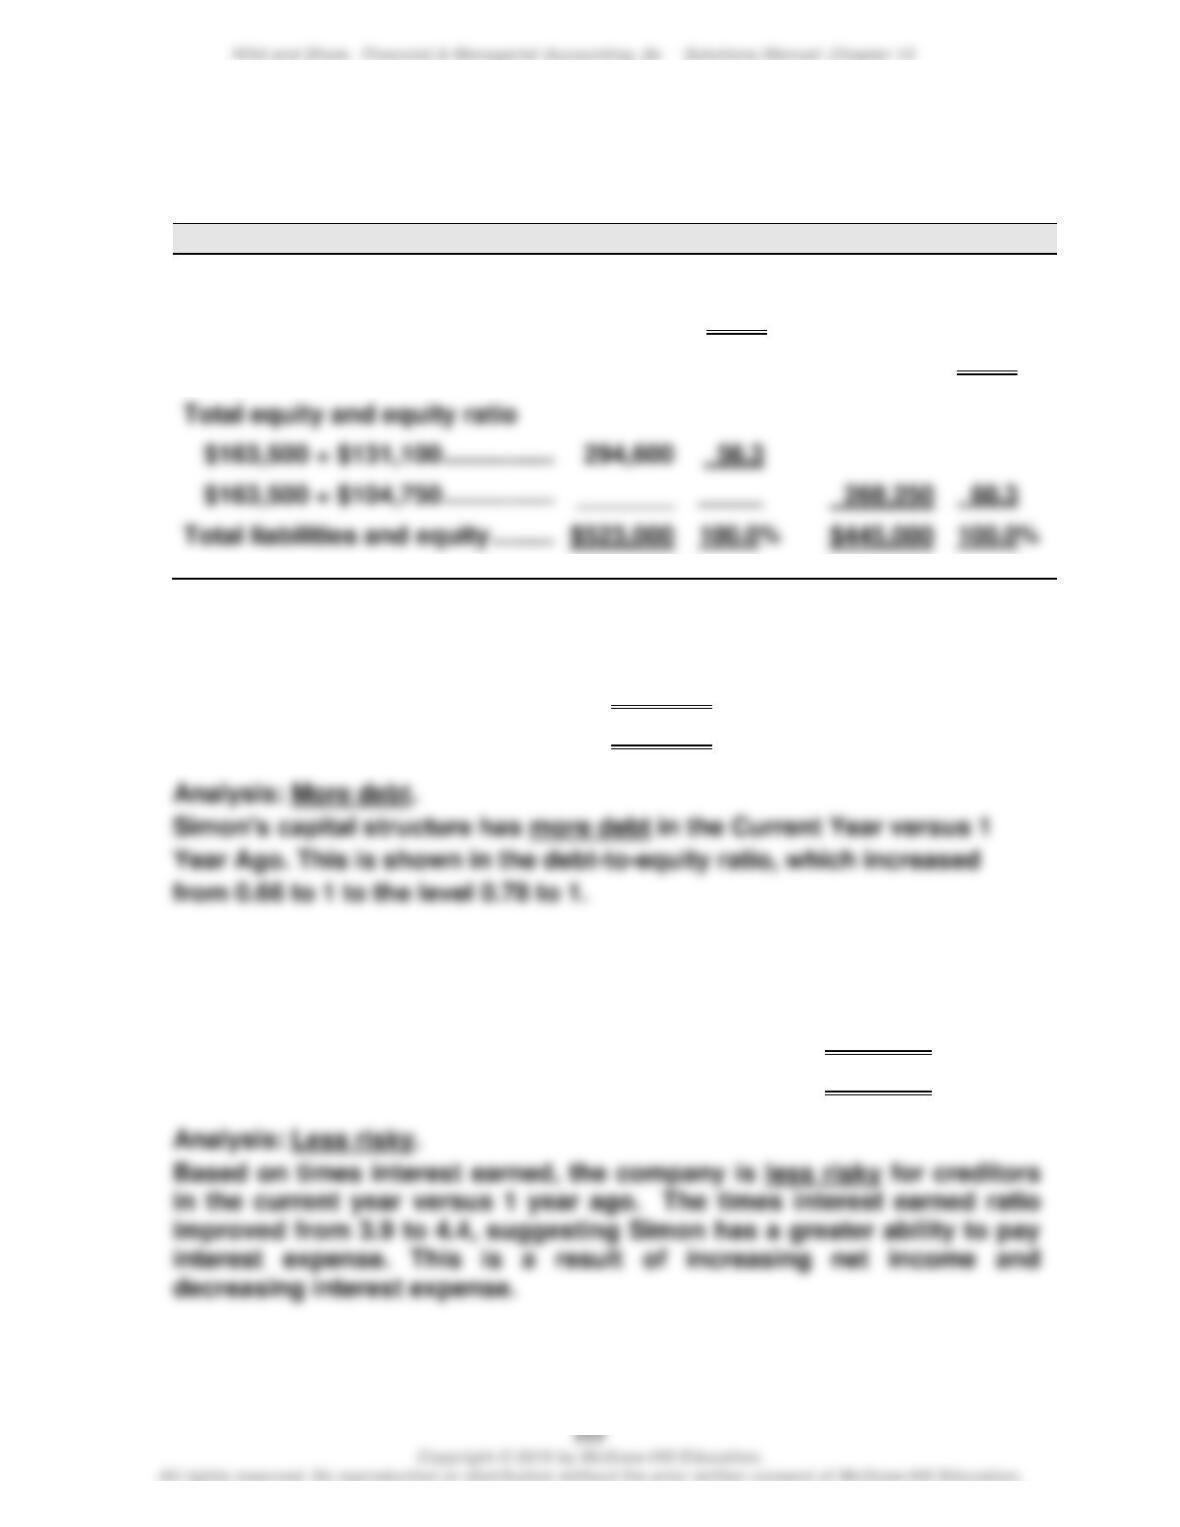
1. Debt and equity ratios
Current Year
1 Year Ago
Total liabilities and debt ratio
$129,900 + $98,500 …………………..
$228,400
43.7%
$75,250 + $101,500 …………………..
$176,750
39.7%
Total equity and equity ratio
$163,500 + $131,100 …………………
$163,500 + $104,750 …………………
60.3
2. Debt–to-equity ratio
Current Year: $228,400 / $294,600 = 0.78 to 1
1 Year Ago: $176,750 / $268,250 = 0.66 to 1
3. Times interest earned
Current Year: ($31,100 + $9,525 + $12,100) / $12,100 = 4.4 times
1 Year Ago: ($29,375 + $8,845 + $13,300) / $13,300 = 3.9 times
Exercise 13-10 (30 minutes)
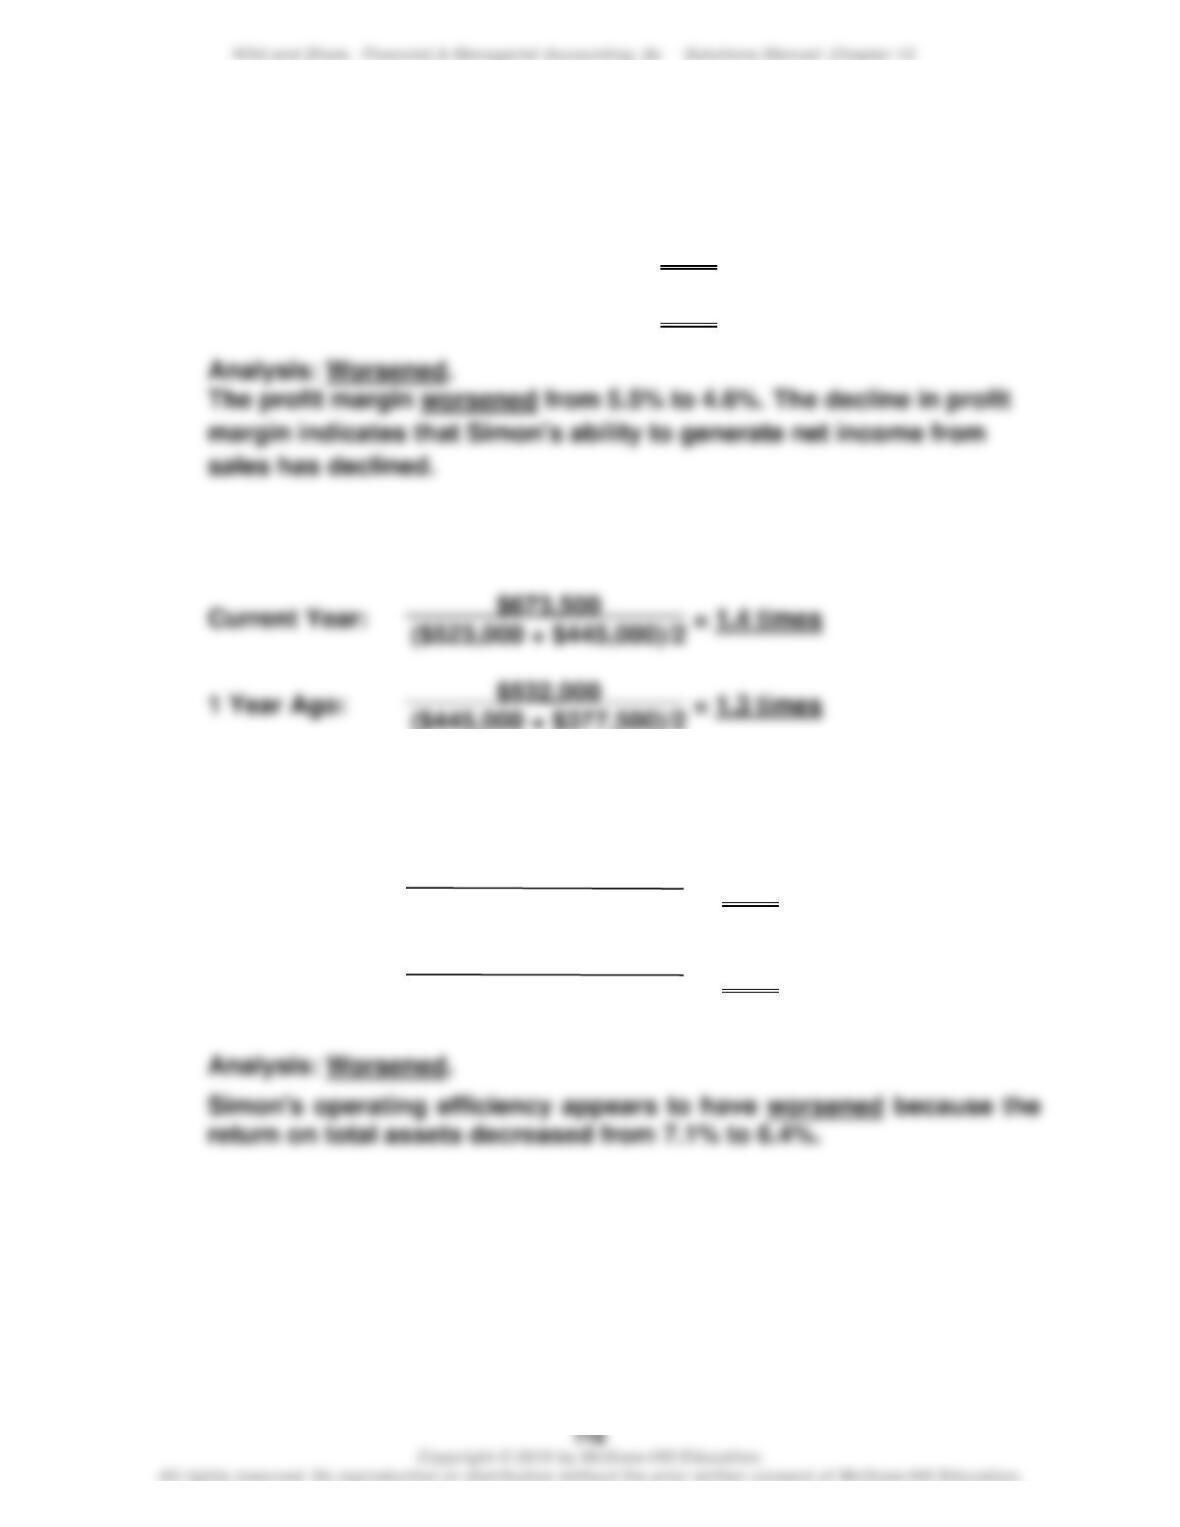
1. Profit margin
Current Year: $31,100 / $673,500 = 4.6%
1 Year Ago: $29,375 / $532,000 = 5.5%
2. Total asset turnover
3. Return on total assets
Current Year: = 6.4%
1 Year Ago: = 7.1%
$31,100
($523,000 + $445,000)/2
$29,375
($445,000 + $377,500)/2
1. Return on common stockholders’ equity
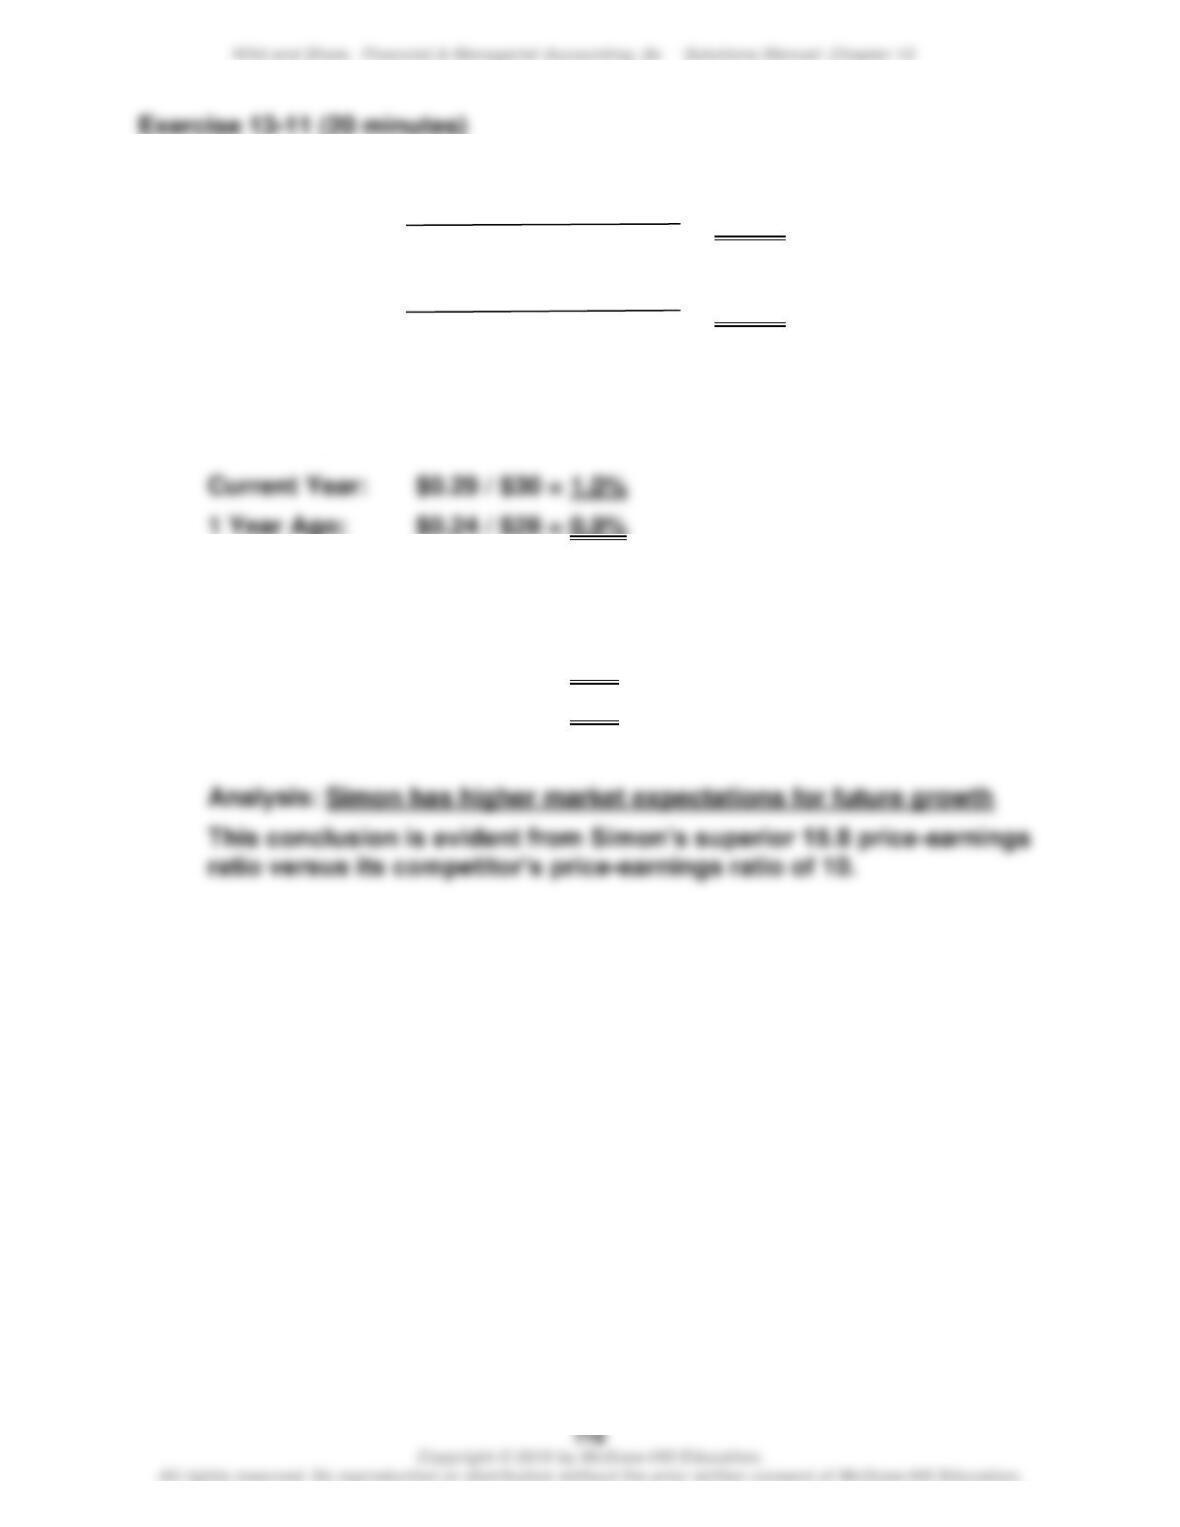
Current Year: = 11.1%
1 Year Ago: = 11.5%
2. Dividend yield
3. Price-earnings ratio
Current Year: $30 / $1.90 = 15.8
1 Year Ago: $28 / $1.80 = 15.6
Exercise 13-12 (15 minutes)
Current ratio = $9,036 / $871 = 10.37
Profit margin = $146 / $4,464 = 3.27%
$31,100
($294,600 + $268,250)/2
$29,375
($268,250 + $242,750)/2
Exercise 13–13 (15 minutes)
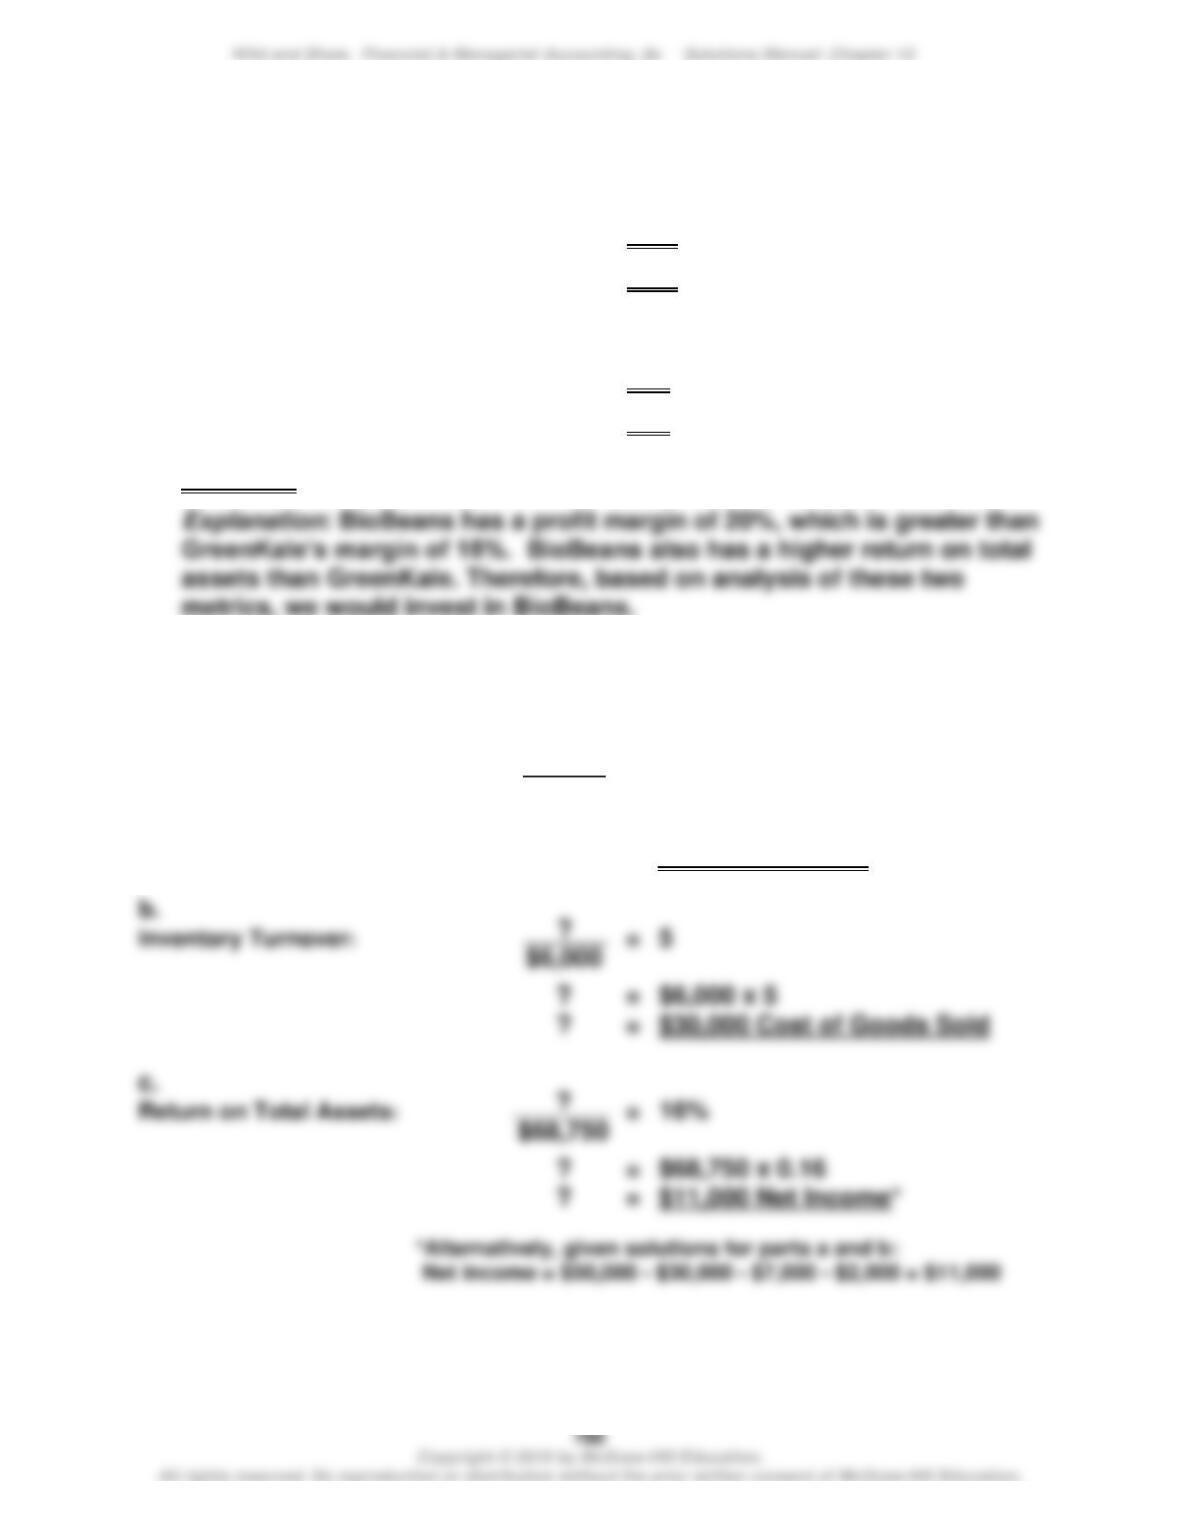
1. Profit margin
BioBeans: $15,000 / $75,000 = 20%
GreenKale: $9,000 / $60,000 = 15%
Return on total assets
BioBeans: $15,000 / $187,500 = 8%
GreenKale: $9,000 / $150,000 = 6%
2. BioBeans
Exercise 13–14 (20 minutes)
a.
Accounts Receivable Turnover: = 8
? = $6,250 x 8
? = $50,000 Net Sales
?
$6,000
?
$6,250
Exercise 13-15 (30 minutes)
COMPARATIVE ANALYSIS REPORT
Clay’s profit margins are higher than Roak’s. However, Roak has
significantly higher total asset turnover ratios. As a result, Roak generates
a substantially higher return on total assets.
The trends of both companies include evidence of growth in sales, total
asset turnover, and return on total assets. However, Clay’s rates of
improvement are better than Roak’s. These differences may result from the
fact that Clay is only three years old, while Roak is a somewhat more
established company. Clay’s operations are considerably smaller than
Roak’s, but that will not persist many more years if both companies
continue to grow at their current rates.
1. a. Clay. Clay’s profit margins are better than Roak’s.
b. Roak. Roak has markedly better total asset turnover ratios.
c. Roak. Following from parts a and b, Roak has a substantially higher
return on total assets.
2. Clay. Clay’s rates of improvement in sales growth are better than
Roak’s—current year: 24% ($210,000/$170,000); and 1 year ago: 55%.
Exercise 13-17A (10 minutes)
1. A Net sales less operating expense section
2. B Other unusual and/or infrequent gains (losses)
7. D Income (loss) from operating a discontinued segment, or gain
(loss) from disposal
8. B Other unusual and/or infrequent gains (losses)
Exercise 13-18A (20 minutes)
RANDA MERCHANDISING, INC.
Income Statement
For Year Ended December 31
Net sales ………………………………………………………………..
$2,900,000
Expenses
Cost of goods sold ………………………………………………
$1,480,000
Depreciation expense ………………………………………….
232,000
Total operating expenses …………………………………….
1,712,000
Income from continuing operations before taxes …….
778,000
Income tax expense ……………………………………………….
217,000
Income from continuing operations ………………………..
561,000
Discontinued segment
Loss from operating wholesale business
segment (net of tax) ………………………………………….
(444,000)
Gain on sale of wholesale business
PROBLEM SET A
Problem 13-1A (120 minutes)
Part 1
HAROUN COMPANY
Income Statement Trends
For Years Ended December 31
2019
2018
2017
2016
2015
2014
2013
Sales ……………………………….
182.5%
161.2%
147.6%
136.2%
127.8%
119.6%
100.0%
Cost of goods sold …………..
212.6
176.1
153.9
136.9
128.3
121.2
100.0
Gross profit ……………………..
131.0
135.7
136.8
135.1
126.9
117.0
100.0
Operating expenses …………
279.7
216.9
198.3
144.1
123.7
122.0
100.0
HAROUN COMPANY
Balance Sheet Trends
At December 31
2019
2018
2017
2016
2015
2014
2013
Cash ………………………………..
65.2%
87.6%
92.1%
94.4%
98.9%
96.6%
100.0%
Accounts recble., net ……….
226.9
238.0
215.7
166.7
147.2
139.8
100.0
Merchandise inventory ……..
298.9
221.8
195.8
167.8
152.2
131.7
100.0
Other current assets …………
400.0
355.6
155.6
377.8
311.1
311.1
100.0
Long-term investments …….
100.0
100.0
100.0
100.0
Plant assets, net ………………
278.6
277.8
241.7
130.2
134.9
118.6
100.0
Total assets ……………………..
246.8
222.3
195.4
144.4
138.6
124.0
100.0
Current liabilities ……………..
432.6
369.5
254.6
217.7
193.6
185.1
100.0
Long-term liabilities ………….
323.5
285.0
278.0
142.5
145.0
155.0
100.0
Common stock …………………
153.8
153.8
153.8
130.8
130.8
100.0
100.0
Other paid-in capital …………
166.7
166.7
166.7
113.3
113.3
100.0
100.0
Retained earnings…………….
213.2
179.2
137.7
124.5
109.4
100.0
Total liabilities & equity …….
246.8
222.3
195.4
144.4
138.6
124.0
100.0