FINANCIAL ACCOUNTING – Eleventh Edition Solutions Manual
Ethical analysis: Reclassifying a long-term investment as current to meet a
debt agreement does not, in itself, brand Turnberry managers as unethical.
The managers may have honestly intended to sell the investments in order to
Chapter 13: Financial Statement Analysis Page 78 of 94

FINANCIAL ACCOUNTING – Eleventh Edition Solutions Manual
Apple, Inc.
(1-2 hours)
Requirements
Solution:
Req. 1
(in millions)
2014 2013
2014 Vertical
Analysis
2013 Vertical
Analysis
Dollar
Change
Horizontal
Analysis
2014 Amount
Net Sales
2013 Amount
Net Sales
Dollar
Change
2013
Amount
Net Sales $182,795 $170,910 100.00% 100.00% $11,885 6.95%
1. Perform horizontal and vertical analysis of the following information on the company’s comparative income
statements for 2014 and 2013:
a. Net sales
b. Gross margin
c. Operating income
d. Net income
Did the company appear to be performing better or worse on these dimensions in 2014, relative to 2013?
Explain.
2. Perform horizontal and vertical analysis of the company’s balance sheets for 2014 and 2013. In what areas
did the company’s balance sheet appear to be improving? Deteriorating? Explain.
3. Compute trends in the major elements of the company’s cash flow statement (operations, investing, and
financing) for 2014 relative to 2013. From where does the company generate most of its cash? What did the
company spend most of its cash on?
4. As explained in the narrative of this chapter, using fiscal 2014 year-end data, we predicted a stock price for
Apple Inc. of about $121 per share. Using an Internet site such as Google Finance or Yahoo! Finance, perform
research on events that have happened since then. Have these events positively or negatively impacted the
company’s stock price? Which events were controllable by the company, and which were not? Using this data,
update the analysis given in this chapter regarding the potential of the company’s stock as a long-term
investment. Would Apple Inc. stock have been a good buy at $121 per share if purchased at the end of its
fiscal year 2014? Explain. (Challenge)
Chapter 13: Financial Statement Analysis Page 79 of 94
FINANCIAL ACCOUNTING – Eleventh Edition Solutions Manual
Req. 2
(in millions)
2014 2013
2014 Vertical
Analysis
2013 Vertical
Analysis
Dollar
Change
Horizontal
Analysis
2014 Amount
2014 Assets
2013 Amount
2013 Assets
Dollar
Change
2013
Amount
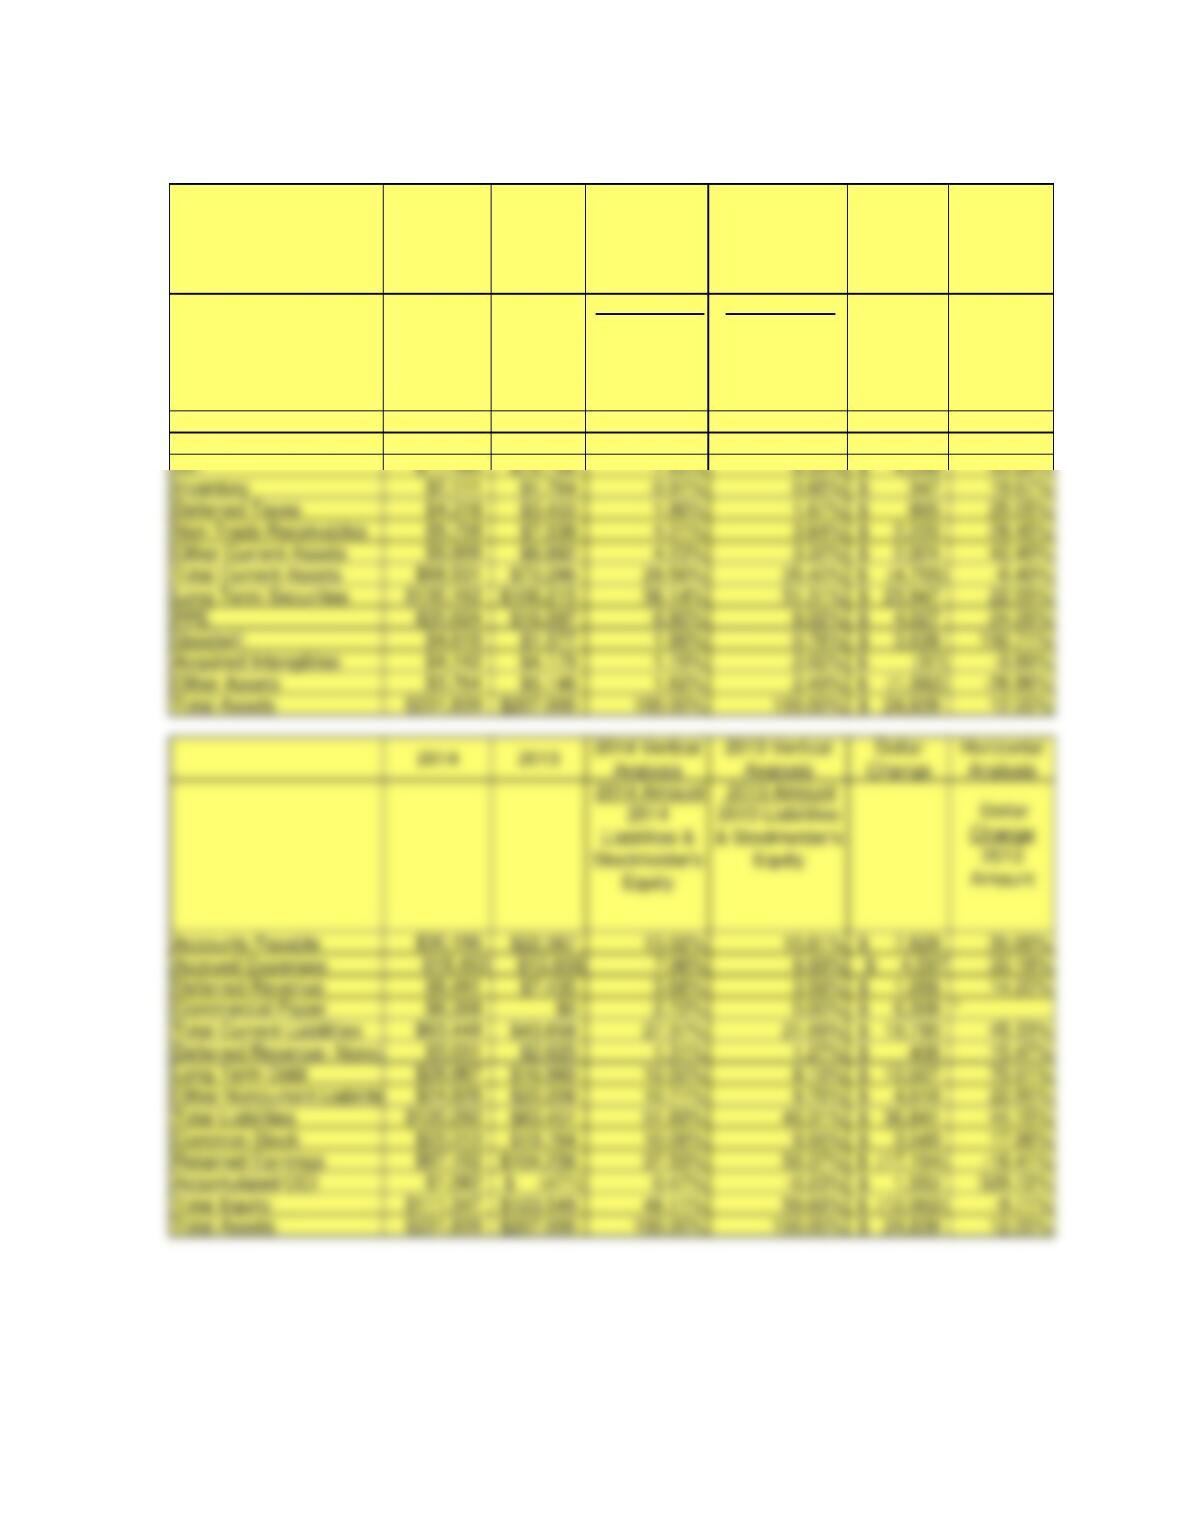
Cash $13,844 $14,259 5.97% 6.89% (415)$ -2.91%
Short Term Securities $11,233 $26,287 4.85% 12.70% $ (15,054) -57.27%
Chapter 13: Financial Statement Analysis Page 80 of 94
Deferred Taxes $4,318 $3,453 1.86% 1.67% 865$ 25.05%
Non-Trade Receivables $9,759 $7,539 4.21% 3.64% 2,220$ 29.45%
Other Current Assets $9,806 $6,882 4.23% 3.32% 2,924$ 42.49%
Acquired Intangibles $4,142 $4,179 1.79% 2.02% (37)$ -0.89%
Other Assets $3,764 $5,146 1.62% 2.49% (1,382)$ -26.86%
Accounts Payable $30,196 $22,367 13.02% 10.81% 7,829$ 35.00%
Commercial Paper $6,308 $0 2.72% 0.00% 6,308$ *
Total Current Liabilities $63,448 $43,658 27.37% 21.09% 19,790$ 45.33%
Total Liabilities $120,292 $83,451 51.89% 40.31% 36,841$ 44.15%
Common Stock $23,313 $19,764 10.06% 9.55% 3,549$ 17.96%
Total Equity $111,547 $123,549 48.11% 59.69% (12,002)$ -9.71%
Total Assets $231,839 $207,000 100.00% 100.00% 24,839$ 12.00%
FINANCIAL ACCOUNTING – Eleventh Edition Solutions Manual
Req. 3
Section
Operating 11.27%
Investing
-33.15%
($59,713 – $53,666) / $53,666
($22,579 – $33,774) / $33,774
Computation
(2014 Amount
– 2013 Amount)
Horizontal Analysis
Chapter 13: Financial Statement Analysis Page 81 of 94
Req. 4
($37,549 – $16,379) / $16,379
FINANCIAL ACCOUNTING – Eleventh Edition Solutions Manual
Under Armour, Inc.
(20 min.)
Solution:
Req. 1
a.
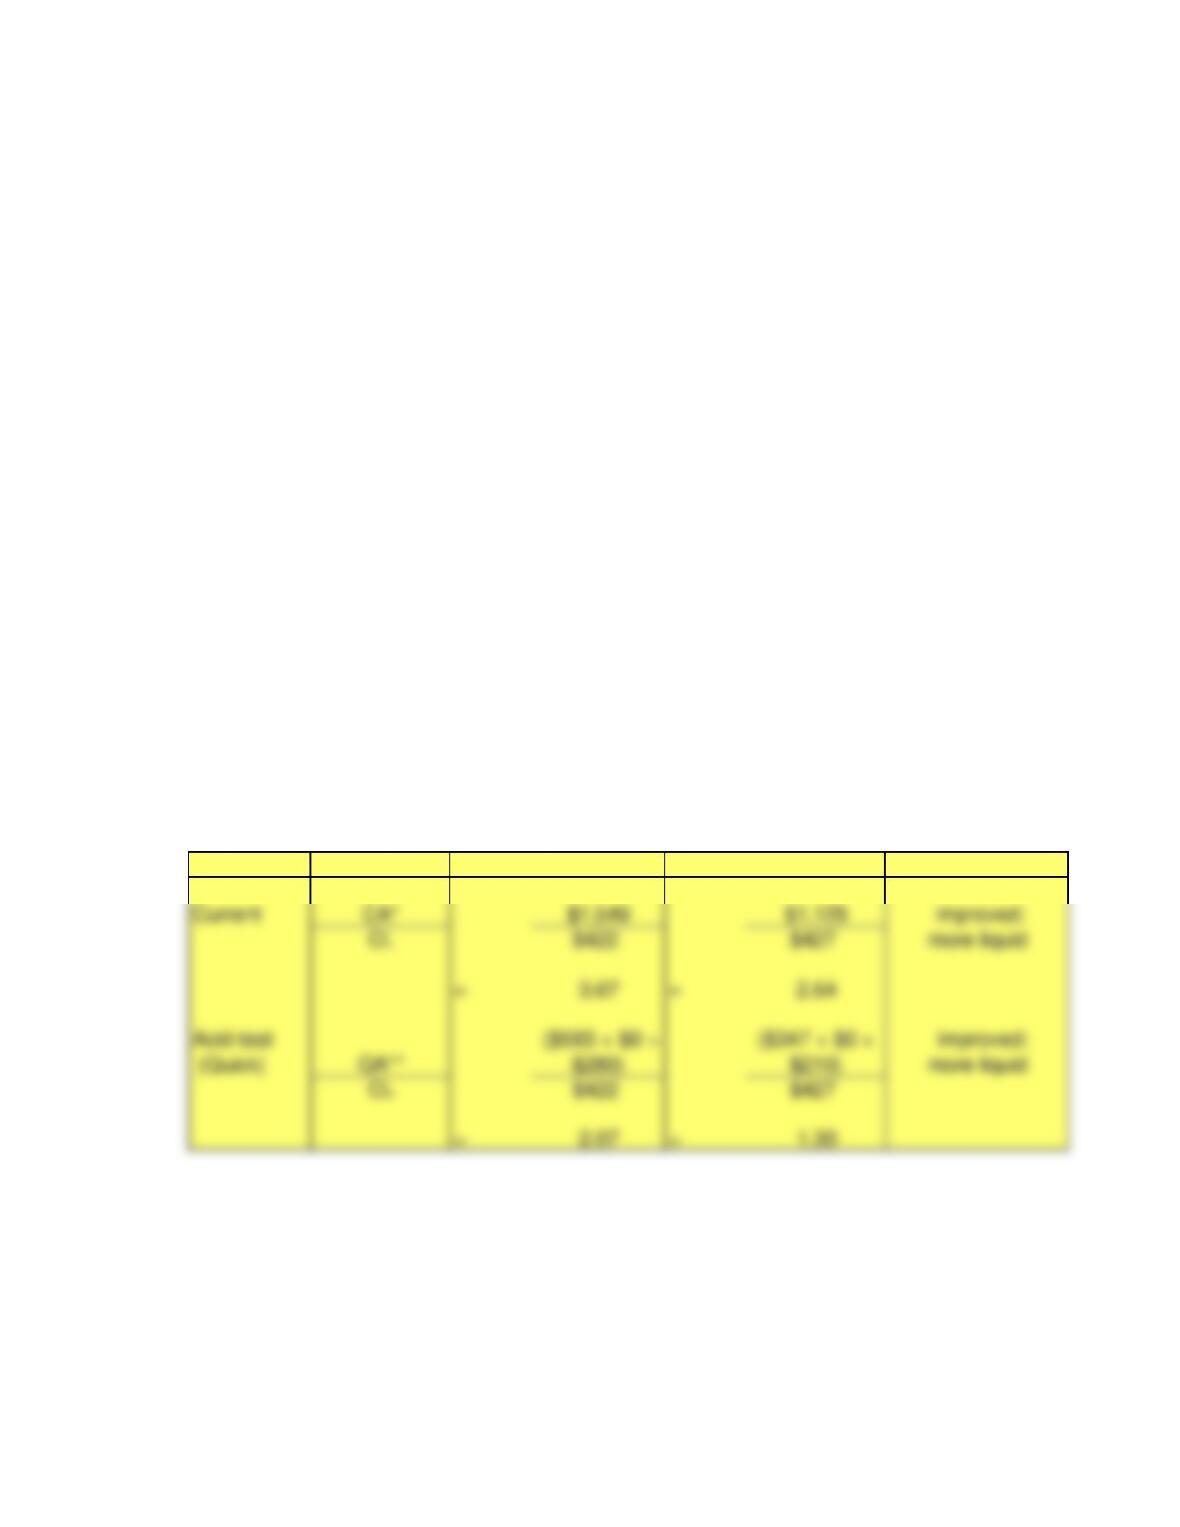
Ratio
Computation 2014 2013
Interpretation
1. Compute ratios for 2013 and 2014 to determine the following for Under Armour, Inc.:
a. The company’s ability to pay its current liabilities. Was 2014 stronger or weaker than 2013?
b. The company’s inventory turnover and days inventory outstanding (DIO); accounts receivable
turnover and days sales outstanding (DSO), accounts payable turnover and days payable
outstanding (DPO), and the number of days in its cash conversion cycle (CCC). 2012 figures for
the company are as follows (in thousands): Accounts receivable (net) $175,524; Inventories
$319,286; Accounts payable $143,689. Was 2014 stronger or weaker than 2013 based on
these measures? (Assume all sales were on account.)
c. The company’s rates of return on sales (ROS), average total assets (ROA), and average
stockholders’ equity (ROE), using DuPont analysis. For computation of averages, use the
following amounts for 2012: total assets 5 $1,157,083; total stockholders’ equity 5 $816,922.
Did these ratios get stronger or weaker in 2014 compared to 2013?
2. Find Under Armour, Inc.’s, annual report for 2015 at http://www.sec.gov. Also perform
research using an Internet site such as MSN Money or Yahoo! Finance to update the
information from question 1. (Challenge)
3. What in your opinion is the company’s outlook for the future? Would you buy the company’s
stock as an investment? Why or why not? (Challenge)
Chapter 13: Financial Statement Analysis Page 82 of 94
FINANCIAL ACCOUNTING – Eleventh Edition Solutions Manual
b.
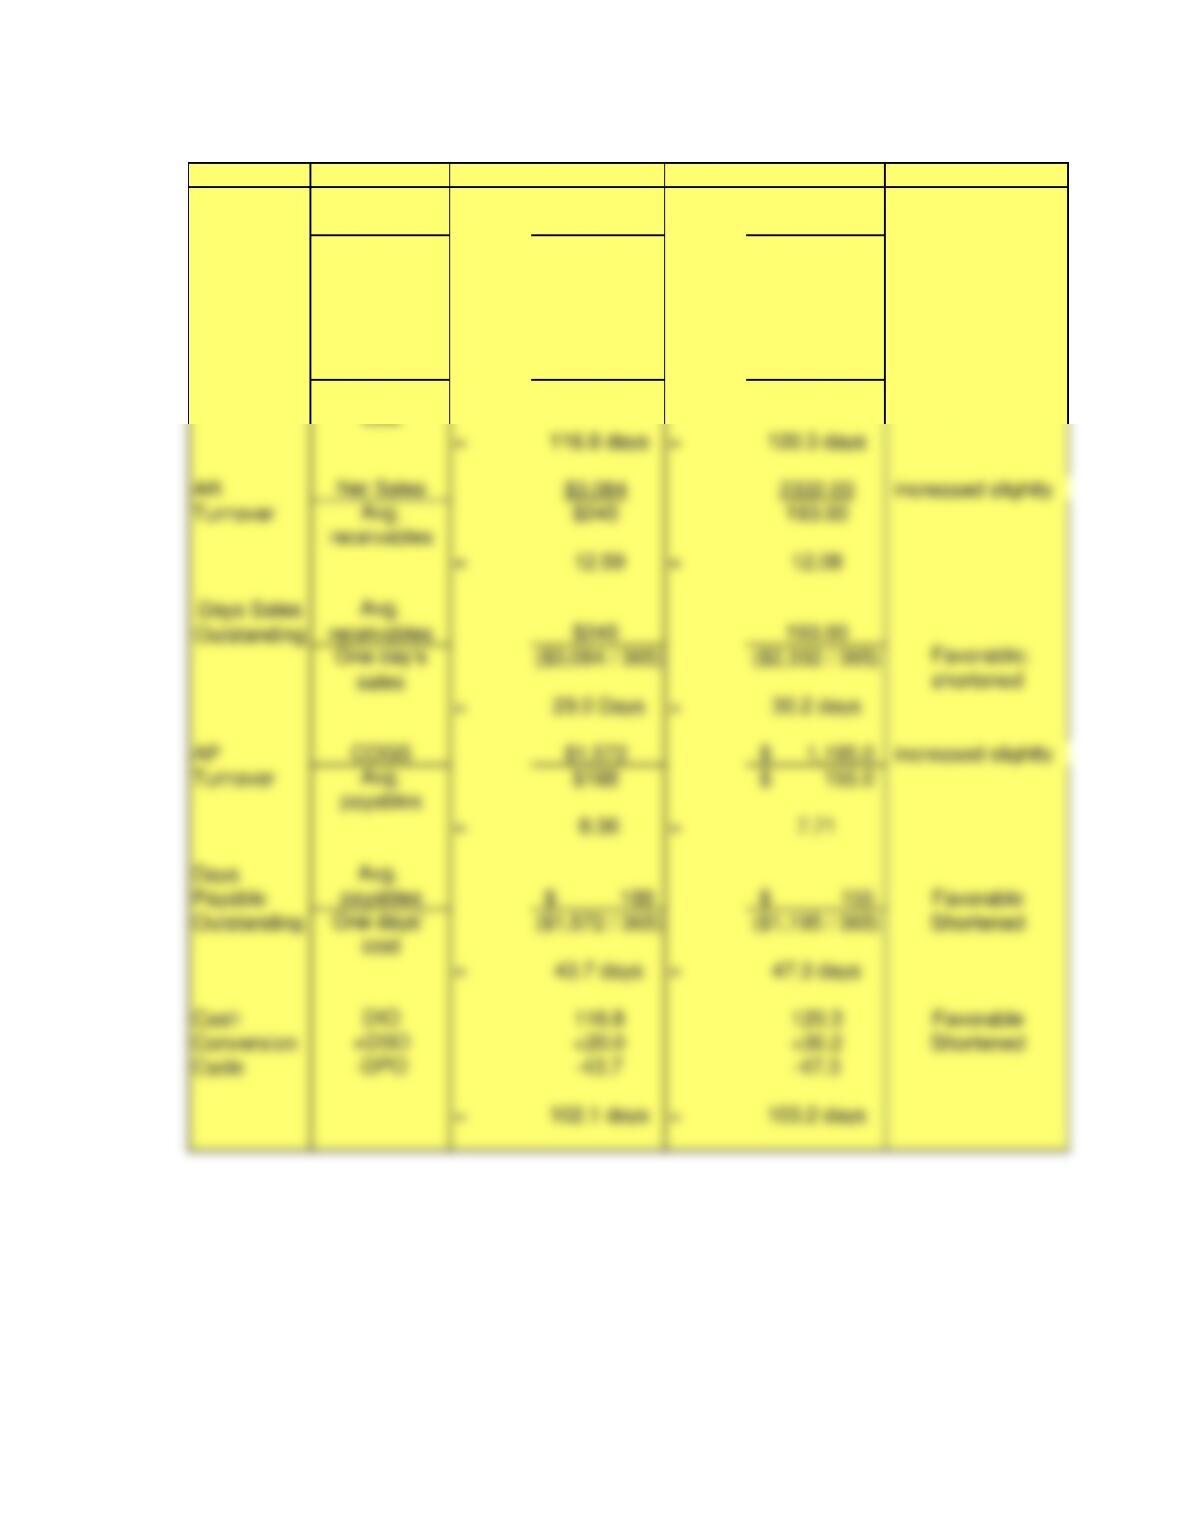
Ratio Computation 2014 2013
COGS $1,572 $1,195
Avg. $503 $394
inventory
=3.13 = 3.03
Avg. Inventory $503 $394
One day’s ($1572 / 365) ($1,195 / 365)
cost
Interpretation
Days
Inventory
Outstanding
favorable;
shortened
Inventory
Turnover
increased
slightly
Chapter 13: Financial Statement Analysis Page 83 of 94
cost
FINANCIAL ACCOUNTING – Eleventh Edition Solutions Manual
c.
Ratio
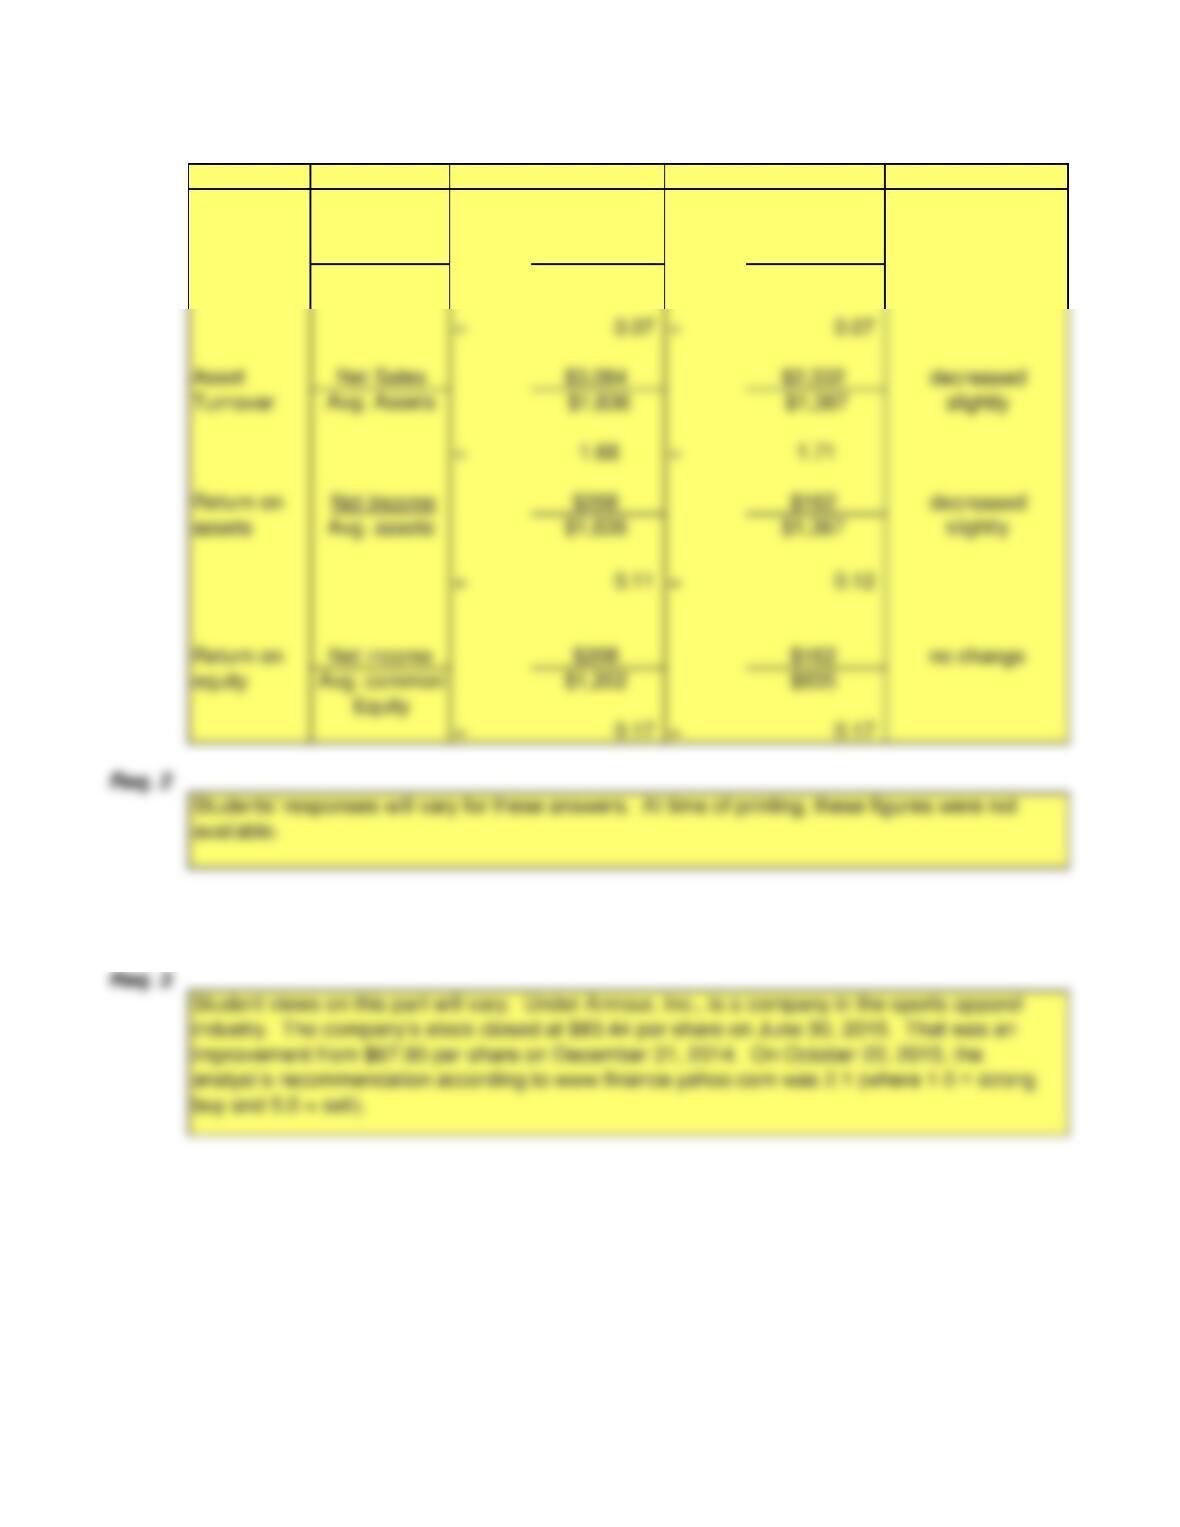
Computation 2014 2013
Net income $208 $162
Net sales $3,084 $2,332
Interpretation
Return
On
Sales
no change
Chapter 13: Financial Statement Analysis Page 84 of 94
Net income $208 $162
no change

FINANCIAL ACCOUNTING – Eleventh Edition Solutions Manual
Group Projects
(2-3 hours)
Student responses will vary on this assignment.
Project 1. Select an industry in which you are interested, and use the leading company
in that industry as the benchmark. Then select two other companies in the same
industry.
For each category of ratios in the Decision Guidelines feature on pages 786–787,
compute at least two ratios for all three companies. Write a two-page report that
compares the two companies with the benchmark company.
Chapter 13: Financial Statement Analysis Page 85 of 94

FINANCIAL ACCOUNTING – Eleventh Edition Solutions Manual
Project 2. Select a company and obtain its financial statements. Convert the income
statement and the balance sheet to common size and compare the company you
selected to the industry average. Risk Management Association’s Annual Statement
Studies, Dun & Bradstreet’s Industry Norms & Key Business Ratios, and Prentice Hall’s
Almanac of Business and Industrial Financial Ratios by Leo Troy publish common-size
statements for most industries. You will find these and other resources in your campus
library and on the Internet.
Chapter 13: Financial Statement Analysis Page 86 of 94
FINANCIAL ACCOUNTING – Eleventh Edition Solutions Manual
Comprehensive Financial Statement Analysis Project
(2-4 hours)
Requirement 1
Solution:
a.
b.
Basic information (provide sources):
a. Using a site such as Yahoo! Finance or Hoover’s Inc., research the discount variety
store industry. List two competitors of Kohl’s Corporation.
b. Describe Kohl’s business and risk factors.
c. List three Kohl’s brands.
d. What is Kohl’s largest asset? Largest liability?
e. How many shares of common stock are authorized? Issued? Outstanding?
f. Did Kohl’s repurchase any shares of common stock during the year? If so, how many?
g. When does Kohl’s record revenue?
h. What inventory method does Kohl’s use?
i. What was Kohl’s bad debt expense for the year?
j. Does Kohl’s have any business interests in foreign countries? Explain your answer.
Two competitors of Kohl’s are Target and J.C. Penney. (Hoovers.com)
b. Kohl’s Corporation operates approximately 1,162 family-orientated department
stores in the United States. Kohl’s sells moderately priced, exclusive and national
brand apparel, footwear, accessories, beauty and home products. Item 1A of Kohl’s
Form 10-K lists the items the company sees as risks. Some of these factors are
The following answers come from the January 31, 2015 year end 10-K of Kohl’s
Corporation.
Chapter 13: Financial Statement Analysis Page 87 of 94
FINANCIAL ACCOUNTING – Eleventh Edition Solutions Manual
Requirement 2
Solution:
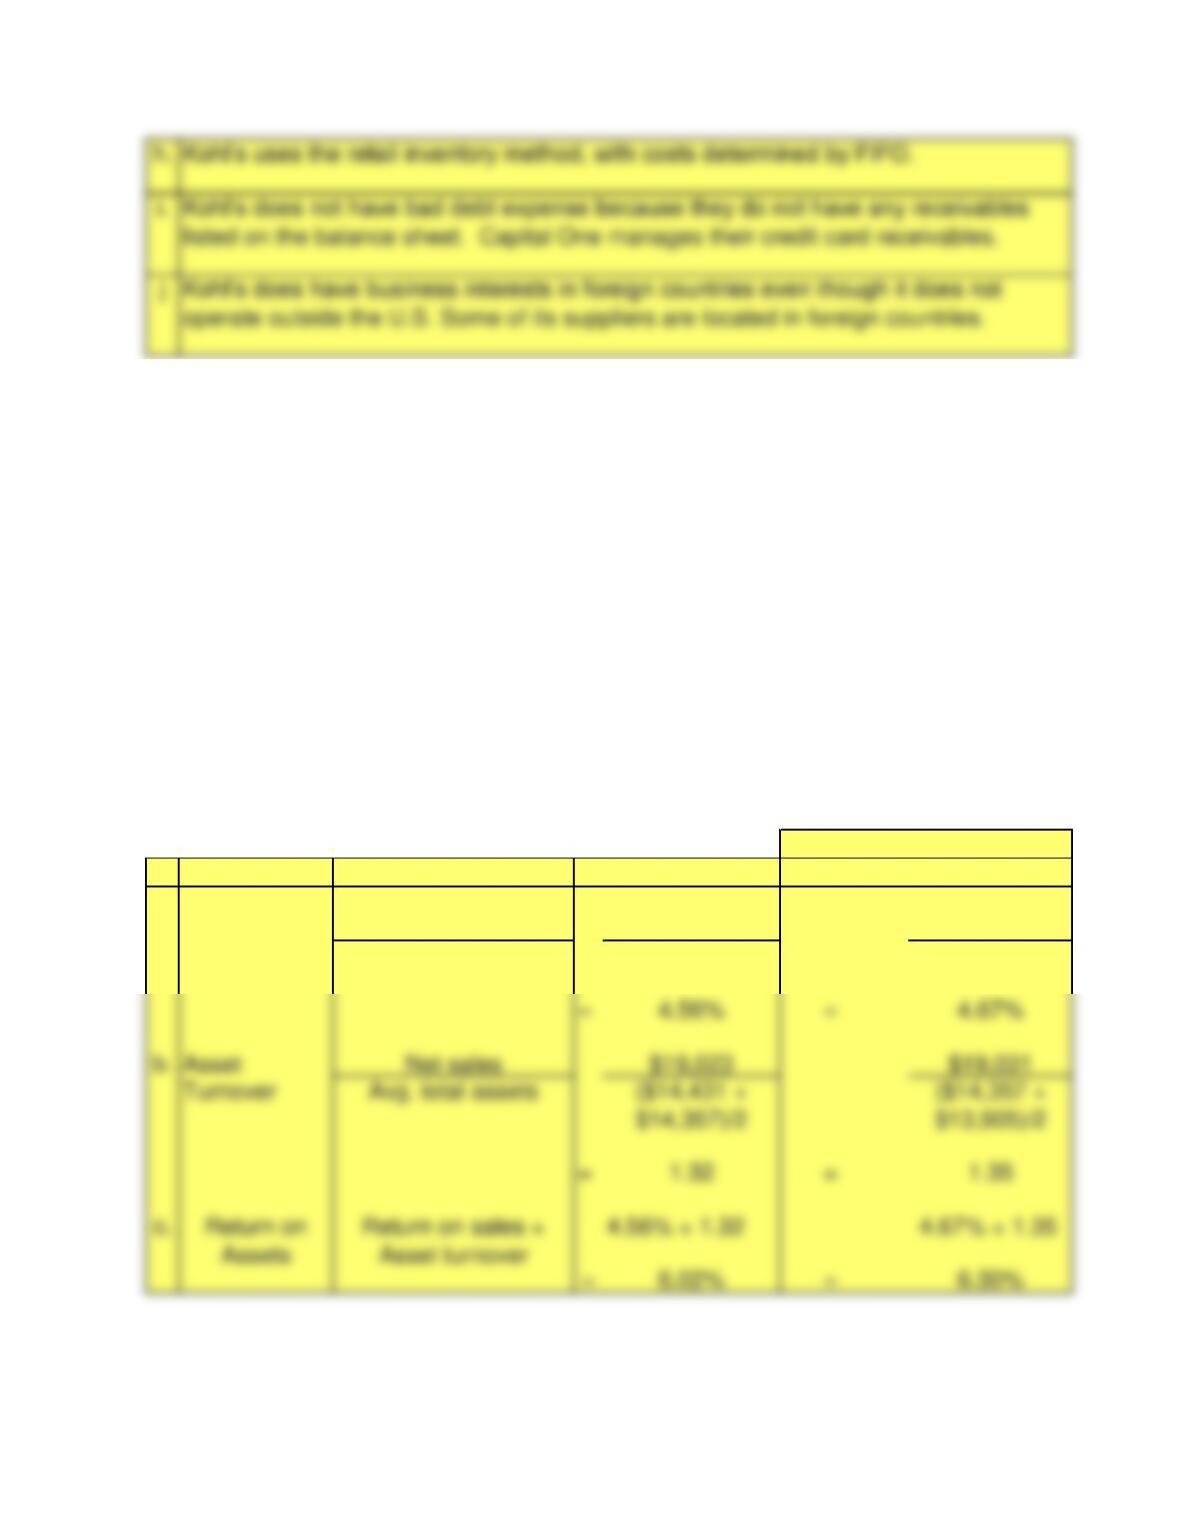
Ratio Computation 2014 2013
a. Return Net income $867 $889
on Sales Net sales $19,023 $19,031
Evaluate profitability. Using information you have learned in the text and elsewhere,
evaluate Kohl’s profitability for 2014 compared with 2013. (Remember that the 2014 year-
end is January 31, 2015.) In your analysis, you should compute the following ratios and
then comment on what those ratios indicate. NOTE: You will have to look up the 10-K for
2013 to obtain total assets and stockholders’ equity for 2012. See http://www.sec.gov.
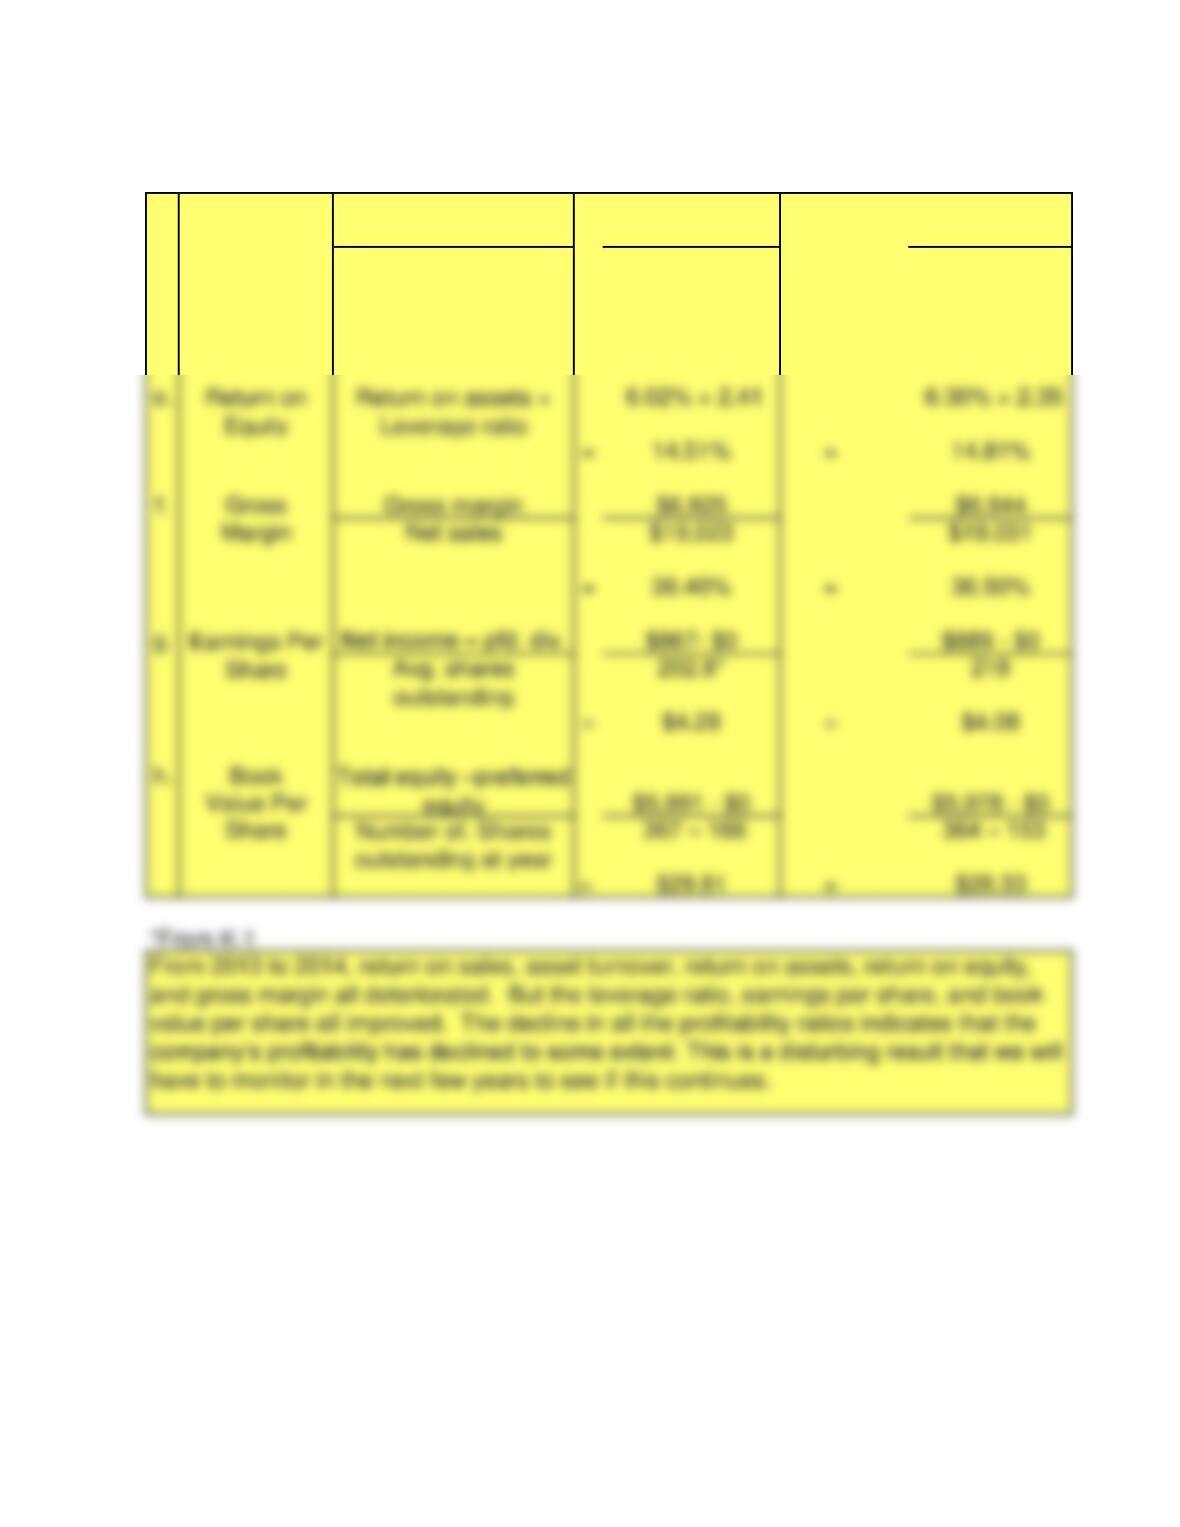
a. Rate of return on sales
b. Asset turnover
c. Return on assets (DuPont model)
d. Leverage ratio
e. Return on equity (DuPont model)
f. Gross margin percentage
g. Earnings per share (show computation)
h. Book value per share
(in millions)
Chapter 13: Financial Statement Analysis Page 88 of 94
b. Asset Net sales $19,023 $19,031
Turnover Avg. total assets
FINANCIAL ACCOUNTING – Eleventh Edition Solutions Manual
d.
Avg. equity
= 2.41 = 2.35
($5,991 +
$5,978)/2
Leverage
Ratio
Avg. total assets
($14,357 +
$13,905)/2
($14,431 +
$14,357)/2
($5,978 +
$6,048)/2
Chapter 13: Financial Statement Analysis Page 89 of 94
FINANCIAL ACCOUNTING – Eleventh Edition Solutions Manual
Requirement 3
Solution:
Ratio Computation 2014 2013
a. Cost of goods sold $12,098 $12,087
Avg. inventory
($3,814 +
$3,874)/2
($3,874 +
$3,748)/2
Evaluate the company’s ability to sell inventory and pay debts during 2014 and 2013.
You should note that the company does not hold traditional accounts receivable because
it sells all of its receivables to Capital One, which is a credit card company. Therefore, it
is impossible to compute accounts receivable turnover and days sales to collection.
However, in your analysis, you should compute the following ratios and then comment on
what those ratios indicate. Since the 2014 annual report includes only the balance sheets
for 2014 and 2013, you will need to look up the 10-K for 2013 for information about 2012
inventory and accounts payable.
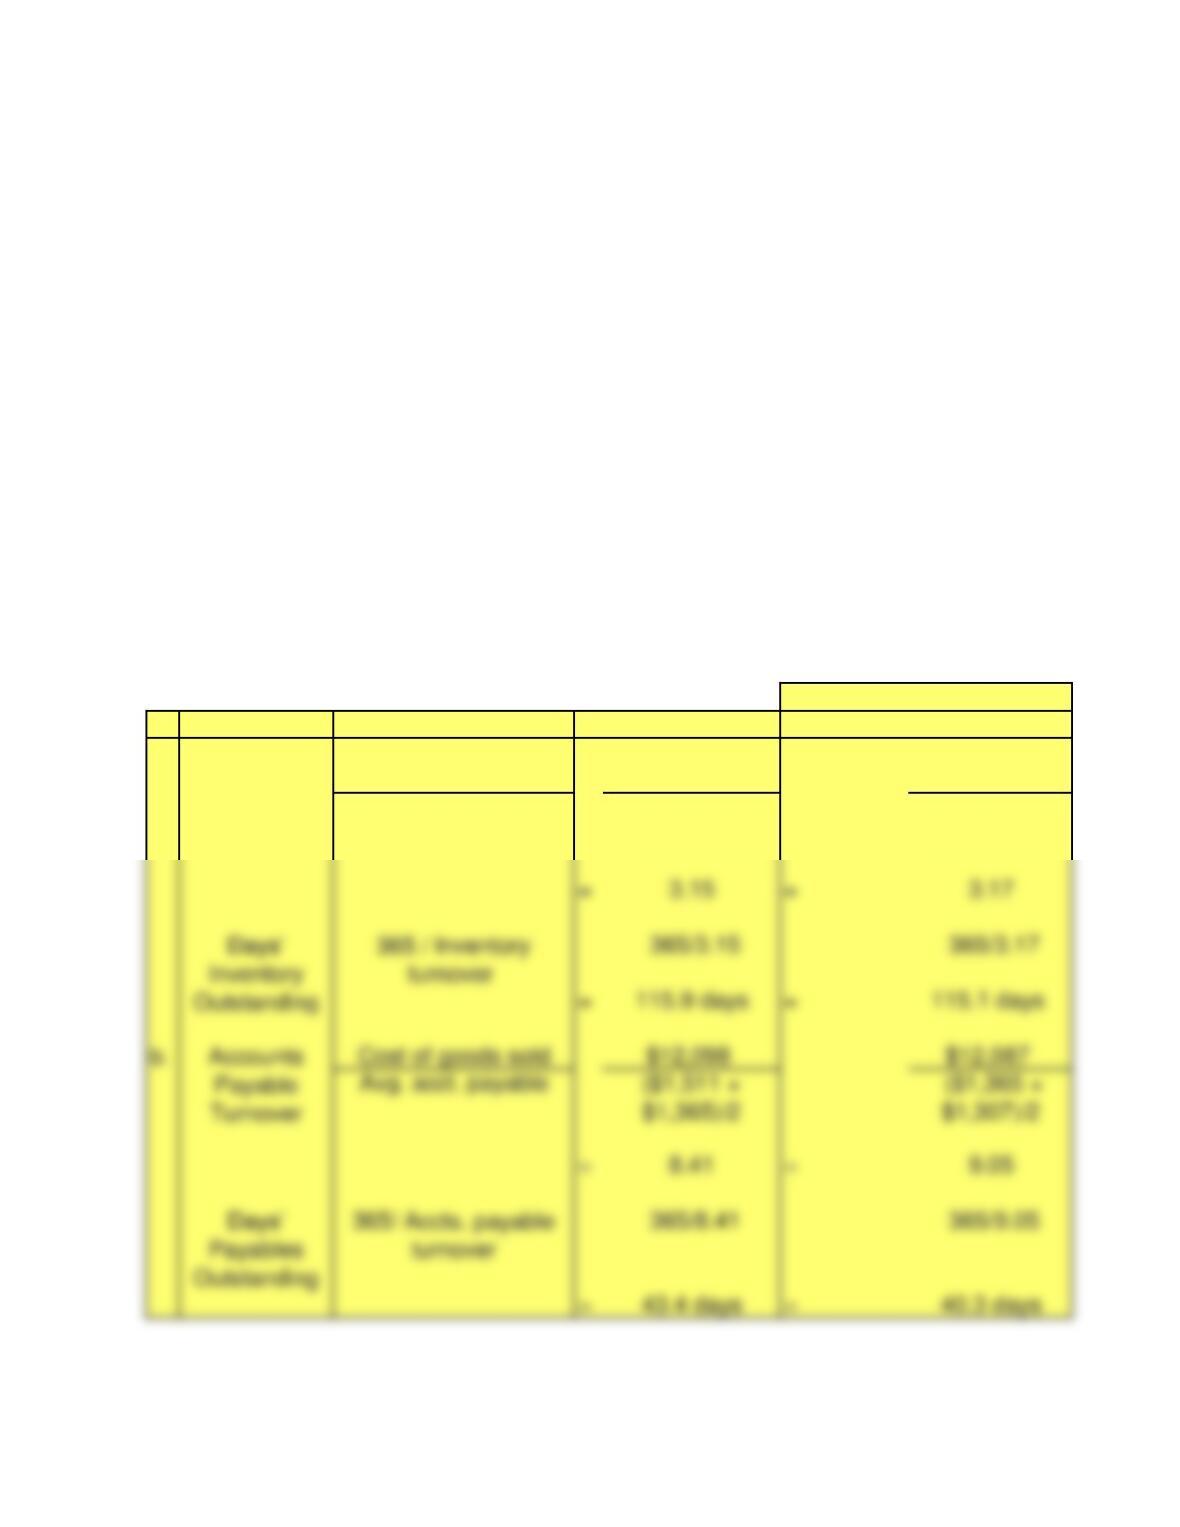
a. Inventory turnover and days’ inventory outstanding (DIO)
b. Accounts payable turnover and days’ payable outstanding (DPO)
c. Cash conversion cycle (DIO-DPO)
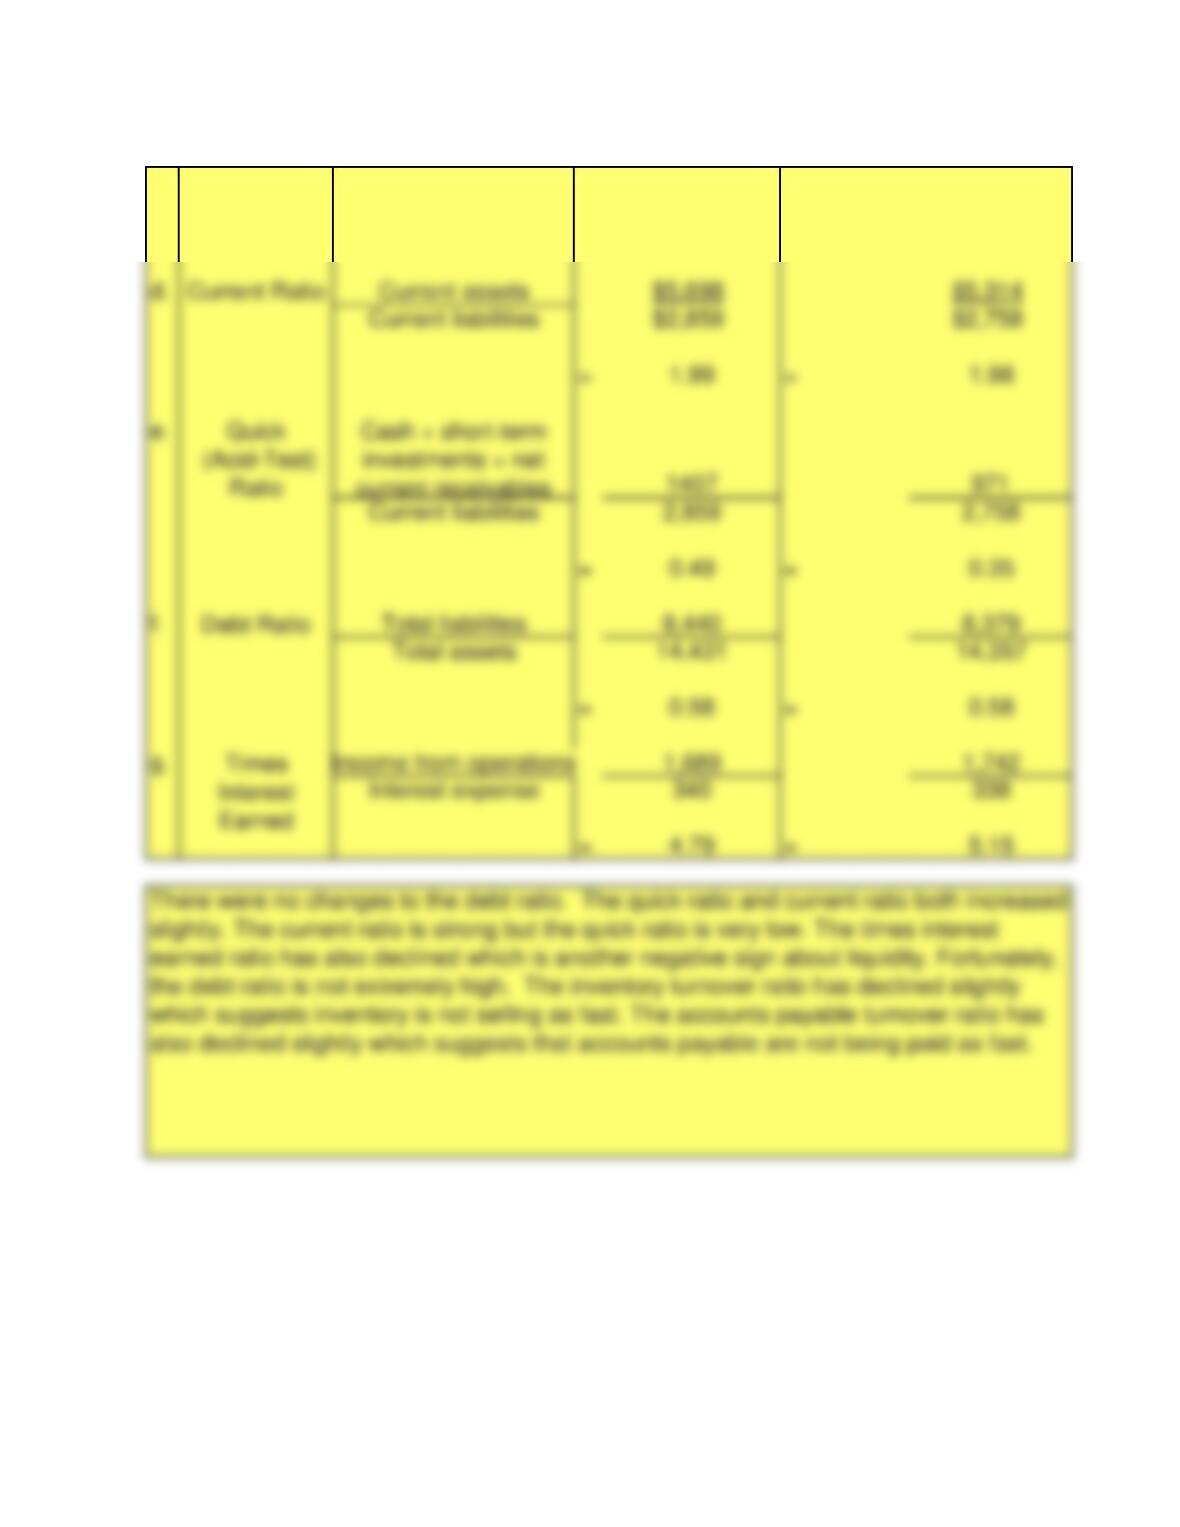
d. Current ratio
e. Quick (acid-test) ratio
f. Debt ratio
g. Times interest earned
Inventory
Turnover
(In Millions)
Chapter 13: Financial Statement Analysis Page 90 of 94
FINANCIAL ACCOUNTING – Eleventh Edition Solutions Manual
c.
DIO – DPO 115.9 – 43.4 115.1 – 40.3
=72.5 days =74.8 days
Cash
Conversion
Cycle
Chapter 13: Financial Statement Analysis Page 91 of 94
FINANCIAL ACCOUNTING – Eleventh Edition Solutions Manual
Requirement 4
Solution:
a.
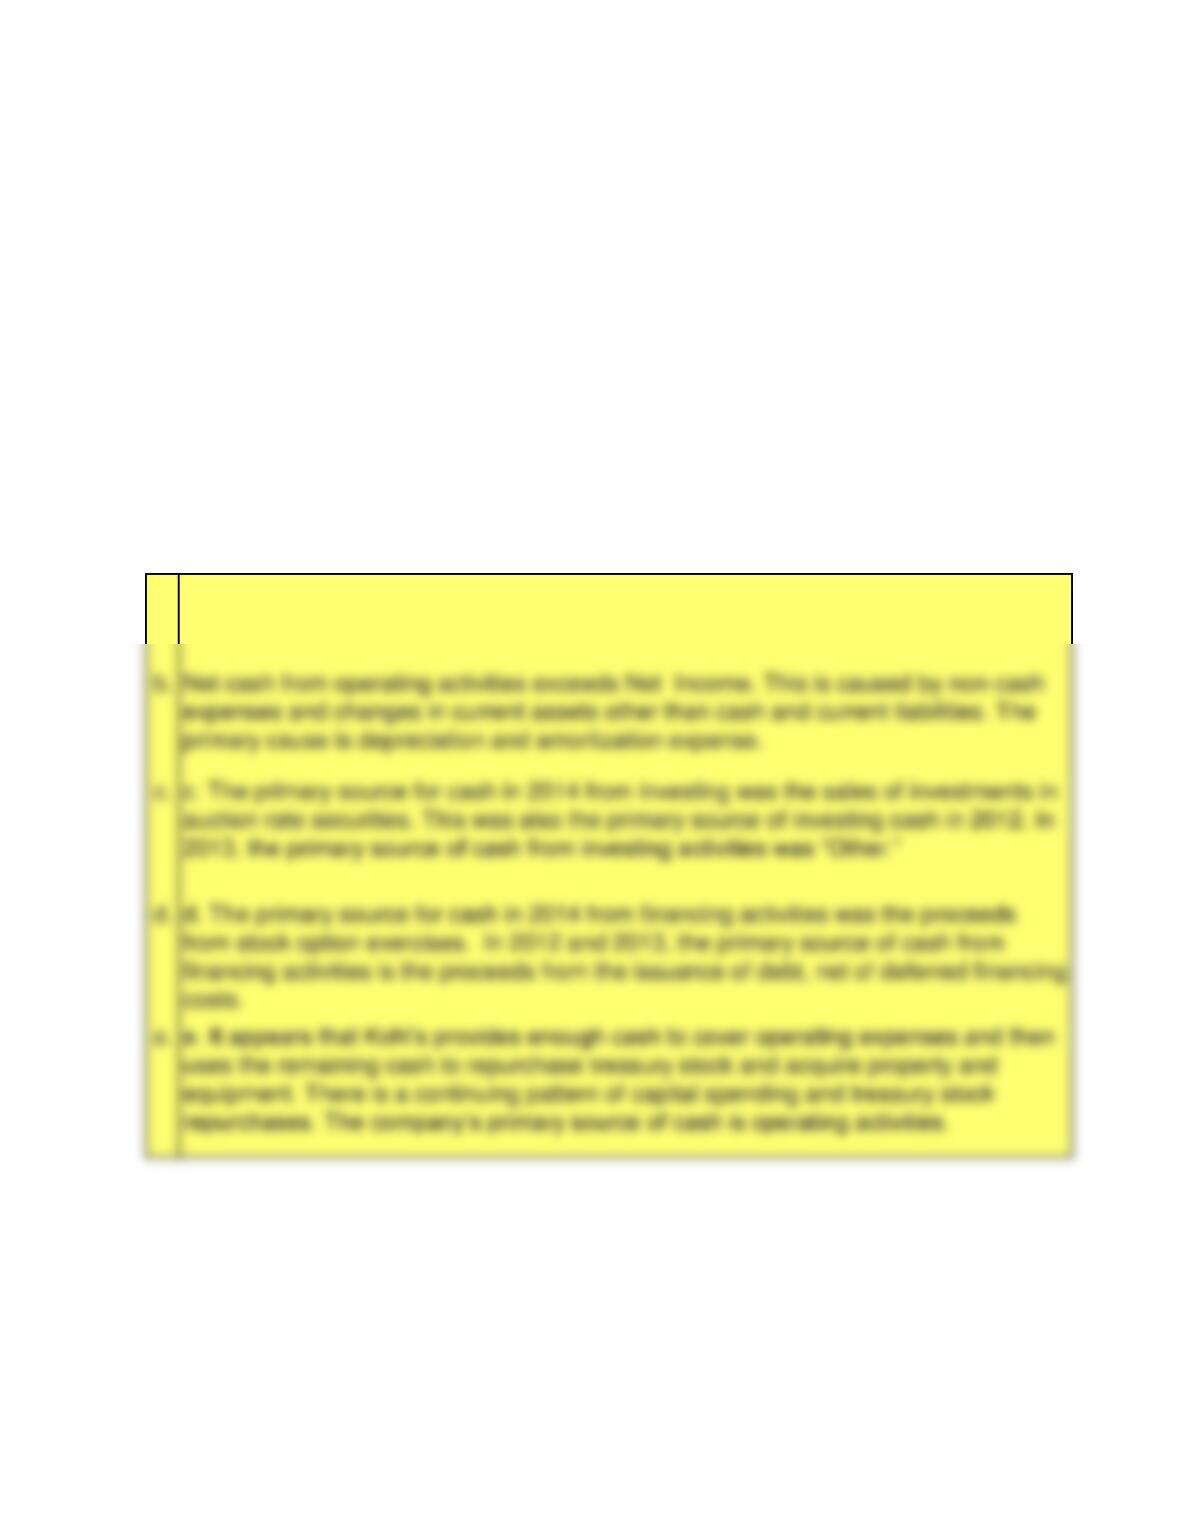
The two main sources of cash for Kohl’s were Net Income and Depreciation and
Amortization, which is actually a non-cash expense so it is added back to Net Income.
Evaluate Kohl’s cash flow.
a. For 2014, what are Kohl’s two main sources of cash?
b. For 2014, is Kohl’s net cash flow from operations greater than or less than net
income? What is the primary cause of the difference?
c. For 2014, what is the primary source of cash from investing activities? Is this the same
as in 2013 and 2012? If not, state the primary source(s) of cash from investing activities
in 2013 and 2012.
d. For 2014, what is the primary source of cash from financing activities? Is this the same
as in 2013 and 2012? If not, state the primary source(s) of cash from financing activities
in 2013 and 2012.
e. What trend(s) do you detect from this analysis?
Chapter 13: Financial Statement Analysis Page 92 of 94
b.
d.
e.
FINANCIAL ACCOUNTING – Eleventh Edition Solutions Manual
Requirement 5
Solution:
a. 2014 2013 2011
Net sales 100% 100% 100%
Gross Margin 36.4% 36.5% 38.2%
2012
100%
36.3%
Other financial analysis.
a. Compute common-size percentages for sales, gross profit, operating income, and net
income for 2011–2014. Comment on your results.
b. Find the selected financial data in the 10-K where Kohl’s reports selected information
since 2011. Compute trend percentages, using 2011 as the base year, for total revenues
and net earnings. Comment on your results.
Chapter 13: Financial Statement Analysis Page 93 of 94
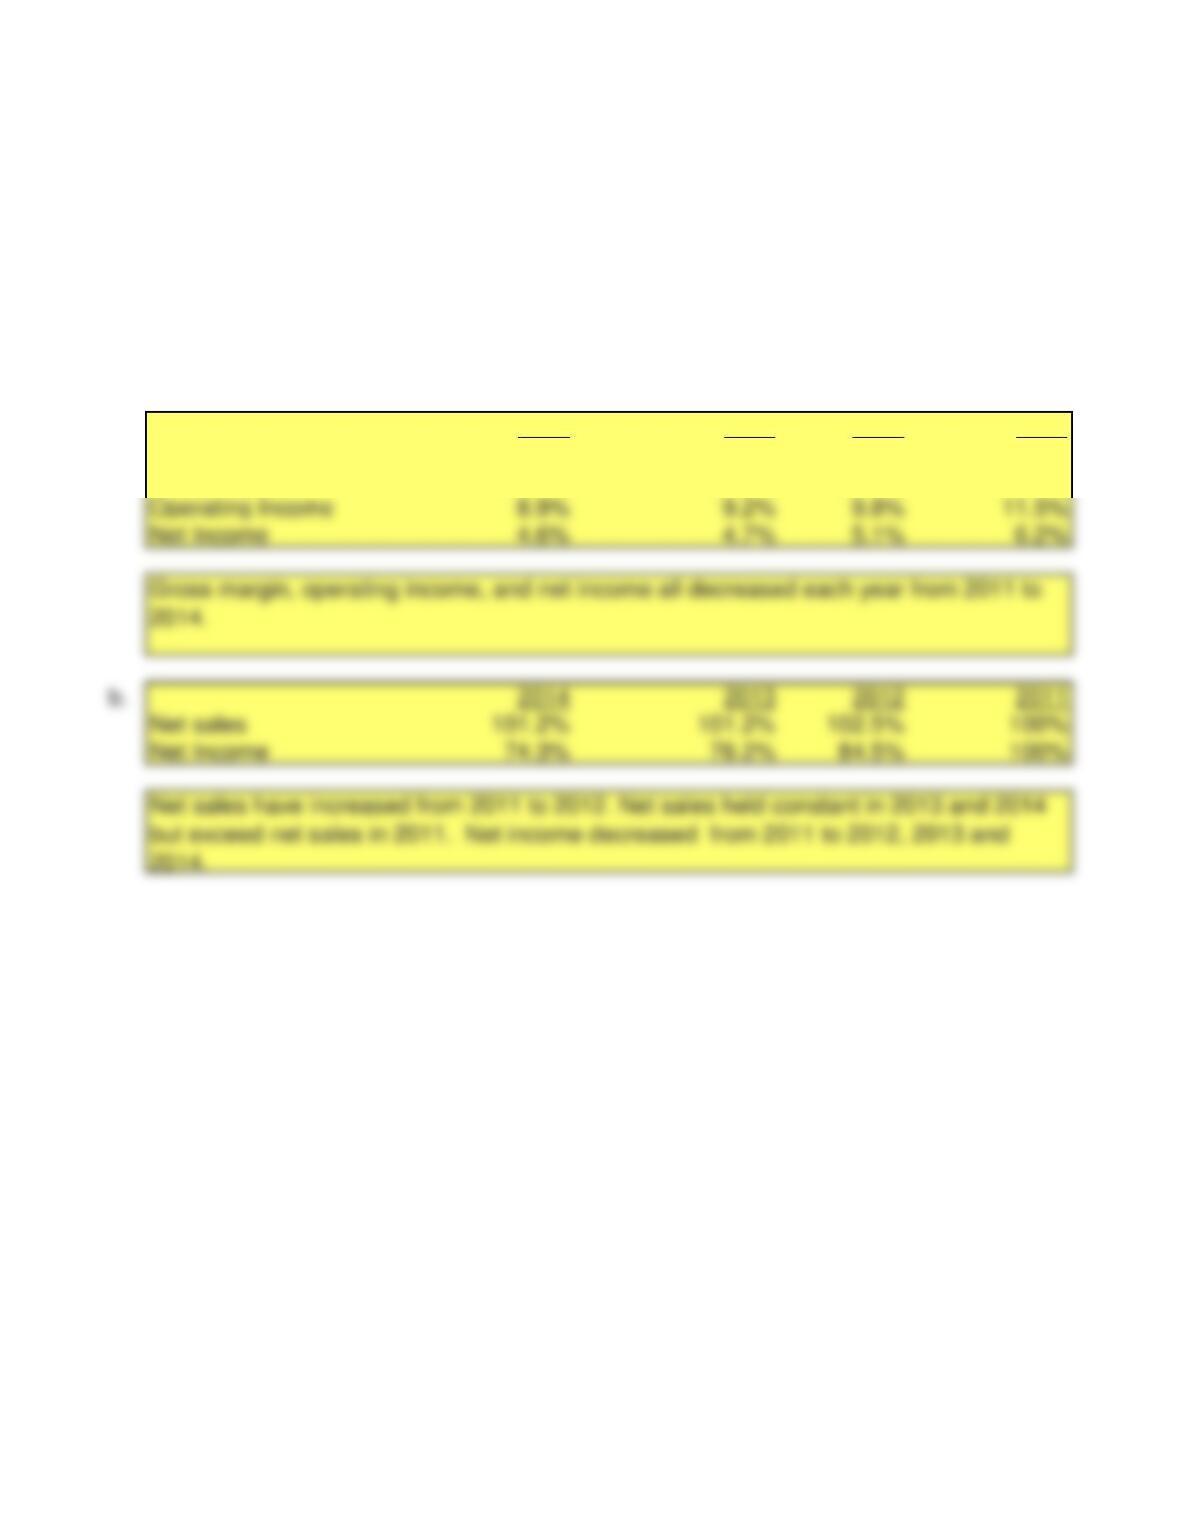
Net Income 4.6% 4.7% 6.2%
b. 2014 2013 2011
Net sales 101.2% 101.2% 100%
Net Income 74.3% 76.2% 100%
84.5%
2012
FINANCIAL ACCOUNTING – Eleventh Edition Solutions Manual
Requirement 6
Solution:
a.
Evaluate Kohl’s Corporation stock as an investment.
a. What was the closing market price of Kohl’s Corporation stock on February 2, 2015,
the next trading day after the balance-sheet date of January 31, 2015?
b. Compute the price-earnings ratio using your EPS calculation and the market price you
just determined.
c. Assume that Kohl’s Corporation’s weighted-average cost of capital, and therefore, the
relevant capitalization rate for projected earnings from operations, is 8%. Using the
methods you learned in Chapter 11, calculate a projected value of Kohl’s Corporation as
of February 2, 2015. Compare that calculated value with the company’s market
capitalization (market cap) as of that date. Based on comparison of these two
computations, would you evaluate the company’s stock as a “buy,” “hold,” or “sell”? State
your reasons. Now compare the price of the stock as of the date you are making this
evaluation (it will be later than February 2, 2015) with the price as of February 2, 2015. In
retrospect, would your decision using the data as of February 2, 2015 have been a wise
one? State your reasons.
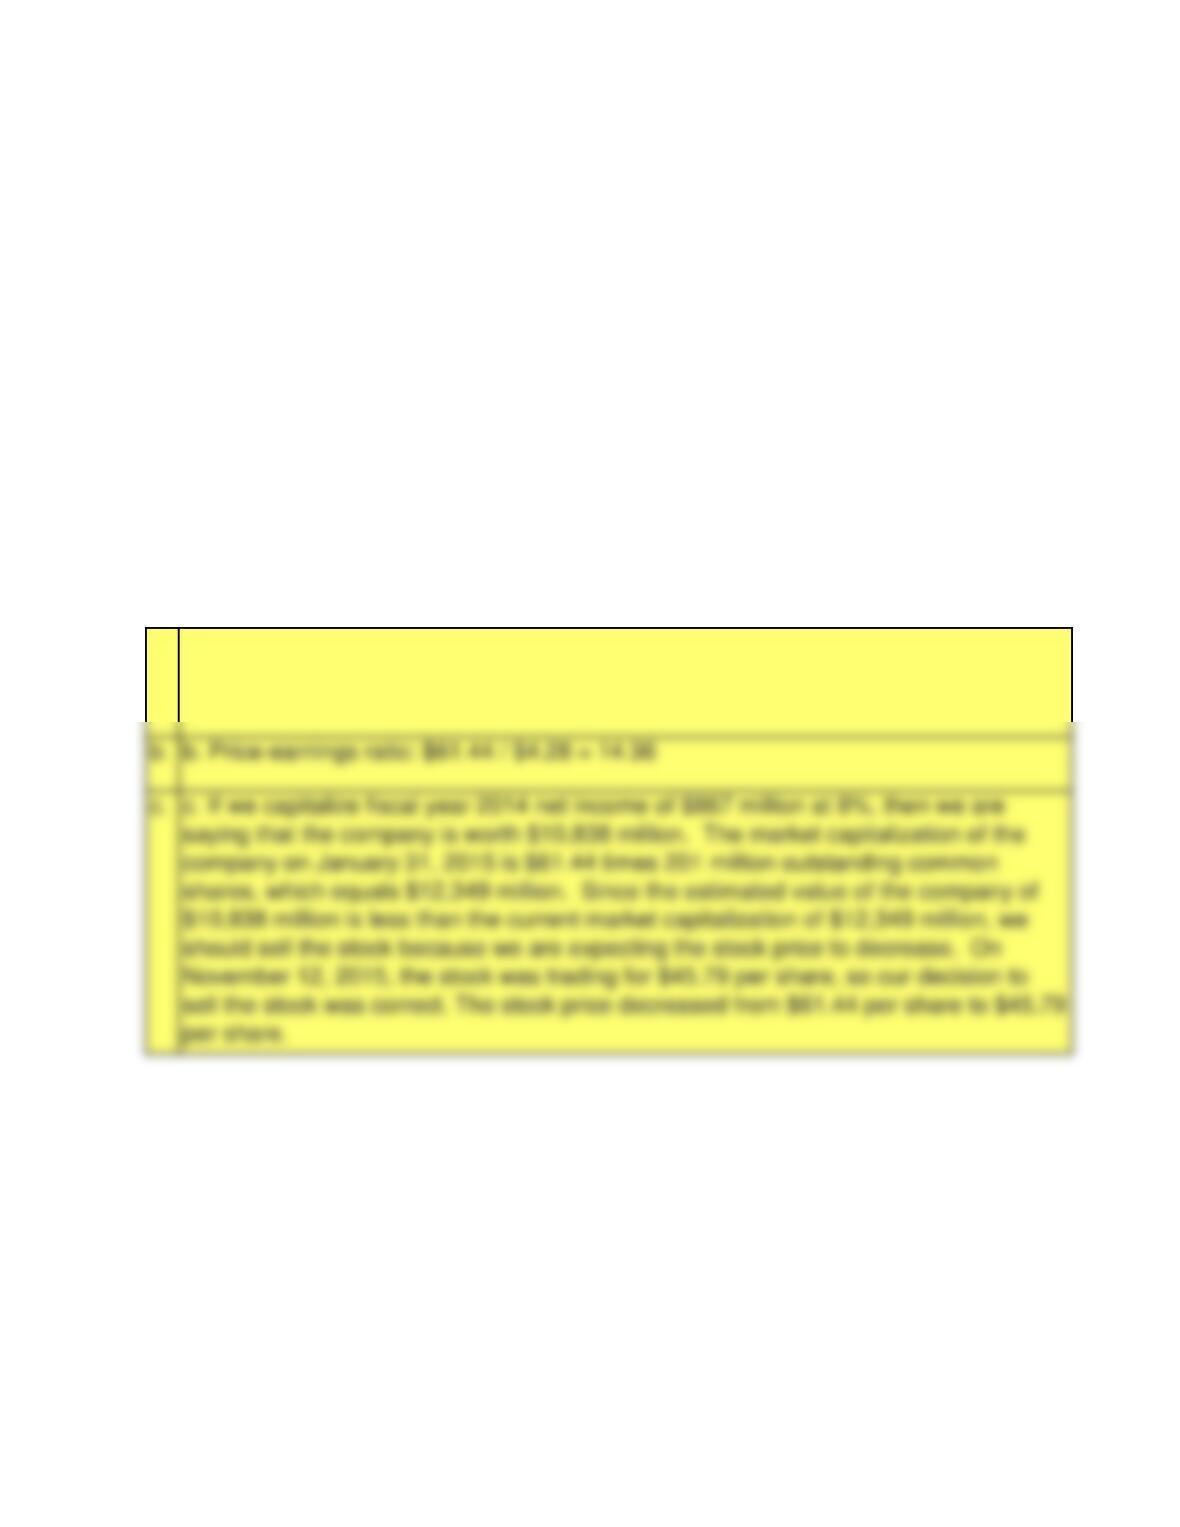
a. The closing market price of Kohl’s stock on the balance sheet date, January 31,
2015 is $61.44.
Chapter 13: Financial Statement Analysis Page 94 of 94
b.