
CHAPTER 13
THE BALANCED SCORECARD:
STRATEGIC-BASED CONTROL
DISCUSSION QUESTIONS
1. A strategic-based responsibility accounting
system converts an organization’s mission
and strategy into operational objectives and
measures for four perspectives: the financial
perspective, the customer perspective, the
process perspective, and the learning and
growth perspective. It differs from activity-
based responsibility accounting because of
the formal linkage to strategy and because it
adds two perspectives to the responsibility
dimension: the customer perspective and
the learning and growth perspective.
2. A Balanced Scorecard is a strategic-based
performance management system that
translates an organization’s vision and strat-
egy into operational objectives and
measures for four perspectives: financial,
customer, process, and learning and growth.
3. Balanced measures mean that the strategic
measures used are made up of a proper mix
of integrated financial and nonfinancial
measures that are both predictive and his-
torical and which may be subjective or ob-
jective in nature.
4. Lag measures reflect what has happened.
Lead measures are factors that drive future
performance.
5. Objective measures are quantifiable and
verifiable. (Verifiable means that the values
are the same from one person to the next.)
Subjective measures are less quantifiable
and more judgmental in nature (indicating
that their values can vary from one person to
the next).
6. Stretch targets are targets that are set at
levels that, if achieved, will transform the or-
ganization within three to five years. Their
strategic purpose is to bring the organization
to the level envisioned by the strategy.
7. A strategic-based reward system is designed
to encourage and support the implementation
of the organization’s strategy. Rewards are
offered for both financial and nonfinancial
performance. (Traditional rewards are mostly
tied to financial performance.)
8. The three strategic themes of the financial
perspective are revenue growth, cost reduc-
tion, and asset utilization.
9. The five core objectives of the customer
perspective are market share, customer
retention, customer acquisition, customer
satisfaction, and customer profitability.
10. The long-wave of value creation means antic-
ipating the emerging and potential needs of
customers and creating new products and
processes to satisfy those needs. The short-
wave of value creation is producing and
delivering existing products to customers.
11. The three processes of the process value
chain are the innovation process, the
operations process, and the post-sales
service process. The innovation process
anticipates the emerging and potential
needs of customers and creates new
products and services to satisfy those
needs. The operations process produces
and delivers existing products and services
to customers. The post-sales service
process provides critical and responsive
services to customers after the product or
service has been delivered.
12. Three objectives of the learning and growth
perspective are to increase employee capa-
bilities; to increase motivation, empower-
ment, and alignment; and to increase
information systems capabilities.
13. A testable strategy is a set of linked objec-
tives aimed at an overall goal that can be
restated into a sequence of cause-and-effect
hypotheses.

13-2
14. Double-loop feedback is information that
deals with both the effectiveness of strategy
implementation and the validity of the as-
sumptions underlying the strategy.
15. Communication, incentives, and resource
allocation are three methods that promote
strategic alignment. To internalize the strat-
egy, employees must be fully informed and
aware of how their actions affect the strate-
gy. Rewards must be tied to the strategic
measures, and resources must be allocated
to fund the strategic initiatives.

13-3
CORNERSTONE EXERCISES
Cornerstone Exercise 13.1
1. Actual cycle time = 60 minutes/160 units = .375 minutes per unit
2. Theoretical cycle time = 60 minutes/300 units = 0.2 minutes per unit
3. Actual cycle time = 60 minutes/220 units = .27 minutes (rounded)
Cornerstone Exercise 13.2
1. Process time = 60 minutes – 20 minutes – 18 minutes – 12 minutes
MCE = Process time /(Process time + Move time + Inspection time + Rework
time)
2. Theoretical cycle time = 10 minutes/100 units = 0.10 minute
Actual cycle time = 60 minutes/100 units = 0.60 (includes theoretical cycle
time plus the waste)
3. New waste = (0.60)(20 minutes + 18 minutes + 12 minutes) = 30 minutes
Cornerstone Exercise 13.3
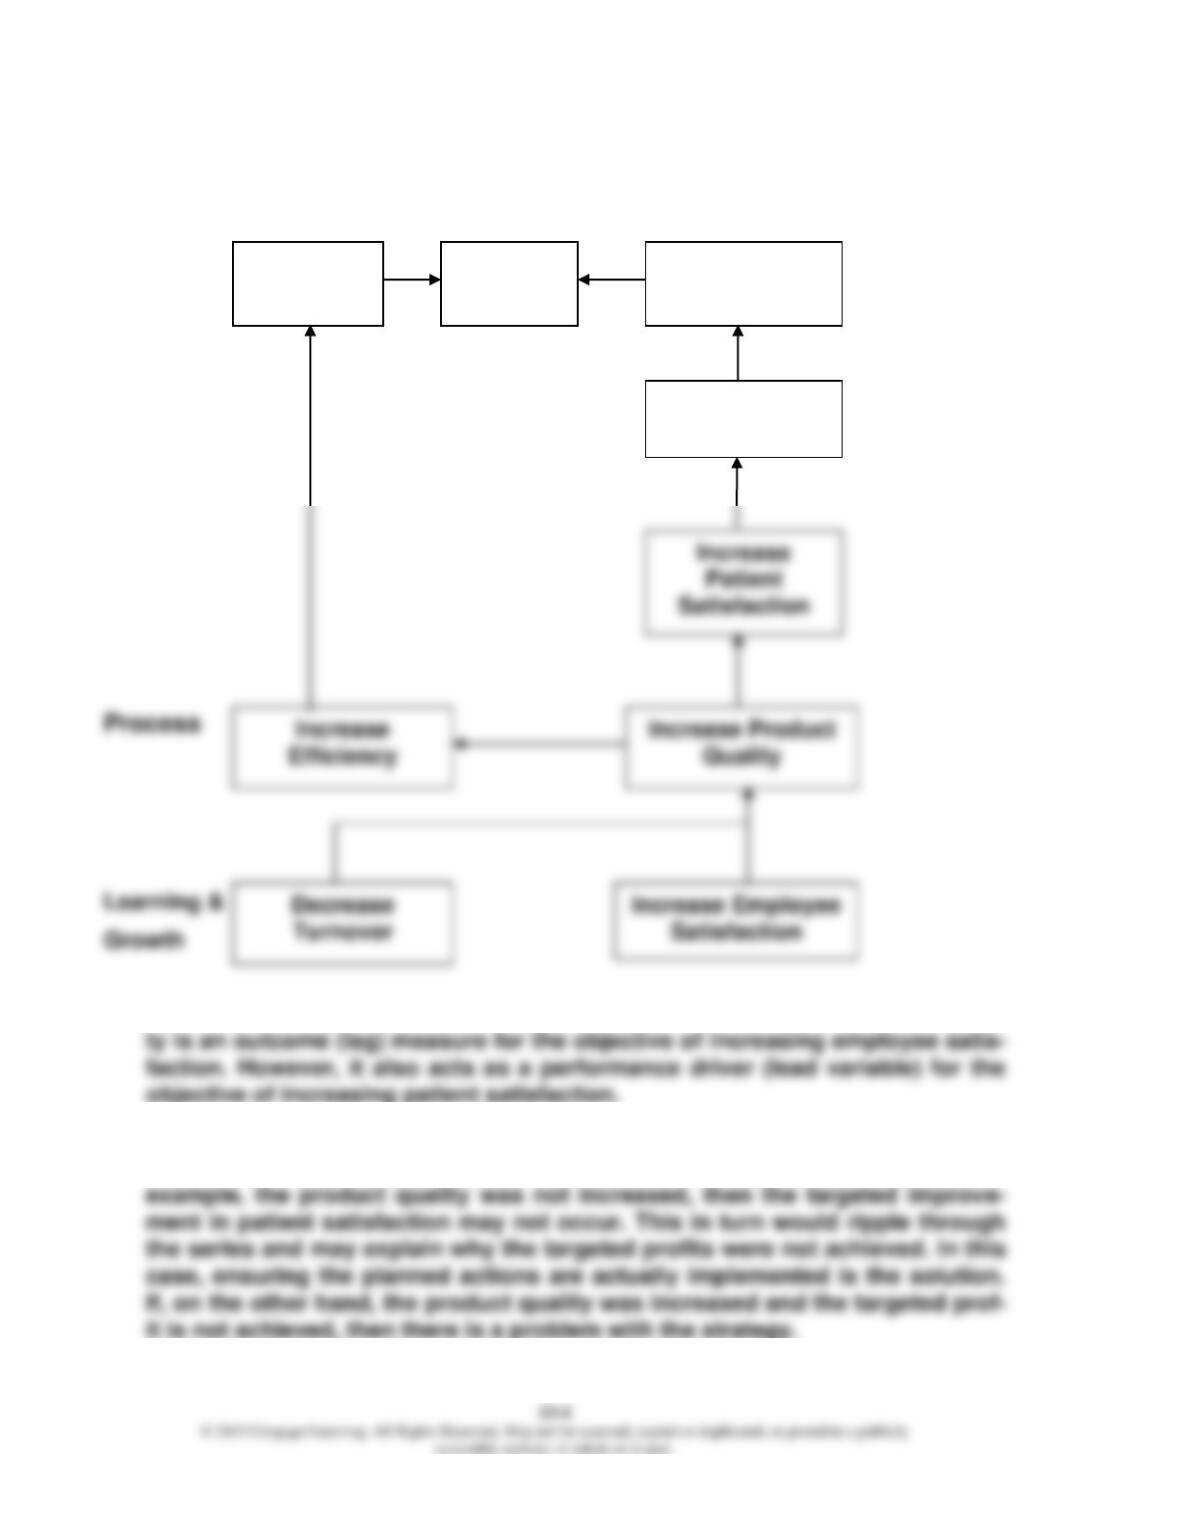
1. Strategy Map
Financial
Customer
2. Consider the objective of increasing product quality. Increased product quali-
3. Assuming that the strategy is valid, increasing the targeted profit is depend-
ent on achieving the targeted values of all the preceding lead variables. If, for
Decrease
Costs
Increase
Profits
Increase
Market Share
Increase
Revenues
13-5
EXERCISES
Exercise 13.4
A strategic-based system adds direction to improvement efforts by tying respon-
Exercise 13.5
1. Scorecard measures differ because they are integrated. Strategy is the basis
for integration. This means they are derived from, support, and describe the
2. A historical measure is a lag measure—it measures an outcome—something
Exercise 13.6
1. Change is brought about by establishing stretch targets that are set at levels
which, if achieved, will transform the organization. These targets are set for
2. Double-loop feedback is the means by which strategy effectiveness and via-
bility are tested. A strategy can be expressed as a series of if-then statements
based on causal relations. If the outcome occurs as predicted, then evidence

13-6
Exercise 13.7
a. Financial, Financial, Objective, External
b. Customer, Nonfinancial, Subjective, External
c. Process (innovation), Nonfinancial, Objective, Internal
Exercise 13.8
1. Theoretical rate = $12,960,000/1,440,000 = $9.00 per minute
Theoretical conversion cost per unit = $9.00 × 65 = $585
3. An incentive exists to reduce product cost by reducing cycle time. For exam-
ple, current cycle time is 100 minutes per unit. If cycle time could be reduced
to 75 minutes per unit, conversion costs would be reduced from $900 per unit

13-7
Exercise 13.9
1. Velocity (theoretical) = 243,000/60,750 = 4 laptops per hour
2. Conversion cost rate = $7,290,000/(60,750 × 60) = $2.00 per minute
Assignment per unit (theoretically) = $2.00 × 15 minutes
= $30, or $7,290,000/243,000
Exercise 13.10
1. If the plant layout is improved, then wait time and move time will decrease; if
2. MCE of 75 percent implies the following ratio: 15/20, which implies that move
time and wait time have been reduced to zero (leaving rework time of five
minutes as the source of inefficiency). The expected conversion cost per unit
13-8
Exercise 13.11
1. Lead indicators make things happen—they are the things that enable
outcome measures to be achieved. Some measures may act as both lead and
lag indicators. This exercise illustrates and emphasizes that it is very difficult
to classify measures as lead or lag without expressing the underlying strate-
gy as a series of if-then statements: if A, then B; if B, then C; etc., helps
2. It is interesting to note that learning and growth indicators come at the begin-
ning of the strategy map and that indicators from the financial perspective
3. Double-loop feedback provides information about both effectiveness and via-
bility. If employee capabilities do not improve, then it could be due to one of
two reasons: (1) The targeted value for employee capabilities (e.g., number of
13-9
Exercise 13.12
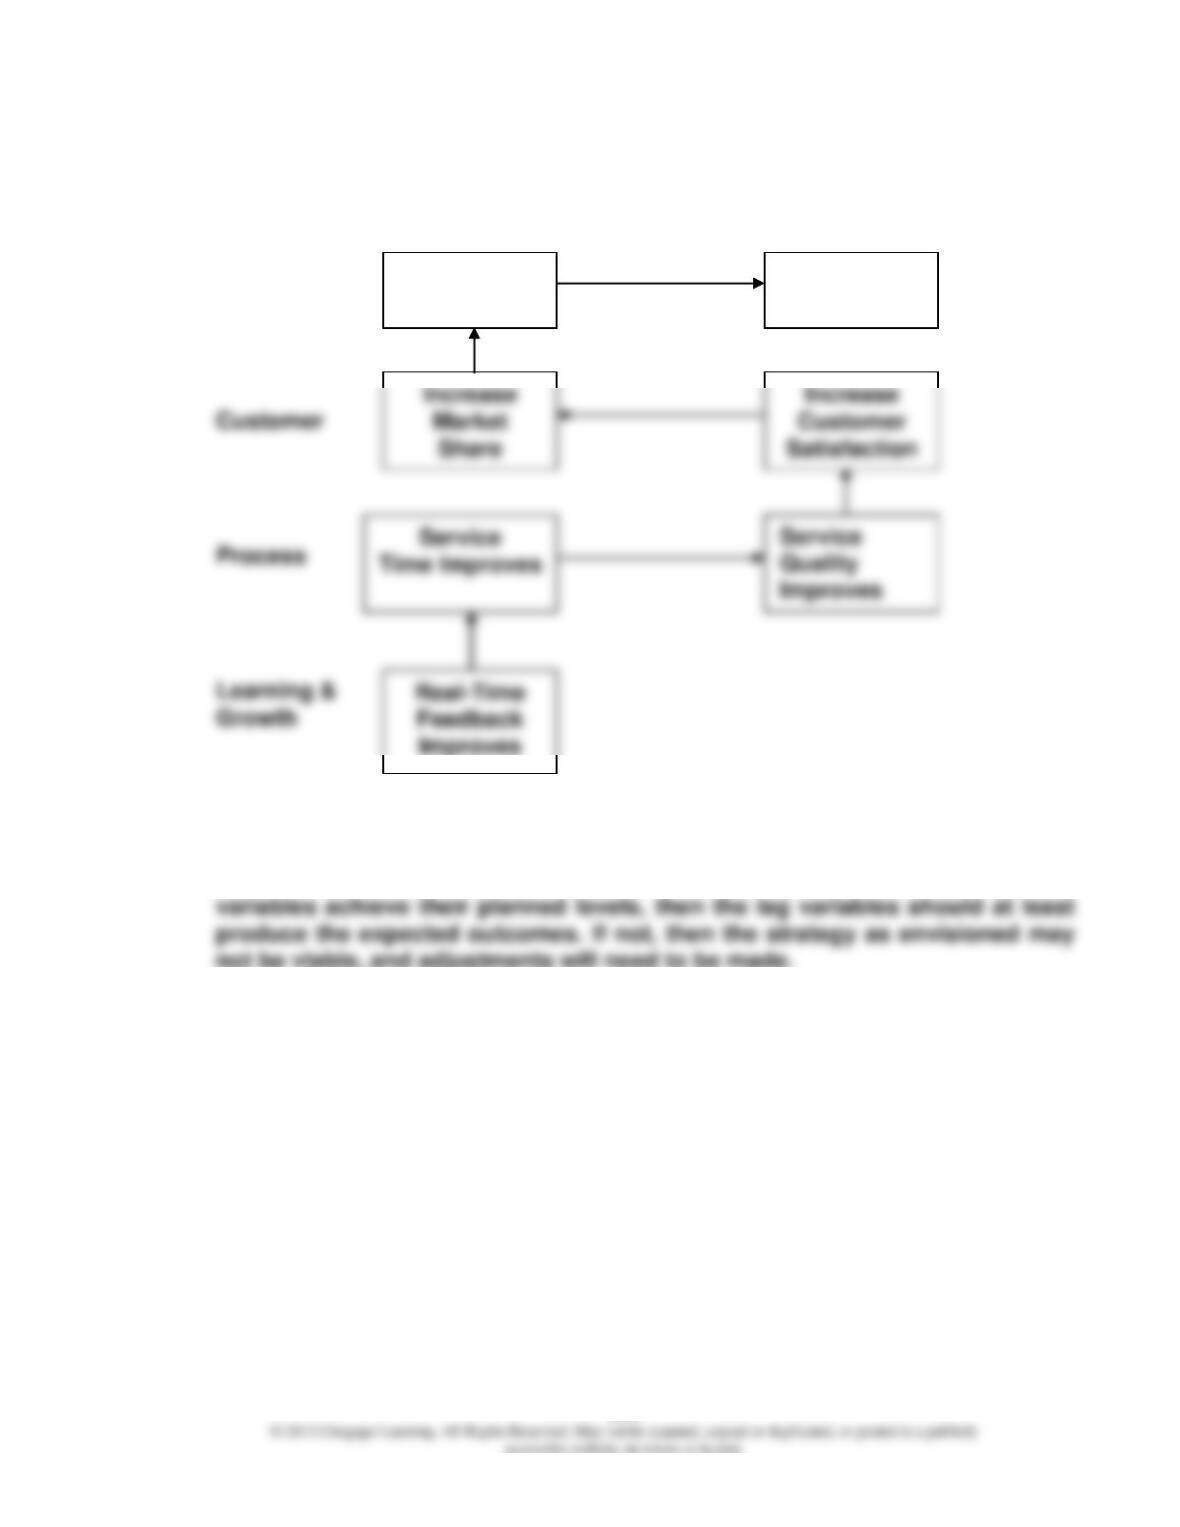
1. Strategy Map:
Financial
2. The strategy is testable because each if-then sequence is essentially a
hypothesis about the relationship between lead and lag variables. If the lead
Increase
Sales
Increase
Profits
Exercise 13.13
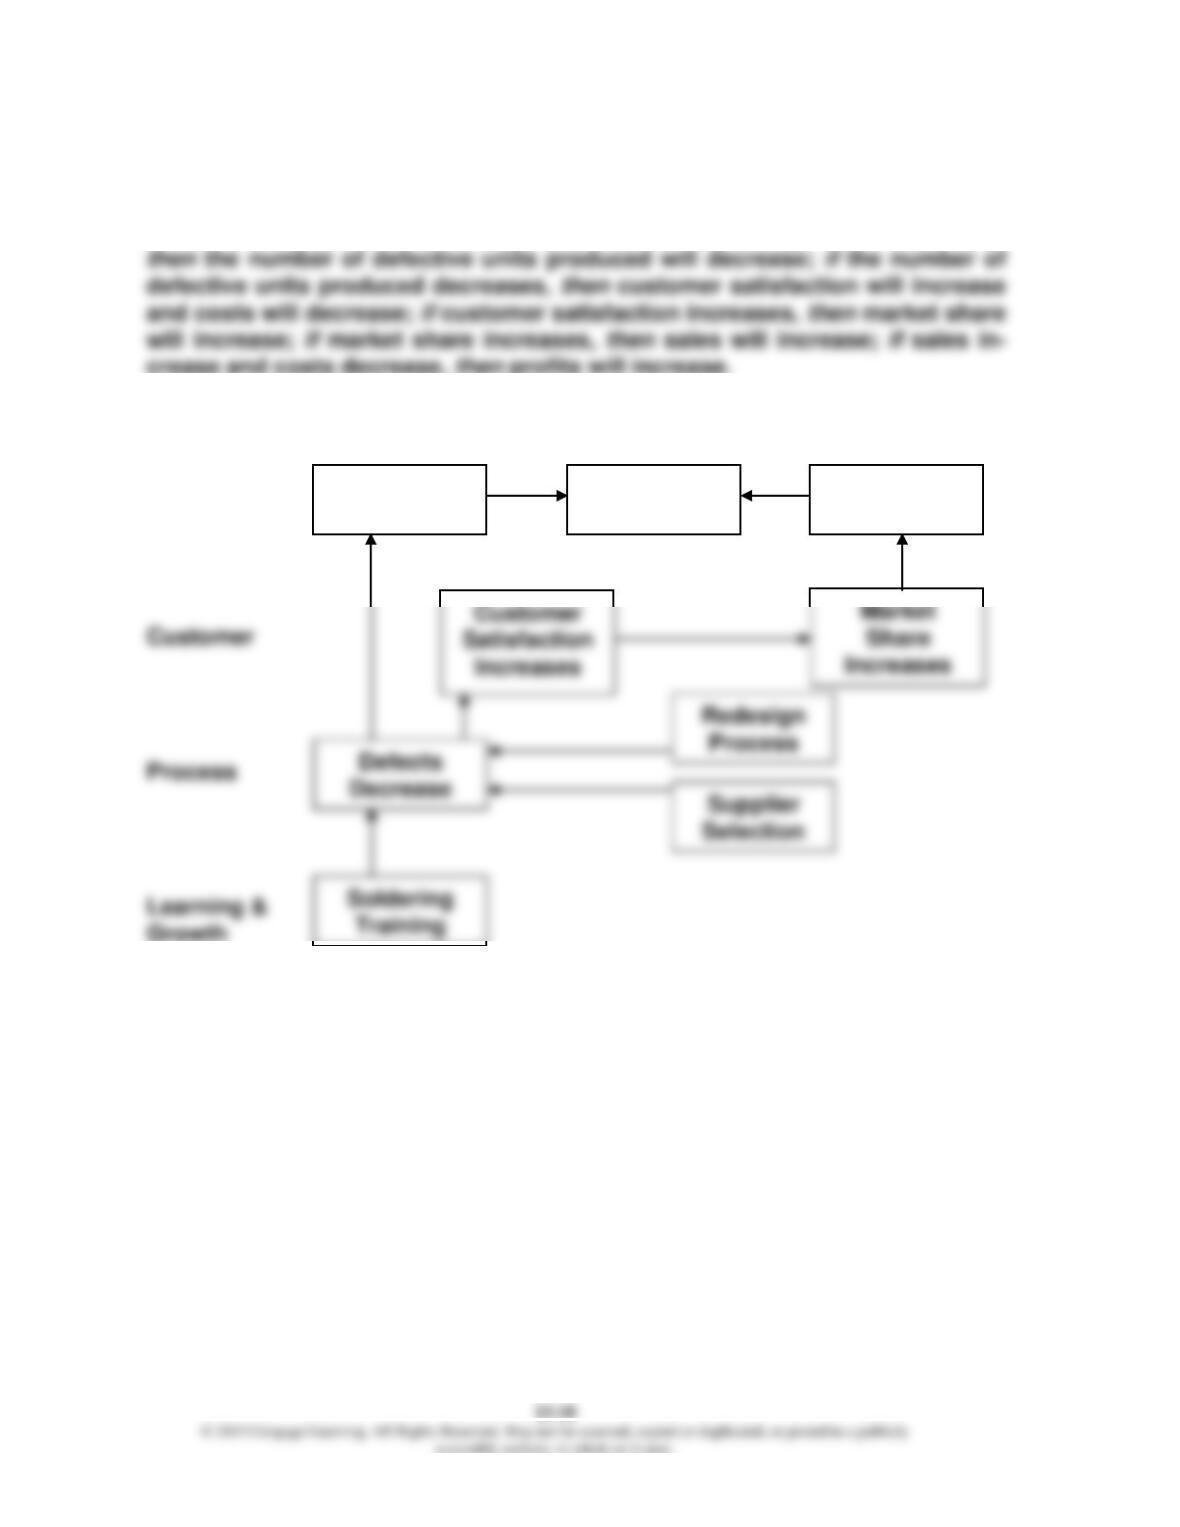
1. If (a) employees are trained to improve their soldering capabilities, (b) the
manufacturing process is redesigned, and (c) the right suppliers are selected,
2. Strategy Map:
Financial
Costs
Decrease
Profits
Increase
Sales
Increase

13–11
Exercise 13.13 (Concluded)
3. Each consequence of the if-then sequence (the “then” outcome) can be tested
to see if the outcome is as expected. For example, if workers are trained to
solder better, do defects actually decrease? If defects decrease, do we observe
an increase in customer satisfaction? Does market share then increase? Thus,
the consequences are observable but only if they are mea-sured. Of course, it
should be mentioned that not only outcomes must be measured but also those
factors that lead to the outcomes (the performance drivers). Was the process
redesigned? How many hours of training are needed, and were they provided?
Were suppliers selected so that we now have a higher-quality circuit
board? Note also that the number of defects acts as both a lag measure and a
Exercise 13.14
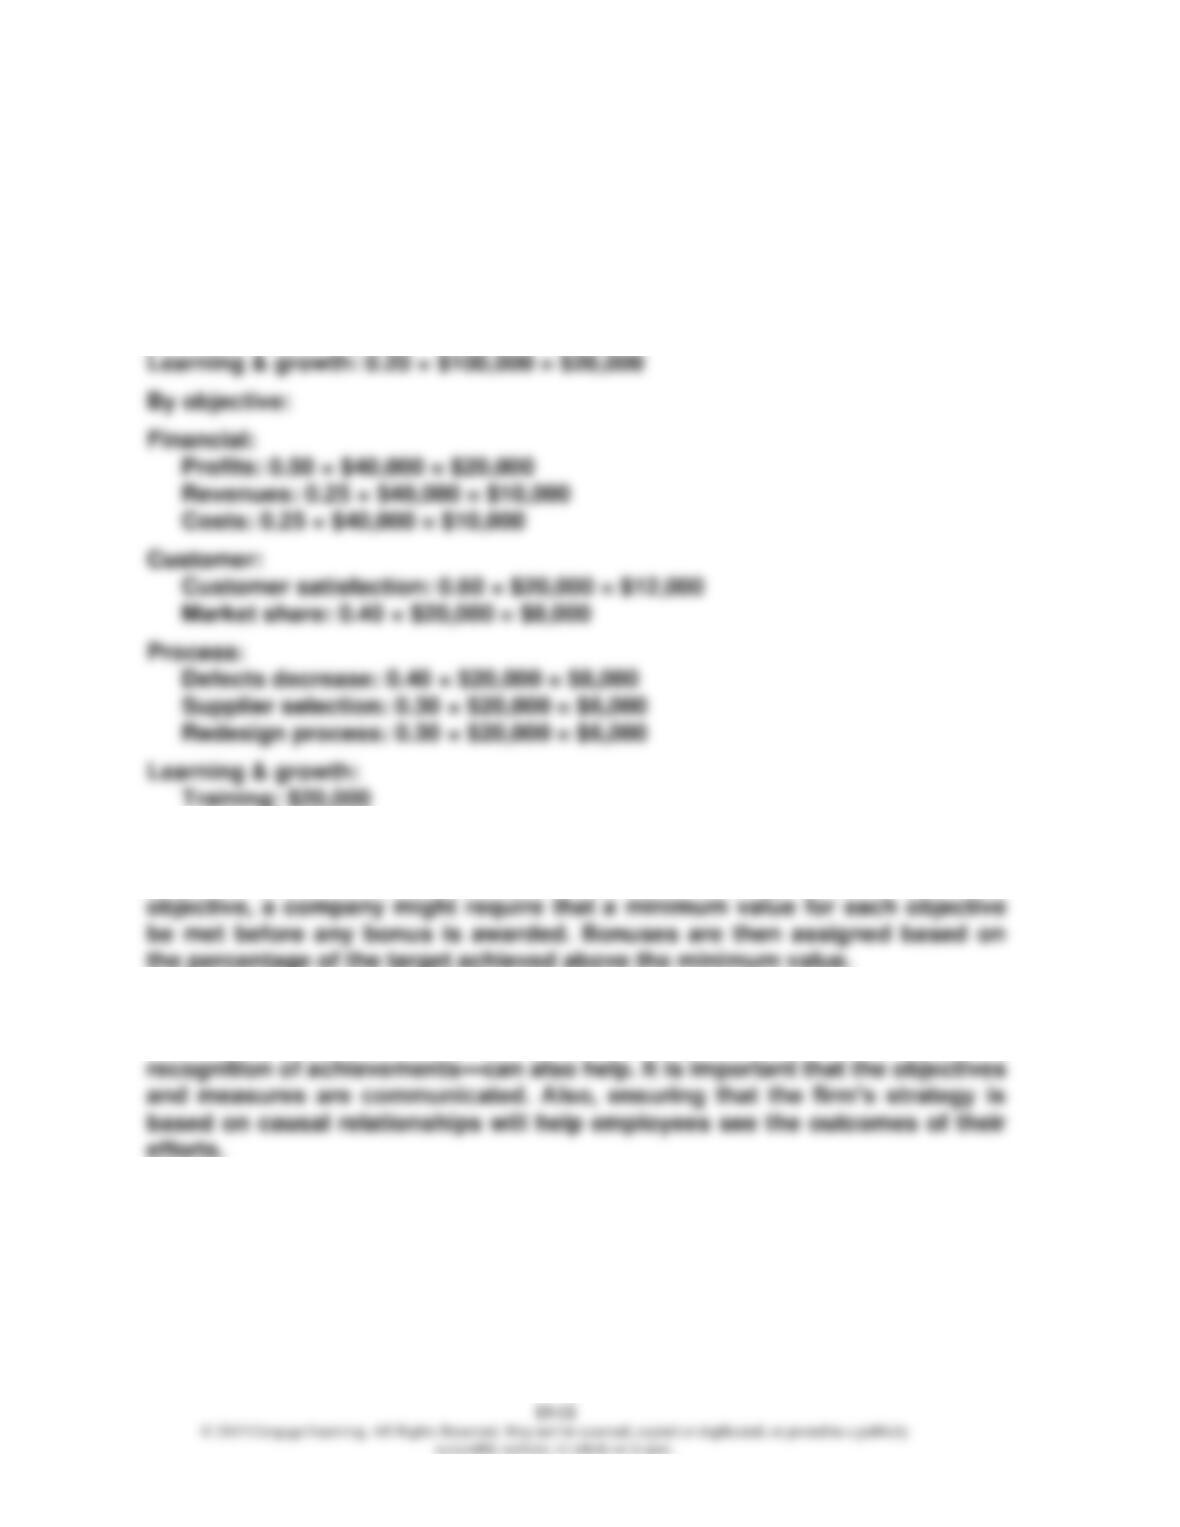
1. Bonuses:
By perspective:
Financial: 0.40 × $100,000 = $40,000
Customer: 0.20 × $100,000 = $20,000
Process: 0.20 × $100,000 = $20,000
2. Measures must be developed for each objective of each perspective. Next,
targeted values for each measure are set. To encourage attention for each
3. Involving employees in identifying the strategic objectives and measures will
help the employees internalize them. Nonfinancial rewards—such as public

13–13
CPA-TYPE EXERCISES
Exercise 13.15
c. If the target value of the performance driver is achieved (reduction in defective
Exercise 13.16
Exercise 13.17
Exercise 13.18
b. Learning and growth has three major objectives: (1) increase employee
Exercise 13–19