CHAPTER 27 (FIN MAN); CHAPTER 13 (MAN) Lean Manufacturing and Activity Analysis
Ex. 27–18 (FIN MAN); Ex. 13–18 (MAN) (Concluded)
d. The reports indicate that Three Rivers Inc.’s total costs of quality are 25.1% of total
CHAPTER 27 (FIN MAN); CHAPTER 13 (MAN) Lean Manufacturing and Activity Analysis
Ex. 27–19 (FIN MAN); Ex. 13–19 (MAN)
a.
Activity Cost
Activity Cost per Can = Number of Completed Cans
$480,000
= = $0.08 per can
6,000,000 cans
b. In this improvement scenario, 237,000 (300,000 – 63,000) additional cans will be processed
through the packaging operation. The same number of cans still will be processed by the
mixing and filling activities.
c. Expected activity cost per can after improvement:
Activity Cost
Activity Cost per Can = Number of Completed Cans
$480,000 + $3,792
=6,237,000 cans
= $0.078 per can
The activity cost per can of the new process is improved because the number of
CHAPTER 27 (FIN MAN); CHAPTER 13 (MAN) Lean Manufacturing and Activity Analysis
Ex. 27–20 (FIN MAN); Ex. 13–20 (MAN)
a.
Percent of
Total Process
Activity
Cost
Receiving claim ………………………………………………..
$120,000
24%
Adjusting claim …………………………………………………
260,000
52%
Paying claim …………………………………………………….
c.
Activity Cost
Prior to
Improvement
Activity Cost
After
Improvement
Activity Cost
Savings
(Cost)
Activity
Receiving claim ………………………….
$120,000
$132,000*
$ (12,000)
Adjusting claim …………………………..
260,000
52,000**
208,000
Paying claim ………………………………
120,000
120,000
0
CHAPTER 27 (FIN MAN); CHAPTER 13 (MAN) Lean Manufacturing and Activity Analysis
Ex. 27–21 (FIN MAN); Ex. 13–21 (MAN)
a.
Activity
Cost
Percent of
Total Process
Preparing materials request ………………………………
$ 32,000
8%
Requesting, receiving, and selecting
vendor bids …………………………………………………..
92,000
23%
Preparing receiving ticket …………………………………
24,000
6%
Matching M/R, R/T, and invoice ………………………….
52,000
13%
Correcting reconciliation differences …………………
37%
Preparing and delivering vendor payment ………….
Total process activity cost …………………………..
“Requesting, receiving, and selecting vendor bids” and “correcting reconciliation
differences” total 60% of the total process cost. This indicates that these two
activities are good candidates for improvement efforts.
b. Average process cost per payment:
$400,000 = $40 per payment
10,000 payments
c.
Activity Cost
Prior to
Improvement
Activity Cost
After
Improvement
Activity Cost
Savings
Activity
Preparing materials request……..
$ 32,000
$ 32,000
$ —
Requesting, receiving, and
—
selecting vendor bids ……………
92,000
23,000*
69,000
Preparing purchase order ………..
20,000
—
Matching M/R, R/T, and invoice ..
52,000
—
differences …………………………...
111,000
Preparing and delivering
*
$92,000 × (100% – 75%)
**
$148,000 × (10% ÷ 40%)
CHAPTER 27 (FIN MAN); CHAPTER 13 (MAN) Lean Manufacturing and Activity Analysis
PROBLEMS
Prob. 27–1A (FIN MAN); Prob. 13–1A (MAN)
1. Bright Night’s purchasing policy is very short-sighted. It does not involve developing
partnerships with suppliers. Bright Night should consider changing its arm’s-length
2. The hidden costs beyond the price include the costs associated with the higher
inventory required by Central’s delivery schedule. These inventory costs include
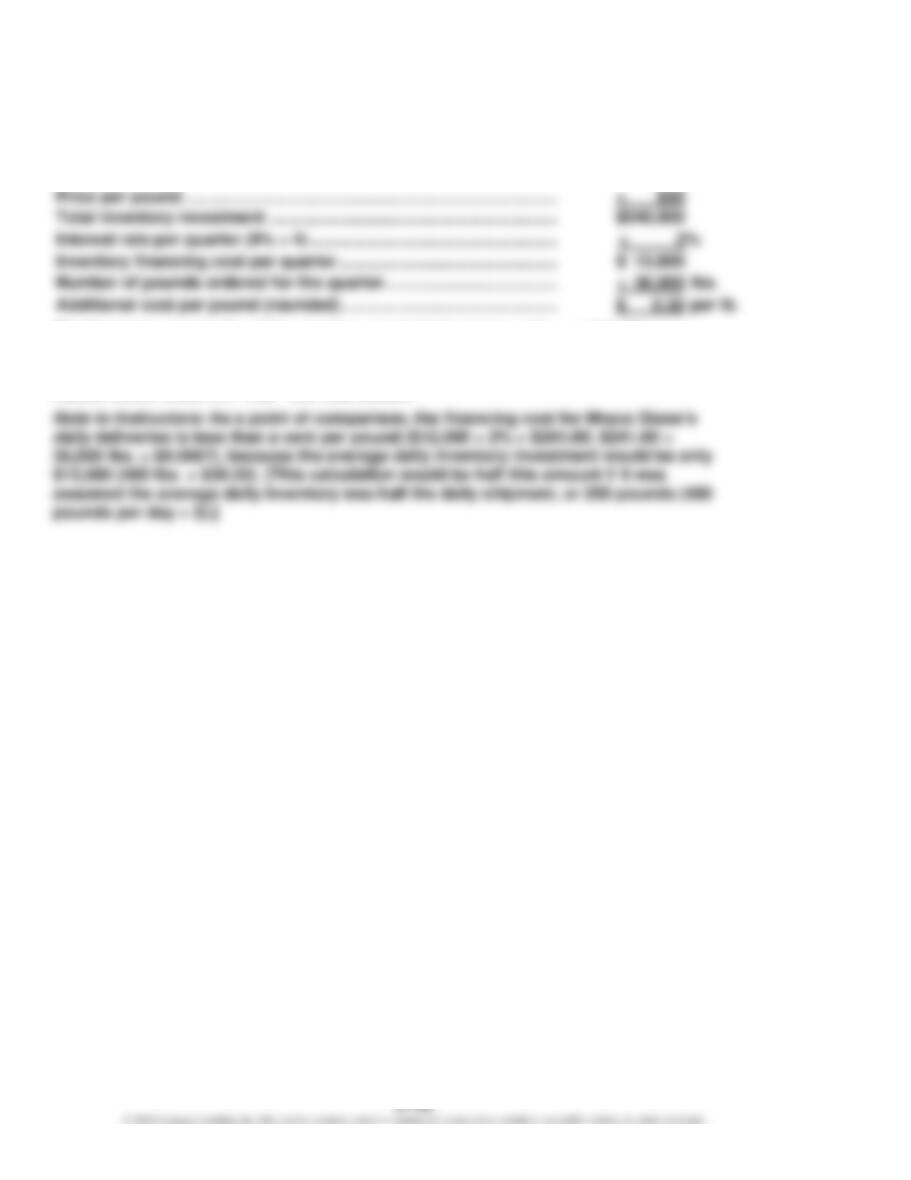
3. If the financing costs are 8%, then the additional cost of the inventory could be determined
as follows:
At the beginning of July, the new shipment of 36,000 pounds arrives. Assuming that the
glass supply runs out by the end of the quarter, the average inventory for the quarter is:
CHAPTER 27 (FIN MAN); CHAPTER 13 (MAN) Lean Manufacturing and Activity Analysis
Prob. 27–1A (FIN MAN); Prob. 13–1A (MAN) (Concluded)
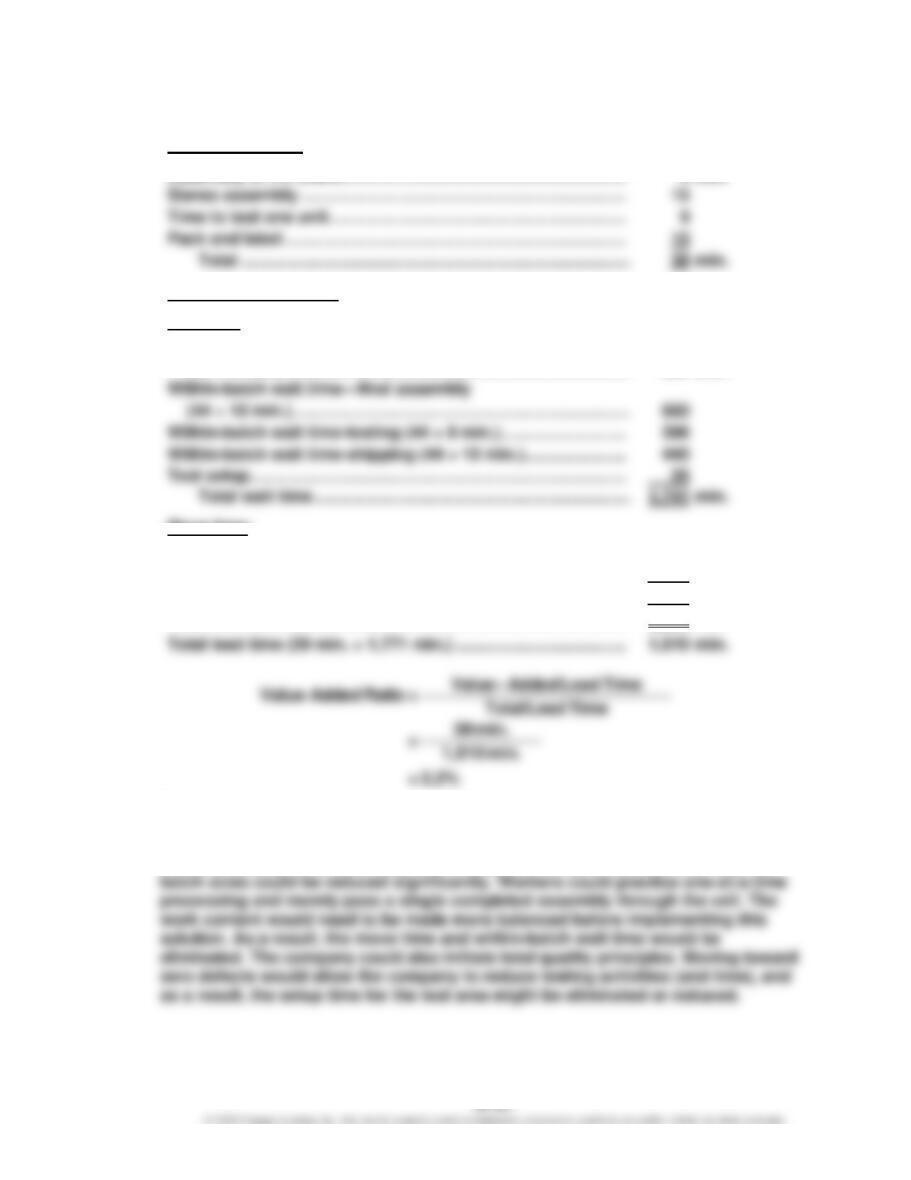
The inventory carrying cost can be estimated as follows:
Average pounds in inventory for the quarter …………………………….
18,000
The financing cost is 2% of the average quarterly inventory value, or $10,800 per
quarter. This translates into an additional 30¢ per pound ($10,800 ÷ 36,000 lbs.)
purchased during the quarter. Thus, just considering the financing cost by itself
CHAPTER 27 (FIN MAN); CHAPTER 13 (MAN) Lean Manufacturing and Activity Analysis
Prob. 27–2A (FIN MAN); Prob. 13–2A (MAN)
1.
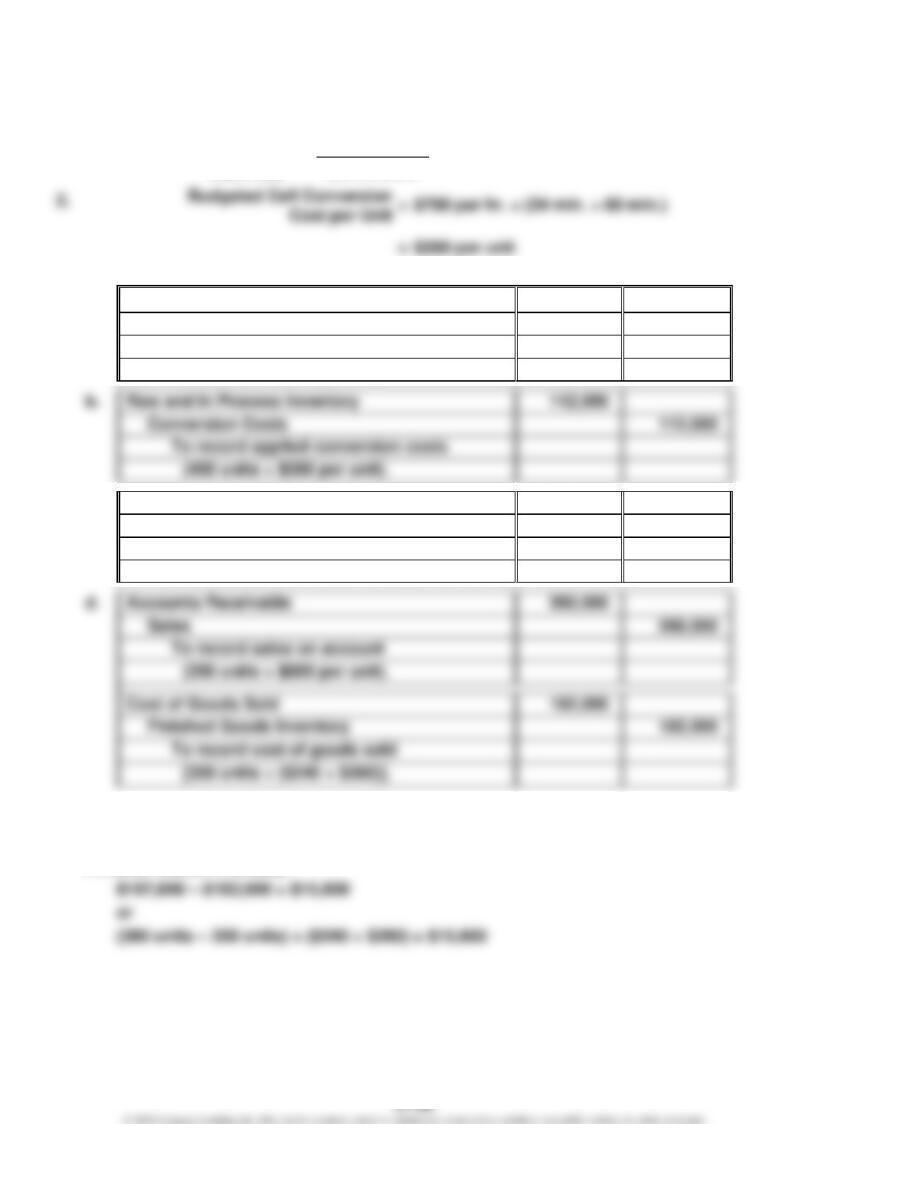
Value-added time:
Assembly of PC board …………………………………………………….
min.
Stereo assembly …………………………………………………………….
Non-value-added time:
Wait time:
Within-batch wait time—PC board assembly
(44 × 5 min.) …………………………………………………………………
min.
Within-batch wait time-shipping (44 × 10 min.) ………………….
Test setup ………………………………………………………………………
Move time:
Move from PC board assembly to final assembly ……………..
10
min.
Move from final assembly to testing ………………………………..
20
Total move time ………………………………………………………...
30
min.
Total non-value-added time……………………………………………..
1,771
min.
2. The existing process is very wasteful. The company could improve the process by
changing the layout from a process orientation to a product orientation. Each
stereo model could be formed into a production cell. Each cell would have PC
board assembly, final assembly, and testing next to each other. In this way, the
CHAPTER 27 (FIN MAN); CHAPTER 13 (MAN) Lean Manufacturing and Activity Analysis
Prob. 27–3A (FIN MAN); Prob. 13–3A (MAN)
1.
Budgeted Cell Conversion $1,400,000
= = $700 per hour
2,000 hours
3.
a.
Raw and In Process Inventory
108,000
Accounts Payable
108,000
To record materials purchases
(450 units × $240 per unit).
To record applied conversion costs
c.
Finished Goods Inventory
197,600
Raw and In Process Inventory
197,600
To transfer the cost of completed units to
finished goods [380 units × ($240 + $280)].
To record sales on account
To record cost of goods sold
4.
Raw and In Process Inventory:
$108,000 + $112,000 – $197,600 = $22,400
CHAPTER 27 (FIN MAN); CHAPTER 13 (MAN) Lean Manufacturing and Activity Analysis
Prob. 27–3A (FIN MAN); Prob. 13–3A (MAN) (Concluded)
5. Lean accounting is different from traditional accounting in a number of respects.
Most importantly, lean accounting is simplified and uses minimal control. As a
result, the number of transactions is reduced, and the control intervals between
CHAPTER 27 (FIN MAN); CHAPTER 13 (MAN) Lean Manufacturing and Activity Analysis
Prob. 27–4A (FIN MAN); Prob. 13–4A (MAN)
CHAPTER 27 (FIN MAN); CHAPTER 13 (MAN) Lean Manufacturing and Activity Analysis
Prob. 27–4A (FIN MAN); Prob. 13–4A (MAN) (Continued)
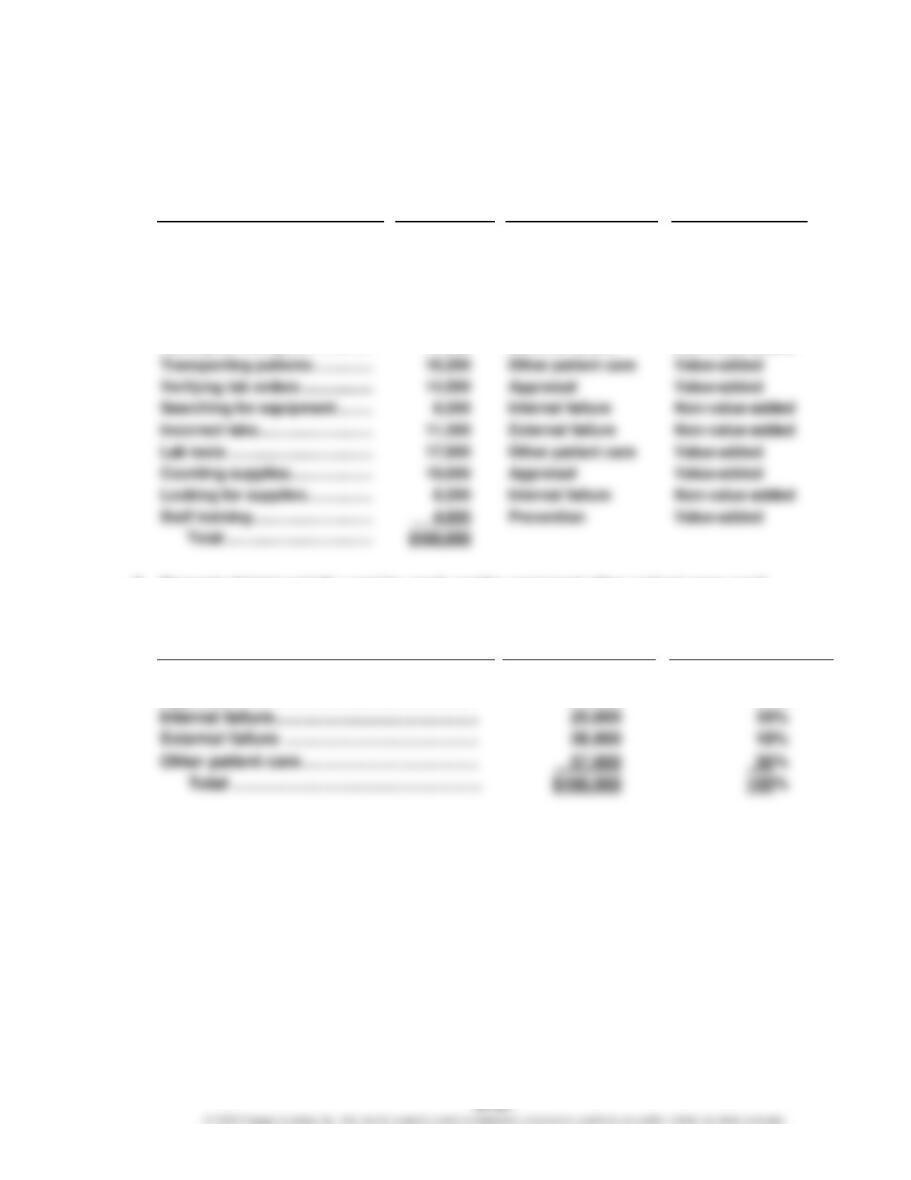
2. Activity classifications:
Activity
Cost
Cost of Quality
Classification
Value-Added/
Non-Value-Added
Classification
Activity
Patient registration ………………
$ 6,500
Other patient care
Value-added
Verifying patient information ..
9,700
Appraisal
Value-added
Assigning patients ……………….
13,000
Other patient care
Value-added
Searching/waiting for doctor ..
9,200
Internal failure
Non-value-added
Doctor exam ………………………..
4,900
Other patient care
Value-added
Waiting for transport …………….
Transporting patients …………..
16,200
Other patient care
Value-added
Verifying lab orders ……………..
Appraisal
Value-added
Searching for equipment ………
8,200
Internal failure
Non-value-added
17,500
External failure
Non-value-added
3. Percent of total activity cost for each quality cost (and other patient care cost)
classification:
Activity
Cost
Percent of Total
Department Cost
Quality Cost Classification
Prevention …………………………..………………
$ 4,800
3%
Appraisal …………………………………………….
43,200
27%
CHAPTER 27 (FIN MAN); CHAPTER 13 (MAN) Lean Manufacturing and Activity Analysis
Prob. 27–4A (FIN MAN); Prob. 13–4A (MAN) (Concluded)
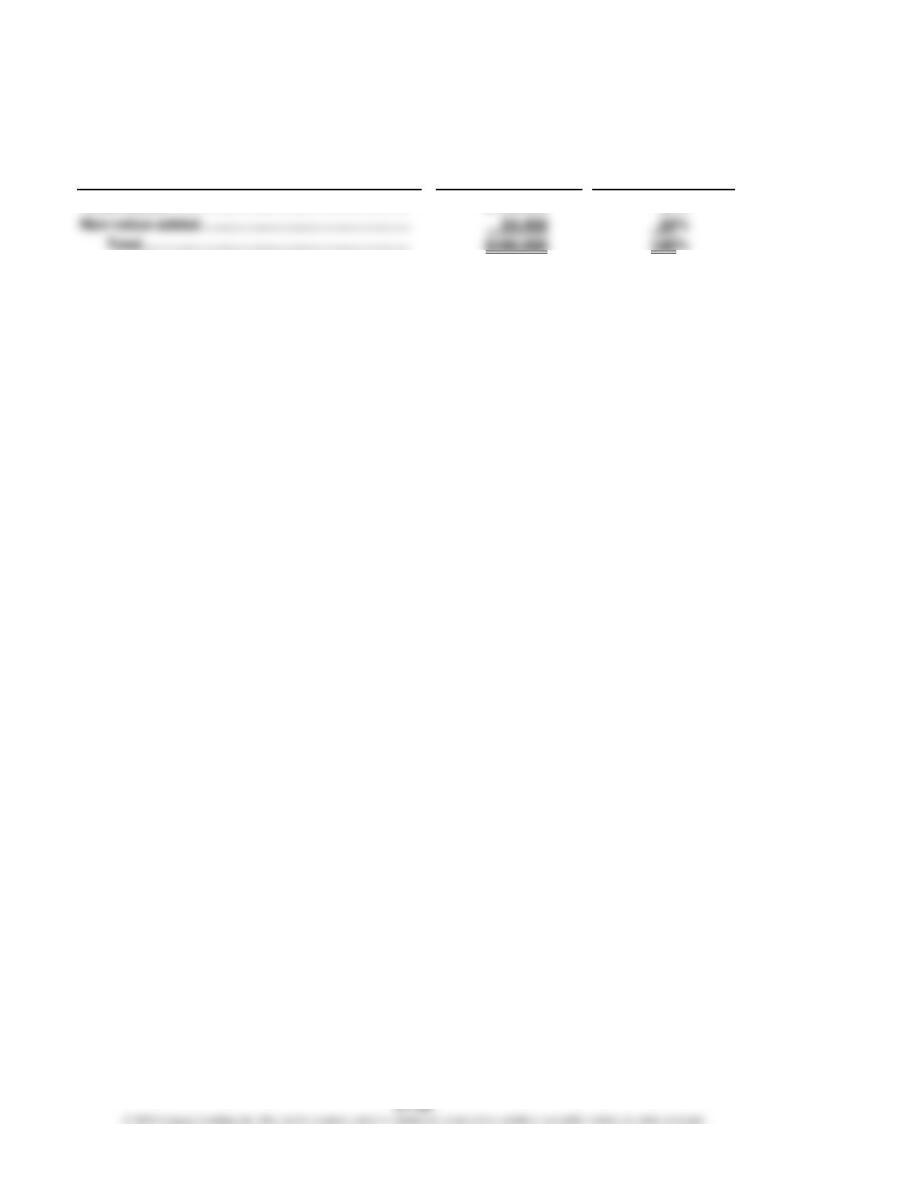
4. Percentages of total activity cost that are value- and non-value-added:
Activity
Cost
Percent of Total
Department Cost
Total ………………………………………………………..
$160,000
100%
5. The ER has 34% of its total costs as non-value-added. This represents a significant
opportunity for cost savings. There is potential for significant improvement in the
operations of the ER by using lean principles.
CHAPTER 27 (FIN MAN); CHAPTER 13 (MAN) Lean Manufacturing and Activity Analysis
Prob. 27–1B (FIN MAN); Prob. 13–1B (MAN)
1. J. Burns’ purchasing policy is very short-sighted. It does not involve
developing partnerships with suppliers. J. Burns should consider changing its
arm’s-length policy and work on building a long-term supply chain strategy
2. The hidden costs beyond the price include the costs associated with the higher
inventory required by Iron Fist Frames’ delivery schedule. These inventory
CHAPTER 27 (FIN MAN); CHAPTER 13 (MAN) Lean Manufacturing and Activity Analysis
Prob. 27–1B (FIN MAN); Prob. 13–1B (MAN) (Concluded)
3. If the financing costs are 8%, then the additional cost of the inventory could be determined
as follows:
At the beginning of July, the new shipment of 3,600 frames arrives. Assuming that the
frame supply runs out by the end of the quarter, the average inventory for the quarter
is:
Beginning of July …………………………..……………………………..
3,600
frames
End of September …………………………………………………………
Total ………………………………………………………………………..
frames
The inventory carrying cost can be estimated as follows:
Average frames in inventory for the quarter ……………………
1,800
Interest rate per quarter (8% ÷ 4) ……………………………………
Number of frames ordered for the quarter ………………………
÷ 3,600
frames
Additional cost per frame ………………………………………………
$ 4.00
per frame
The financing cost is 2% of the average quarterly inventory value, or $14,400 per