CHAPTER 13
SOLUTIONS TO PROBLEMS—SET C
PROBLEM 13-1C
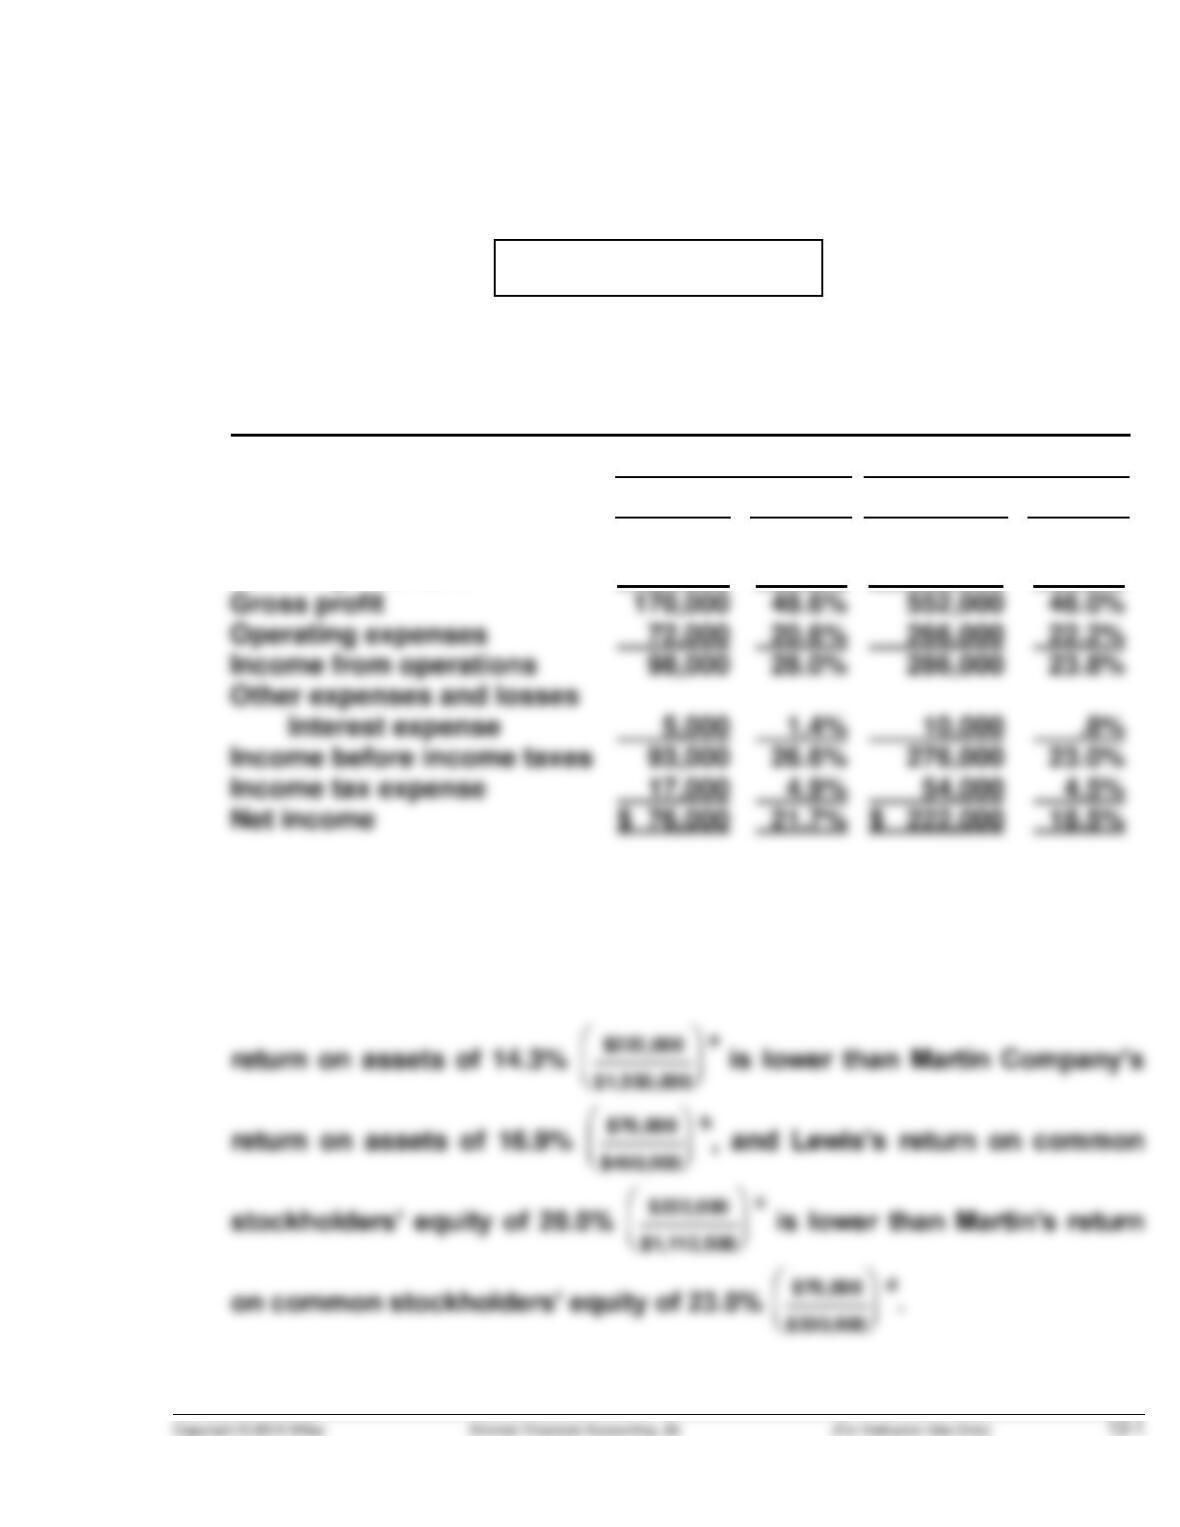
(a) Condensed Income Statement
For the Year Ended December 31, 2014
Martin Company
Lewis Company
Dollars
Percent
Dollars
Percent
Net income
$ 76,000
Net sales
Cost of goods sold
$350,000
180,000
100.0%
51.4%
$1,200,000
648,000
100.0%
54.0%
(b) Martin Company appears to be more profitable. It has higher relative
income from operations, income before taxes, and net income. Lewis’s
PROBLEM 13-1C (Continued)
a$222,000 is Lewis’s 2014 net income. $1,550,000 is Lewis’s 2014
average assets: Return on assets = ($222,000 ÷ $1,550,000) = 14.3%
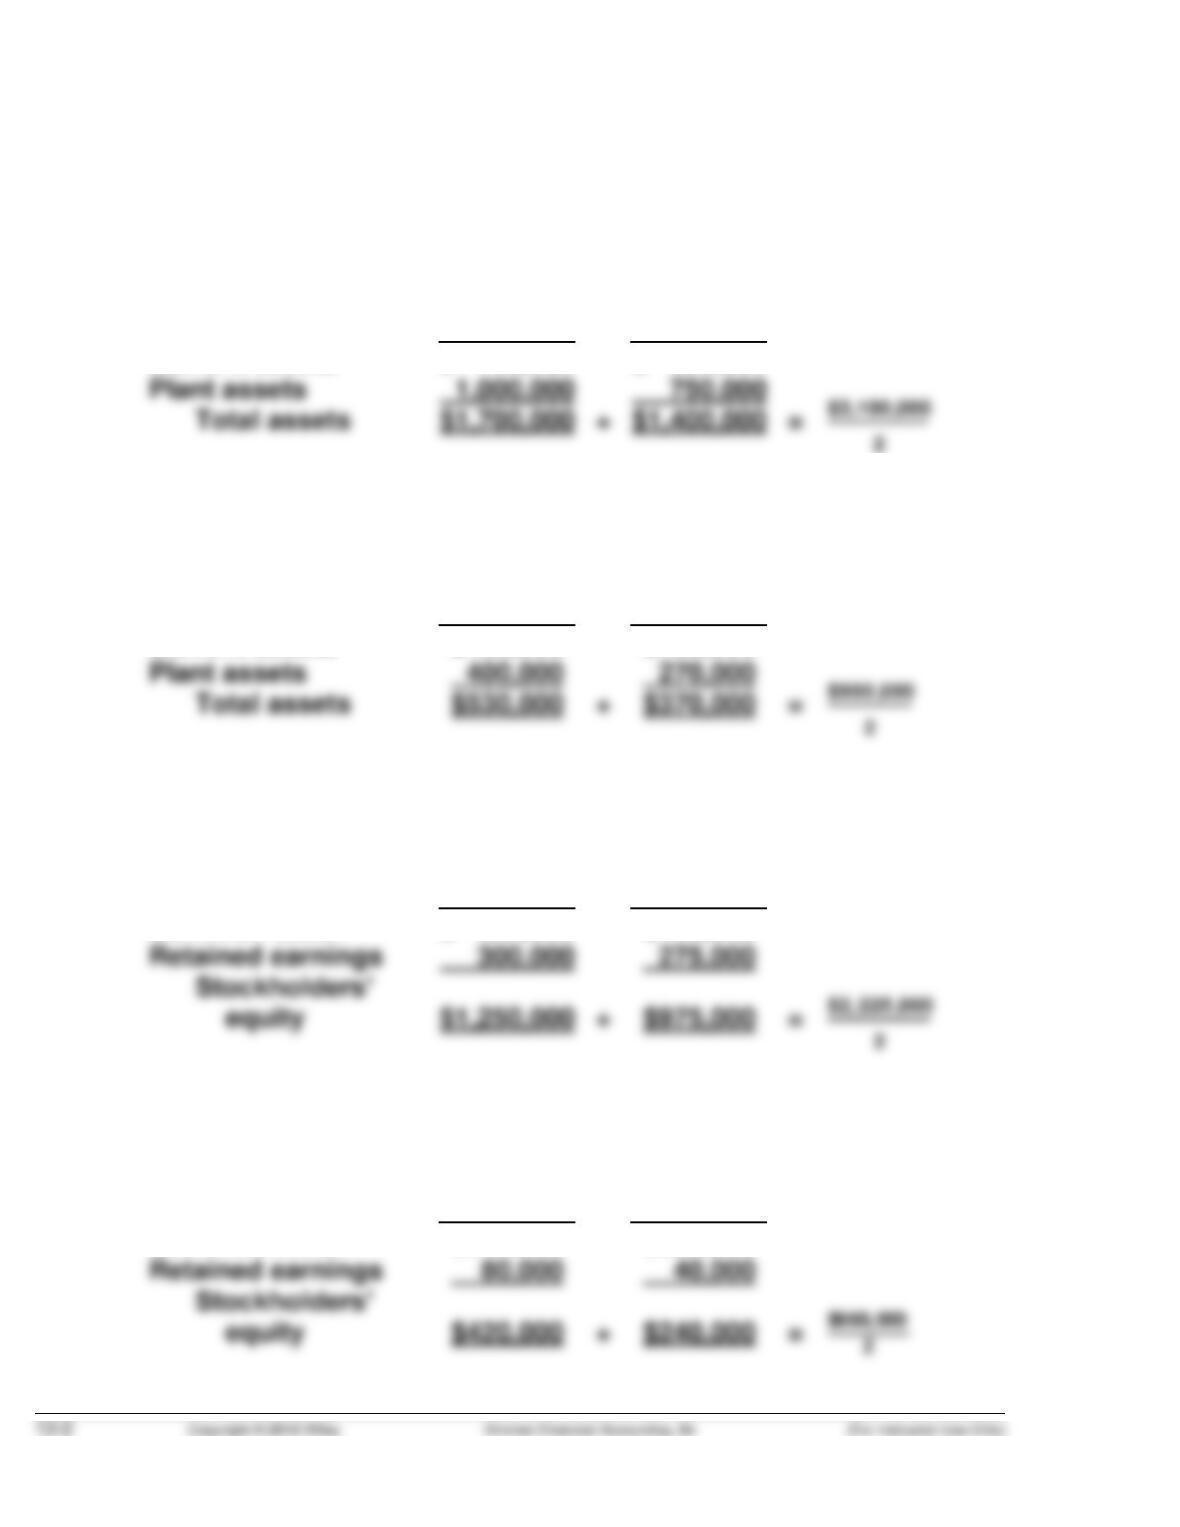
2014
2013
Current assets
$ 700,000
$ 650,000
b$76,000 is Martin’s 2014 net income. $450,000 is Martin’s 2014 average
assets: Return on assets = ($76,000 ÷ $450,000) = 16.9%
2014
2013
Current assets
$130,000
$100,000
c$222,000 is Lewis’s 2014 net income. $1,112,500 is Lewis’s 2014
average stockholders’ equity: Return = $222,000 ÷ $1,112,500 = 20.0%
2014
2013
Retained earnings
Common stock
$ 950,000
$700,000
d$76,000 is Martin’s 2014 net income. $330,000 is Martin’s 2014 average
stockholders’ equity: Return = $76,000 ÷ $330,000 = 23%
2014
2013
Common stock
$340,000
$200,000
PROBLEM 13-2C
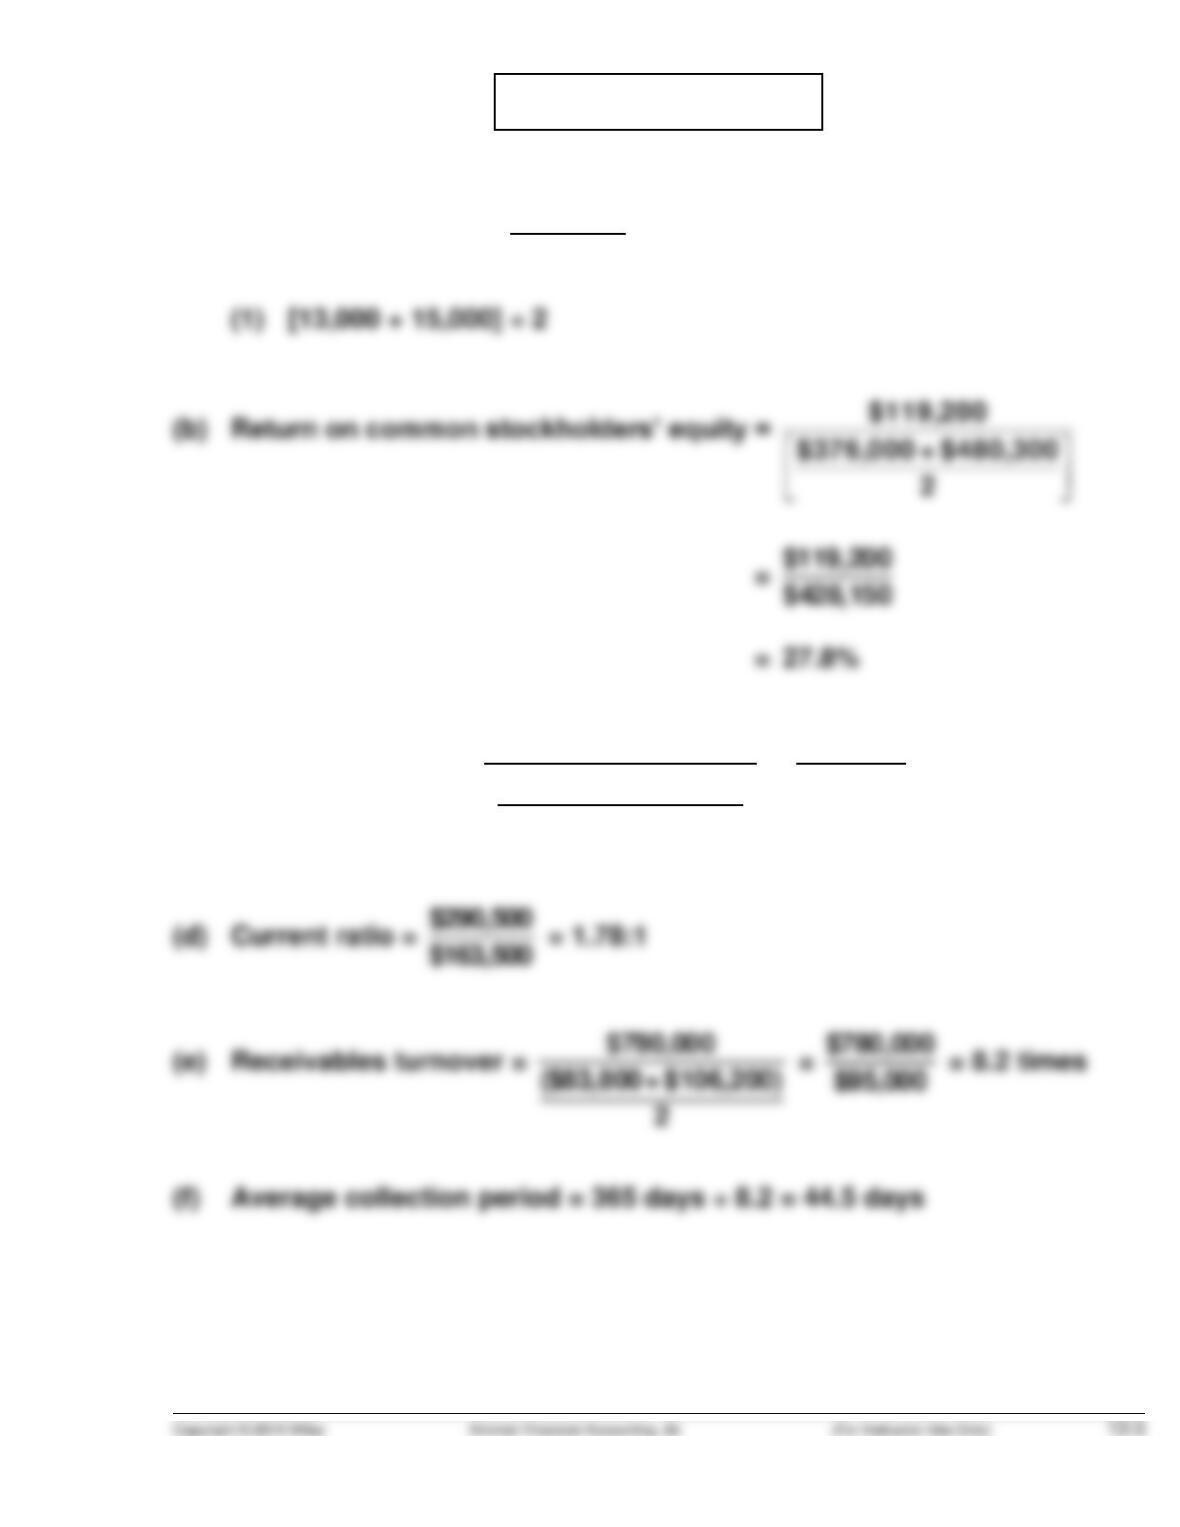
(a) Earnings per share =
$119,200
14,000 (1)
$119,200
$428,150
= $8.51
(c) Return on assets =
$119,200
$652,000 + $775,800
2
=
$119,200
$713,900
= 16.7%
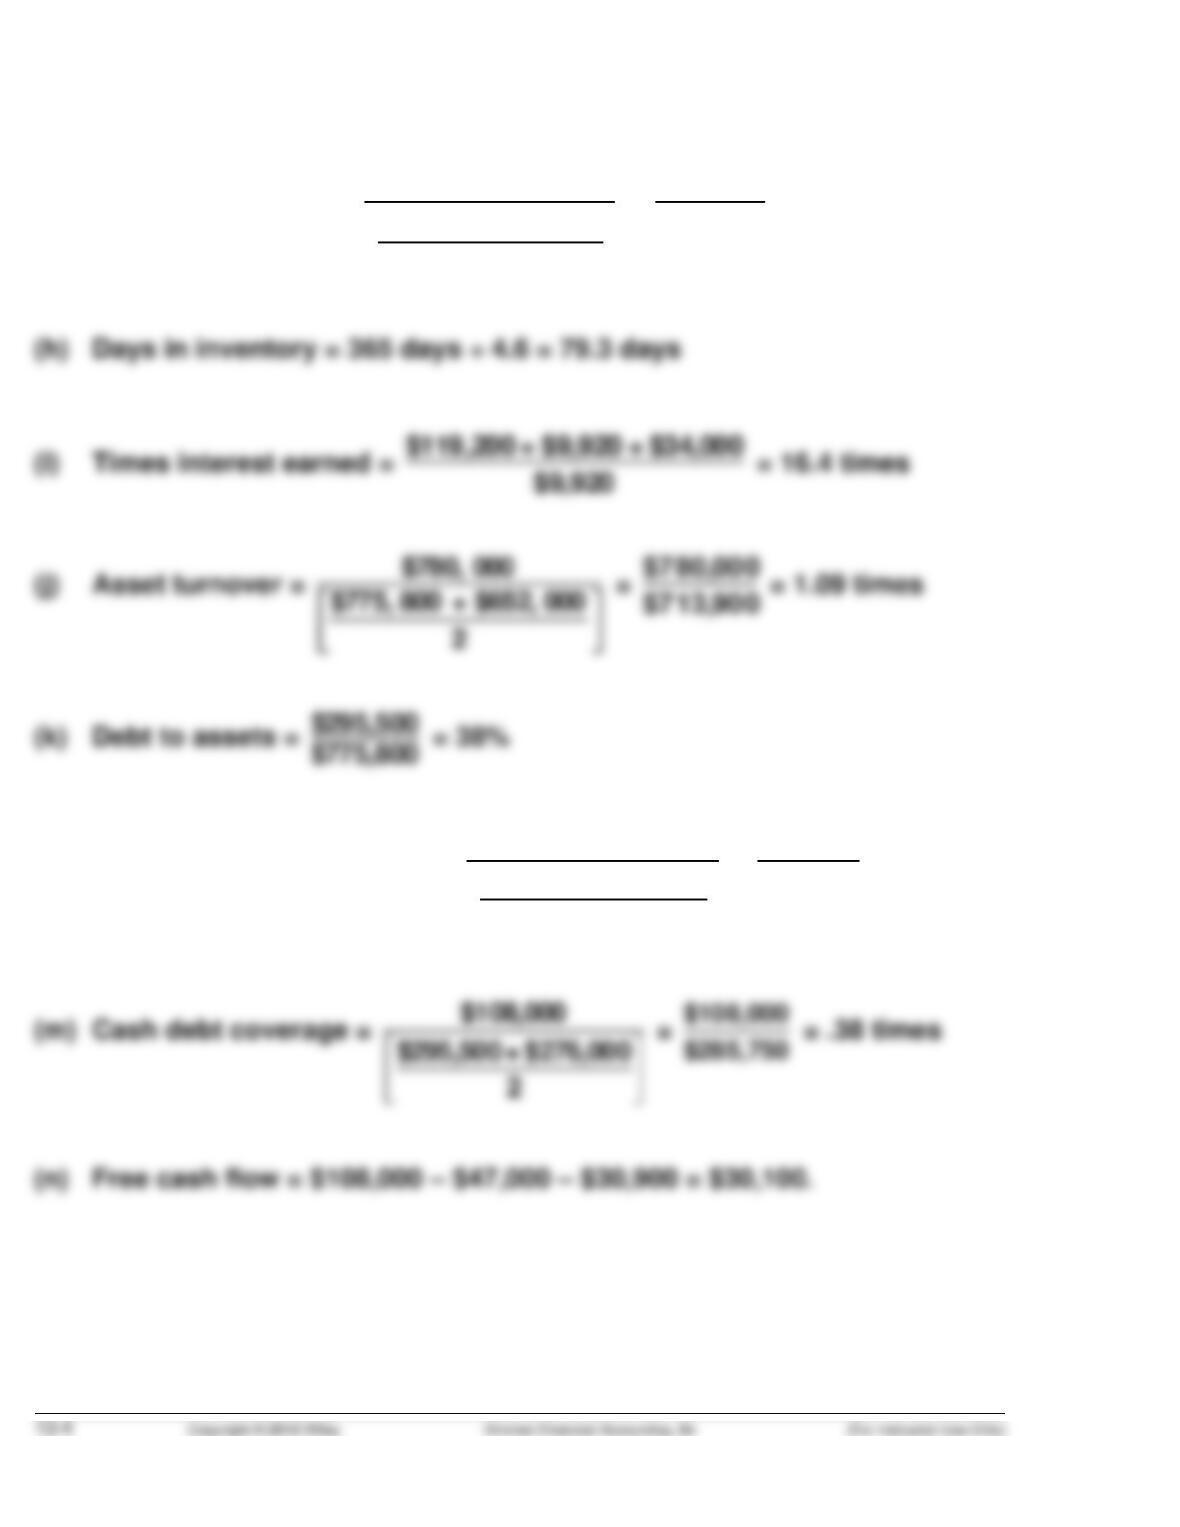
PROBLEM 13-2C (Continued)
(g) Inventory turnover =
$440,000
$74,000+$116,400
2
=
$440,000
$95,200
= 4.6 times
(l) Current cash debt coverage =
$108,000
$163,500 + $156,000
2
=
$108,000
$159,750
= .68 times
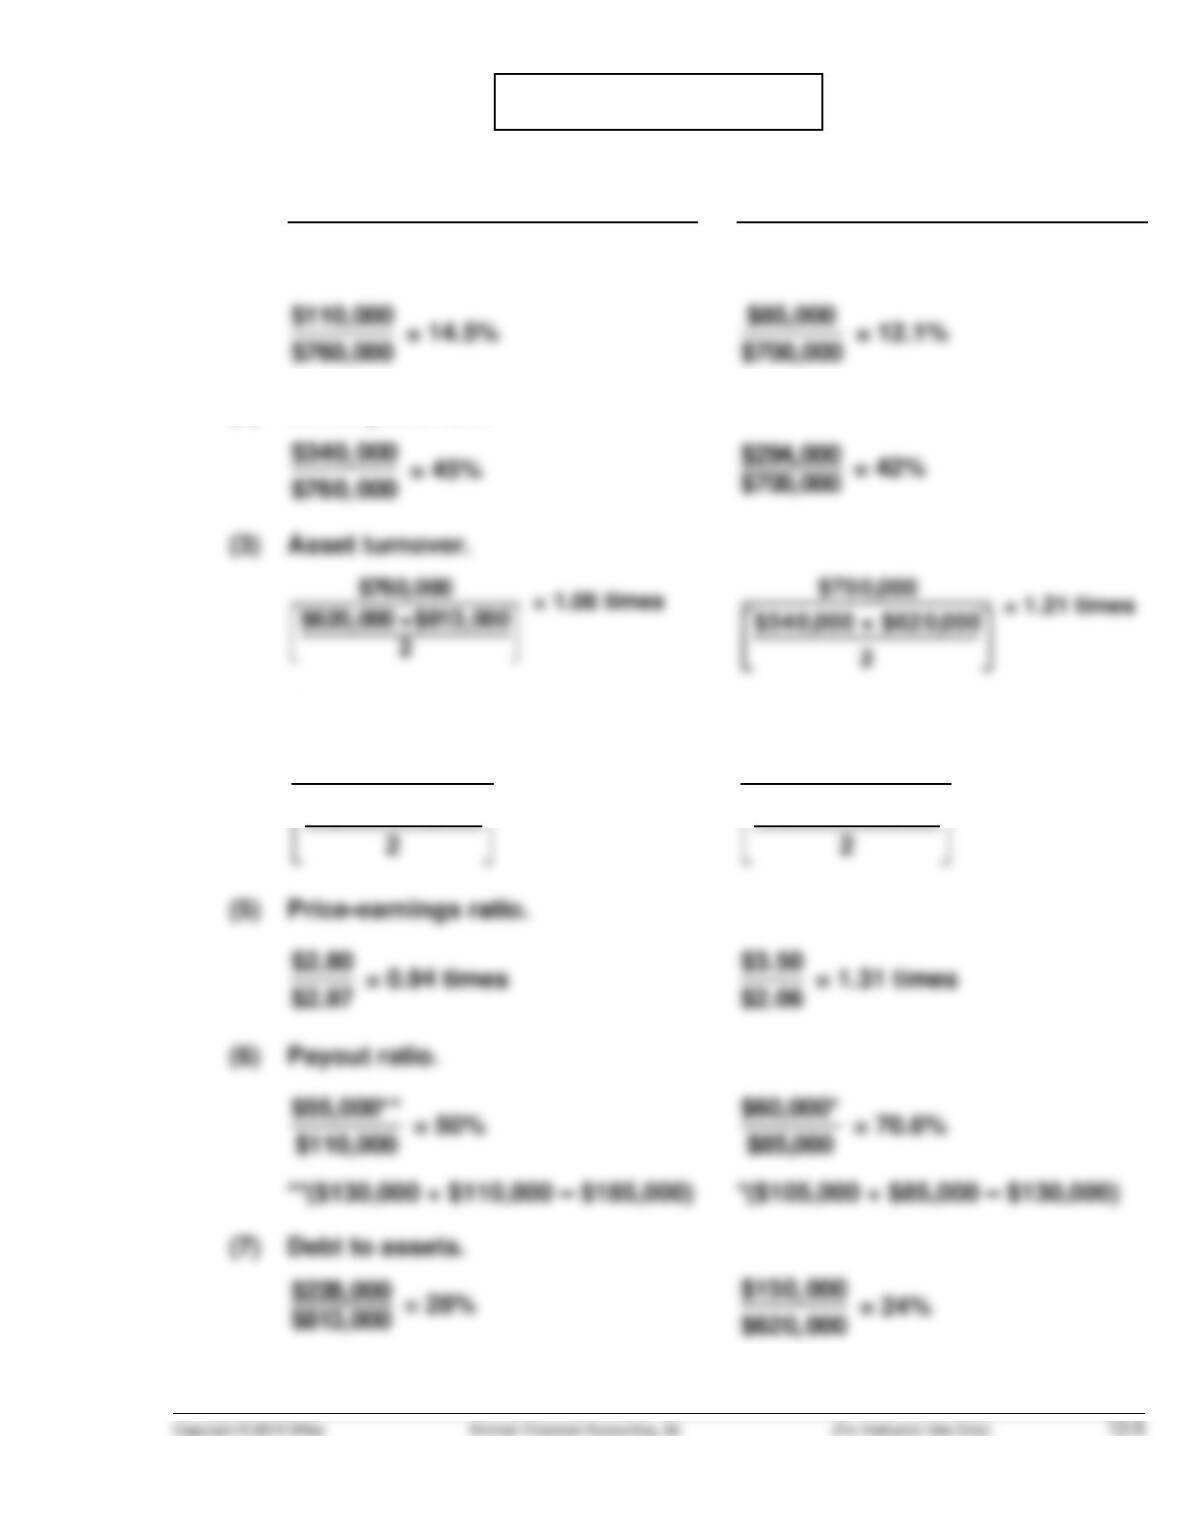
PROBLEM 13-3C
(a)
2014
2013
(1)
Profit margin.
(2)
Gross profit rate.
(4)
Earnings per share.
(5)
Price-earnings ratio.
(7)
Debt to assets.
$110,000
34,000 + 40,000
= $2.97
$85,000
30,000 + 34,000
= $2.66
PROBLEM 13-3C (Continued)
(b) The underlying profitability of the corporation has improved. For example,
the profit margin and gross profit rate have both improved. In addition,
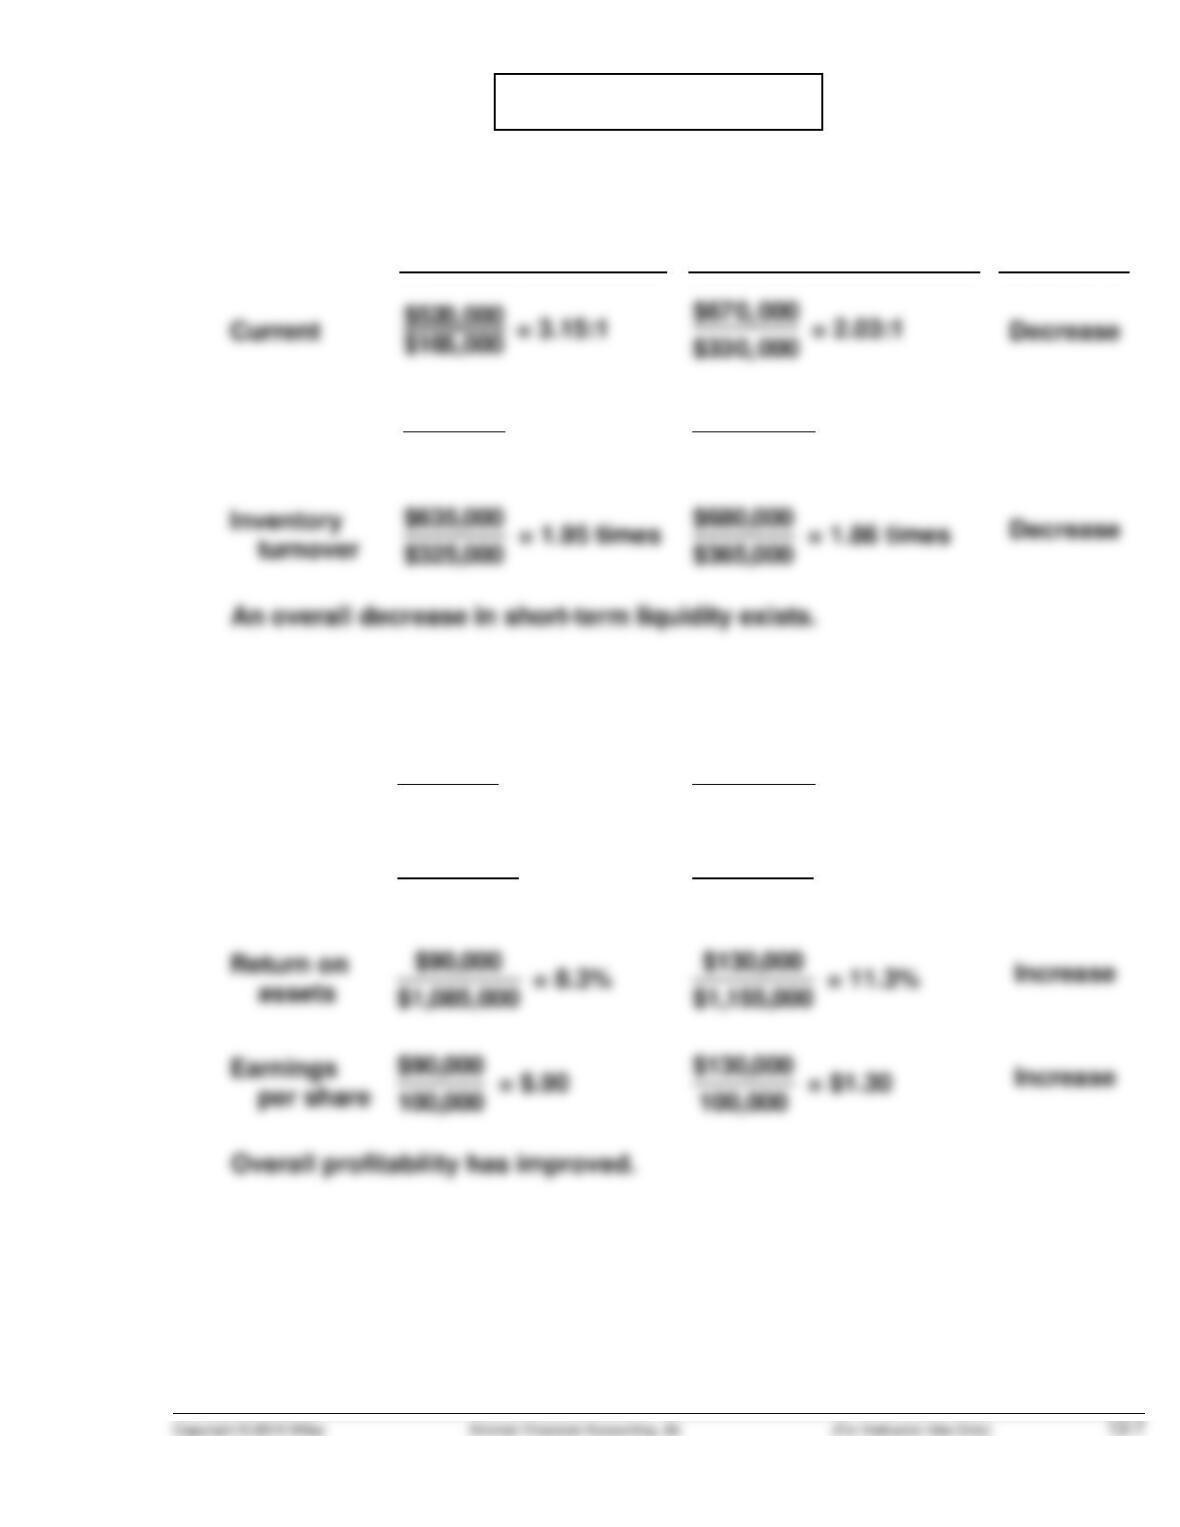
PROBLEM 13-4C
(a) LIQUIDITY
2013
2014
Change
Receivables
turnover
$940,000
$78,500
= 12.0 times
$1,050,000
$88,500
= 11.9 times
Decrease
turnover
$635,000
= 1.95 times
$680,000
= 1.86 times
Decrease
PROFITABILITY
Profit
margin
$90,000
$940,000
= 9.6%
$130,000
$1,050,000
= 12.4%
Increase
Asset
turnover
$940,000
$1,085,000
= .87 times
$1,050,000
$1,155,000
= .91 times
Increase
assets
$1,085,000
= 8.3%
per share
$130,000
100,000
= $1.30
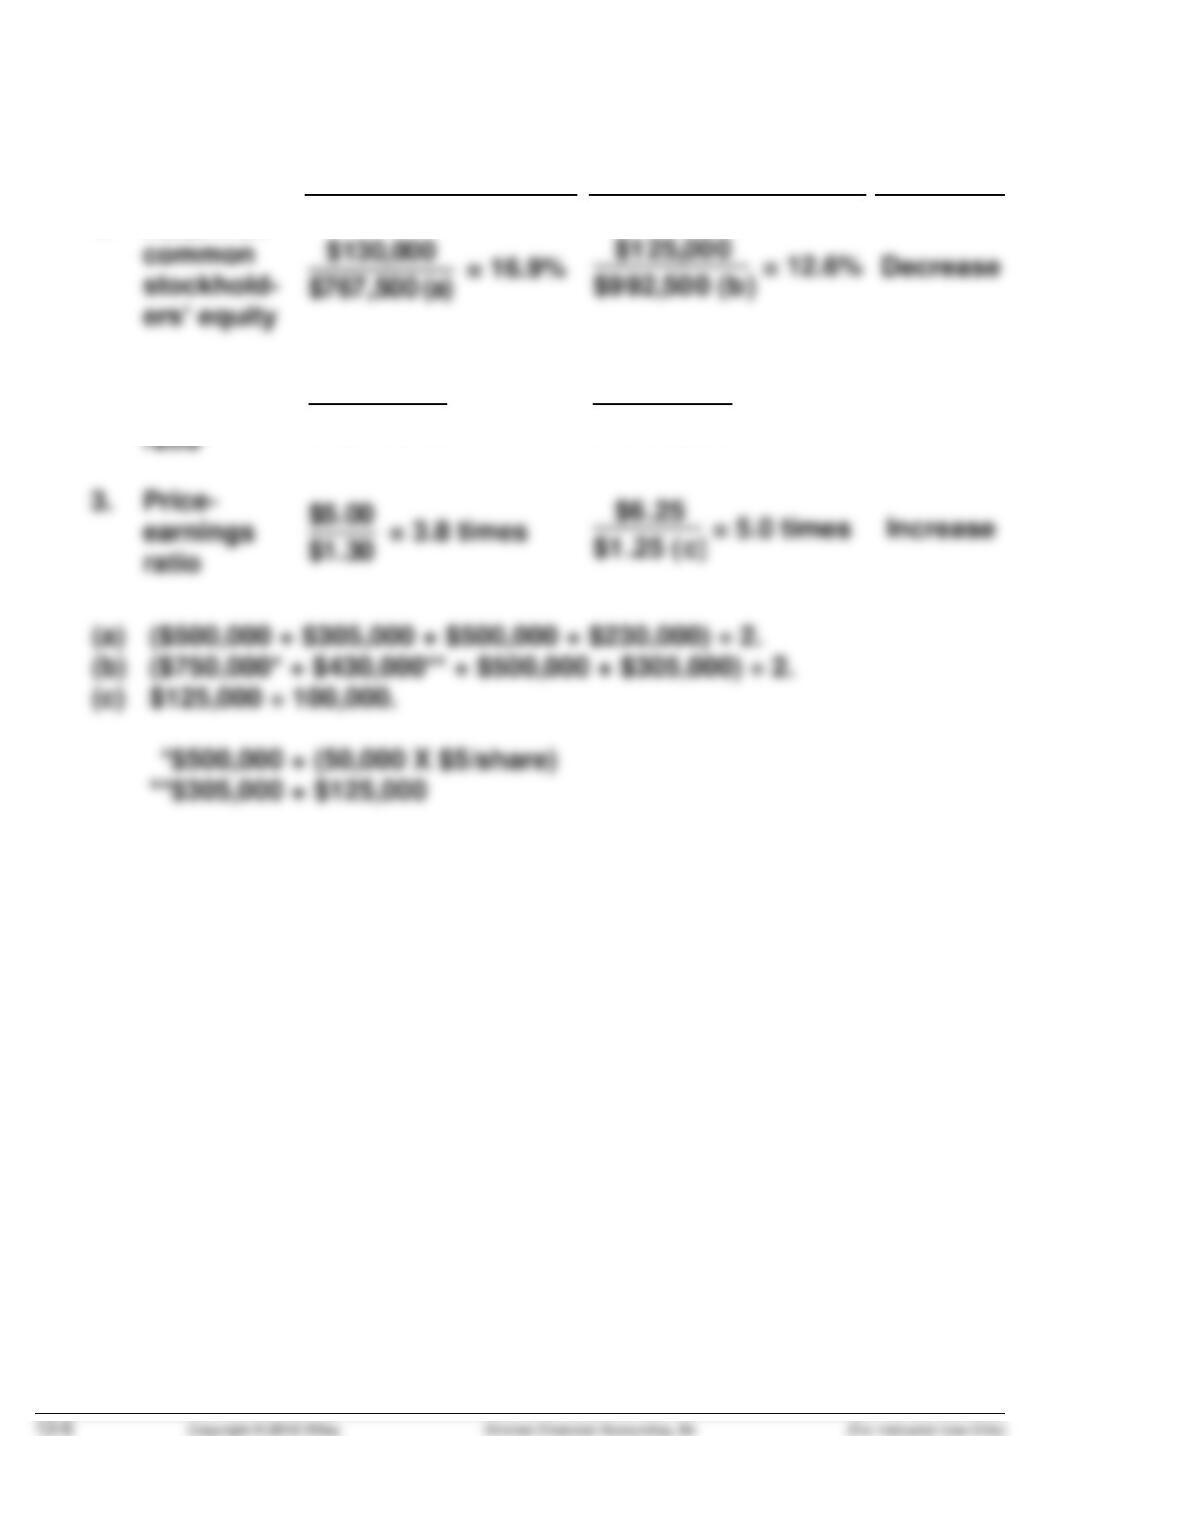
PROBLEM 13-4C (Continued)
(b)
2014
2015
Change
1.
Return on
2.
3.
Price-
Debt
to assets
$510,000
$1,315,000
= 39%
$390,000
$1,450,000
= 27%
Decrease
PROBLEM 13-5C
(a)
Ratio
Stanley Black & Decker, Inc
Snap-On Tools
(All Dollars Are in Millions)
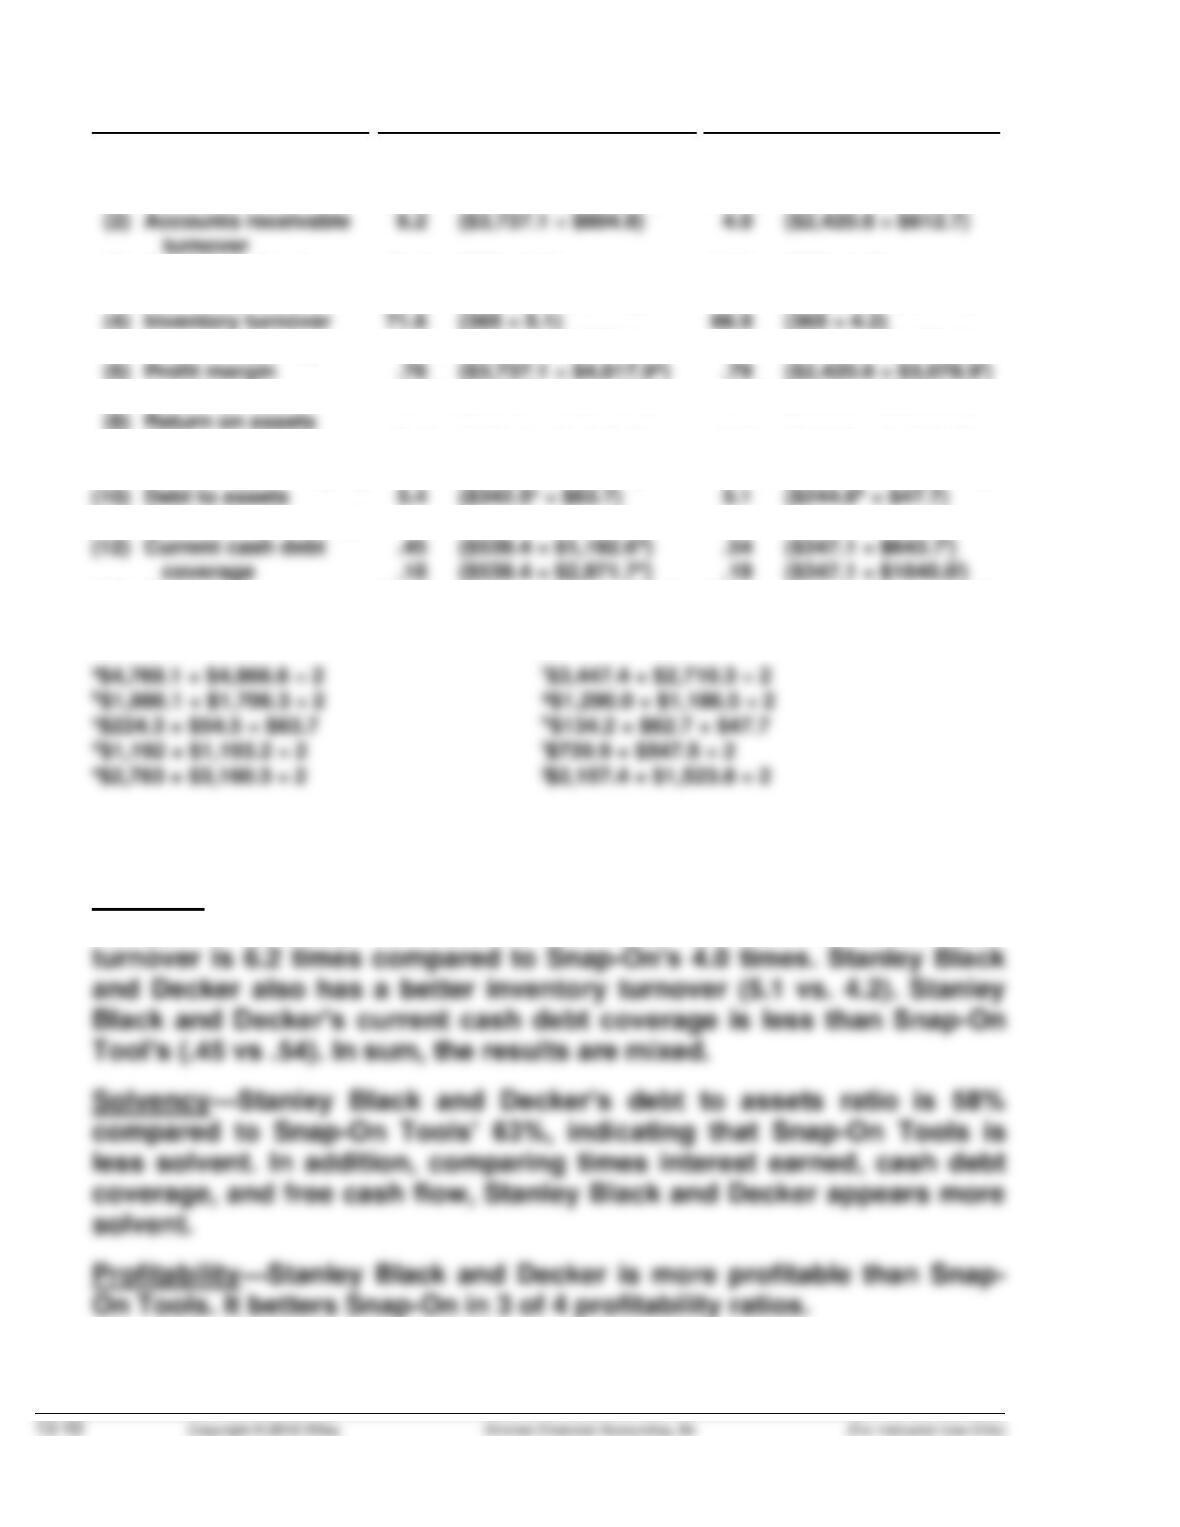
(2) Accounts receivable
turnover
(4) Inventory turnover
(6) Profit margin
(8) Return on assets
(10) Debt to assets
(12) Current cash debt
coverage
(14) Free cash flow
6.2 ($3,737.1 ÷ $604.9)
5.1 ($2,228.8 ÷ $440.5)
6.0 % ($224.3 ÷ $3,737.1)
4.7 % ($224.3 ÷ $4,817.9a)
58 % ($2,783 ÷ $4,769.1)
.45 ($539.4 ÷ $1,192.6d)
$362.9 ($539.4 – $72.9 – $103.6)
4.0 ($2,420.8 ÷ $612.7)
4.2 ($1,345.7 ÷ $316.9)
5.5 % ($134.2 ÷ $2,420.8)
4.4 % ($134.2 ÷ $3,078.9f)
63 % ($2,157.4 ÷ $3,447.4)
.54 ($347.1 ÷ $643.7i)
$213.7 ($347.1 – $64.4 – $69.0)
a$4,769.1 + $4,866.6 ÷ 2 f$3,447.4 + $2,710.3 ÷ 2
b$1,986.1 + $1,706.3 ÷ 2 g$1,290.0 + $1,186.5 ÷ 2
(b) The comparison of the two companies shows the following:
Liquidity—Stanley Black and Decker’s current ratio is only 1.18:1
compared to Snap–On Tools’ 2.27:1 but its accounts receivable
turnover is 6.2 times compared to Snap–On’s 4.0 times. Stanley Black
and Decker also has a better inventory turnover (5.1 vs. 4.2). Stanley
(a)
Ratio
Stanley Black & Decker, Inc
Snap-On Tools
(All Dollars Are in Millions)
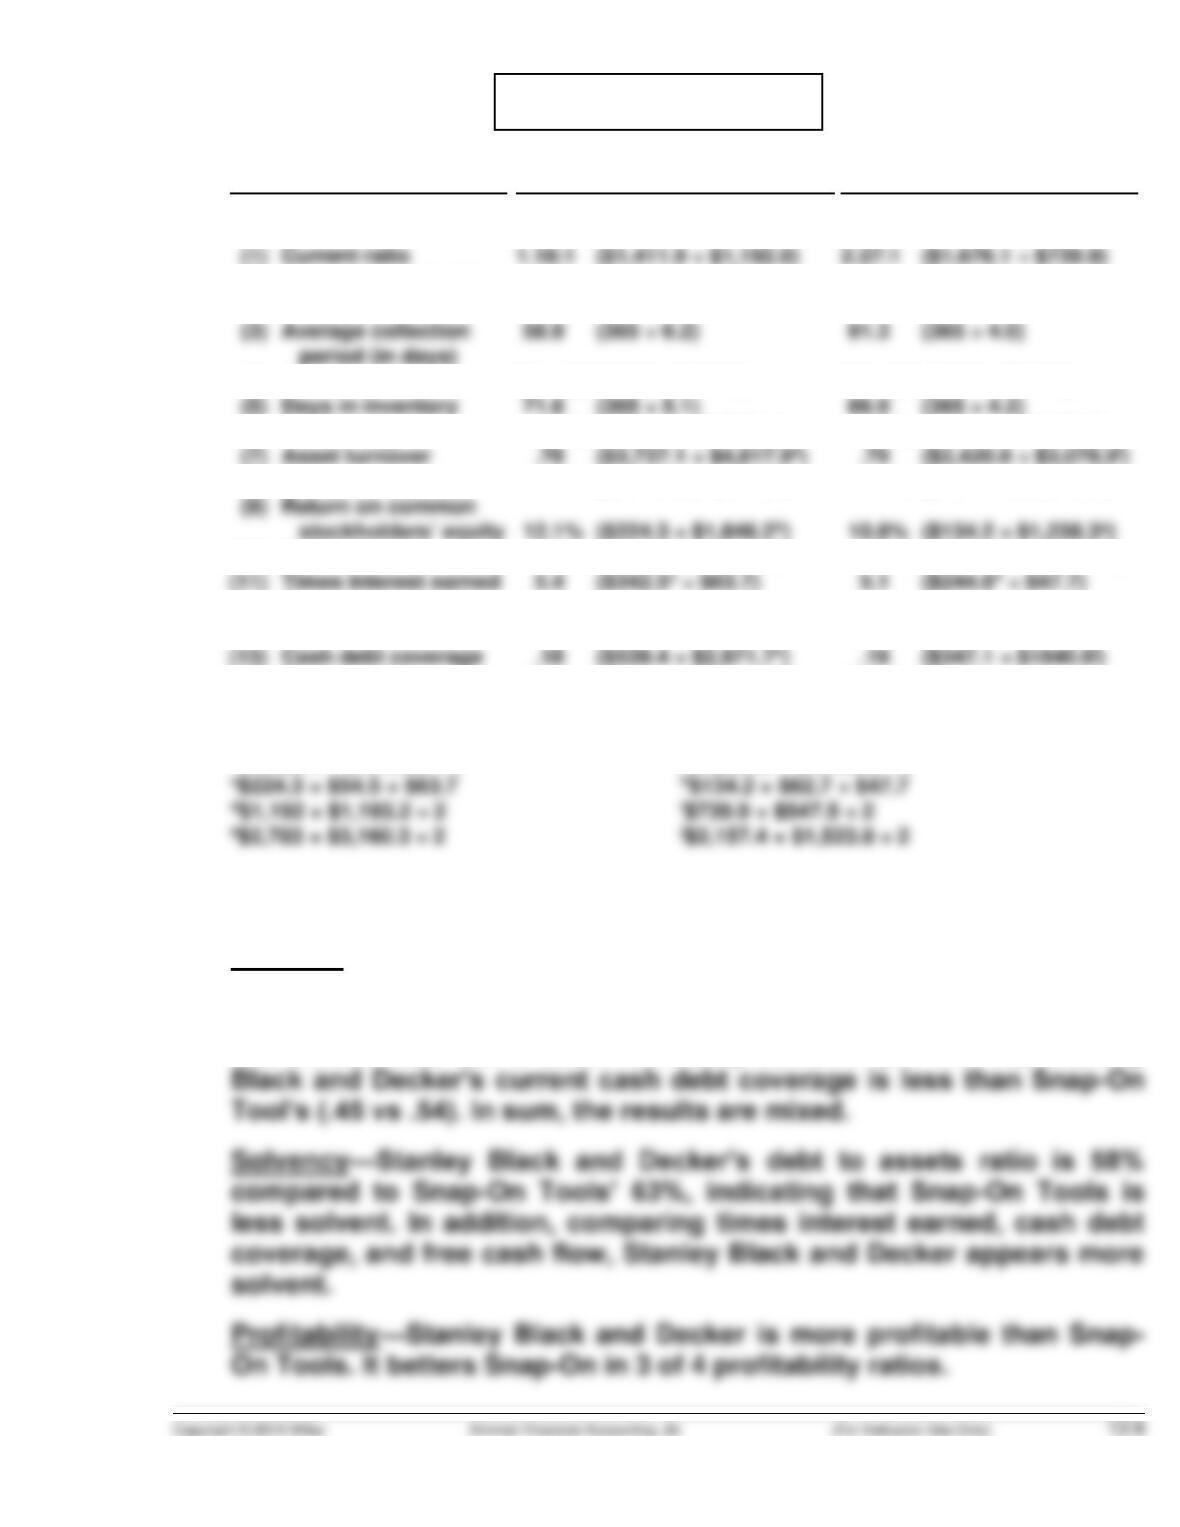
(1) Current ratio
(3) Average collection
period (in days)
(5) Days in inventory
(7) Asset turnover
(9) Return on common
stockholders’ equity
(11) Times interest earned
(13) Cash debt coverage
(14) Free cash flow
1.18:1 ($1,411.9 ÷ $1,192.0)
58.9 (365 ÷ 6.2)
5.1 ($2,228.8 ÷ $440.5)
6.0 % ($224.3 ÷ $3,737.1)
4.7 % ($224.3 ÷ $4,817.9a)
12.1 % ($224.3 ÷ $1,846.2b)
58 % ($2,783 ÷ $4,769.1)
$362.9 ($539.4 – $72.9 – $103.6)
2.27:1 ($1,676.1 ÷ $739.9)
91.3 (365 ÷ 4.0)
4.2 ($1,345.7 ÷ $316.9)
5.5 % ($134.2 ÷ $2,420.8)
4.4 % ($134.2 ÷ $3,078.9f)
10.8 % ($134.2 ÷ $1,238.3g)
63 % ($2,157.4 ÷ $3,447.4)
$213.7 ($347.1 – $64.4 – $69.0)
(b) The comparison of the two companies shows the following:
Liquidity—Stanley Black and Decker’s current ratio is only 1.18:1
compared to Snap-On Tools’ 2.27:1 but its accounts receivable