CHAPTER 27 (FIN MAN); CHAPTER 13 (MAN)
LEAN MANUFACTURING AND ACTIVITY ANALYSIS
DISCUSSION QUESTIONS
1. The lean philosophy focuses on reducing time, cost, and poor quality within manufacturing
and nonmanufacturing processes.
2. Move time and wait time in inventory are examples of non-value-added lead time.
5. Pull or “make to order” manufacturing requires the manufacturer to build product only as it is
needed for actual customer orders. As a result, finished goods, work in process, and materials
inventories are minimized. Make to order manufacturing requires a high degree of flexibility and
insignificant setup costs.
6. Product defects can cause additional costs and unpredictability in the process in the form of
scrap, rework, record keeping, and inspection. In addition, product defects can cause a
process to shut down, because there is very little work in process inventory to keep the next
(downstream) operations running. Thus, a lean manufacturer would wish to eliminate the
negative consequences of product defects.
8. A lean environment will result in fewer (or no) work in process control points. As a result,
there are no in-process transactions into and out of work in process inventory locations
throughout the process. The lean accounting system backflushes cost to finished product
rather than pushing cost through intermediate work in process departments.
9. The raw and in process inventory account combines the materials and work in process
CHAPTER 27 (FIN MAN); CHAPTER 13 (MAN) Lean Manufacturing and Activity Analysis
DISCUSSION QUESTIONS (Concluded)
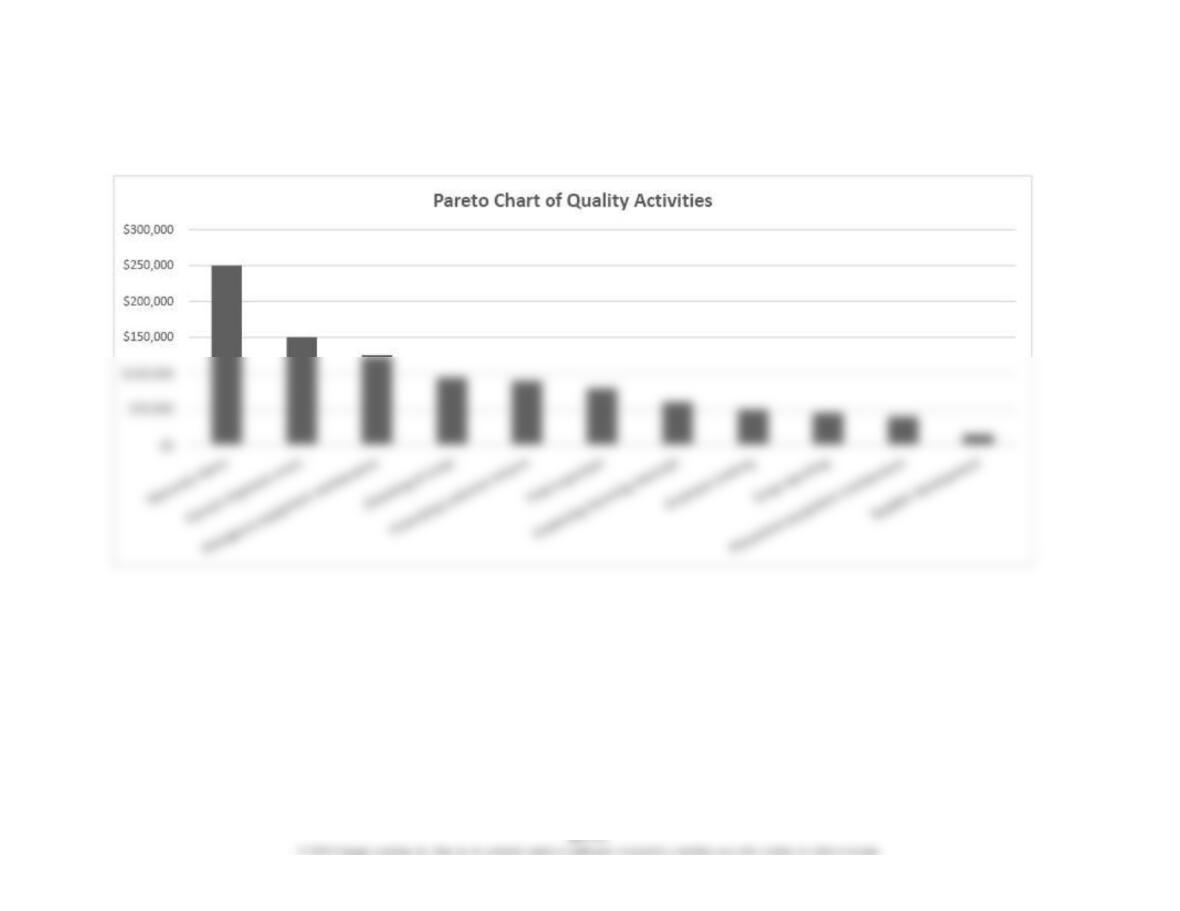
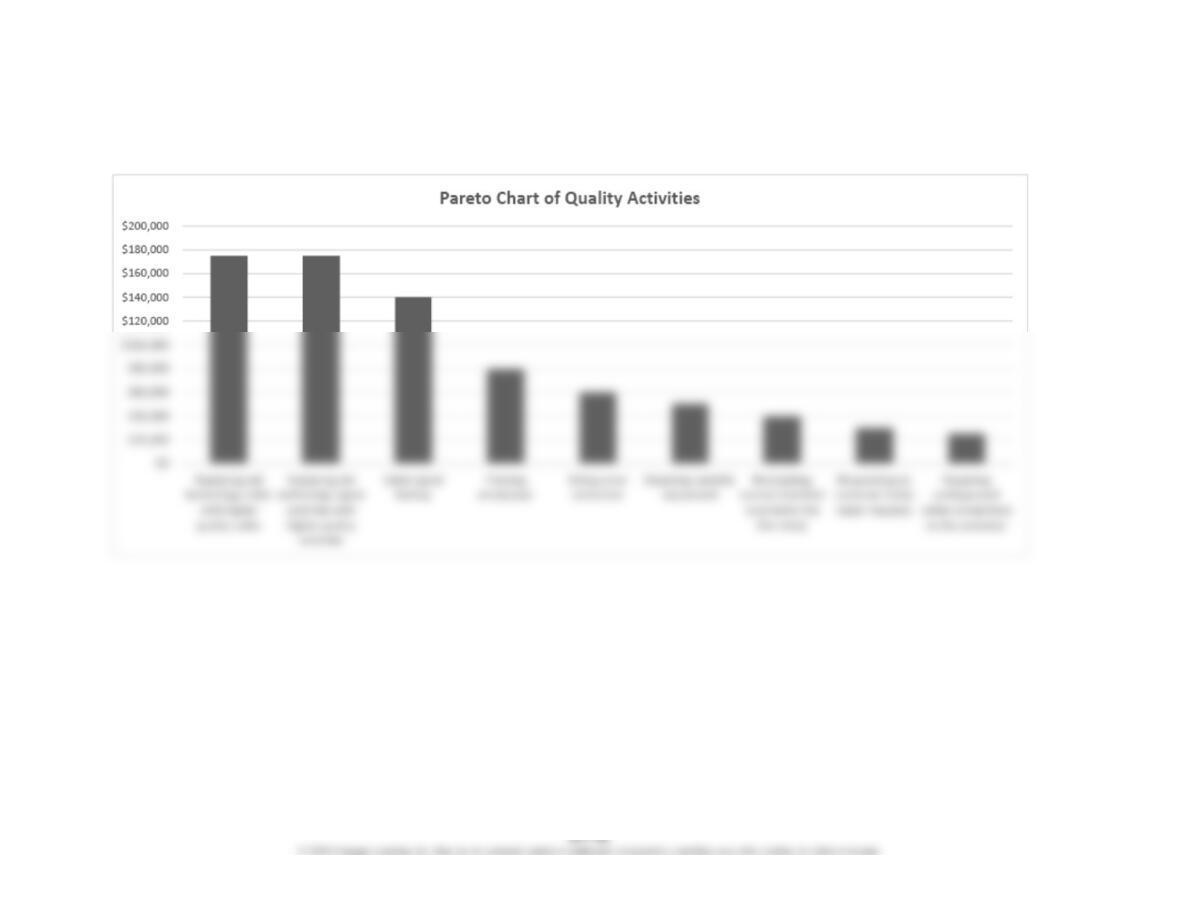
11. A Pareto chart shows the totals of a particular attribute for a number of categories. The
categories are ranked and displayed left to right, so that the largest total is on the left and the
smallest total is on the right. In this way, management can quickly identify important
problems.
CHAPTER 27 (FIN MAN); CHAPTER 13 (MAN) Lean Manufacturing and Activity Analysis
BASIC EXERCISES
BE 27–1 (FIN MAN); BE 13–1 (MAN)
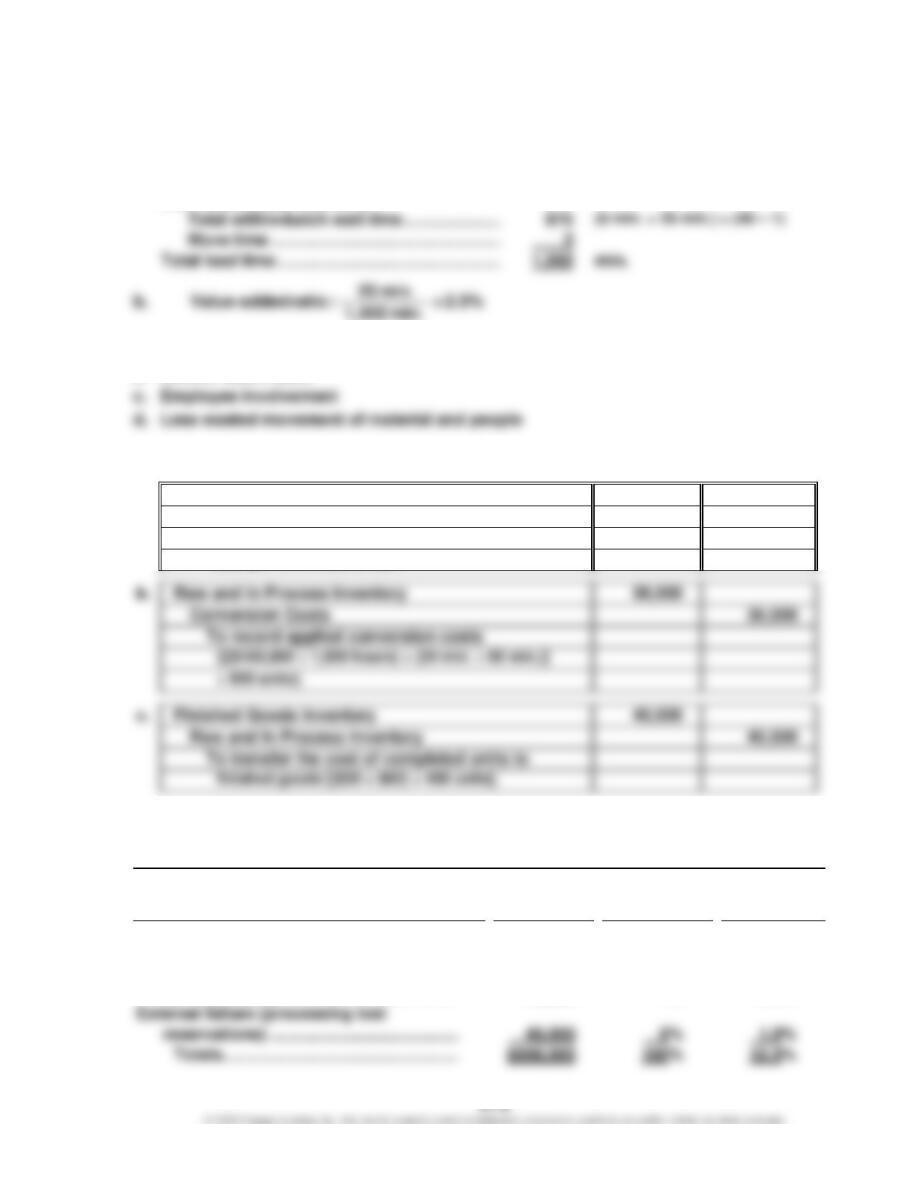
a.
Value-added lead time ………………………………
25
min. (5 min. + 20 min.)
Total within-batch wait time …………………
Move time …………………………………………..
Total lead time …………………………………………
1,002
Non-value-added lead time:
BE 27–2 (FIN MAN); BE 13–2 (MAN)
BE 27–3 (FIN MAN); BE 13–3 (MAN)
a.
Raw and In Process Inventory
15,000
Accounts Payable
15,000
To record materials purchases
Raw and In Process Inventory
36,000
Conversion Costs
36,000
To record applied conversion costs
× 600 units}.
c.
Finished Goods Inventory
40,500
Raw and In Process Inventory
40,500
To transfer the cost of completed units to
finished goods [($30 + $60) × 450 units].
($30 per unit × 500 units).
BE 27–4 (FIN MAN); BE 13–4 (MAN)
Cost of Quality Report
Quality Cost Classification
Quality
Cost
Percent of
Total Quality
Cost
Percent of
Total
Sales
Prevention (employee training) ……………..
$265,000
53%
6.6%
Appraisal (inspecting rooms) ………………..
175,000
35%
4.4%
Internal failure (reworking room
service meals) …………………………………
20,000
4%
0.5%
External failure (processing lost

CHAPTER 27 (FIN MAN); CHAPTER 13 (MAN) Lean Manufacturing and Activity Analysis
BE 27–5 (FIN MAN); BE 13–5 (MAN)
Inspection activity before improvement ……….
$105,600 ÷ 40,000 units = $2.64 per unit
CHAPTER 27 (FIN MAN); CHAPTER 13 (MAN) Lean Manufacturing and Activity Analysis
EXERCISES
Ex. 27–1 (FIN MAN); Ex. 13–1 (MAN)
The CEO must not have been reading the article very carefully. Lean manufacturing is
not primarily an inventory reduction method. Lean manufacturing is a process
improvement philosophy that focuses on reducing time, cost, poor quality, and
uncertainty from a process. Large inventories are merely a symptom of poorly designed
In addition, the CEO has not provided the training or action plan for moving to lean
manufacturing. The CEO has only commanded that it be done. This will create anxiety in
the workforce, and it is not consistent with employee involvement.
Ex. 27–2 (FIN MAN); Ex. 13–2 (MAN)
This is an actual situation facing the U.S. apparel industry. Warren Featherbone and
other U.S.-based apparel manufacturers are discovering the strategic power of lean
manufacturing. Rather than competing with the offshore manufacturers on price,
these companies are providing smaller quantities with much faster delivery. The
retailer is able to order and receive goods in smaller, more frequent batch sizes. As a
result, the retailer is able to move with fashion trends much more quickly. For
CHAPTER 27 (FIN MAN); CHAPTER 13 (MAN) Lean Manufacturing and Activity Analysis
Ex. 27–3 (FIN MAN); Ex. 13–3 (MAN)
Piecework compensation is a characteristic of a traditional manufacturing philosophy
that is inconsistent with lean manufacturing. Under lean manufacturing, workers are
viewed not just as laborers but as valuable assets of the company. The company wants
workers to also bring their minds to the job. Thus, workers should be compensated for
contributing to process improvements, for training themselves to work other jobs in the
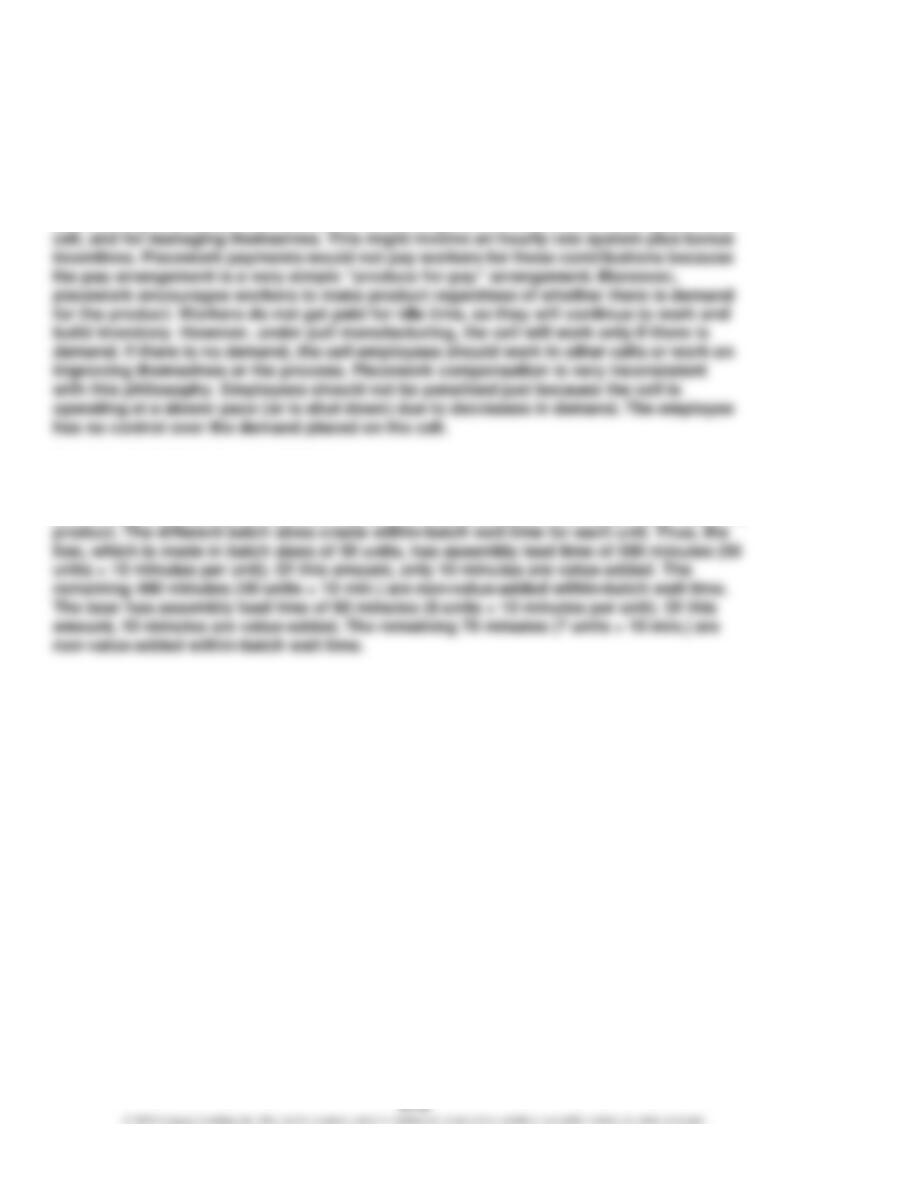
Ex. 27–4 (FIN MAN); Ex. 13–4 (MAN)
Management is incorrect in stating that the direct labor time is equal to the lead time. The
lead time also includes the wait time and other non-value-added time required to make the
CHAPTER 27 (FIN MAN); CHAPTER 13 (MAN) Lean Manufacturing and Activity Analysis
Ex. 27–5 (FIN MAN); Ex. 13–5 (MAN)
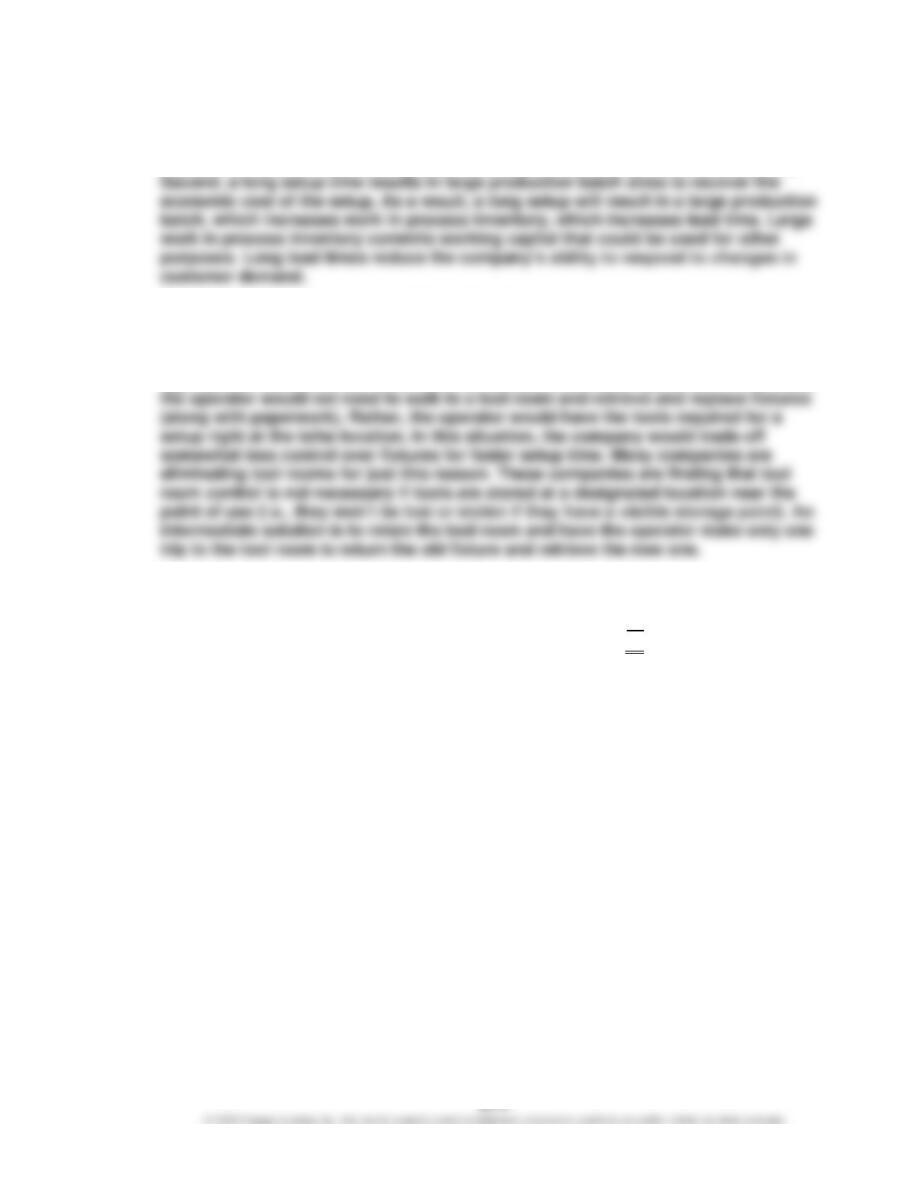
a. Long setup times have two negative consequences. First, a long setup time
consumes valuable machine capacity that could be used for productive purposes.
b. One obvious improvement would be to limit the trips to the tool room to one round
trip, rather than two. However, even this could be improved upon by changing the
location of the fixtures. Changing the location of the fixtures could significantly
reduce the lathe setup time. Instead of using a tool room to control the fixtures, the
appropriate fixtures for the lathe could be located at the lathe operation. In this case,
c.
Turn off machine and remove fixture from lathe ……….
15
minutes
Clean lathe …………………………………………………………….
20
Install new fixture and turn on machine ……………………
5
Total setup time ………………………………………………..
40
minutes*
*
Plus time for replacing and retrieving a tool at a point of use.
CHAPTER 27 (FIN MAN); CHAPTER 13 (MAN) Lean Manufacturing and Activity Analysis
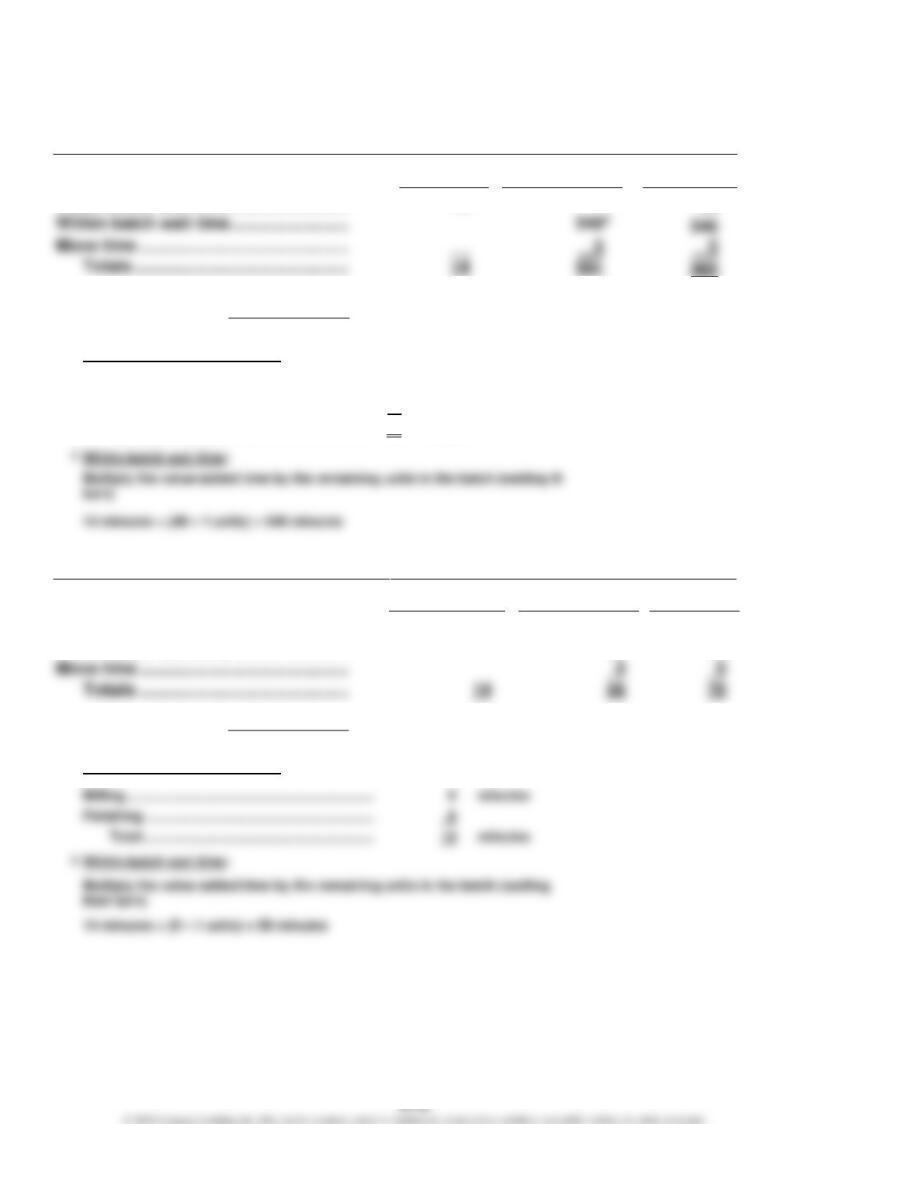
Ex. 27–6 (FIN MAN); Ex. 13–6 (MAN)
Traditional Philosophy
Value-Added
Time
Non-Value-
Added Time
Total
Time
– 14 minutes
Value added ratio: = 2.5%, rounded
565 minutes
1
Total value-added time per unit:
Milling …………………………………………………………
6
minutes
Finishing …………………………………………………….
8
Total ……………………………………………………..
14
minutes
Lean Manufacturing Philosophy
Value-Added
Time
Non-Value-
Added Time
Total
Time
Value-added time …………………………...
141
14
Within-batch wait time …………………….
562
56
Move time ………………………………………
70
– 14 minutes
Value added ratio : = 20.0%
70 minutes
1
Total value-added time per unit:
CHAPTER 27 (FIN MAN); CHAPTER 13 (MAN) Lean Manufacturing and Activity Analysis
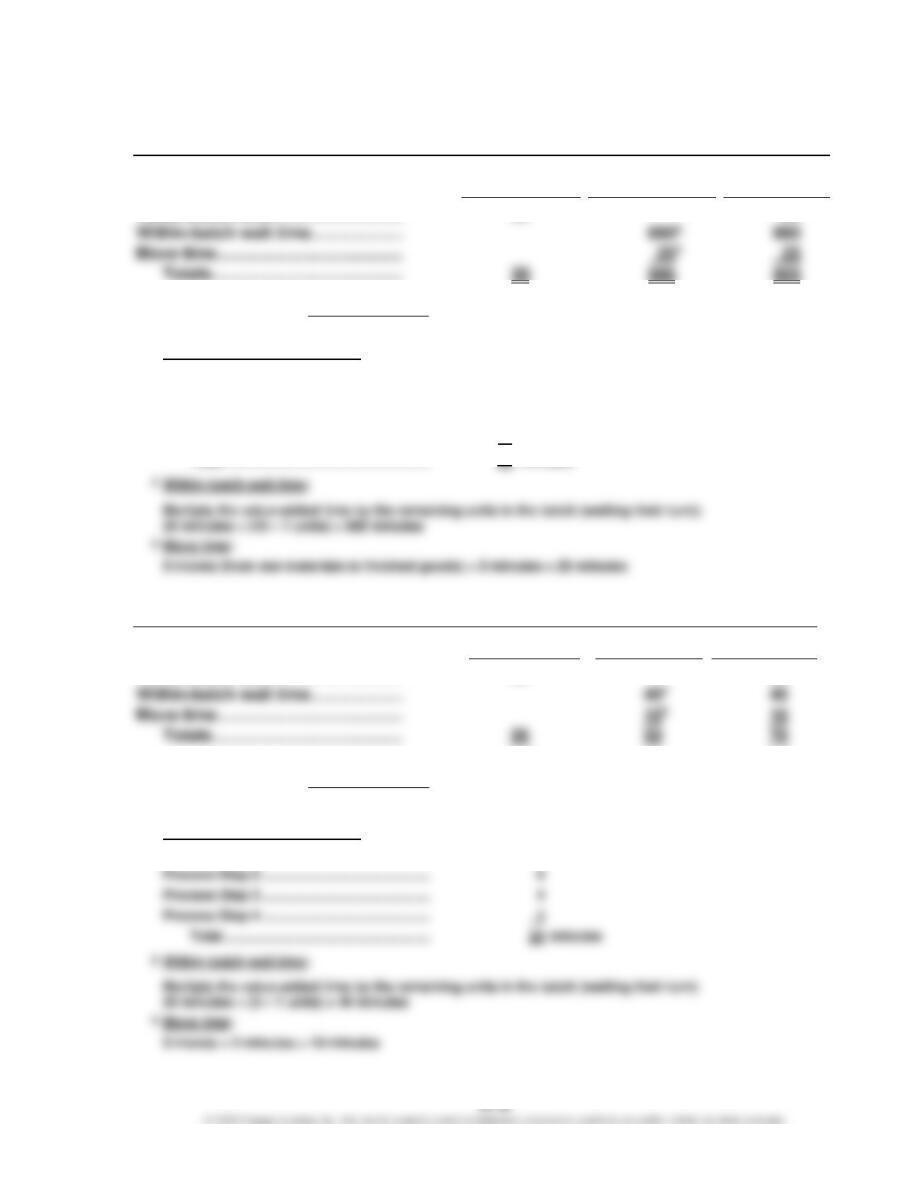
Ex. 27–7 (FIN MAN); Ex. 13–7 (MAN)
a.
Present Approach
Value-Added
Time
Non-Value-
Added Time
Total
Time
Value-added time ……………………….
20
Within-batch wait time ………………..
880
Move time ………………………………….
Totals …………………………………..
20
905
925
– 20 minutes
Value added ratio : = 2.2%, rounded
925 minutes
1
Total value-added time per unit:
Process Step 1 ………………………………………
5
minutes
Process Step 2 ………………………………………
8
Process Step 3 ………………………………………
4
Process Step 4 ………………………………………
3
Within-batch wait time:
3
Move time:
b.
Proposed Lean Approach
Value-Added
Time
Non-Value-
Added Time
Total
Time
Value-added time ……………………….
Within-batch wait time ………………..
40
Move time ………………………………….
10
201
20
– 20 minutes
Value added ratio : = 28.6%, rounded
70 minutes
1
Total value-added time per unit:
Process Step 1 ………………………………………
5
minutes
Process Step 2 ………………………………………
Process Step 3 ………………………………………
Process Step 4 ………………………………………
2
Within-batch wait time:
5 moves × 2 minutes = 10 minutes
CHAPTER 27 (FIN MAN); CHAPTER 13 (MAN) Lean Manufacturing and Activity Analysis
Ex. 27–8 (FIN MAN); Ex. 13–8 (MAN)
a. The Japanese supply chain model is one based on long-term arrangements and
partnership. The Japanese automobile manufacturers want their suppliers to be
b. These suppliers support the Japanese system because it provides for win–win
opportunities, whereby the customer and the supplier can both be successful. The
suppliers are concerned about their margins being squeezed down to the point that
business over time.
c. Supply chain management is often beneficial to the customer. However, the
customer may have to trade off between short-term and longer-term benefits. For
CHAPTER 27 (FIN MAN); CHAPTER 13 (MAN) Lean Manufacturing and Activity Analysis
Ex. 27–9 (FIN MAN); Ex. 13–9 (MAN)
Quickie’s team approaches are very different from using a manager to hire and evaluate
employees. First, the input of many individuals goes into the hiring decision. In this way,
the viewpoints of a variety of people are brought into the decision. Moreover, the new hire
needs to “fit” with the culture of the team. Team-based hiring can produce a higher
probability of having an effective team member by having a good fit. A possible concern is
CHAPTER 27 (FIN MAN); CHAPTER 13 (MAN) Lean Manufacturing and Activity Analysis
Ex. 27–10 (FIN MAN); Ex. 13–10 (MAN)
a. The present Daddy-O’s service delivery system is an example of a push system.
Special orders are “pushed” through the system. The order is placed at the
have to wait for the complete cook and dress cycle to be completed.
b. A new system could be designed so that a custom order is introduced after cooking
the burger, rather than prior to cooking. In this way, hamburgers are made to order
without the use of finished goods inventory. Under this process, assume a customer
ordered a hamburger with ketchup and pickles only. The order would be received at
the dressing station. Here, a food preparer would take a hamburger off the grill and
place ketchup and pickles on the burger using materials at the dressing station
(termed point-of-use materials). The hamburger that is pulled from the grill would
Note to Instructors: You may recognize that the first system described in this exercise is
similar to the method invented by McDonald’s, while Wendy’s uses the second method.
McDonald’s indicated that it was switching its method to work more like Wendy’s
CHAPTER 27 (FIN MAN); CHAPTER 13 (MAN) Lean Manufacturing and Activity Analysis
Ex. 27–11 (FIN MAN); Ex. 13–11 (MAN)
The production manager probably has some good points. If the accounting system does
not change when an organization embraces a lean strategy, then there will likely be
complaints. A conventional accounting system needs to have a strong accounting control
orientation. Under lean manufacturing, the accounting system can be designed with much
wider transaction control intervals. The company could have a very wide transaction
The direct labor reporting can be eliminated. Using lean accounting practices, the direct
labor employees are assigned to production cells. Their wages are treated as part of the
cell’s conversion costs and are not separately traced or reported. The traditional financial
measures should be supplemented with nonfinancial measures, such as schedule
CHAPTER 27 (FIN MAN); CHAPTER 13 (MAN) Lean Manufacturing and Activity Analysis
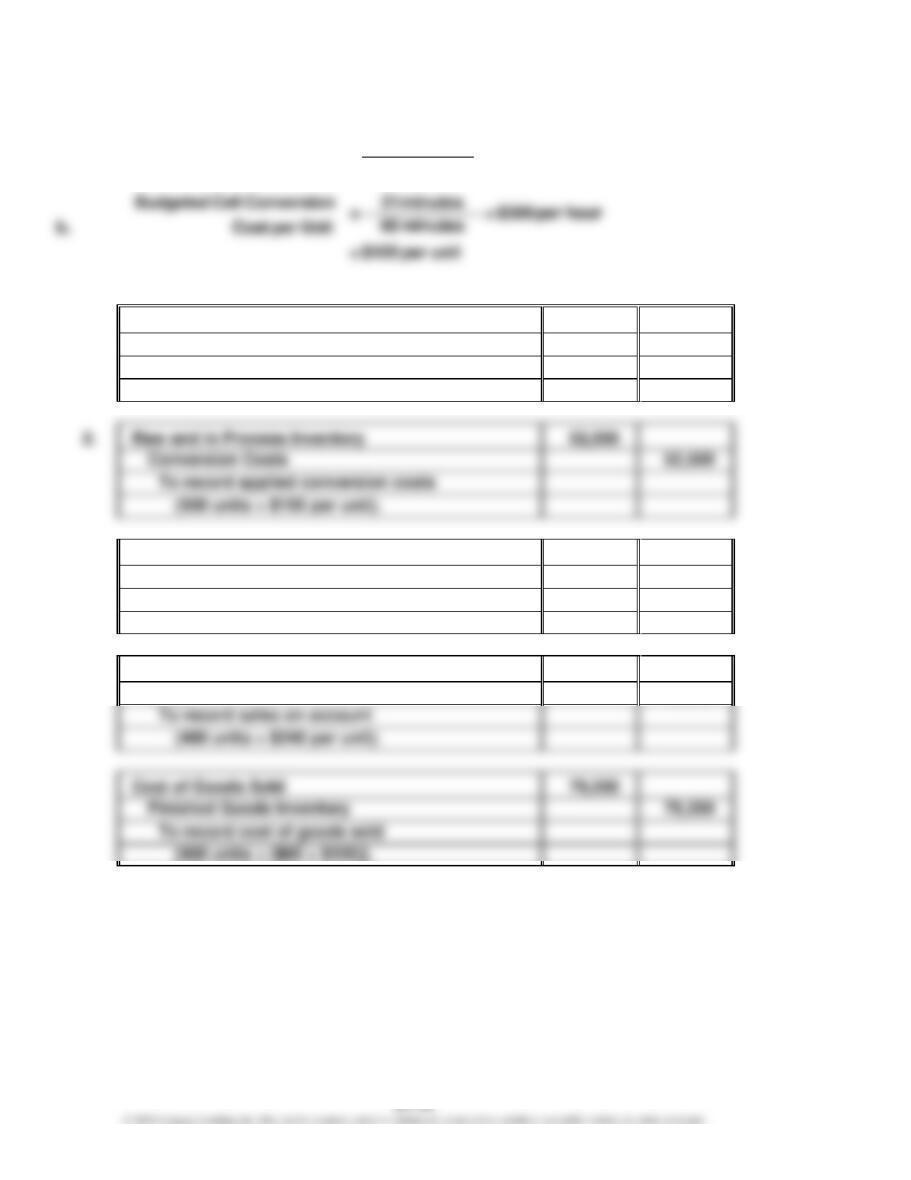
Ex. 27–12 (FIN MAN); Ex. 13–12 (MAN)
a.
Budgeted Cell Conversion $600,000
== $300 per hour
2,000 hours
Cost Rate
c.
1.
Raw and In Process Inventory
30,000
Accounts Payable
30,000
To record materials purchases
(500 units × $60 per unit).
2.
Raw and In Process Inventory
52,500
3.
Finished Goods Inventory
82,500
Raw and In Process Inventory
82,500
To transfer the cost of completed units to
finished goods [500 units × ($60 + $105)].
4.
Accounts Receivable
115,200
Sales
115,200
To record sales on account
Cost of Goods Sold
79,200
Finished Goods Inventory
79,200
To record cost of goods sold
CHAPTER 27 (FIN MAN); CHAPTER 13 (MAN) Lean Manufacturing and Activity Analysis
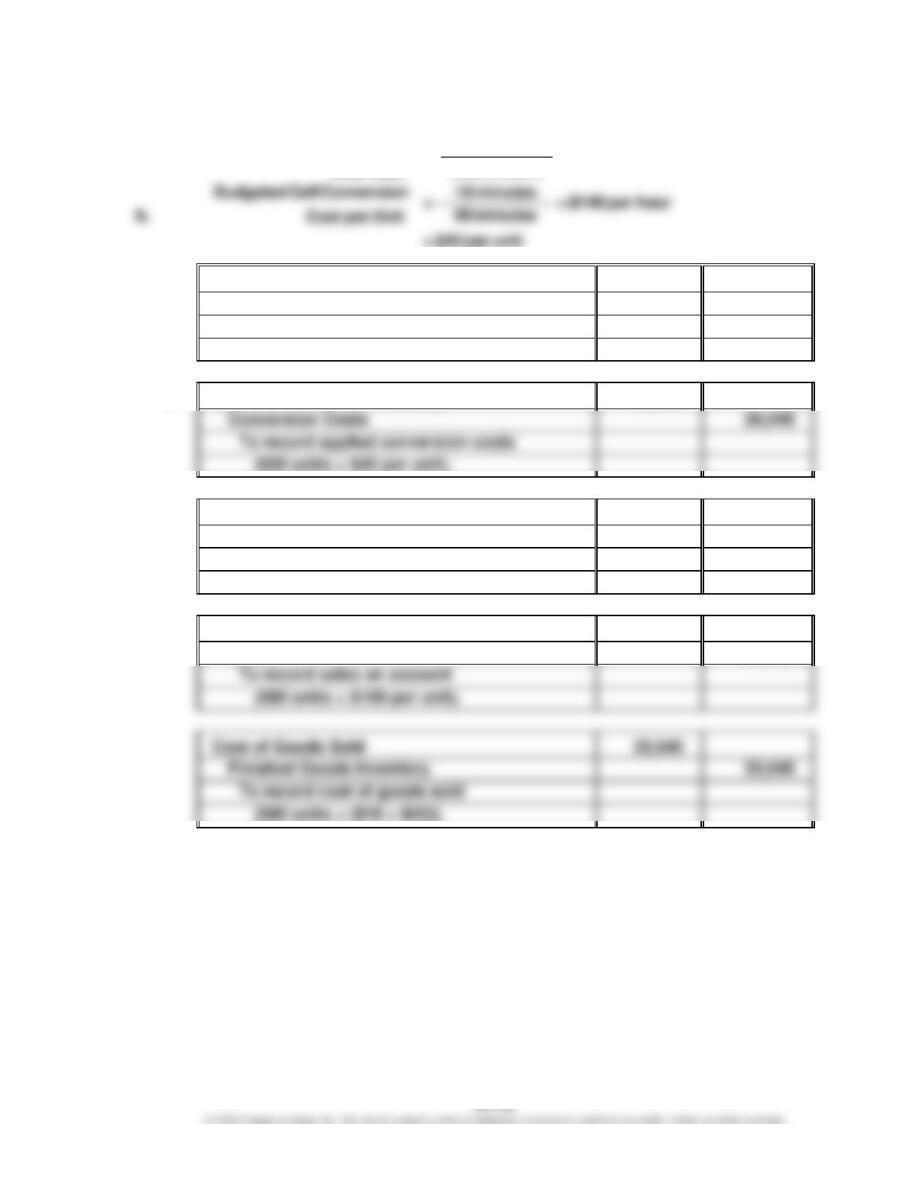
Ex. 27–13 (FIN MAN); Ex. 13–13 (MAN)
a.
Budgeted Cell Conversion $308,000
= = $140 per hour
= $42 per unit
c.
1.
Raw and In Process Inventory
9,920
Accounts Payable
9,920
To record materials purchases
(620 units × $16 per unit).
2.
Raw and In Process Inventory
26,040
26,040
To record applied conversion costs
(620 units × $42 per unit).
3.
Finished Goods Inventory
34,800
Raw and In Process Inventory
34,800
To transfer the cost of completed units to
finished goods [600 units × ($16 + $42)].
4.
Accounts Receivable
58,000
Sales
58,000
To record sales on account
(580 units × $100 per unit).
Cost of Goods Sold
33,640
Finished Goods Inventory
33,640
To record cost of goods sold
CHAPTER 27 (FIN MAN); CHAPTER 13 (MAN) Lean Manufacturing and Activity Analysis
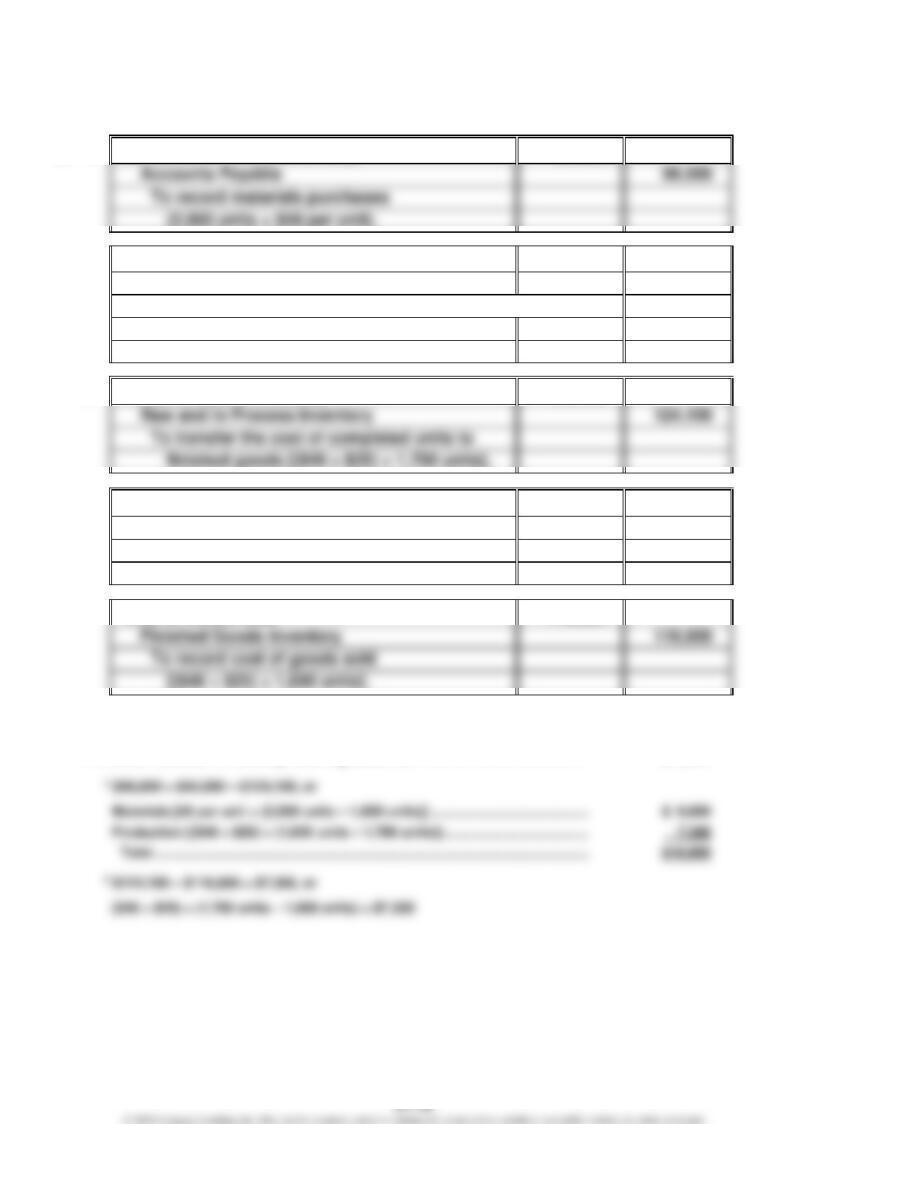
Ex. 27–14 (FIN MAN); Ex. 13–14 (MAN)
a.
1.
Raw and In Process Inventory
96,000
To record materials purchases
(2,000 units × $48 per unit).
2.
Raw and In Process Inventory
45,000
Conversion Costs
45,000
To record applied conversion costs
{[($50,000 ÷ 800 hours) × (24 min. ÷ 60 min.)]
× 1,800 units}.
3.
Finished Goods Inventory
124,100
4.
Accounts Receivable
144,000
Sales
144,000
To record sales on account
($90 per unit × 1,600 units).
Cost of Goods Sold
116,800
116,800
To record cost of goods sold
b.
Raw and In Process Inventory, ending balance1 ………………………..
$16,900
Finished Goods Inventory, ending balance2 ……………………………..
$7,300
CHAPTER 27 (FIN MAN); CHAPTER 13 (MAN) Lean Manufacturing and Activity Analysis
Ex. 27–15 (FIN MAN); Ex. 13–15 (MAN)
CHAPTER 27 (FIN MAN); CHAPTER 13 (MAN) Lean Manufacturing and Activity Analysis
Ex. 27–16 (FIN MAN); Ex. 13–16 (MAN)
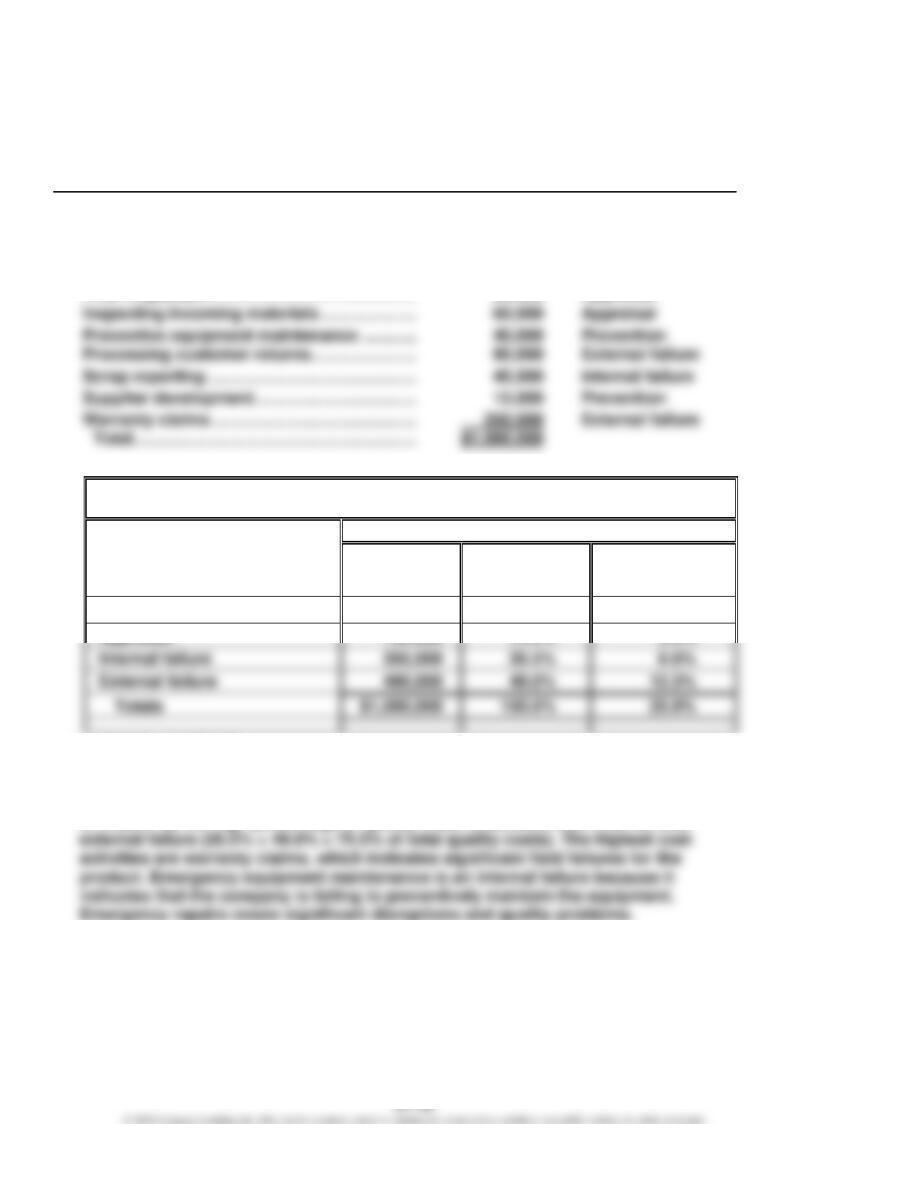
a. Activities classified by cost of quality:
Activity Cost
Quality Cost
Classification
Quality Activities
Correct shipment errors ………………………….
$ 150,000
External failure
Disposing of scrap …………………………..……..
95,000
Internal failure
Emergency equipment maintenance ………..
125,000
Internal failure
Employee training …………………………………..
50,000
Prevention
Final inspection ………………………………………
80,000
Appraisal
Inspecting incoming materials …………………
60,000
Appraisal
Scrap reporting ………………………………………
45,000
Internal failure
Supplier development ……………………………..
15,000
Prevention
b.
Meagher Solutions Inc.
Cost of Quality Report
Quality Cost Classification
Cost Summary
Quality
Cost
Percent of
Total
Quality Cost
Percent
of Total
Sales
Prevention
$ 105,000
10.5%1
2.6%2
1
$105,000 ÷ $1,000,000
2
$105,000 ÷ $4,000,000
c. The majority of the company’s quality efforts are in correcting quality problems. This
CHAPTER 27 (FIN MAN); CHAPTER 13 (MAN) Lean Manufacturing and Activity Analysis
Ex. 27–17 (FIN MAN); Ex. 13–17 (MAN)
CHAPTER 27 (FIN MAN); CHAPTER 13 (MAN) Lean Manufacturing and Activity Analysis
Ex. 27–18 (FIN MAN); Ex. 13–18 (MAN)
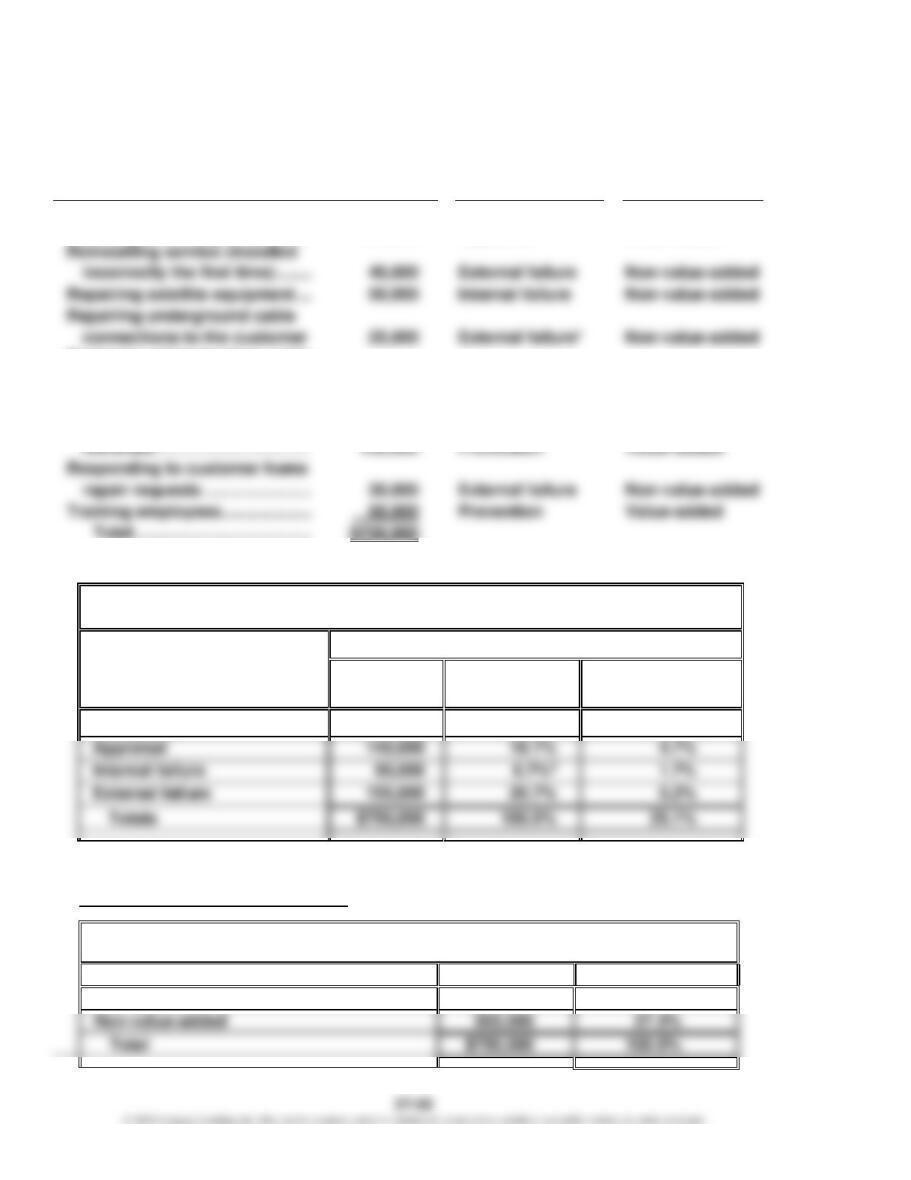
a. Quality cost and value-added/non-value-added classifications:
Quality Activities
Activity
Cost
Quality Cost
Classification
Value-Added/
Non-Value-Added
Classification
Billing error correction …………..
$ 60,000
External failure
Non-value-added
Cable signal testing ……………….
140,000
Appraisal
Value-added
Reinstalling service (installed
incorrectly the first time) …….
Non-value-added
Repairing underground cable
connections to the customer
Non-value-added
Replacing old technology cable
with higher quality cable …….
175,000
Prevention
Value-added
Replacing old technology signal
switches with higher quality
Training employees ……………….
Total …………………………..……
$750,000
* This is an external failure because the underground cable connection needs to be repaired after
receiving notification of disrupted service from a customer.
b.
Three Rivers Inc.
Cost of Quality Report
Quality Cost Classification
Cost Summary
Quality
Cost
Percent of
Total
Quality Cost
Percent
of Total
Sales
Prevention
$405,000
54.0%1
13.5%2
$750,000
1
$405,000 ÷ $750,000
2
$405,000 ÷ $3,000,000
3
Unrounded percentages total to 100.0%.
c.
Three Rivers Inc.
Value-Added/Non-Value-Added Activity Analysis
Category
Amount
Percent
Value-added
$545,000
72.7%