CHAPTER 13 Emerging Topics in Managerial Accounting
P 13-53 (Continued)
significant changes to their beverage portfolios in recent years, moving away
from traditional soda and soft drinks and toward bottled waters.
c. Conducting sustainability activities might help Dorsey Scott discover more
financially viable ways to manufacture and distribute its beverages to
customers. For example, companies often find that environmentally friendly
ways of conducting business produce unexpected financial benefits or
P 13-54
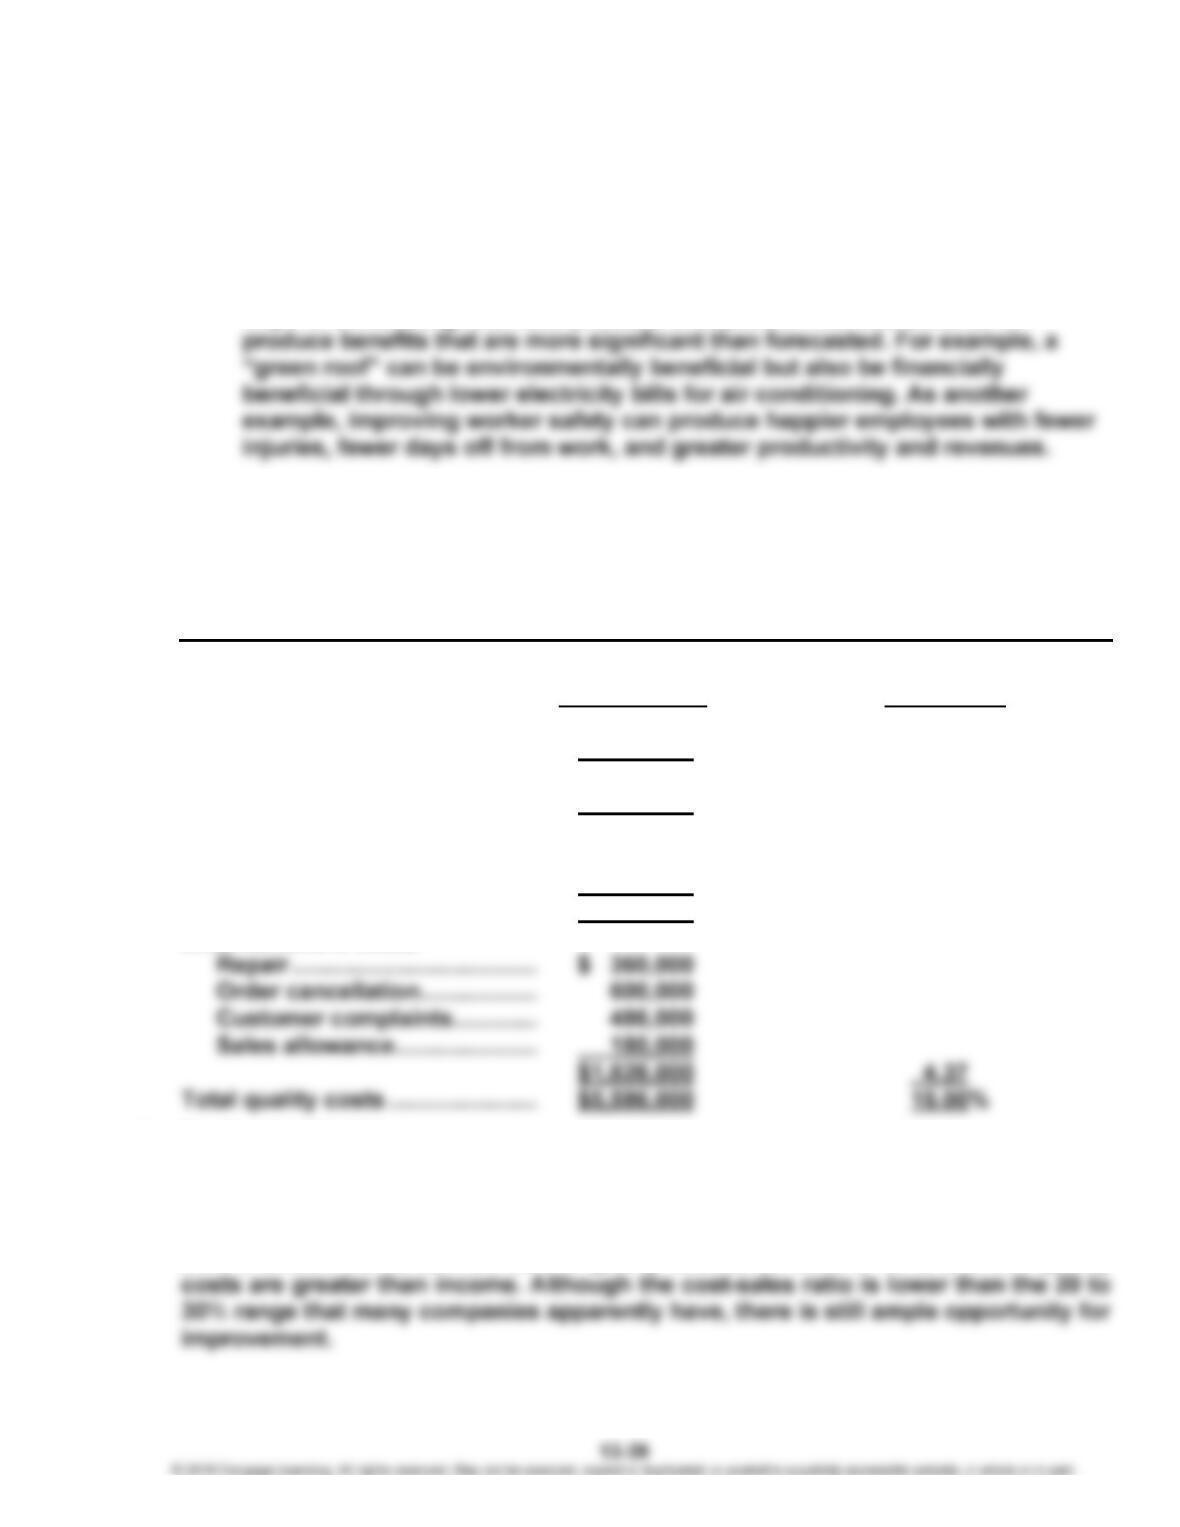
1. Tidwell Company
Quality Cost Report
For the Year Ended 20X1
Percentage
Quality Costs of Sales
Prevention costs:
Quality training ………………….. $ 120,000 0.32%
Appraisal costs:
Product acceptance …………… $ 960,000 2.58
Internal failure costs:
Scrap ………………………………… $1,800,000
Rework ……………………………… 1,080,000
$2,880,000 7.73
External failure costs:
2. Profits: $4,000,000
Quality costs: $5,586,000
Quality costs/Sales = 15.00%
Quality costs/Profits = 139.65%
Danna should be concerned as the quality cost-sales ratio is 15%, and the quality
CHAPTER 13 Emerging Topics in Managerial Accounting
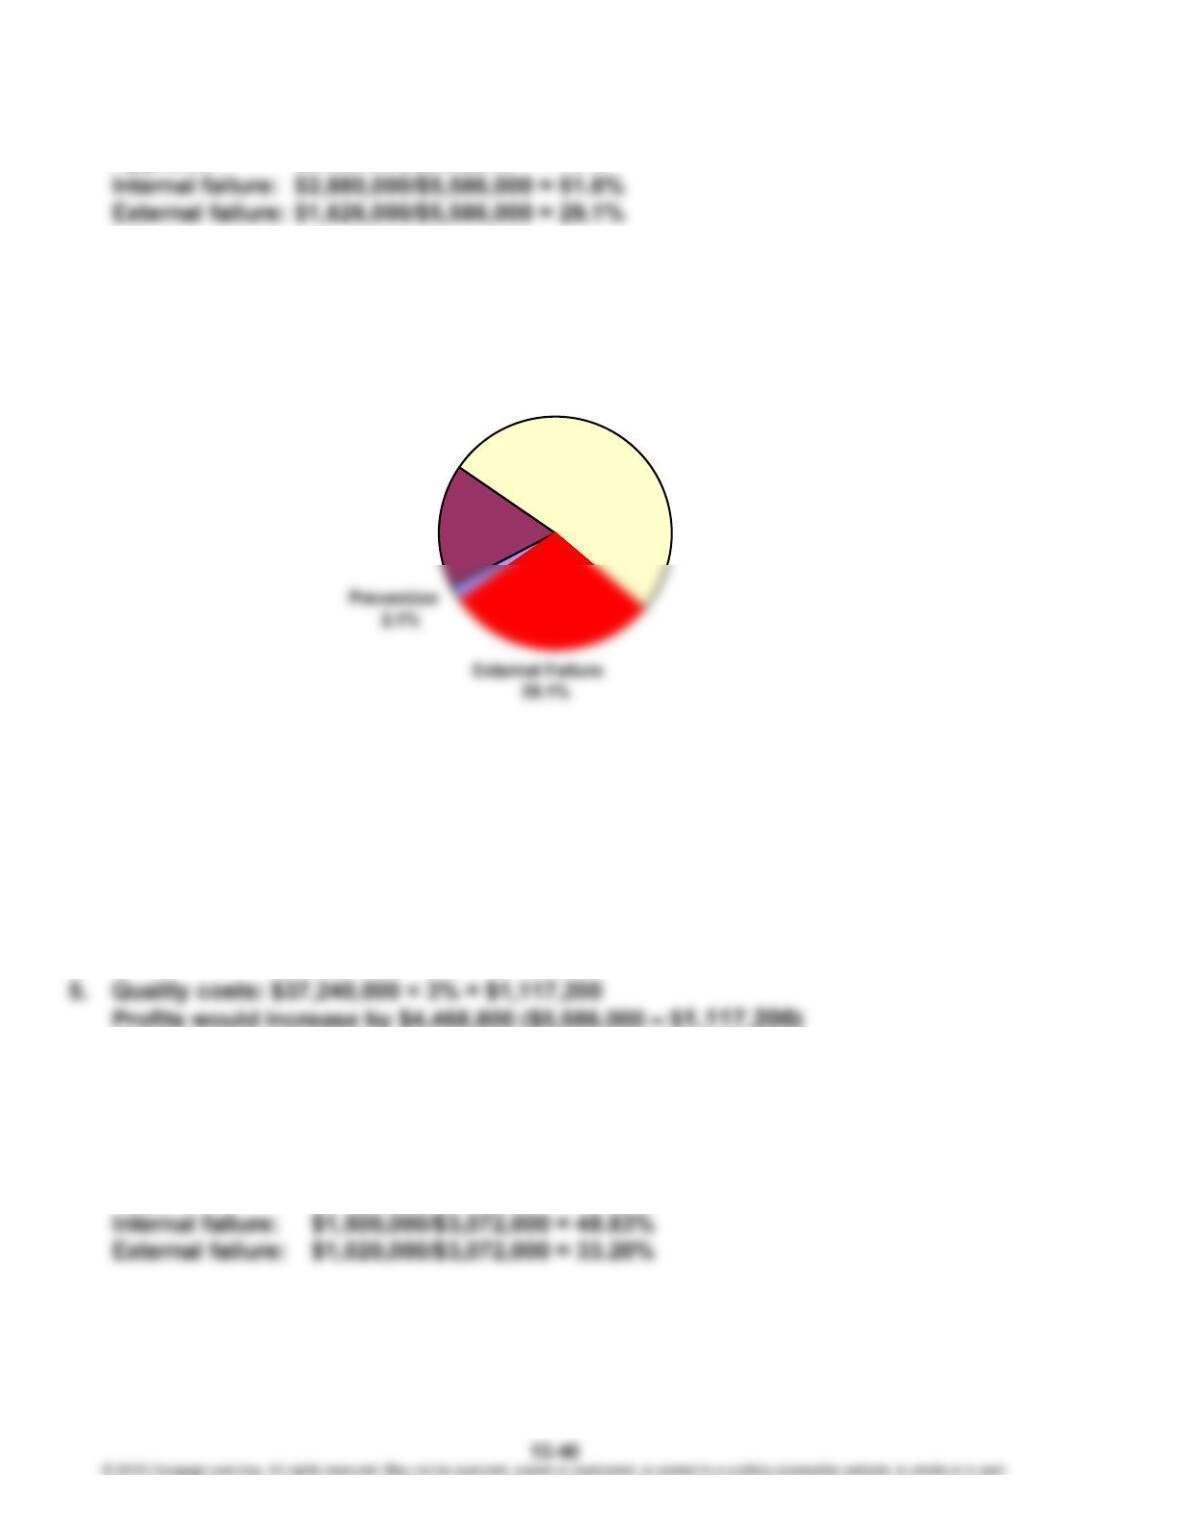
3. Prevention: $120,000/$5,586,000 = 2.1%
Appraisal: $960,000/$5,586,000 = 17.2%
The pie chart is as follows:
Too much is spent on failure costs. These costs are nonvalue-added costs and
should eventually be eliminated. Prevention and appraisal activities should be given
much more emphasis. If anything, experiences of real-world companies indicate
that the control costs should be 80% of total quality costs and the failure costs 20%.
The distribution of quality costs needs to be reversed!
4. The company should increase prevention and appraisal costs. The additional
amounts spent on these programs will be recouped with additional savings from a
resulting decrease in failure costs.
P 13-55
1. 20X1
Prevention: $12,000/$3,072,000 = 0.39%
Appraisal: $540,000/$3,072,000 = 17.58%
17.2%
51.6%
Relative Distribution of Quality Costs
Internal Failure
Appraisal
CHAPTER 13 Emerging Topics in Managerial Accounting
P 13-55 (Continued)
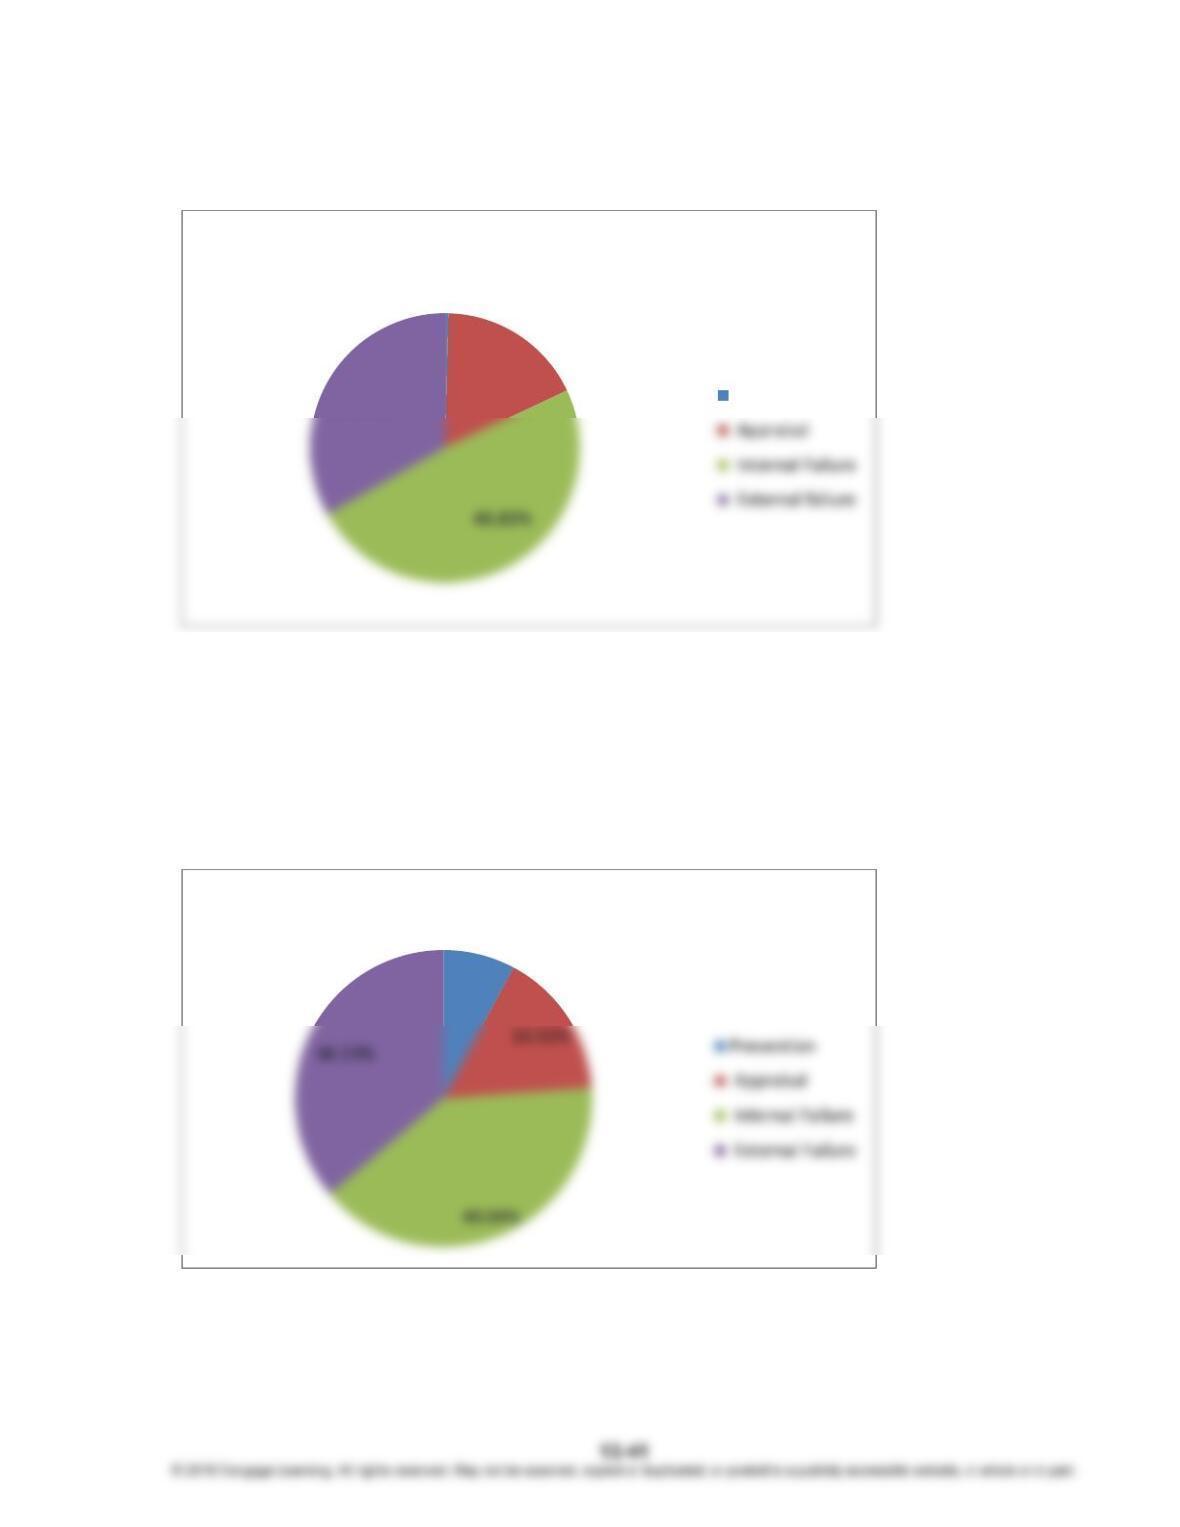
The pie chart for 20X1 is as follows:
20X2
Prevention: $240,000/$3,072,000 = 7.81%
Appraisal: $492,000/$3,072,000 = 16.02%
Internal failure: $1,230,000/$3,072,000 = 40.04%
External failure: $1,110,000/$3,072,000 = 36.13%
The pie chart for 20X2 is as follows:
Yes. More effort is clearly needed for prevention and appraisal activities. The
movement is in that direction, and total failure costs have declined.
0.39%
17.58%
33.20%
PercentageofTotalQualityCosts
Prevention
7.81%
RelativeDistributionofQualityCosts
CHAPTER 13 Emerging Topics in Managerial Accounting
P 13-55 (Concluded)
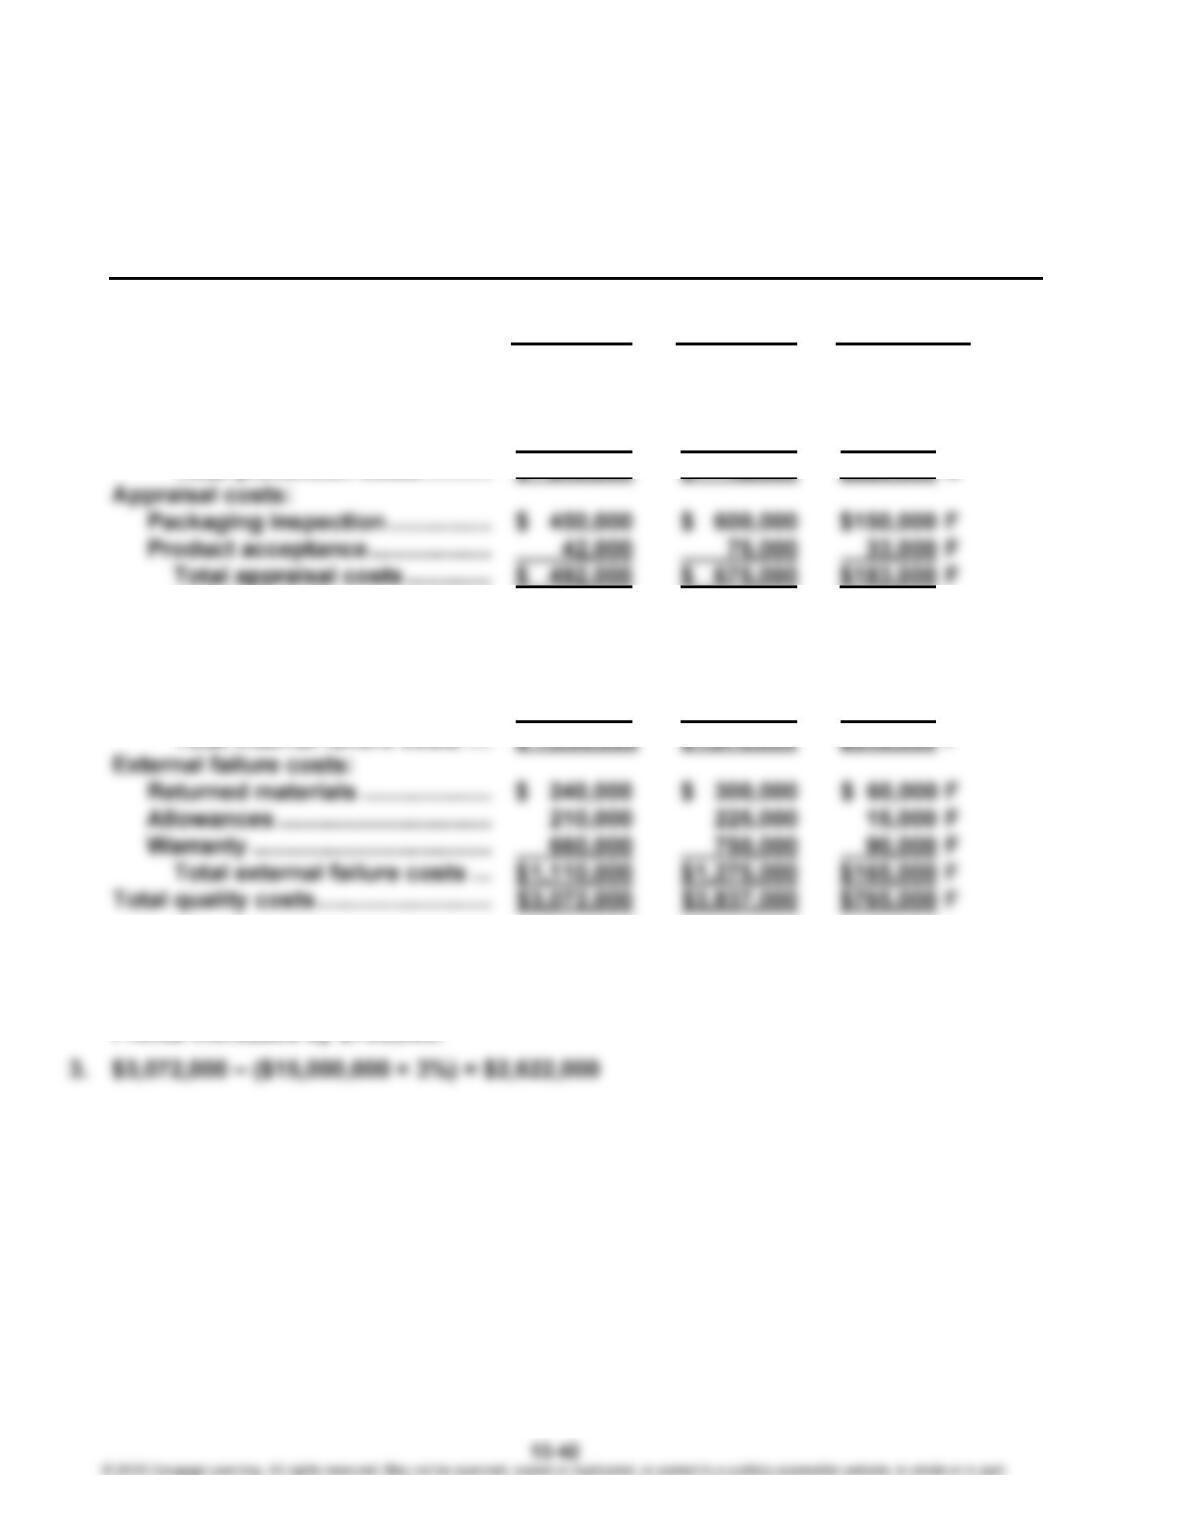
2. Clarkson Inc.
Performance Report: Quality Costs
One-Year Trend
For the Year Ended December 31, 20X2
Actual Costs Actual Costs*
20X2 20X1 Variance
Prevention costs:
Quality circles ………………………. $ 60,000 $ 6,000 $ 54,000 U
Design reviews ……………………… 30,000 3,000 27,000 U
Quality improvement projects .. 150,000 3,000 147,000 U
Internal failure costs:
Scrap ……………………………………. $ 360,000 $ 525,000 $165,000 F
Rework …………………………………. 480,000 675,000 195,000 F
Yield losses ………………………….. 150,000 300,000 150,000 F
Retesting ……………………………… 240,000 375,000 135,000 F
* To compare 20X2 costs with 20X1 costs, the costs for 20X1 must be adjusted to a sales level of
$15,000,000. Thus, all variable costs will change from the 20X1 levels. For example, the adjusted
product packaging inspection cost is ($480,000/$12,000,000) × $15,000,000 = $600,000.
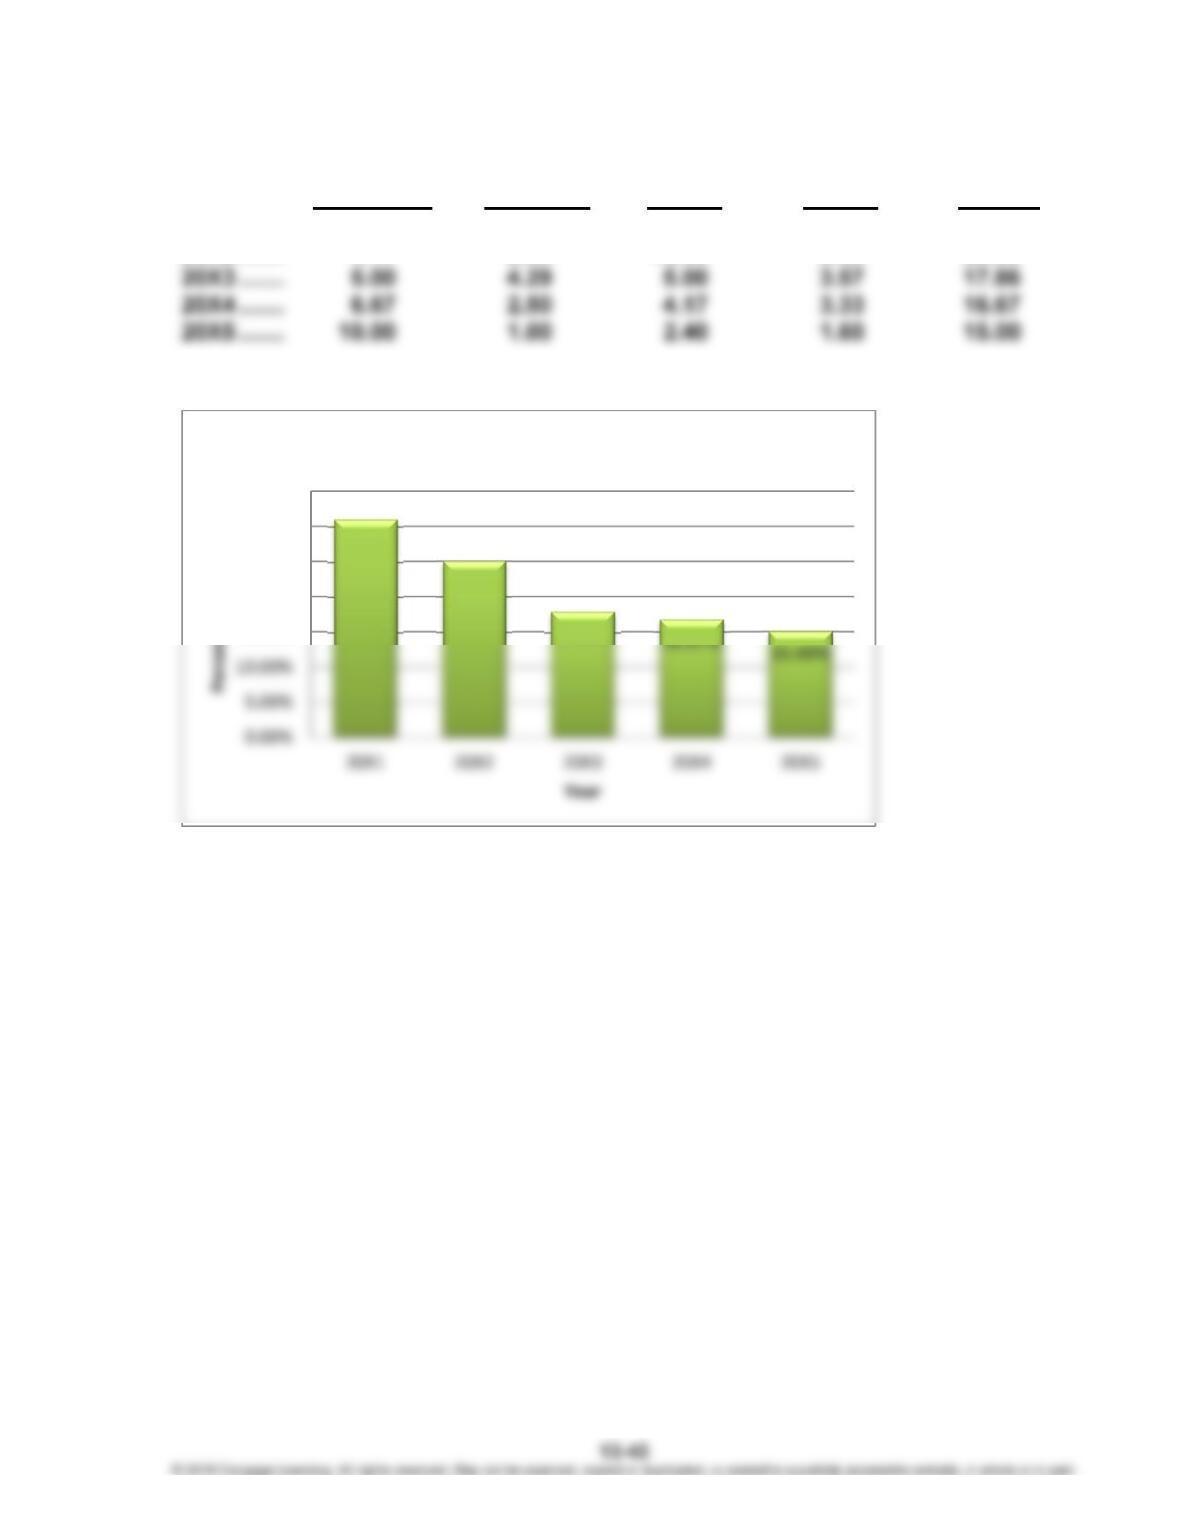
CHAPTER 13 Emerging Topics in Managerial Accounting
P 13-56
1. Internal External
Prevention Appraisal Failure Failure Total
20X1 ……. 1.00% 2.00% 16.00% 12.00% 31.00%
20X2 ……. 4.17 2.50 10.00 8.33 25.00
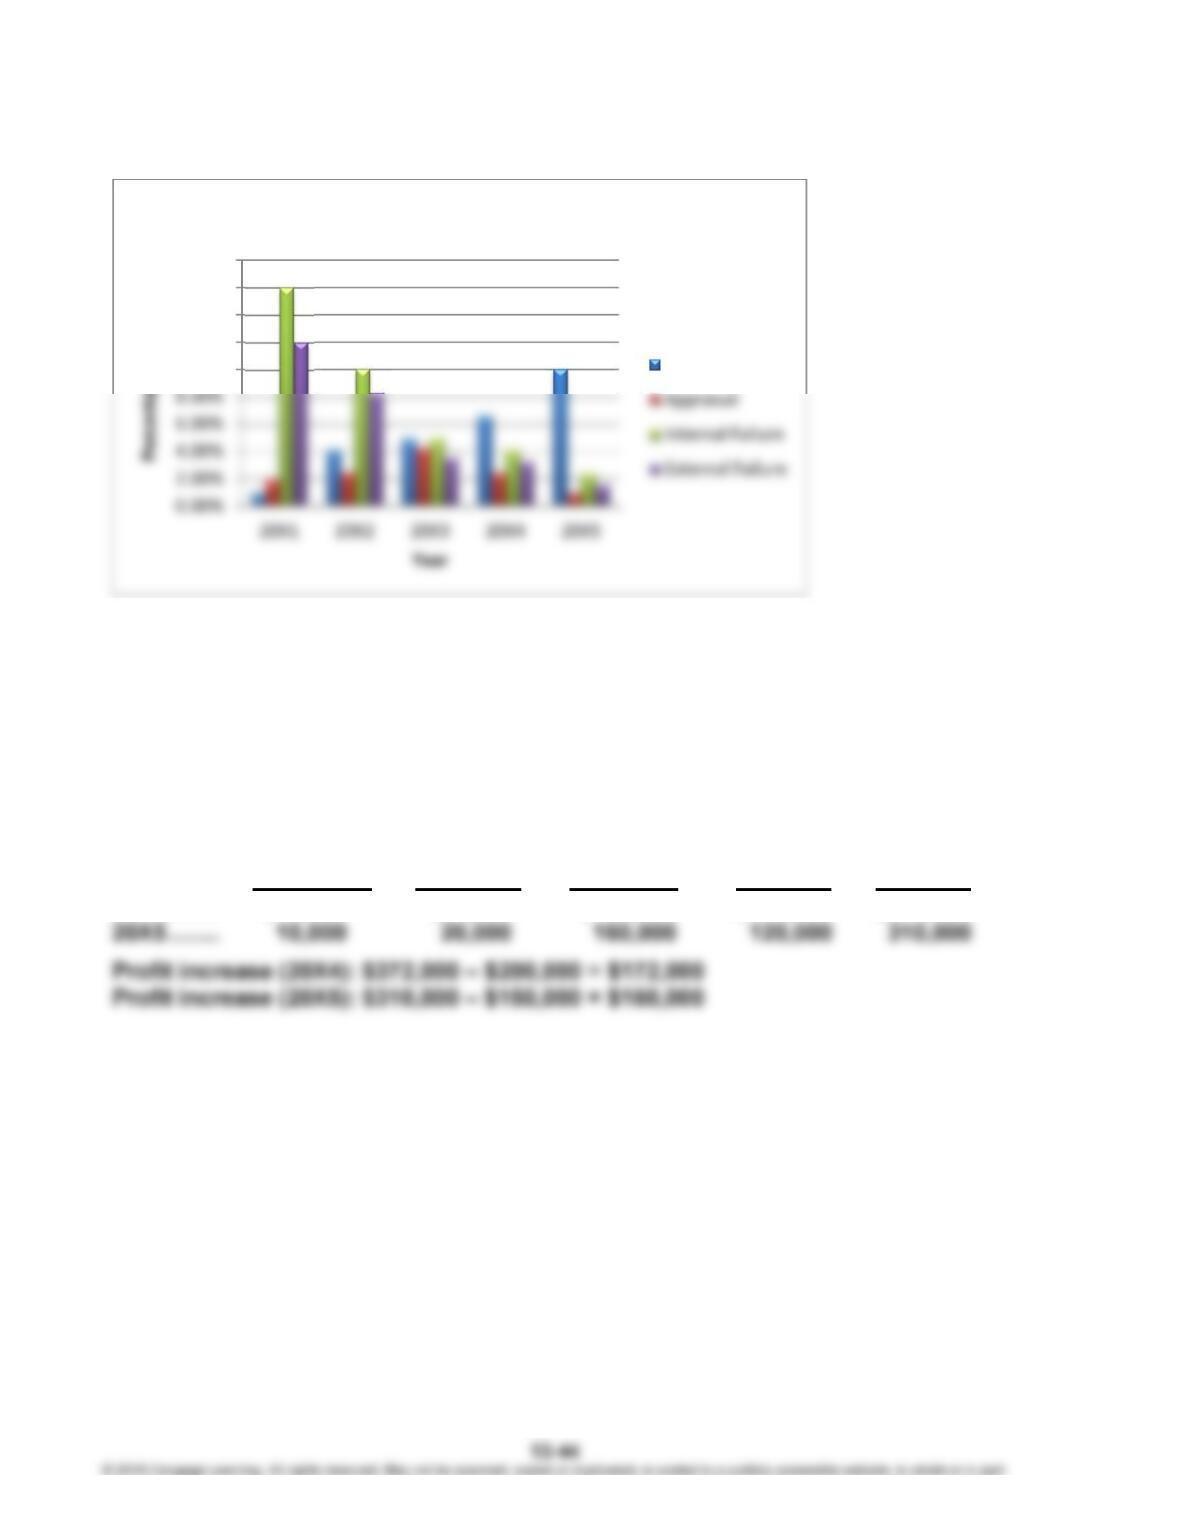
2.
31.00%
25.00%
17.86% 16.67% 15.00%
15.00%
20.00%
25.00%
30.00%
35.00%
TrendinTotalQualityCosts
CHAPTER 13 Emerging Topics in Managerial Accounting
P 13-56 (Concluded)
Yes, quality costs overall have dropped from 31.00% of sales to 15.00% of sales, a
significant improvement. Real evidence for quality improvement stems from the fact
that internal failure costs have gone from 16.00 to 2.40%, external failure costs from
12.00 to 1.60%, and appraisal costs from 2.00 to 1.00%. This reduction of failure
costs has been achieved by putting more resources into prevention (from 1.00 to
10.00%).
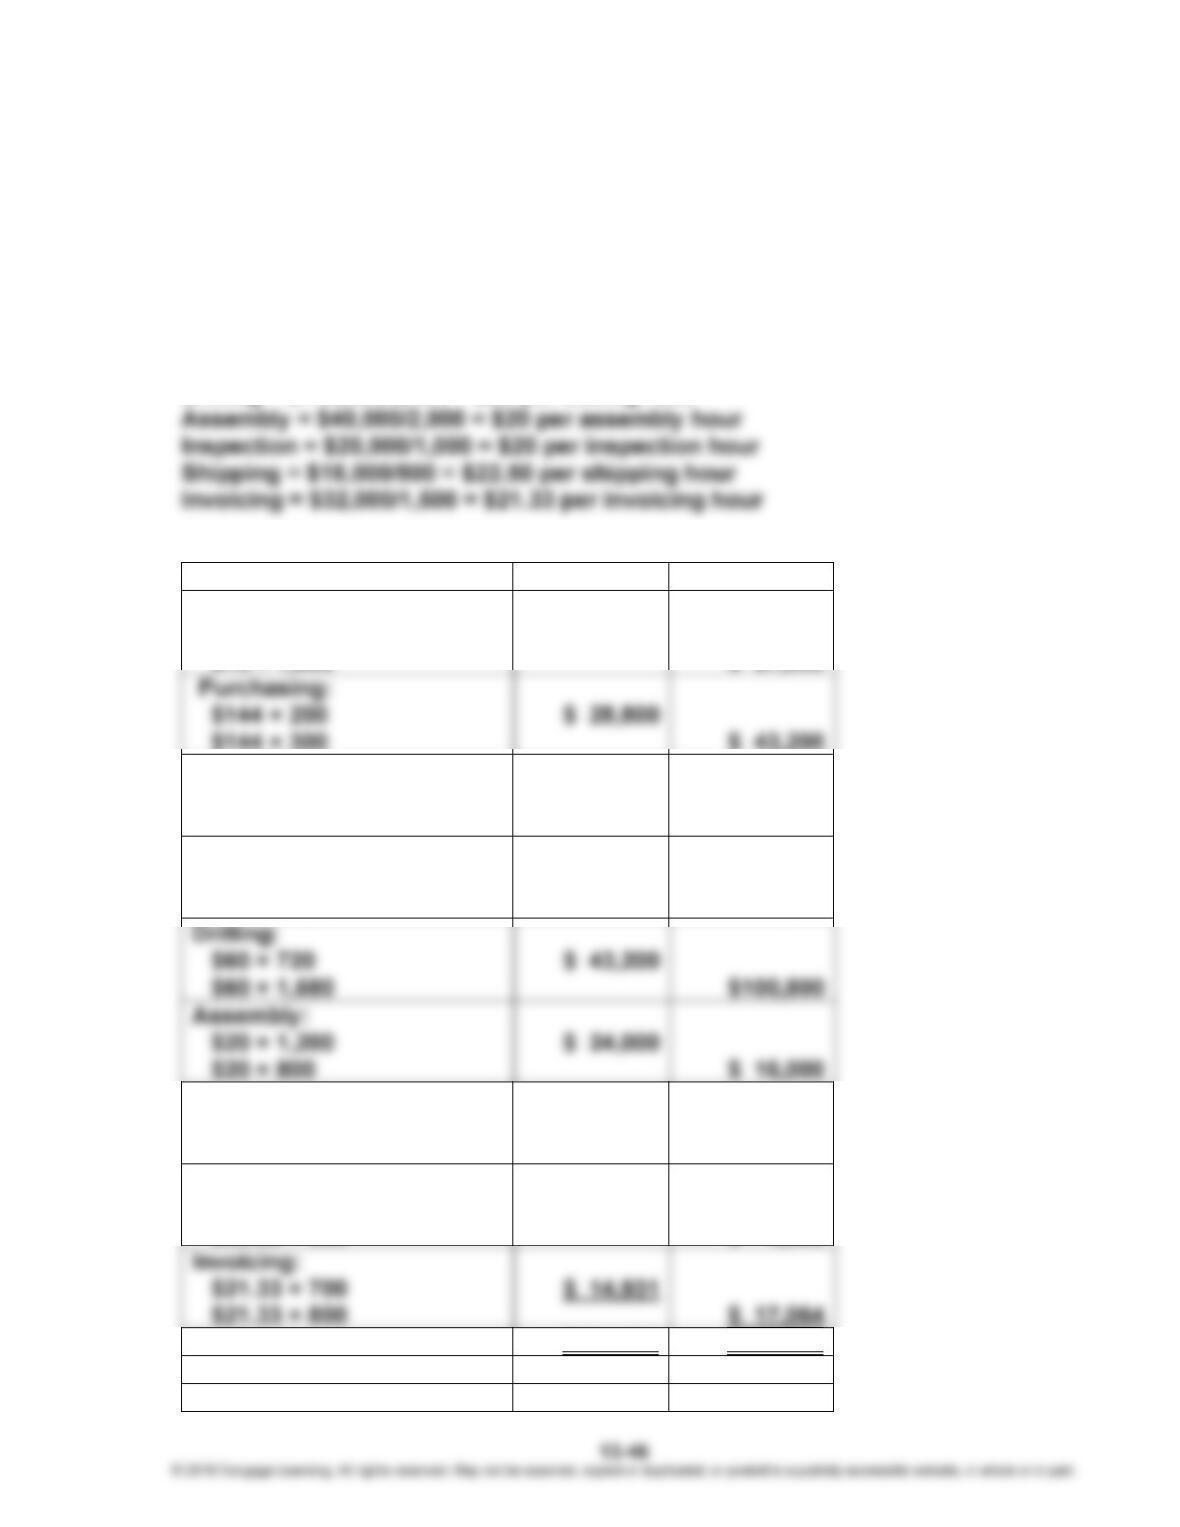
3. Quality costs at the 20X1 rates:
Internal External
Prevention Appraisal Failure Failure Total
20X4 …….. $12,000 $24,000 $192,000 $144,000 $372,000
10.00%
12.00%
14.00%
16.00%
18.00%
TrendbyQualityCostCategory
Prevention
CHAPTER 13 Emerging Topics in Managerial Accounting
P 13-57
1. Average Conversion Cost per Unit = Conversions Costs/Total Units Produced
= $670,000/40,000 units
= $16.75 per unit
2. Activity rates:
Order processing = $36,000/2,400 = $15 per order processing hour
Purchasing = $72,000/500 = $144 per purchasing hour
Lathe = $108,000/800 = $108,000/800 = $135 per lathe hour
Milling = $200,000/2,000 = $100 per milling hour
Drilling = $144,000/2,400 = $60 per drilling hour
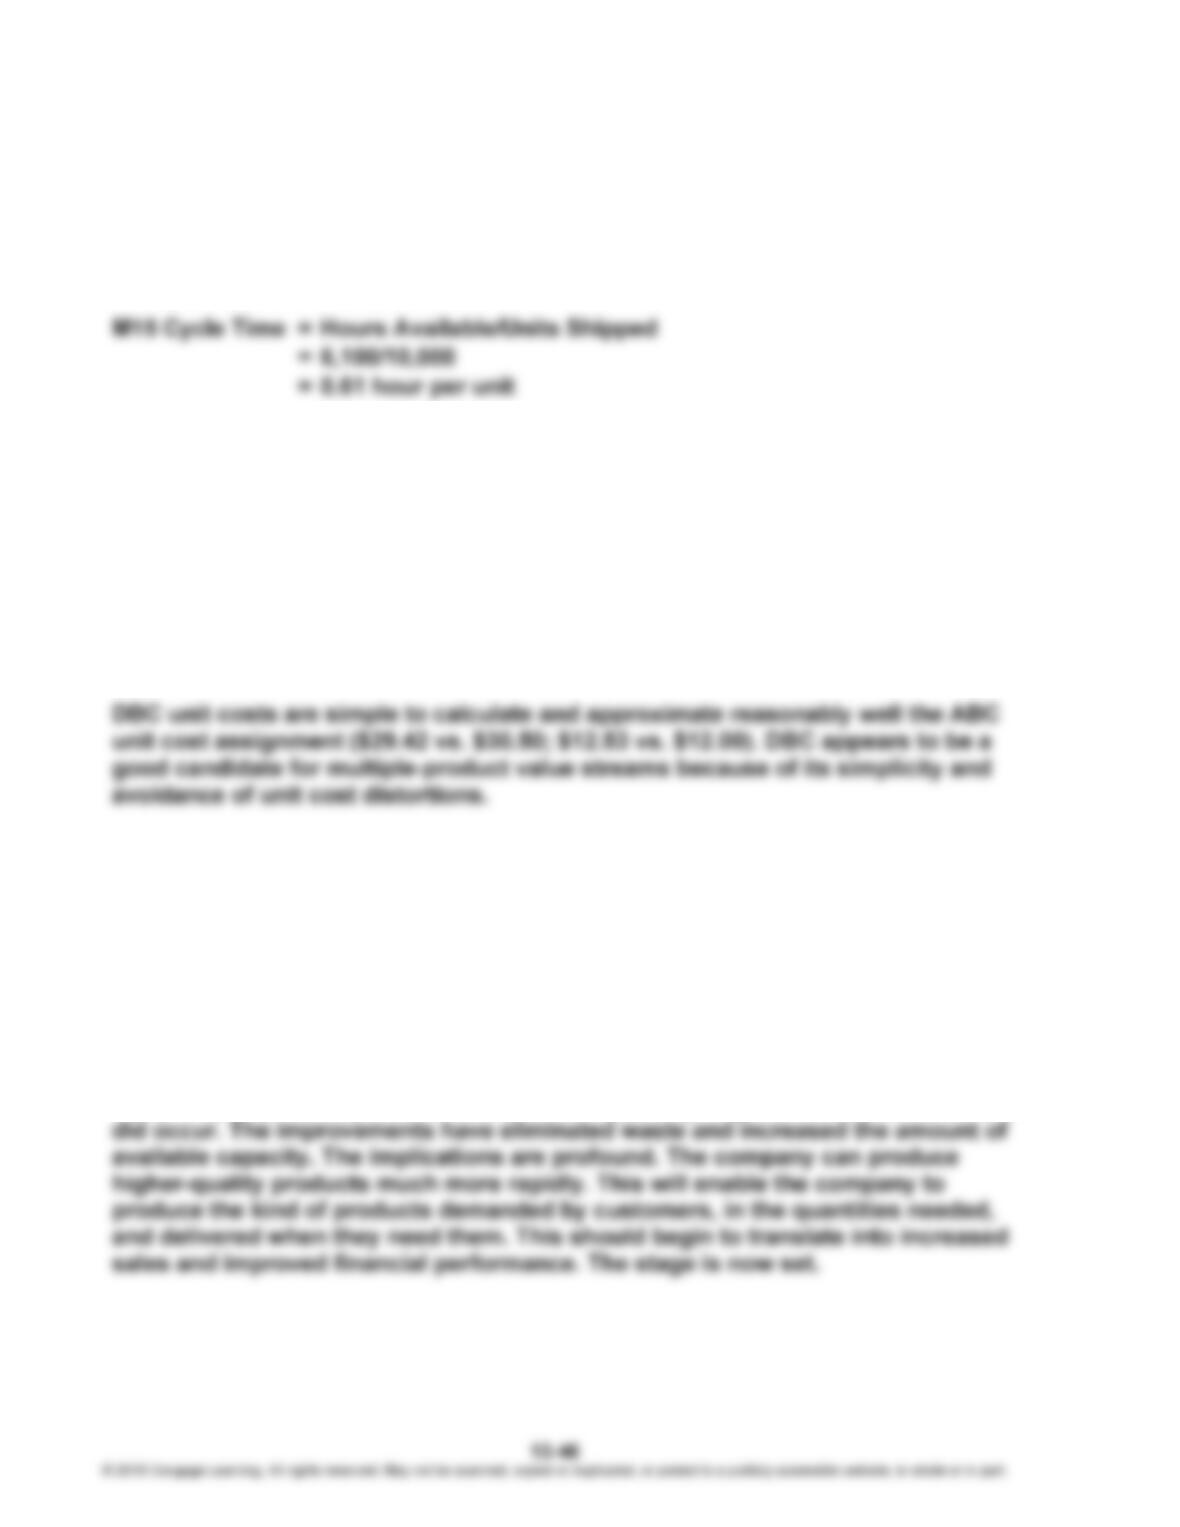
Conversion cost assignment:
Cost Assignment Part M15 Part M78
Order processing:
$15 × 600
$ 9,000
$144 × 300
$ 43,200
Lathe:
$135 × 480
$135 × 320
$ 64,800
$ 43,200
Milling:
$100 × 800
$100 × 1,200
$ 80,000
$120,000
Inspection:
$20 × 800
$20 × 200
$ 16,000
$ 4,000
Shipping:
$22.50 × 600
$ 13,500
Totals $294,231 $375,764
Units shipped 10,000 30,000
Unit conversion cost $29.42 $12.53
CHAPTER 13 Emerging Topics in Managerial Accounting
P 13-57 (Concluded)
The average conversion cost from Requirement 1 is $16.75 per unit. Although the
products use the same sequence of operations, they consume them in quite
different proportions so the average cost is not a good unit cost indicator for this
value stream. Features and characteristics costing or DBC should be used.
3. The cycle time for each product:
M78 Cycle Time = Hours Available/Units Shipped
= 7,300/30,000
= 0.24 hour per unit
Conversion Cost Rate = Conversion Costs/Total Available Hours (or net)
= $670,000/13,400
= $50 per conversion hour
Unit Conversion Cost = Conversion Cost Rate × Cycle Time
M15 = $50 × 0.61 = $30.50 per unit
M78 = $50 × 0.24 = $12.00 per unit
P 13-58
1. The operational performance measures that improved for the first 6 months all have
to do with improving time-based performance. On-time delivery and dock-to-dock
days showed dramatic improvements, reflecting the increased ability of the firm to
produce on demand. From the capacity measures, we see that the ability to produce
on demand has created additional available capacity in the value stream. For the
second 6 months, the focus has been on improving quality. First-time through
improved from 70 to 92%, a dramatic increase in quality. For example, eliminating
scrap may explain why the materials cost dropped, giving the increase in ROS that
CHAPTER 13 Emerging Topics in Managerial Accounting
P 13-58
2. The constant sales per person, coupled with constant total sales, suggest that the
head count has not been reduced. More resources are available for use by the value
stream as reflected by the increase in available capacity. The fact that financial
performance has not improved dramatically is likely attributable to the fact the
company is maintaining the same level of resources in the value stream. Eliminating
P 13-59
Alternative 1:
Advantages: This alternative involves working with a well-understood process in a
well-understood environment. Beryl is completely familiar with the legal and social
environment in Minnesota. Morale may increase because all workers will receive the
higher wages. The factory is already set up, suppliers are in line, and the company
knows just how long it takes to produce the fax machines.
Alternative 2:
Advantages: Wages are much lower in Mexico. The burgeoning Mexican market
would provide demand for Paladin’s product. Production in Mexico would satisfy
Mexican demands for locally produced goods.
Disadvantages: Paladin has no experience in Mexico. There is considerable
uncertainty regarding the training of Mexican workers and the start-up costs of
building a new plant. Language and cultural differences may cause difficulties.
Alternative 3:
Advantages: Location of a new plant in a foreign trade zone would save on duty-
related costs. There is no language difference in Dallas. The opening of a plant in
the Southwest would give Paladin easier access to markets in the southern and
southwestern United States. Wages would be lower than those in Minnesota.
CHAPTER 13 Emerging Topics in Managerial Accounting
P 13-60
1. Using the spot rates in effect on July 1, the following prices can be set in francs and
yen:
2. On October 1, the Swiss customer should pay Custom Shutters 79,104 Swiss
francs. If the 90-day forward rate anticipated on July 1 holds, Custom Shutters will
receive $62,831 (79,104/1.2590).
On October 1, the Japanese customer should pay Custom Shutters 14,594,800 yen.
If the 90-day forward rate anticipated on July 1 holds, Custom Shutters will receive
$124,000.
Will Lee actually receive $186,831 ($62,831 + $124,000) on October 1? We don’t
know. It depends on the exchange rates in effect on October 1. Currently, it is
P 13-61
Yes, the deal is fraudulent. The purchasing officer is asking for a kickback. His actions
are definitely fraud—he is engaging in deception for the purposes of his own financial
gain. Clearly, you do not want to be a part of this. The payment of the $500 will involve
CHAPTER 13 Emerging Topics in Managerial Accounting
CASES
Case 13-62
Given that students will select their own corporate sustainability reports (CSRs), the
1. Three Similarities:
a. Students likely will find that most CSRs have a letter either from the chief
executive officer or chairman of the board of directors that attempts to link the
importance of the CSR to the strategy of the organization. This letter often is a
good starting point for discussing with students whether they “buy into” the
sincerity of the organization’s CSR, or whether it appears more like a public
relations document (i.e., greenwashing).
c. Most CSRs attempt to address multiple stakeholder groups, rather than focus
primarily on investors as in a traditional 10-K annual report. Therefore,
students likely will read considerable content in their CSRs that is addressed
specifically at environmental, social, regulatory, customer, community, and
shareholder groups.
2. Three Differences:
a. Considerable differences likely will exist in the type and amount of data
contained within the two CSRs. For example, some organizations report only
high-level nonfinancial statistics (e.g., amount of money spent on a particular
environmental program in the area where the organization conducts business).
On the other hand, other organizations disclose the “story” behind key
b. In addition, students likely will find differences in the extent and nature to
which their CSRs adhere to optional reporting guidelines, the two most popular
of which are the Global Reporting Initiative (GRI) and the Sustainability
Accounting Standards Board (SASB). Furthermore, for CSRs that adopt GRI’s
sustainability reporting guidelines in preparing their CSR, they can choose to
apply them at either the “core” level or at the “comprehensive” level, thereby
creating additional differences between CSRs.
CHAPTER 13 Emerging Topics in Managerial Accounting
Case 13-62 (Concluded)
c. Students also likely will find considerable differences in the existence of
independent, third-party verification (i.e., auditors) between their two selected
CSRs. In addition, if both CSRs do contain independent, third-party verification,
3. Responses will vary.
4. Responses will vary.
Case 13-63
1. Luna Company
Interim Performance Report: Quality Costs
For the Year Ended December 31, 20X5
Actual Costs Budgeted Costs Variance
Prevention costs:
Quality planning ………. $ 450,000 $ 450,000 $ 0
Quality training ………… 160,000 180,000 20,000 F
Special project ………… 390,000 430,000 40,000 F
Quality reporting ……… 260,000 260,000 0
Total prevention …………… $1,260,000 $1,320,000 $ 60,000 F
Internal failure costs:
Correction of typos ….. $ 350,000 $ 375,000 $ 25,000 F
Plate revisions …………. 100,000 125,000 25,000 F
Press downtime ………. 200,000 221,000 21,000 F
Waste ……………………… 70,000 125,000 55,000 F
CHAPTER 13 Emerging Topics in Managerial Accounting
Case 13-63 (Continued)
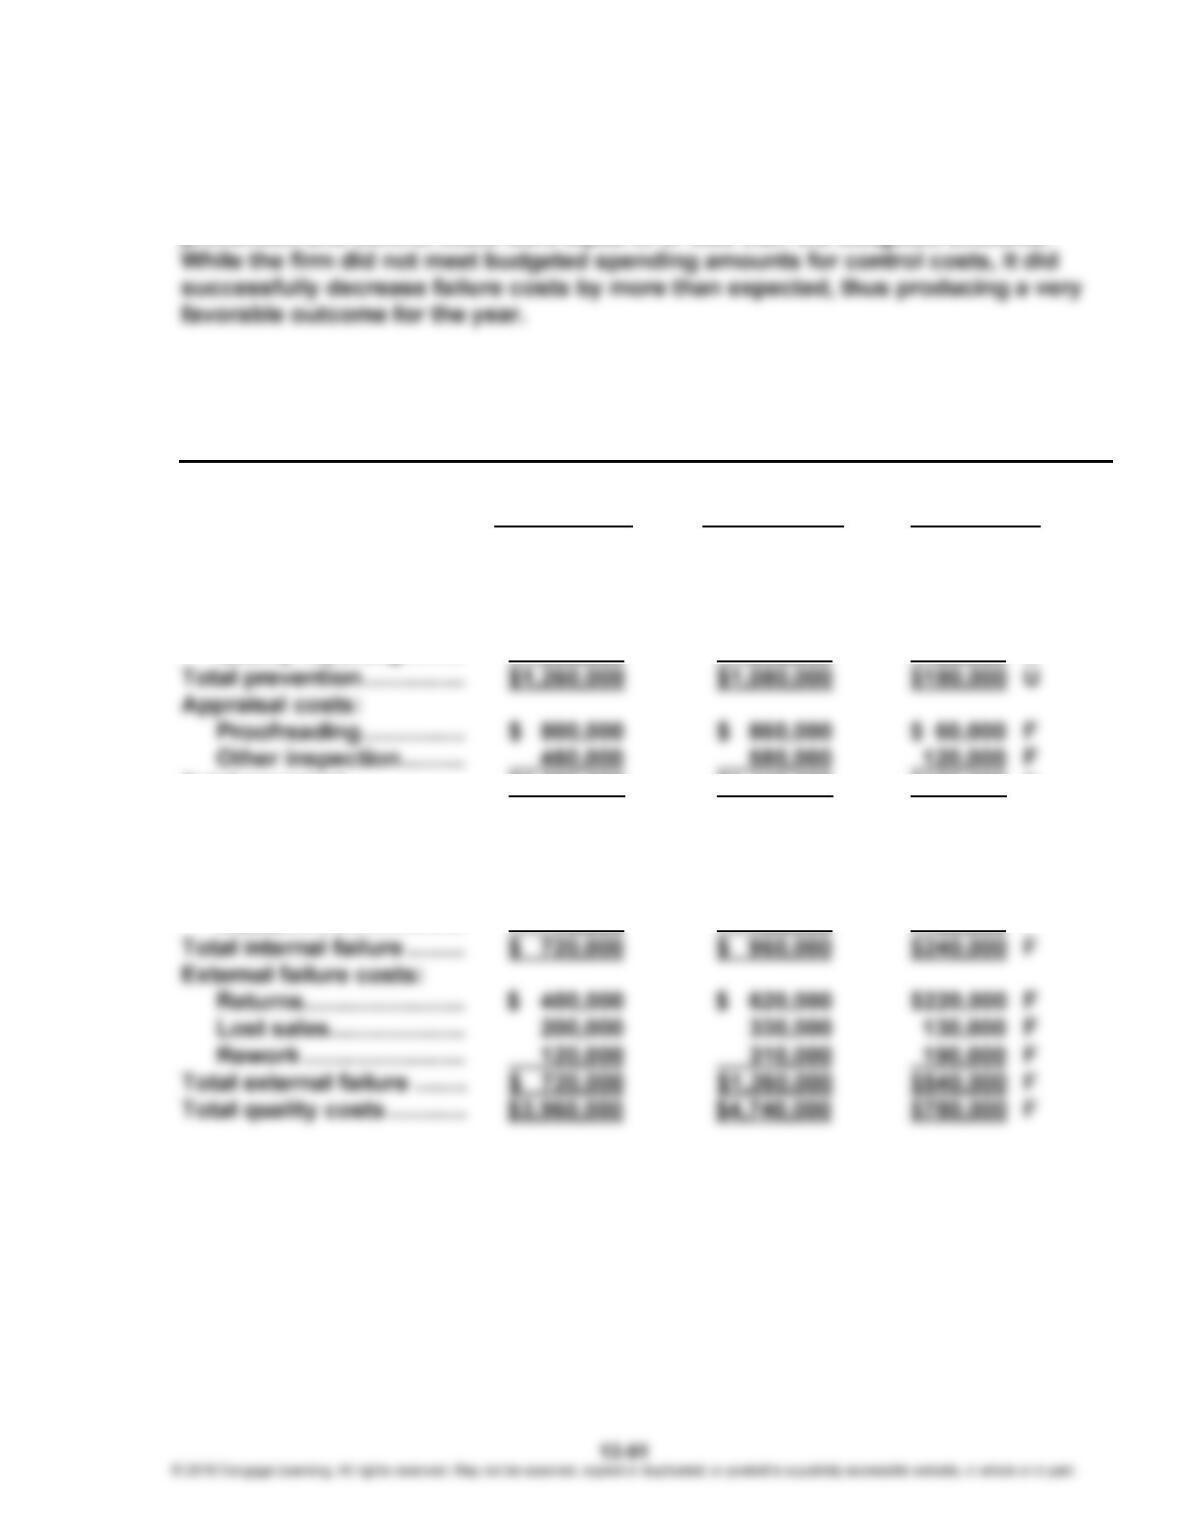
The firm failed across the board to meet its budgeted goals for control costs for the
year (increasing control costs is good as they drive down failure costs). All
2. Luna Company
Performance Report: Quality Costs
One-Year Trend
For the Year Ended December 31, 20X5
Actual Costs Actual Costs
20X5 20X4 Variance
Prevention costs:
Quality planning ………. $ 450,000 $ 440,000 $ 10,000 U
Quality training ………… 160,000 250,000 90,000 F
Special project …………. 390,000 150,000 240,000 U
Quality reporting ……… 260,000 240,000 20,000 U
Total appraisal ……………… $1,260,000 $1,440,000 $180,000 F
Internal failure costs:
Correction of typos ….. $ 350,000 $ 200,000 $150,000 U
Plate revisions …………. 100,000 380,000 280,000 F
Press downtime ……….. 200,000 260,000 60,000 F
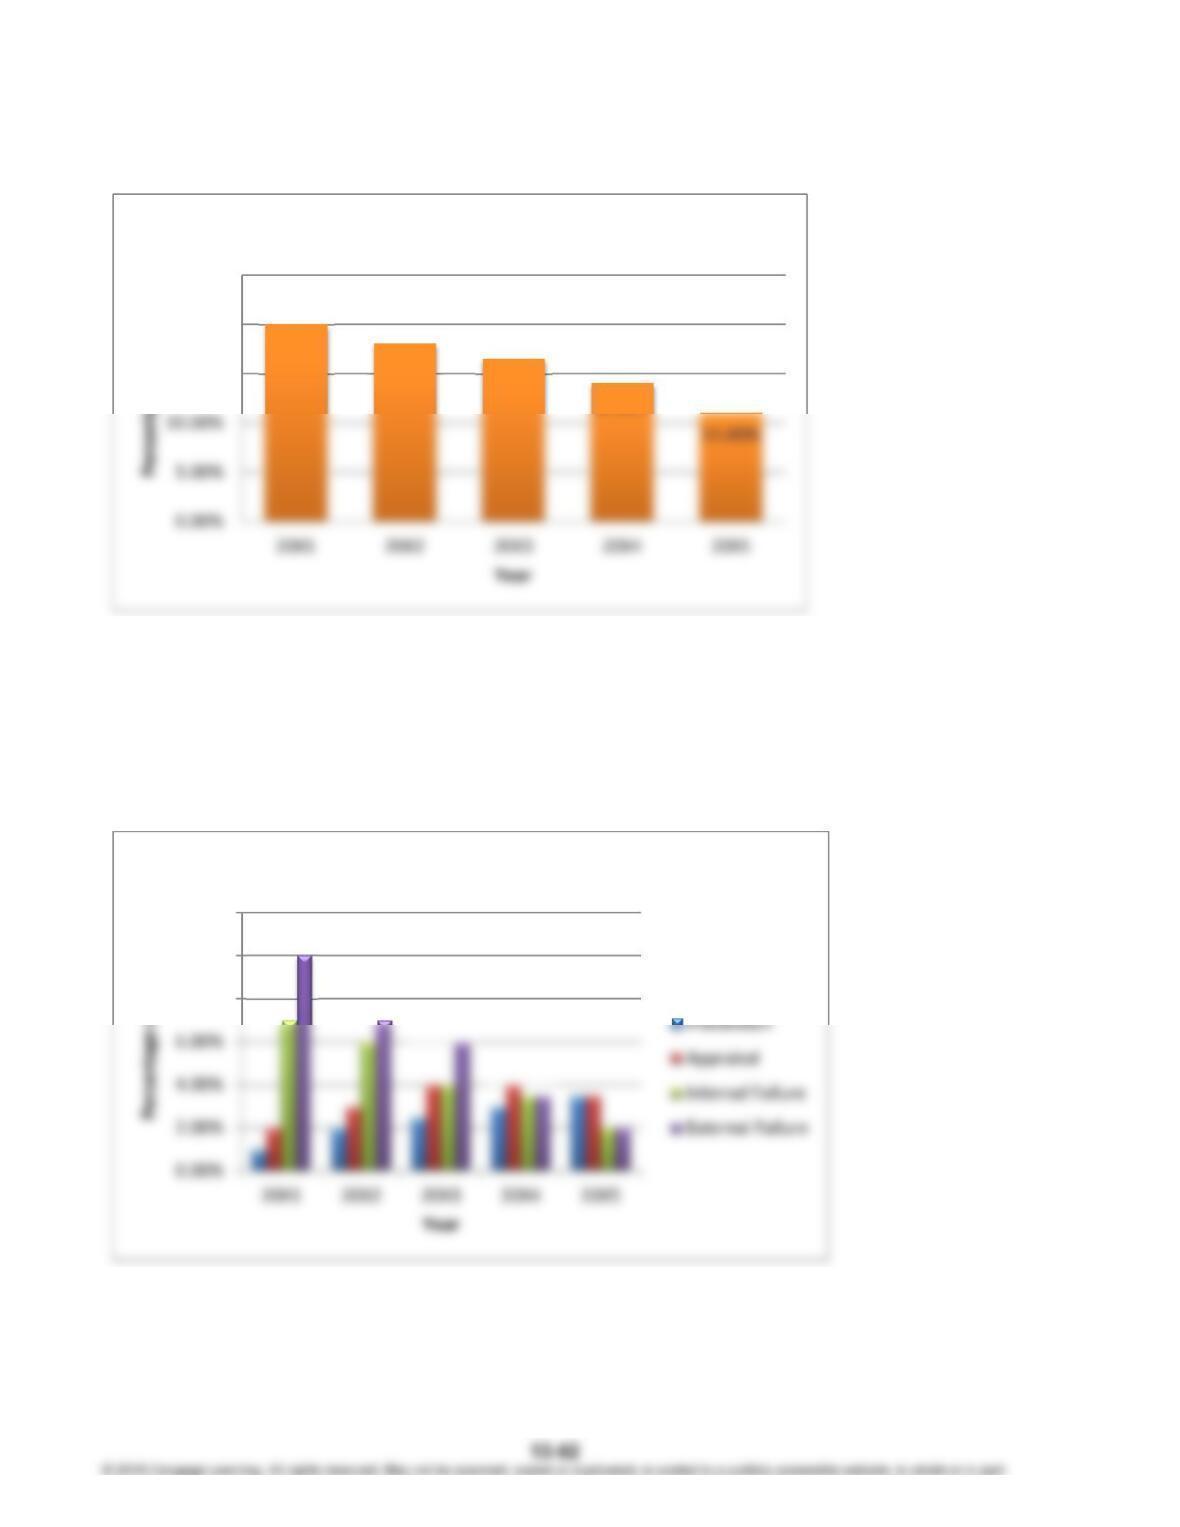
Profits increased $780,000 because of the reduction in quality costs from 20X4 to
20X5. Thus, even though the budgeted increases for control costs for the year were
not met, there was still significant improvement. . . in fact, greater improvement than
expected as failure costs decreased more than expected. Moreover, most of the
improvement came from reduction of failure costs, a positive signal indicating that
quality is indeed increasing.
CHAPTER 13 Emerging Topics in Managerial Accounting
Case 13-63 (Continued)
3.
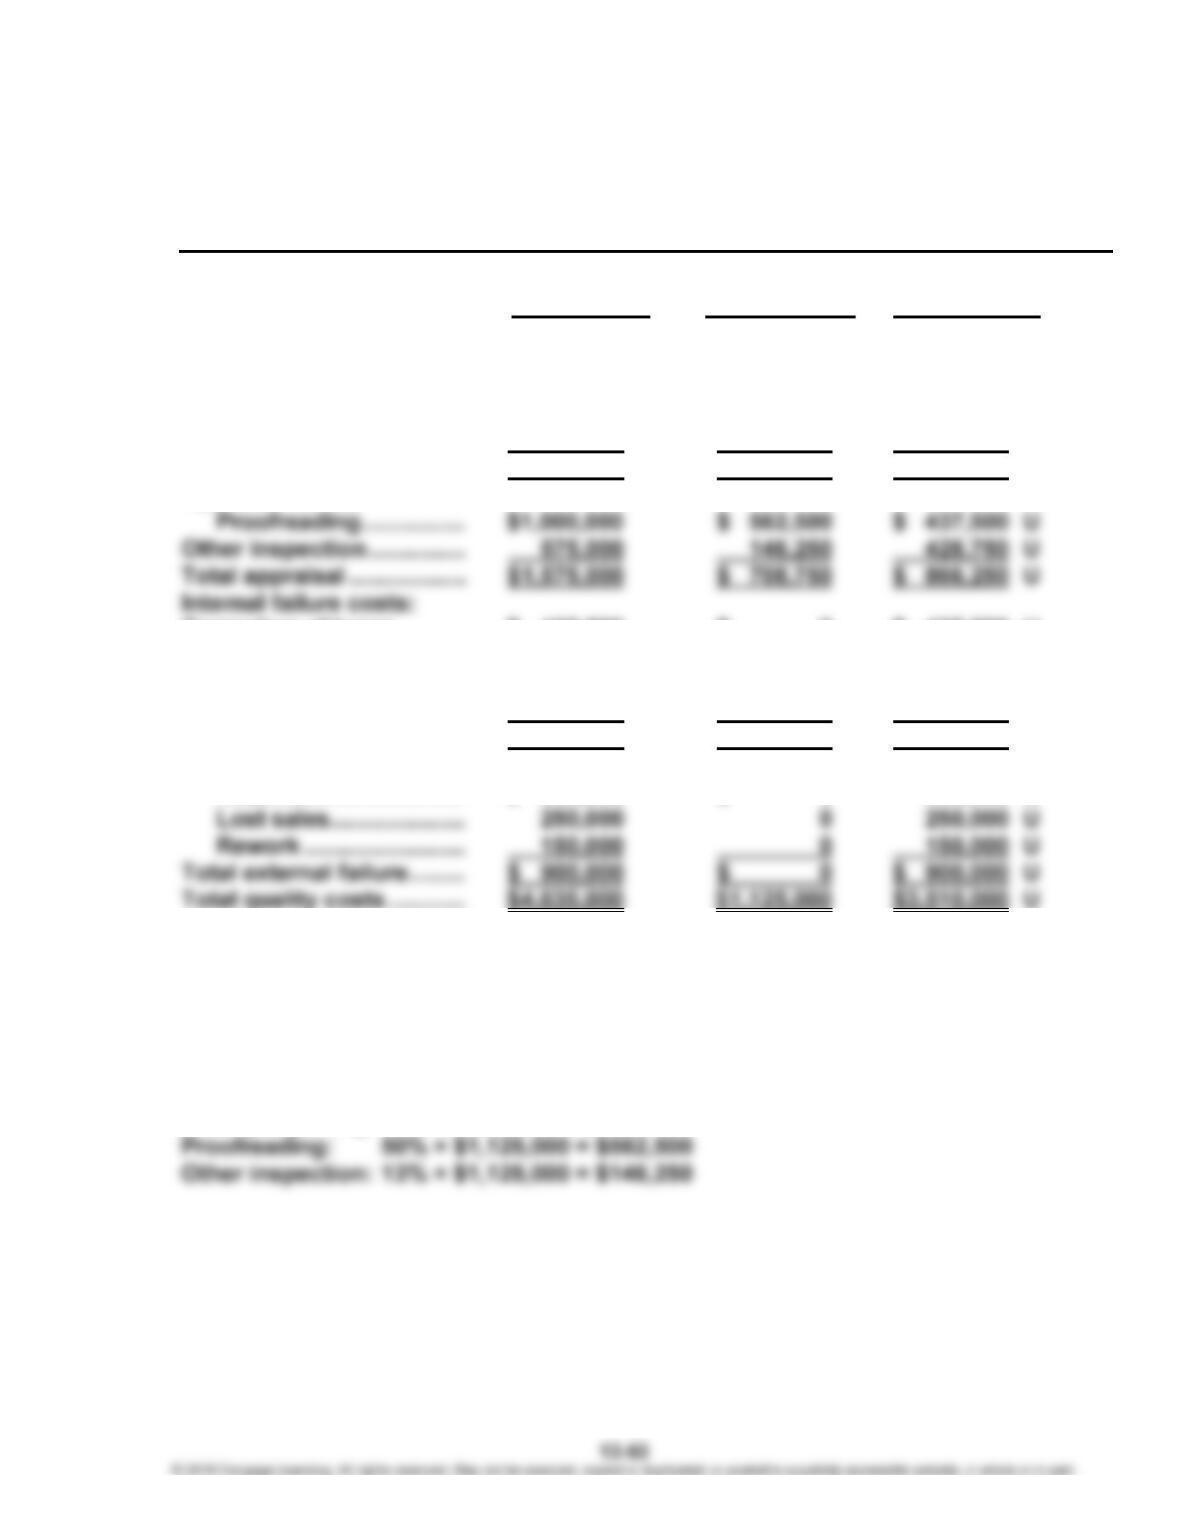
Note: Percentages are calculated as follows:
20X1: $6,000,000/$30,000,000; 20X2: $5,400,000/$30,000,000;
20X3: $5,445,000/$33,000,000; 20X4: $4,740,000/$33,857,000;
20X5: $3,960,000/$36,000,000.
4.
Increases in prevention and appraisal costs with simultaneous reductions in failure
costs are good signals that overall quality is increasing. (Decreases in external
failure costs are particularly hard to achieve without quality actually increasing.)
20.00%
18.00% 16.50%
15.00%
20.00%
25.00%
TrendinTotalQualityCosts
8.00%
10.00%
12.00%
MultiplePeriodTrendbyCategory
CHAPTER 13 Emerging Topics in Managerial Accounting
Case 13-63 (Concluded)
5. Luna Company
Long-Range Performance Report
For the Year Ended December 31, 20X5
Actual Costs Long-Range
20X5a Target Costsb Variance
Prevention costs:
Quality planning …………… $ 450,000 $ 337,500 $ 112,500 U
Quality training ………… 160,000 78,750 81,250 U
Special project …………. 390,000 0 390,000 U
Quality reporting ……… 260,000 0 260,000 U
Total prevention ……………. $ 1,260,000 $ 416,250 $ 843,750 U
Appraisal costs:
Correction of typos ………. $ 437,500 $ 0 $ 437,500 U
Plate revisions …………. 125,000 0 125,000 U
Press downtime ……….. 250,000 0 250,000 U
Waste………………………. 87,500 0 87,500 U
Total internal failure ……… $ 900,000 $ 0 $ 900,000 U
External failure costs:
Returns ……………………. $ 500,000 $ 0 500,000 U
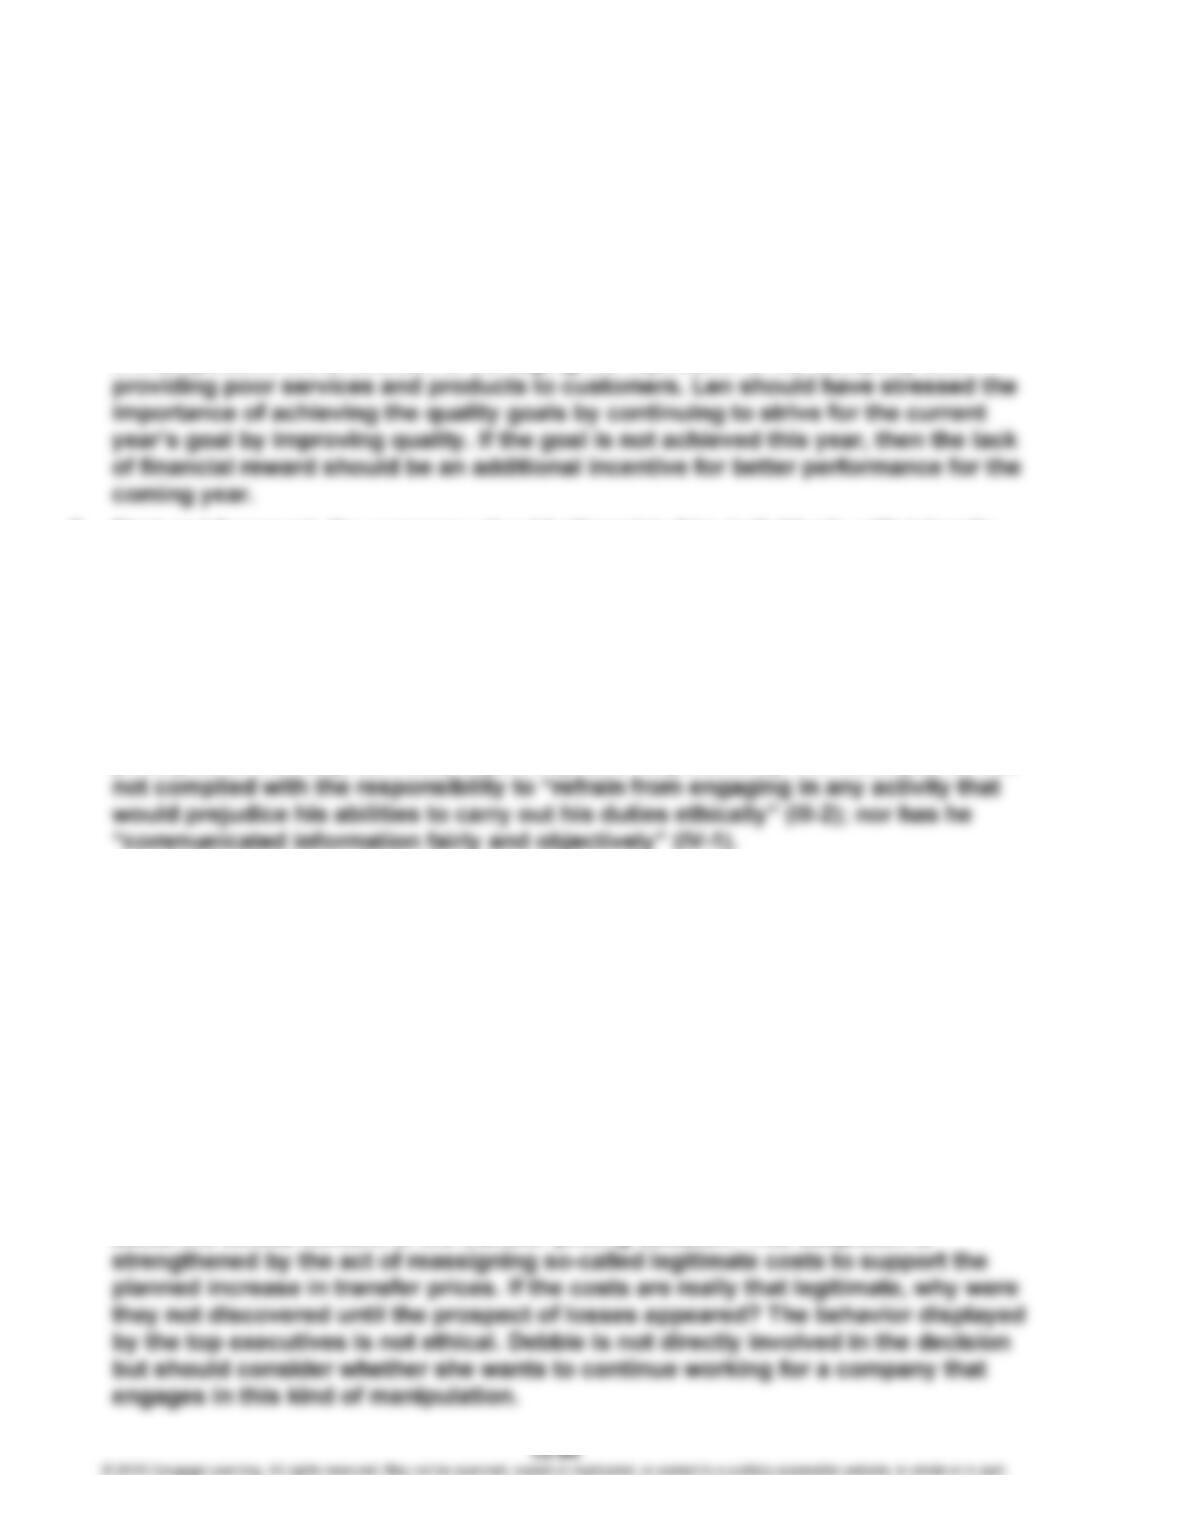
a
Except for prevention costs, which are fixed, actual costs of 20X5 are adjusted to a sales level of
$45 million by multiplying the actual costs at $36 million by 45/36 = 5/4 = 1.25. This report is
prepared at the end of 20X5.
b
2.5% of $45,000,000 = $1,125,000.
Quality training: 30% × $1,125,000 = $337,500
Quality reporting: 7% × $1,125,000 = $78,750
CHAPTER 13 Emerging Topics in Managerial Accounting
Case 13-64
1. Len should know that the bonuses are intended for those who legitimately achieve
the budgeted quality goals. The three actions taken by Len were manipulative in
nature—their objective was simply to massage the performance statistic so that he
could receive his bonus. Since Len’s bonus is achieved simultaneously with that of
his employees, there is some question whether he really had their interest in mind
or simply his own. The behavior exhibited by Len is not ethical. The heart of ethical
behavior is sacrificing one’s self-interest for the well-being of others. By engaging
in manipulative behavior, Len is damaging the reputation of the company and
2. First and foremost, the company should attempt to hire individuals with integrity.
Second, the company should make sure that the performance and reward system is
fair and acceptable to managers and employees. Perhaps the company could
provide a percentage of the savings from quality improvements rather than making
it an all-or-nothing bonus, based on achieving some predetermined target. Finally,
the company should have in place a good monitoring system to discourage the type
of behavior Len is exhibiting, e.g., a good internal audit program.
3. Len has violated the ethical code. He has not acted in accordance with the
principles of honesty, fairness, objectivity, and responsibility. For example, he has
Case 13-65
1. Some might argue that the company has an obligation to pay no more than its
minimum legal tax. The actions taken by the company were clearly intended to
escape taxation. And perhaps auditors would not find anything that would signal
any deviation from the legal guidelines. After all, this had been done in the past with
great success. Nonetheless, the propriety of the actions taken by the firm is
questionable. It was made quite clear that under normal operating conditions,
transfer prices were set by divisional managers. Thus, the incentive for tampering
with the transfer prices appears to be motivated by expected losses for the U.S.
operations. The only purpose of increasing the transfer prices was to reduce
European taxes that normally would be owed and paid. This creates some suspicion
CHAPTER 13 Emerging Topics in Managerial Accounting
Case 13-65 (Concluded)
2. Accountants have a responsibility to “perform their professional duties in
accordance with relevant laws, regulations, and technical standards.” (I-2)
Furthermore, they have a responsibility to “refrain from engaging in or supporting
any activity that would discredit the profession.” (III-7) Finally, they must “disclose
fully all relevant information that could reasonably be expected to influence an