CHAPTER 27 (FIN MAN); CHAPTER 13 (MAN) Lean Manufacturing and Activity Analysis
Prob. 27–2B (FIN MAN); Prob. 13–2B (MAN)
1.
Value-added time:
Stamping ………………………………………………………………………
5
min.
Appliance assembly ……………………………………………………….
22
Time to test one unit ………………………………………………………
8
Pack and shipment labeling ……………………………………………
15
Total …………………………………………………………………………
50
min.
Non-value-added time:
Wait time:
Within-batch wait time—stamping (39 × 5 min.) ……………….
min.
Within-batch wait time—final assembly
Within-batch wait time—testing (39 × 8 min.)……………………
Within-batch wait time—shipping (39 × 15 min.) ………………
Stamping setup ……………………………………………………………..
Total wait time …………………………………………………………..
Move time:
Move from stamping to final assembly …………………………...
10
min.
Move from final assembly to testing ………………………………..
25
Total move time …………………………………………………………
35
min.
Total non-value-added time …………………………………………….
2,045
min.
Total lead time (50 min. + 2,045 min.) ………………………………
2,095
min.
2. The existing process is very wasteful. The company could improve the process by
changing the layout from a process orientation to a product orientation. Each appliance
model could be formed into a production cell. Each cell would have stamping, final
assembly, testing, and shipping next to each other. In this way, the batch sizes could
CHAPTER 27 (FIN MAN); CHAPTER 13 (MAN) Lean Manufacturing and Activity Analysis
Prob. 27–3B (FIN MAN); Prob. 13–3B (MAN)
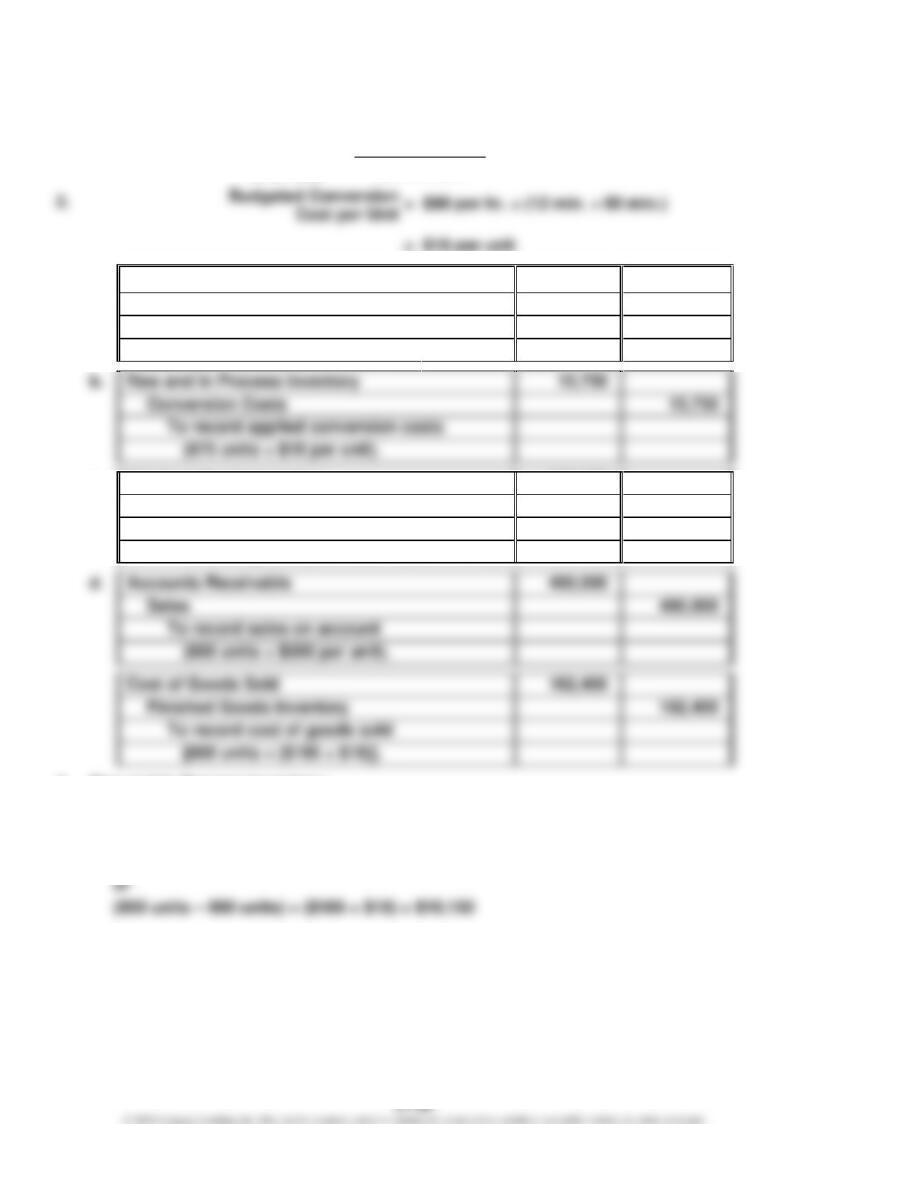
1.
Budgeted Cell Conversion $189,000
= = $90 per hour
2,100 hours
Cost Rate
=
$18 per unit
3.
a.
Raw and In Process Inventory
166,500
Accounts Payable
166,500
To record materials purchases
(900 units × $185 per unit).
To record applied conversion costs
c.
Finished Goods Inventory
172,550
Raw and In Process Inventory
172,550
To transfer the cost of completed units to
finished goods [850 units × ($185 + $18)].
To record sales on account
Finished Goods Inventory
162,400
To record cost of goods sold
4.
Raw and In Process Inventory:
$166,500 + $15,750 – $172,550 = $9,700
Finished Goods Inventory:
$172,550 – $162,400 = $10,150
CHAPTER 27 (FIN MAN); CHAPTER 13 (MAN) Lean Manufacturing and Activity Analysis
Prob. 27–3B (FIN MAN); Prob. 13–3B (MAN) (Concluded)
5. Lean accounting is different from traditional accounting in a number of respects.
Most importantly, lean accounting is simplified and uses minimal control. As a
result, the number of transactions is reduced, and the control intervals between
CHAPTER 27 (FIN MAN); CHAPTER 13 (MAN) Lean Manufacturing and Activity Analysis
Prob. 27–4B (FIN MAN); Prob. 13–4B (MAN)
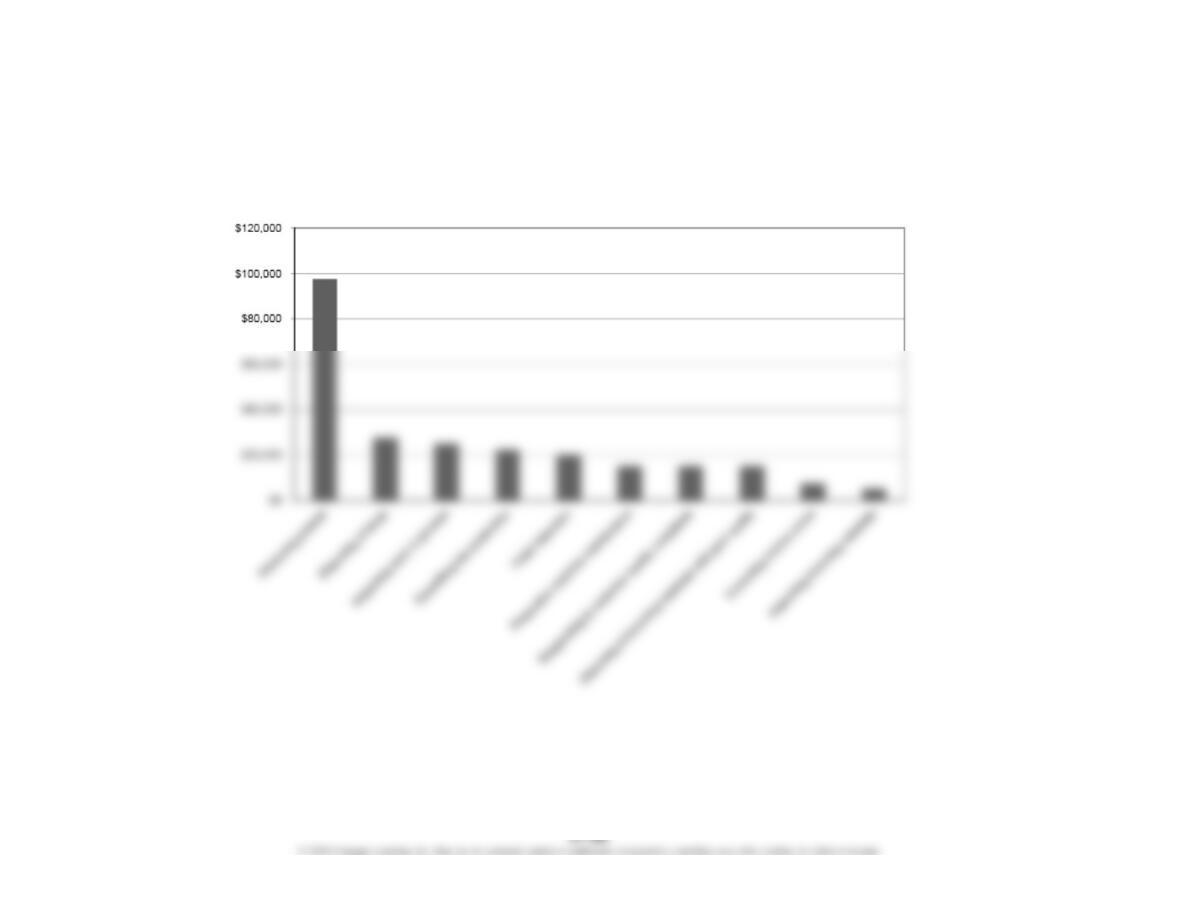
1.
Pareto Chart of Quality Activities
CHAPTER 27 (FIN MAN); CHAPTER 13 (MAN) Lean Manufacturing and Activity Analysis
Prob. 27–4B (FIN MAN); Prob. 13–4B (MAN) (Continued)
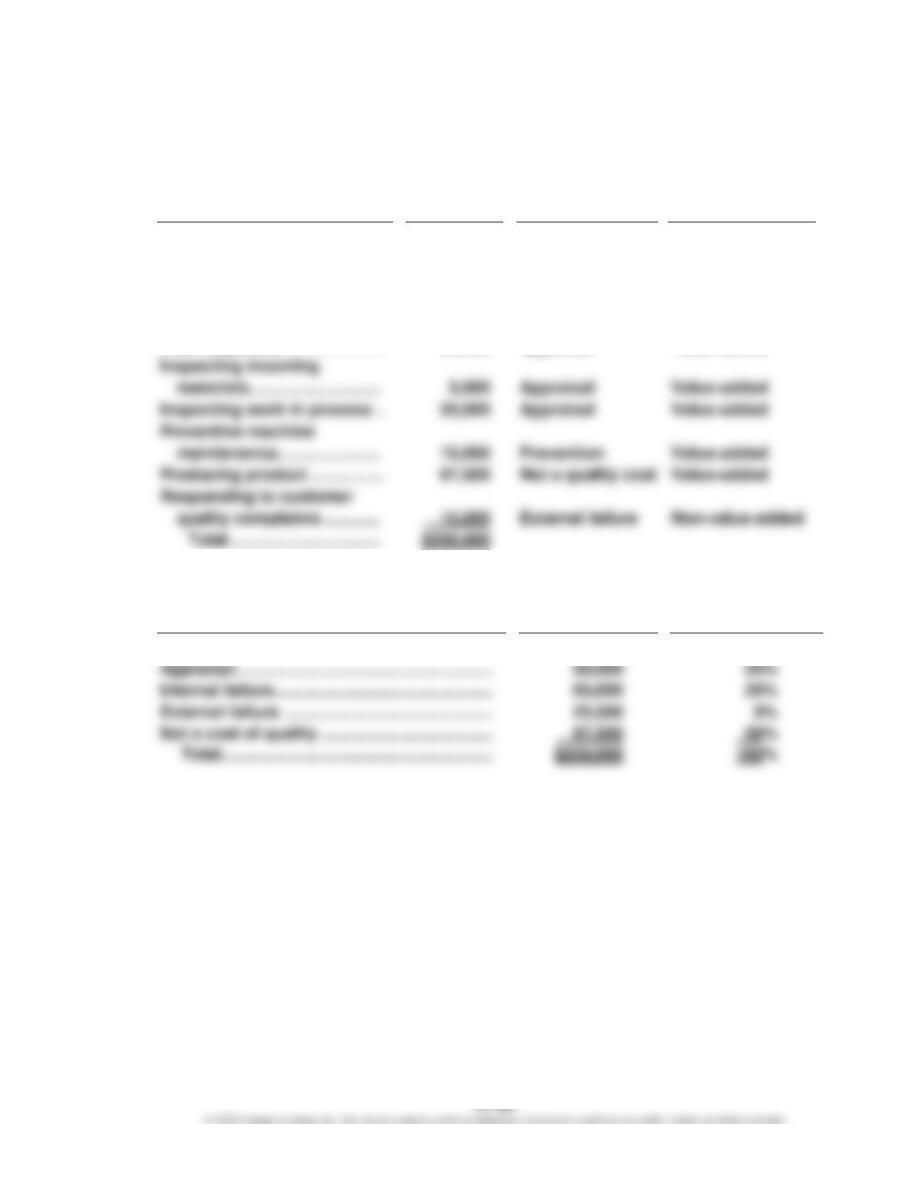
2. Activity classifications:
Activity
Cost
Cost of Quality
Classification
Value-Added/
Non-Value-Added
Classification
Activity
Correcting invoice errors ……
$ 7,500
External failure
Non-value-added
Disposing of incoming
materials with poor quality …
15,000
Internal failure
Non-value-added
Disposing of scrap …………….
27,500
Internal failure
Non-value-added
Expediting late production …
22,500
Internal failure
Non-value-added
Final inspection …………………
Inspecting incoming
materials ……………………….
Appraisal
Value-added
Inspecting work in process ..
25,000
Appraisal
Value-added
Preventive machine
maintenance ………………….
15,000
Prevention
Value-added
Producing product …………….
97,500
Not a quality cost
Value-added
Responding to customer
quality complaints …………
External failure
Non-value-added
3. Percent of total activity cost for each quality cost (and nonquality cost) classification:
Quality Cost Classification
Activity
Cost
Percent of Total
Department Cost
Prevention ……………………………………………..
$ 15,000
6%
Appraisal ……………………………………………….
Internal failure ………………………………………..
External failure ………………………………………
CHAPTER 27 (FIN MAN); CHAPTER 13 (MAN) Lean Manufacturing and Activity Analysis
Prob. 27–4B (FIN MAN); Prob. 13–4B (MAN) (Concluded)
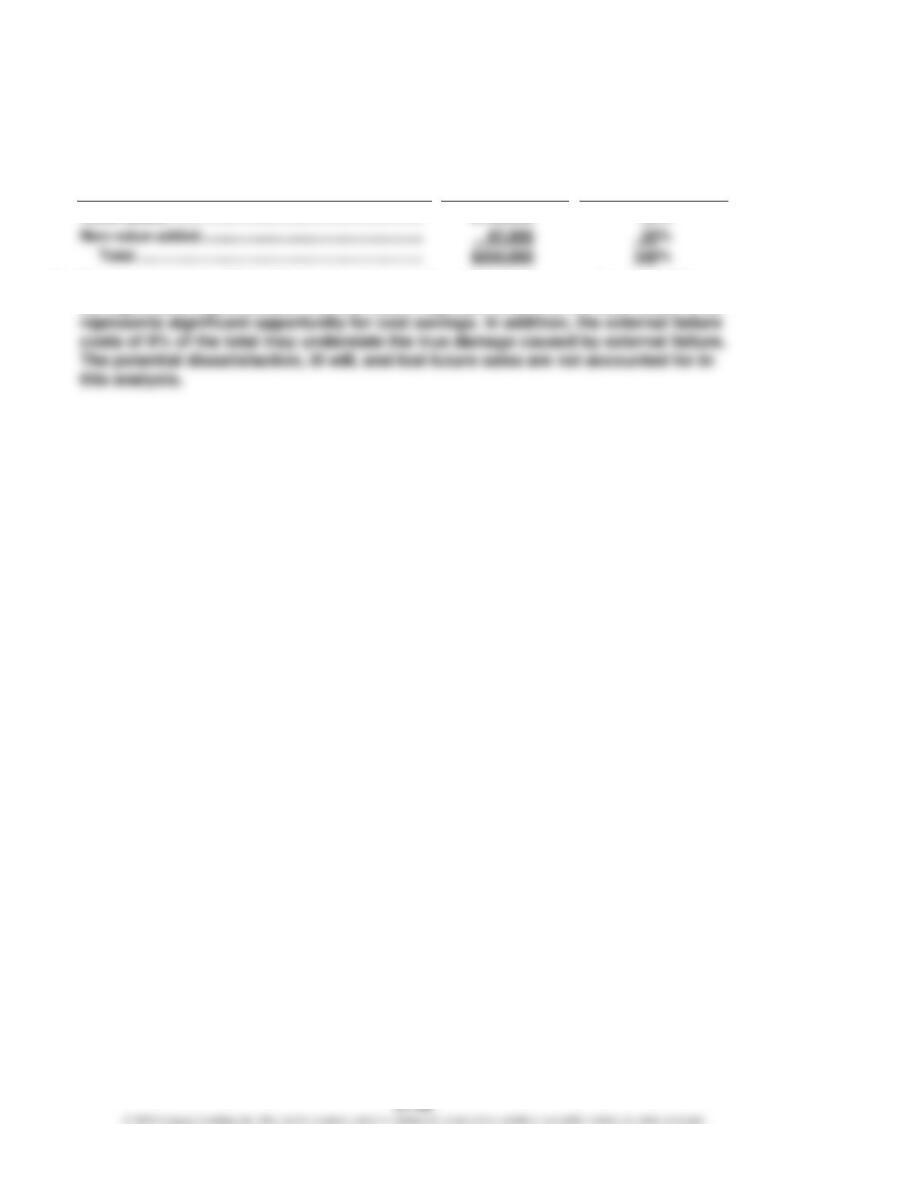
4. Percentages of total activity cost that are value- and non-value-added:
Activity
Cost
Percent of Total
Department Cost
5. The company has 65% of its total costs as value-added. However, there is still room
CHAPTER 27 (FIN MAN); CHAPTER 13 (MAN) Lean Manufacturing and Activity Analysis
MAKE A DECISION
MAD 27–1 (FIN MAN); MAD 13–1 (MAN)
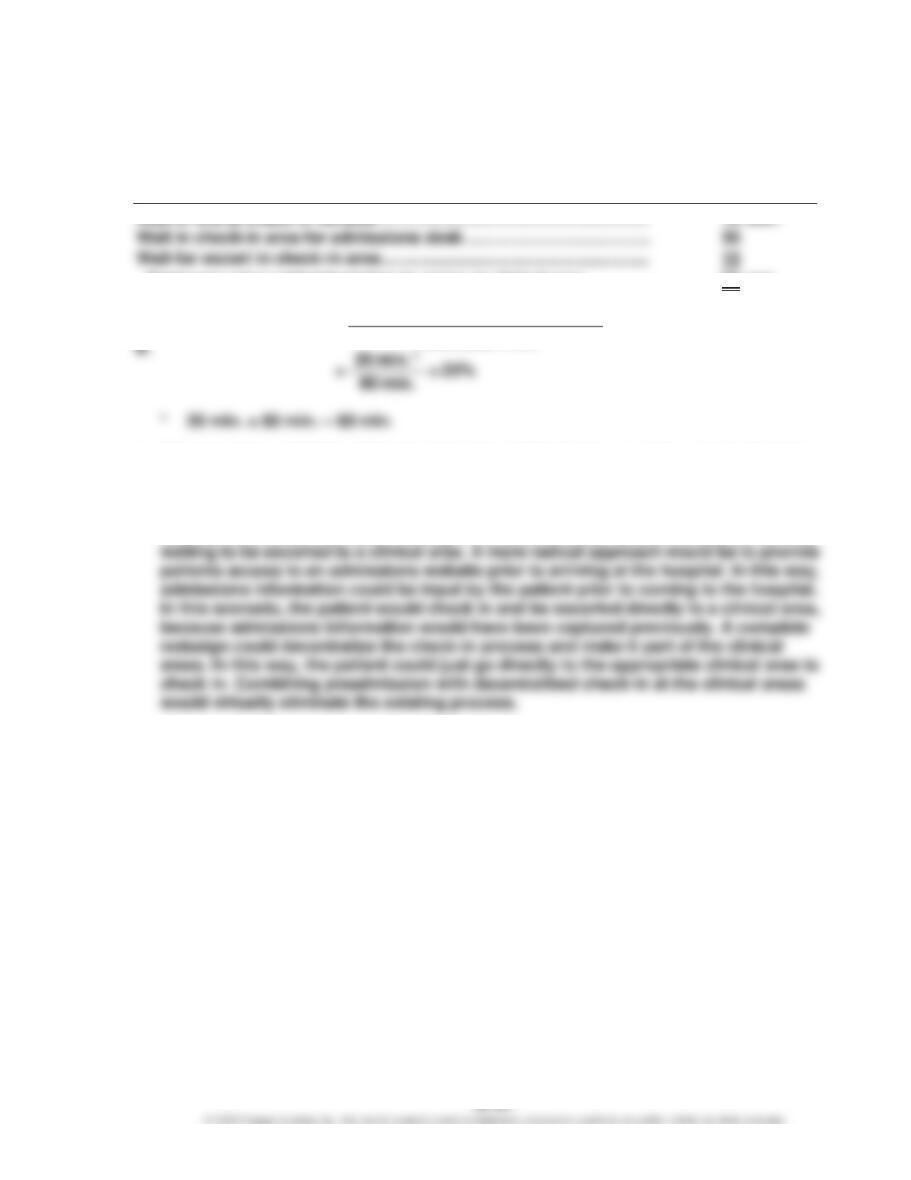
a.
Average
Lead Time
Total non-value-added lead time to arrive at clinical area …………..
60
min.
–Value – Added Lead Time
Value Added Ratio = Total Lead Time
c. The non-value-added lead time is related to waiting between each process element.
Adding resources to the process during the busier times of the day can reduce the
waiting. The check-in window could be expanded to multiple service lines, and the
admissions desk could be expanded to multiple desks. This would reduce the waiting
time between these activities. Adding more escorts could reduce the amount of time
CHAPTER 27 (FIN MAN); CHAPTER 13 (MAN) Lean Manufacturing and Activity Analysis
MAD 27–2 (FIN MAN); MAD 13–2 (MAN)
Shield Insurance Company should adopt lean principles in its claims payment
operations. Management should first consider changing the layout for this process.
Instead of processing the claims payments through three different departments that are
organized by process, the company could design claims payment “cells” that are
organized around different types of insurance products or customers and consolidated
CHAPTER 27 (FIN MAN); CHAPTER 13 (MAN) Lean Manufacturing and Activity Analysis
MAD 27–3 (FIN MAN); MAD 13–3 (MAN)
a.
Sterilization ……………………………………………………………..
15
minutes
Equipment and supply setup …………………………………….
2
Patient preparation …………………………………………………..
3
Total TAT …………………………………………………………….
20
minutes
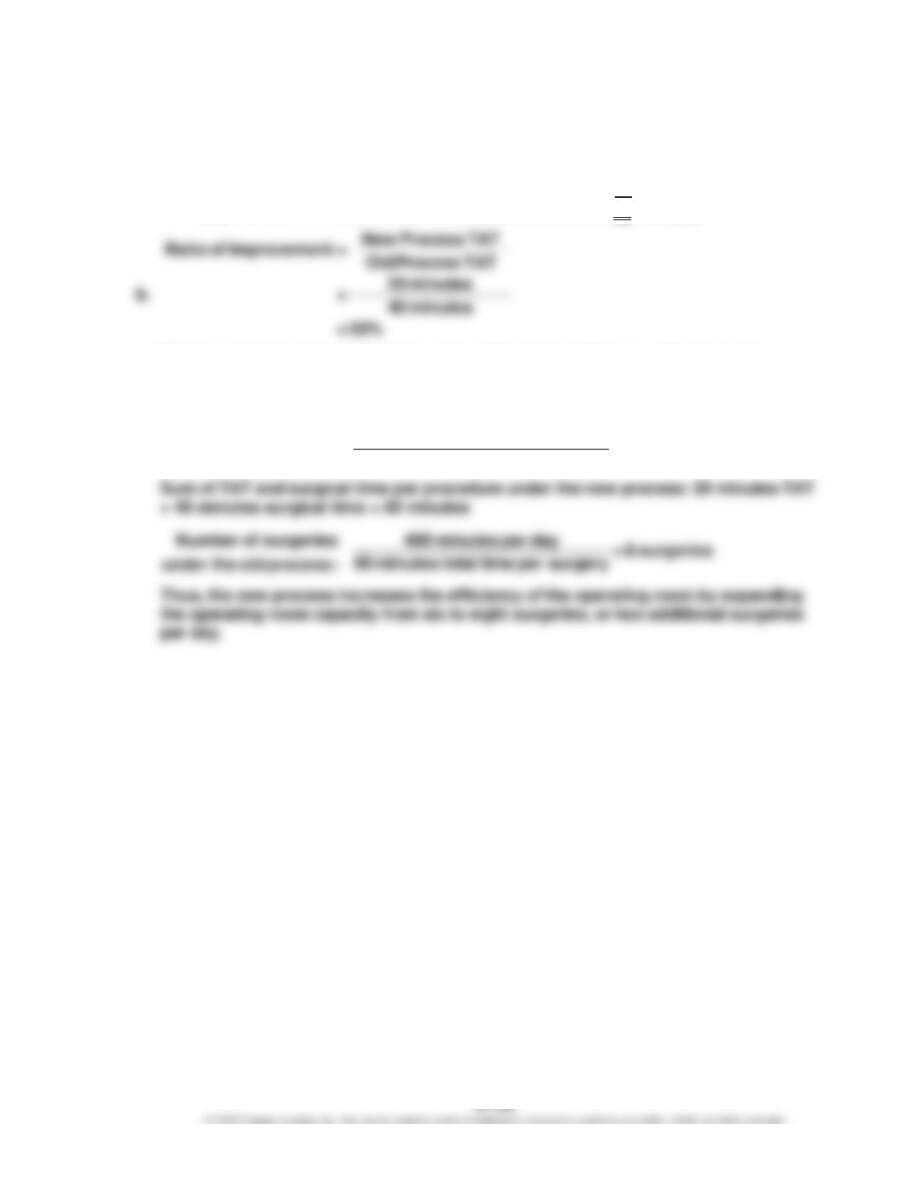
c. Number of minutes in an eight-hour day: 480 minutes (8 hours × 60 minutes)
Sum of TAT and surgical time per procedure under the old process: 40 minutes
TAT + 40 minutes surgical time = 80 minutes
Number of surgeries 480 minutes per day = 6 surgeries
80 minutes total time per surgery
under the old process:
CHAPTER 27 (FIN MAN); CHAPTER 13 (MAN) Lean Manufacturing and Activity Analysis
MAD 27–4 (FIN MAN); MAD 13–4 (MAN)
a. and b.
Elapsed
Time (a)
Activity
Value-Added
Time
Non-
Value-Added
Time (b)
1:00
p.m.
Arrives at doctor office
1:25
Waits in waiting room (5 × 5 min.)
25
min.
1:30
Waits in examining room
5
1:40
Nurse takes readings
10
min.
2:10
Waits in examining room
2:15
Doctor performs diagnosis
2:25
Waits to pay for services
2:30
Walks to pharmacy
2:50
Waits to fill prescription (4 × 5 min.)
20
2:55
Prescription is filled
3:10
Drives home
Simmons arrives home at 3:10 p.m.
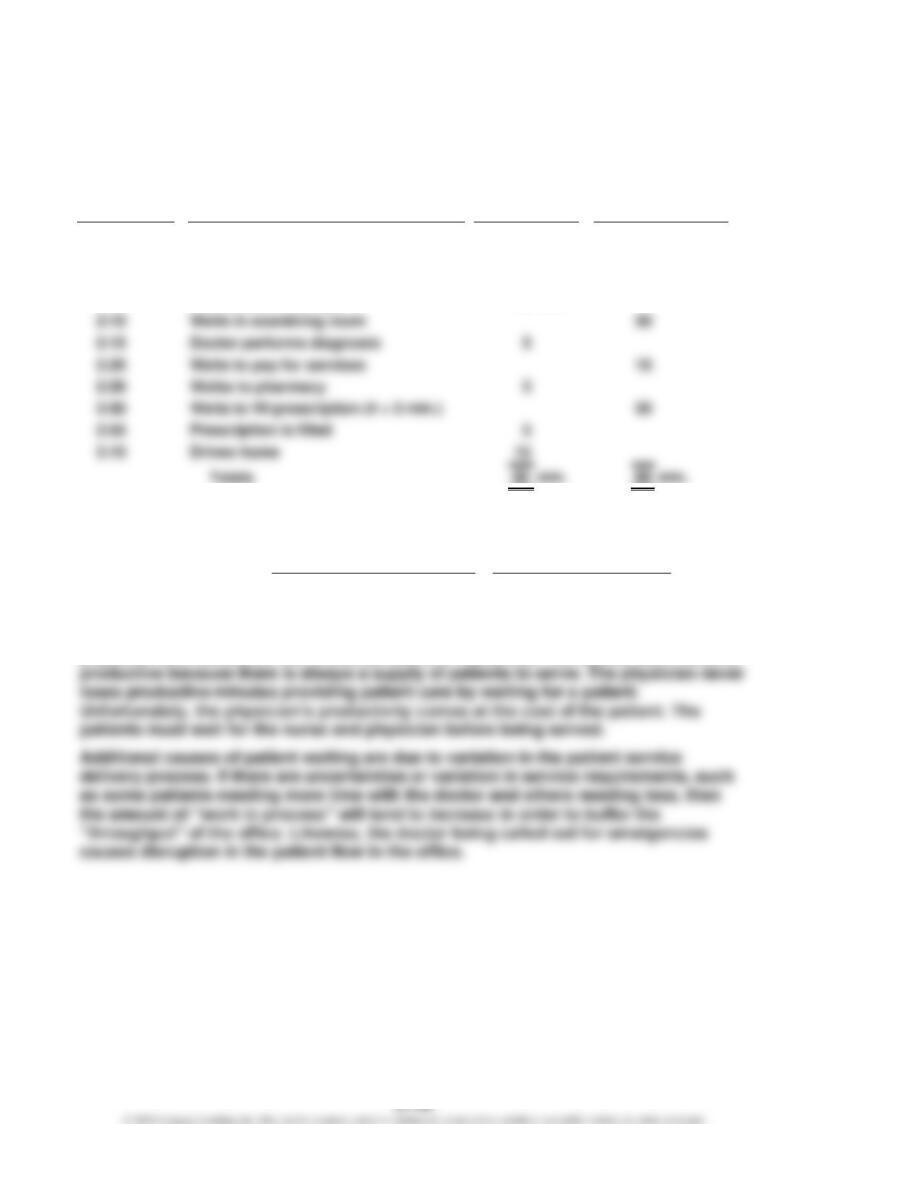
Of the total elapsed time of 130 minutes, 90 minutes is non-value-added time.
c.
–
–Value Added Lead Time 40 min.
Value Added Ratio = = = 30.8%
Total Lead Time (40 min. + 90 min.)
d. The doctor requires patients to wait in order to increase the productivity of the office.
The patients represent the “work in process inventory” of the office, while the
CHAPTER 27 (FIN MAN); CHAPTER 13 (MAN) Lean Manufacturing and Activity Analysis
TAKE IT FURTHER
TIF 27–1 (FIN MAN); TIF 13–1 (MAN)
The controller should confront the plant manager. The plant manager is attempting to
skew the sampling results by giving the sampled items special treatment. The original
intent of the sampling plan is to represent the average performance of the manufacturing
process. Thus, the tagged items should receive no better treatment than the average
not met.
The controller should first insist that the plant manager issue a new memo to all
employees, reversing the first memo. The controller should help the plant manager see
that skewing the results will provide only a short-term benefit. Eventually, this action will
come back to haunt them as the real performance of the plant becomes evident to
CHAPTER 27 (FIN MAN); CHAPTER 13 (MAN) Lean Manufacturing and Activity Analysis
TIF 27–2 (FIN MAN); TIF 13–2 (MAN)
This would be a good assignment for the teams to report back to the class. Each of the
groups will likely go to different restaurants at different times of the day and will have
different results. The results could be shared with the class, and “averages” could be
determined for the various non-value-added categories.
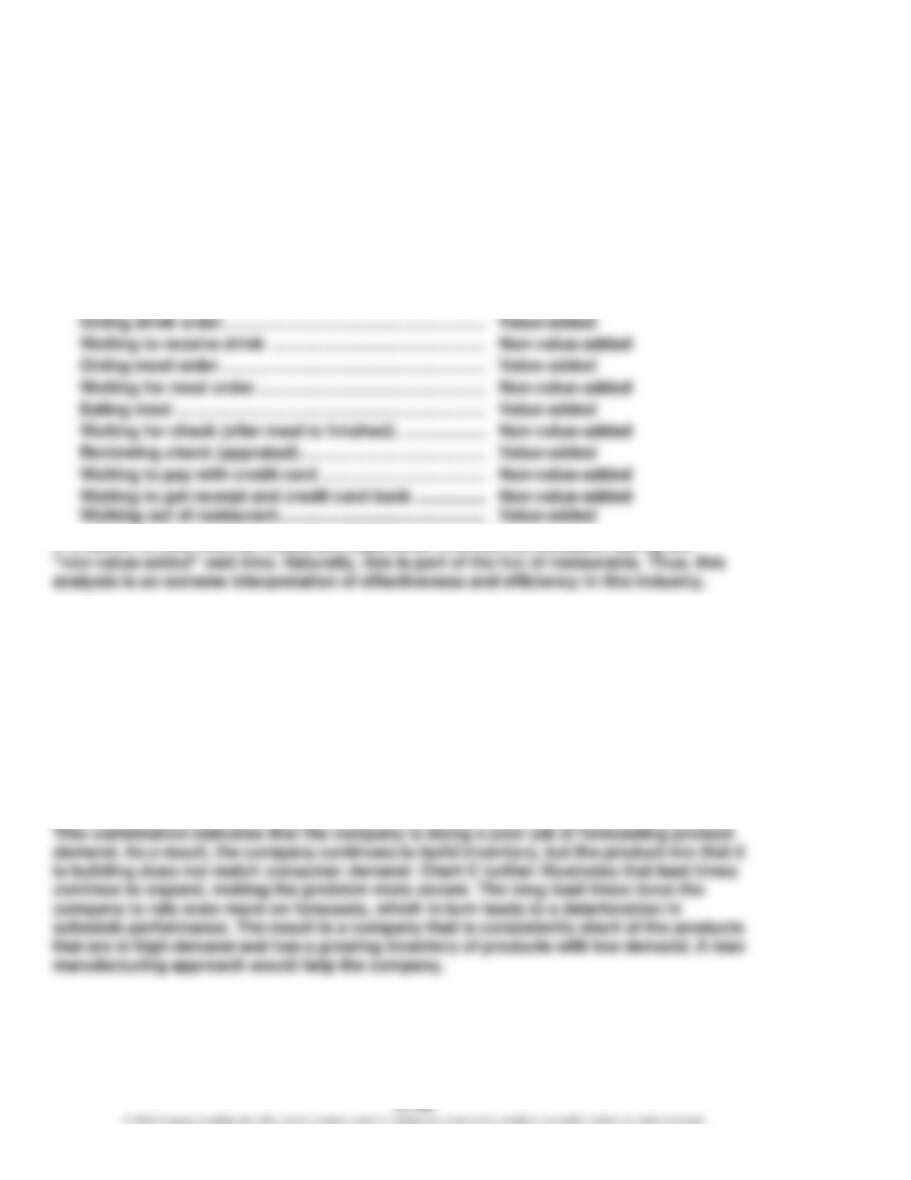
Note to Instructors: The following types of activities will likely be noted in students’ reports:
Waiting to be seated ……………………………………………..
Non-value-added
Being seated ………………………………………………………..
Value-added
Waiting to give drink order…………………………………….
Non-value-added
Waiting to receive drink ………………………………………..
Non-value-added
Giving meal order …………………………………………………
Value-added
Waiting for meal order …………………………………………..
Non-value-added
Waiting for check (after meal is finished) ……………….
Non-value-added
Reviewing check (appraisal) ………………………………….
Value-added
Waiting to pay with credit card ………………………………
Non-value-added
TIF 27–3 (FIN MAN); TIF 13–3 (MAN)
Memo
To: Ethan Fromme
From: Ima Student
Re: Analysis of quality, cost, availability, and response time
A review of Maximal’s three performance charts indicates a steadily deteriorating
situation. Chart A shows that inventory steadily increased during the year, while Chart B
shows that the company’s ability to meet sales orders on time has steadily decreased.
CHAPTER 27 (FIN MAN); CHAPTER 13 (MAN) Lean Manufacturing and Activity Analysis
CERTIFIED MANAGEMENT ACCOUNTANT (CMA®)
EXAMINATION QUESTIONS (ADAPTED)
1. c. Prevention costs include design engineering ($300,000), supplier evaluation
2. b. Appraisal costs are incurred to detect individual units that do not conform to
specifications, e.g., inspecting raw materials.
3. b. Appraisal costs are incurred to detect individual units that do not conform to