Formula
Formula
Amount
Liabilities
Total liabilities and stockholders’ equity
Total stockholders’ equity
2013
2014
Assets
Formula
Formula
Formula
Formula
Increase or (Decrease)
Amount
Formula
Amount
Amount
Formula
Percentage
Amount
Amount
Formula
Amount
Formula
Amount
Amount
Formula
Amount
Retained earnings
Common stock, $1 par
Total liabilities
Stockholders’ Equity
Formula
Formula
Common stock, $1 par
130,000
115,000
Retained earnings
155,000
170,000
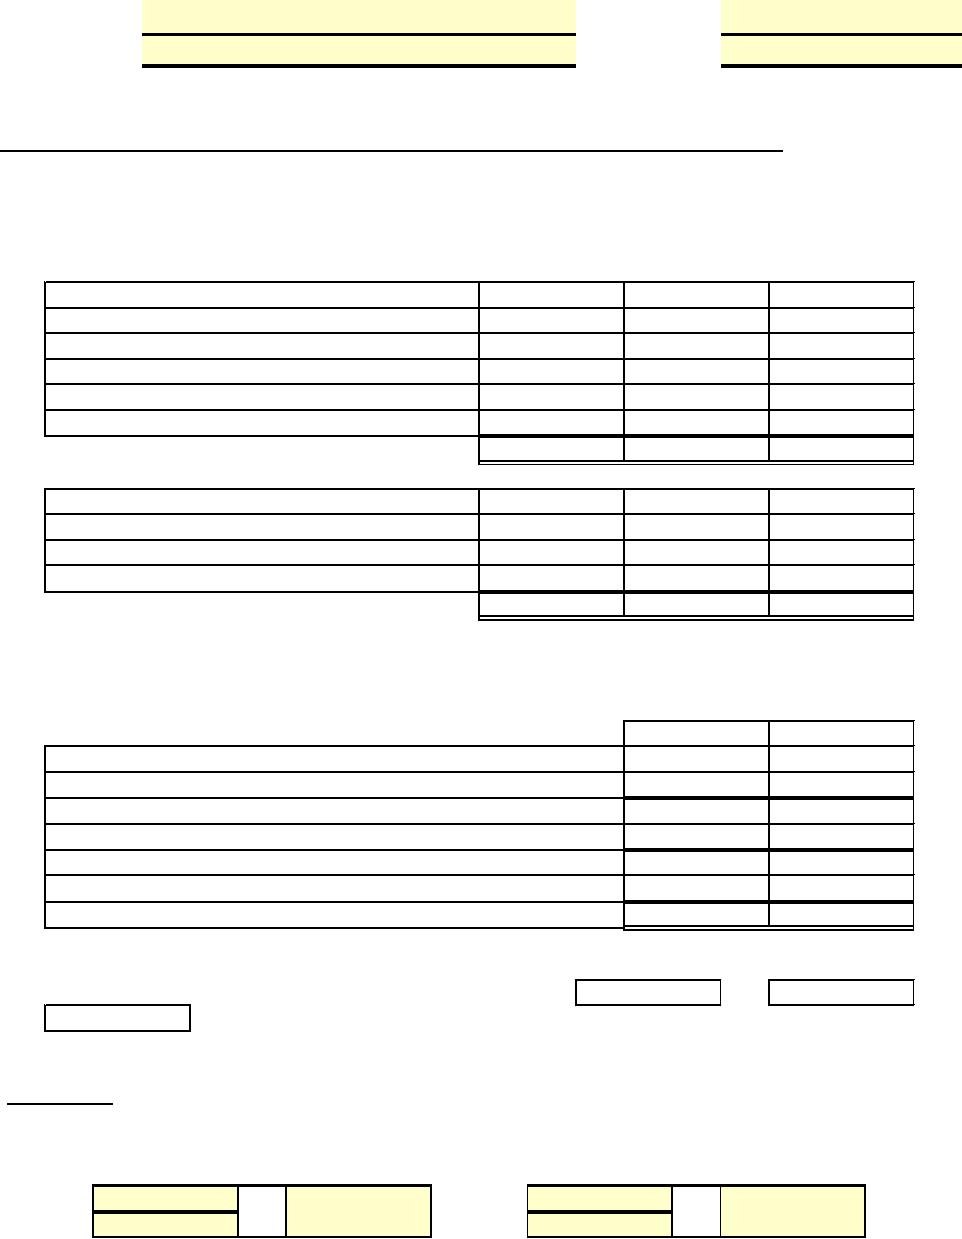
Long-term liabilities
Current liabilities
Amount
Amount
Formula
Formula
Formula
Formula
Formula
Formula
Formula
Formula
Formula
Formula
Amount
Formula
Formula
Formula
Formula
Course:
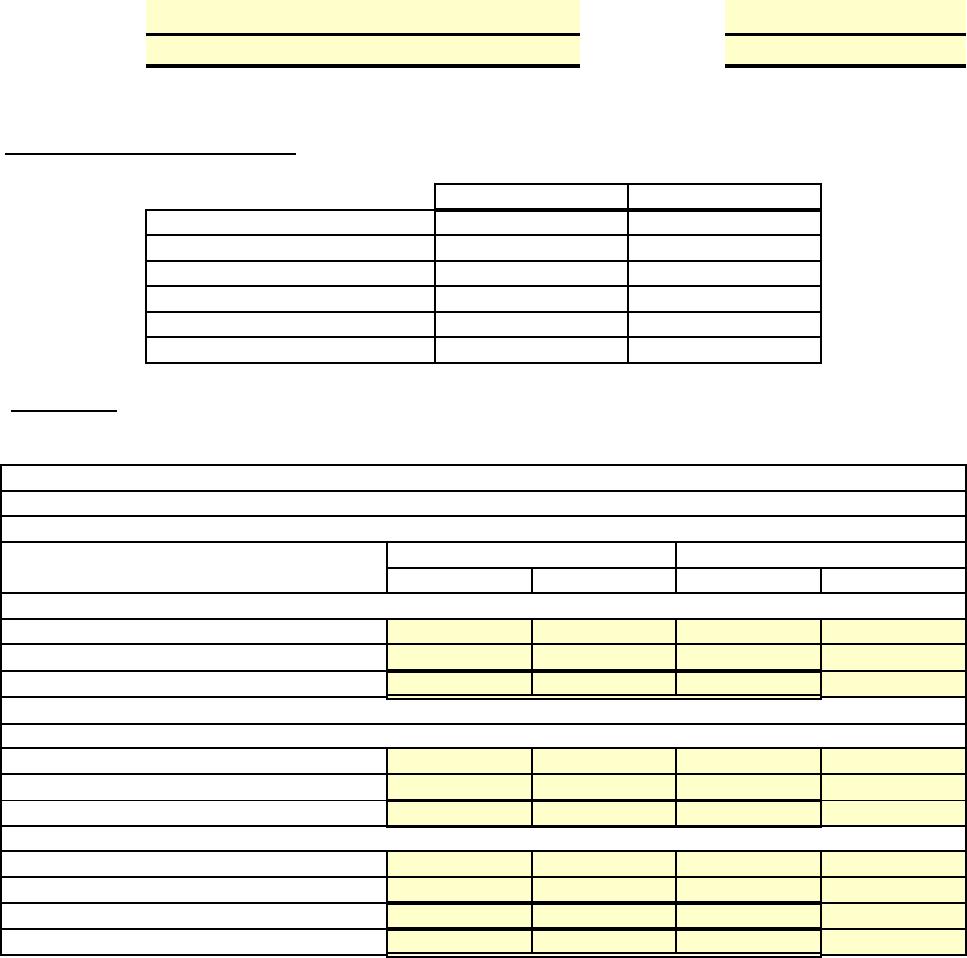
Prepare a schedule showing a horizontal analysis for 2014 using 2013 as the base year.
Instructions:
$90,000
$106,000
Primer on Using Excel in Accounting by Rex A Schildhouse
Here is financial information for Spangles Inc.
E13-3, Prepare horizontal analysis.
Current assets
Plant assets (net)
400,000
December 31
Condensed Balance Sheet
SPANGLES INC.
Name:
Financial Accounting, Seventh Edition by Kimmel, Weygandt, and Kieso
Date:
Instructor:
350,000
Current liabilities
99,000
65,000
December 31, 2013
December 31, 2014
90,000
Long-term liabilities
122,000
Total assets
Plant assets (net)
Current assets
Formula
KimFin_7e_SET_Ch13.xlsx, Page 1 of 10 Page(s), 4/15/202212:00 PM
Condensed Balance Sheet
Increase or (Decrease)
Percentage
Amount
December 31
2014
2013
Retained earnings
155,000
170,000
400,000
350,000
$106,000
SPANGLES INC.
122,000
90,000
Common stock, $1 par
130,000
115,000
99,000
65,000
Long-term liabilities
Current liabilities
December 31, 2013
December 31, 2014
$90,000
Name:
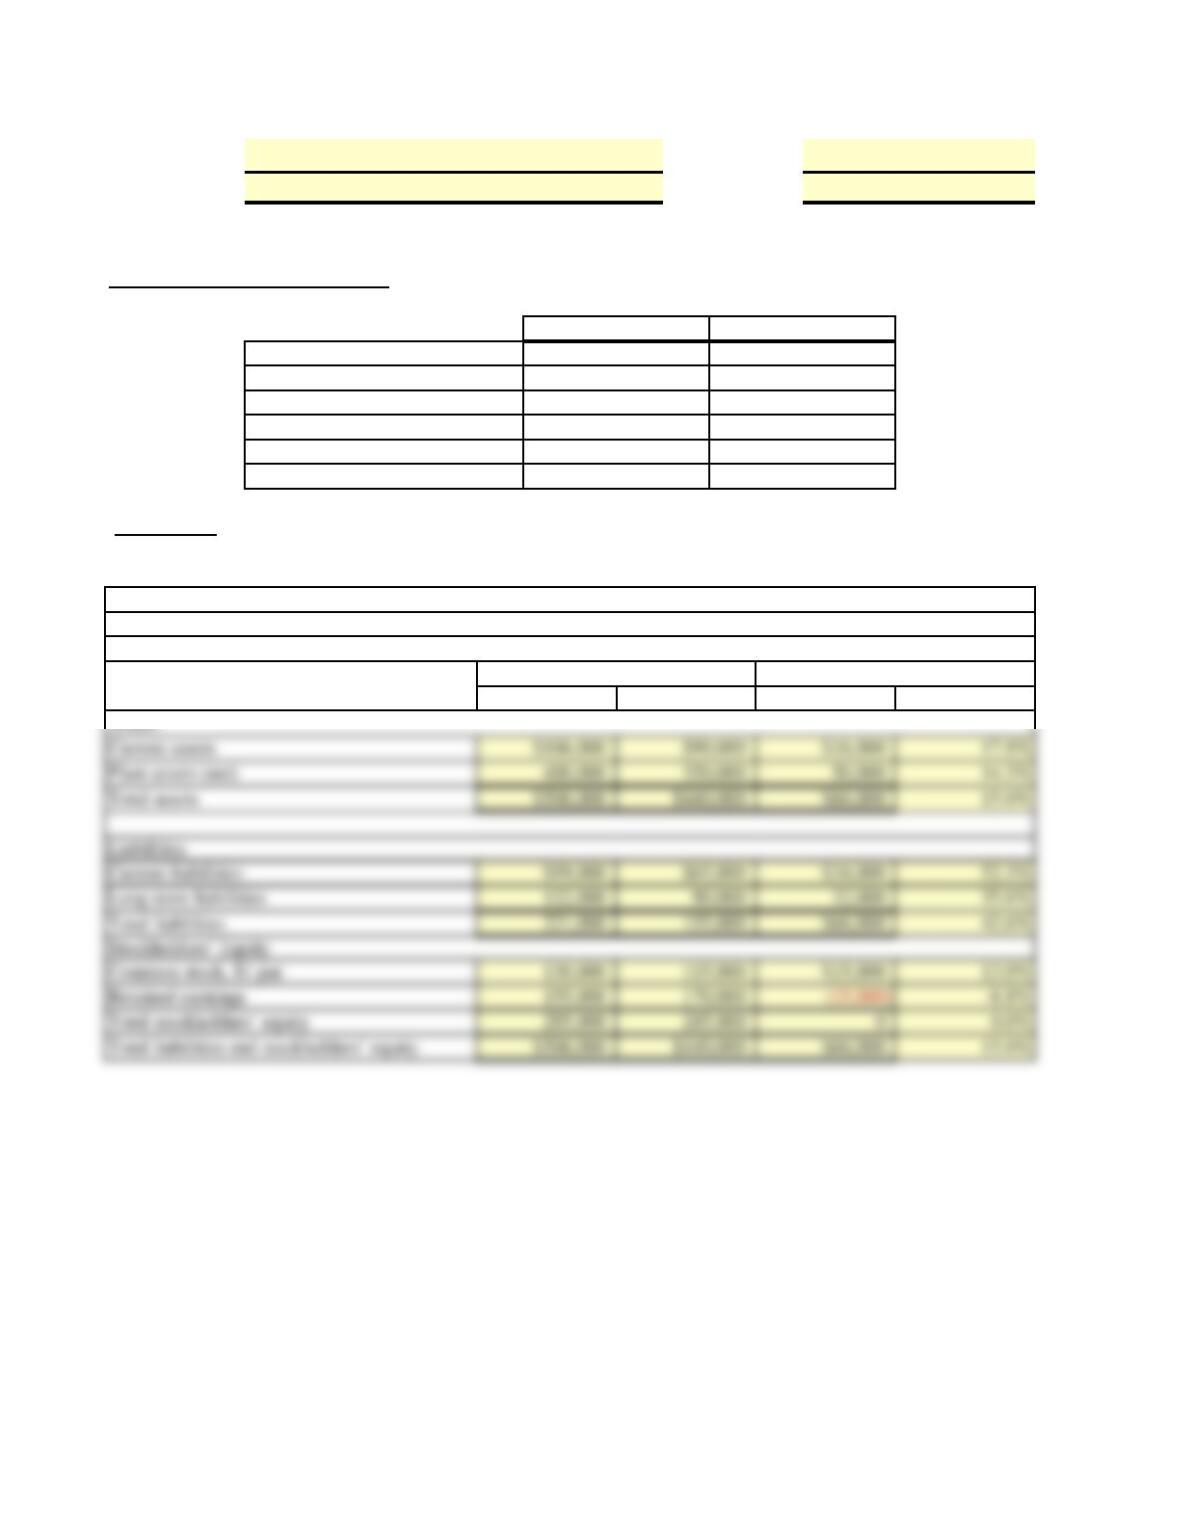
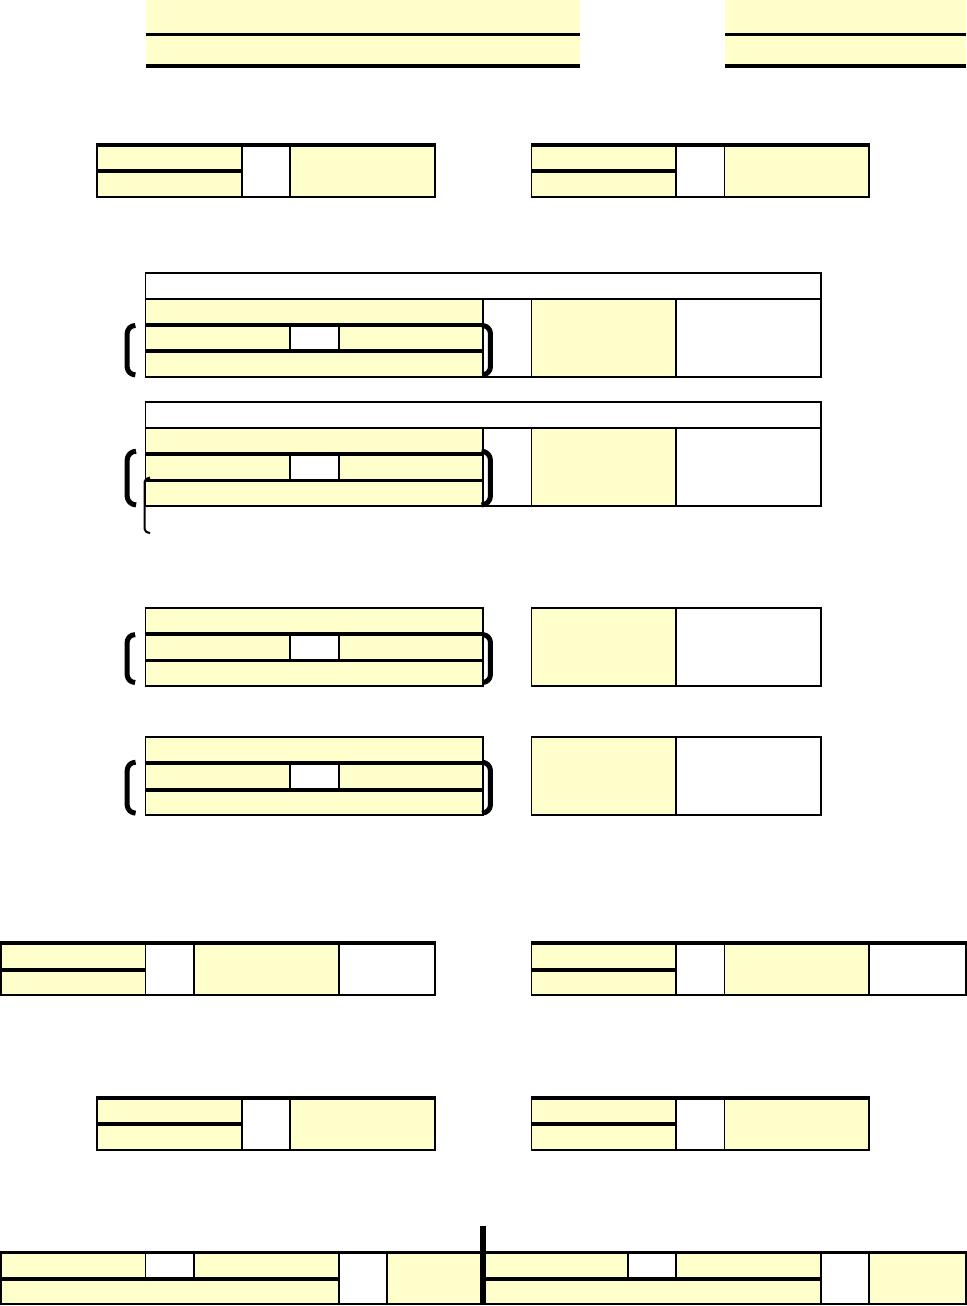
Solution
Date:
Instructor:
Course:
Financial Accounting, Seventh Edition by Kimmel, Weygandt, and Kieso
Primer on Using Excel in Accounting by Rex A Schildhouse
Here is financial information for Spangles Inc.
E13-3, Prepare horizontal analysis.
Prepare a schedule showing a horizontal analysis for 2014 using 2013 as the base year.
Instructions:
Plant assets (net)
Current assets
KimFin_7e_SET_Ch13.xlsx, Page 2 of 10 Page(s), 4/15/202212:00 PM
Account title
Amount
Formula
Amount
Formula
Title
Formula
Formula
Formula
Formula
Title
Formula
Formula
Formula
Formula
Title
Formula
Formula
Formula
Formula
Account title
Amount
Formula
Amount
Formula
Account title
Amount
Formula
Amount
Formula
Account title
Amount
Formula
Amount
Formula
Title
Formula
Formula
Formula
Formula
Account title
Amount
Formula
Amount
Formula
For the Years Ended December 31
2014
2013
Amount
Percent
Amount
Percent
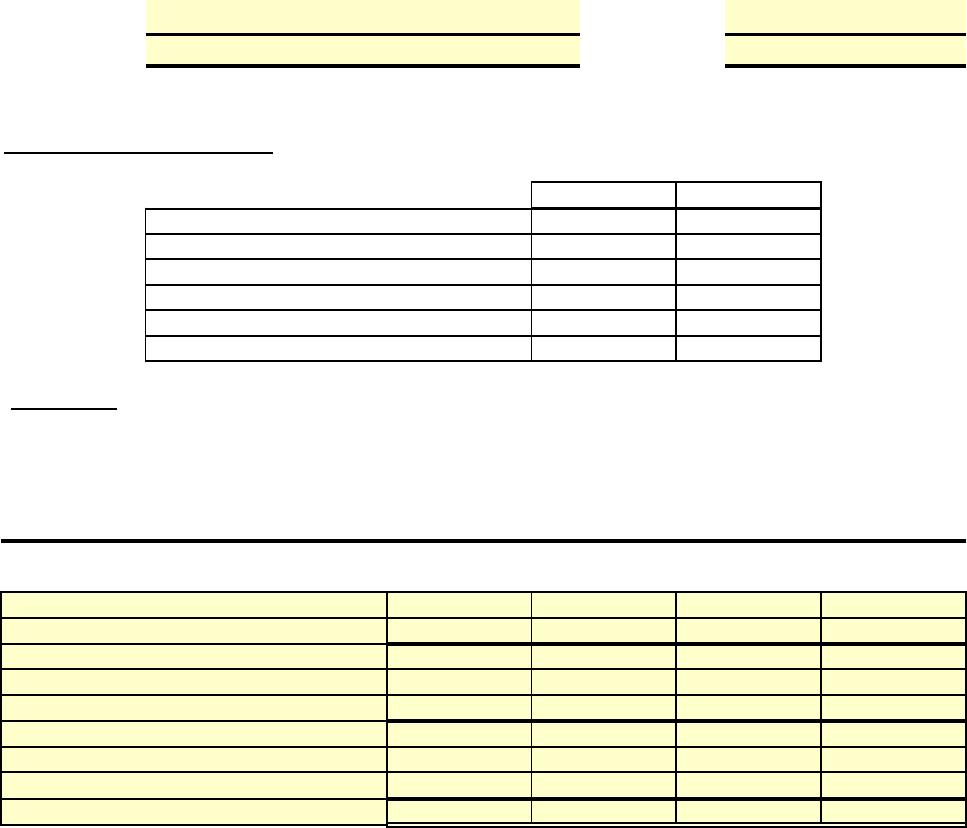
JACOBS CORPORATION
Condensed Income Statement
Prepare a schedule showing a vertical analysis for 2014 and 2013.
Administrative expenses
60,000
48,000
Income tax expense
30,000
24,000
Net income
70,000
48,000
2014
2013
Sales revenue
$800,000
$600,000
Cost of goods sold
520,000
Selling expenses
120,000
408,000
Name:
Date:
Instructor:
Course:
Instructions:
72,000
Financial Accounting, Seventh Edition by Kimmel, Weygandt, and Kieso
Primer on Using Excel in Accounting by Rex A Schildhouse
E13-4, Prepare vertical analysis.
Operating data for Jacobs Corporation are presented below.
KimFin_7e_SET_Ch13.xlsx, Page 3 of 10 Page(s), 4/15/202212:00 PM
Income before income taxes
72,000
Selling expenses
72,000
Gross profit
280,000
192,000
Sales revenue
$800,000
100.0%
$600,000
100.0%
For the Years Ended December 31
2014
2013
Amount
Percent
Amount
Percent
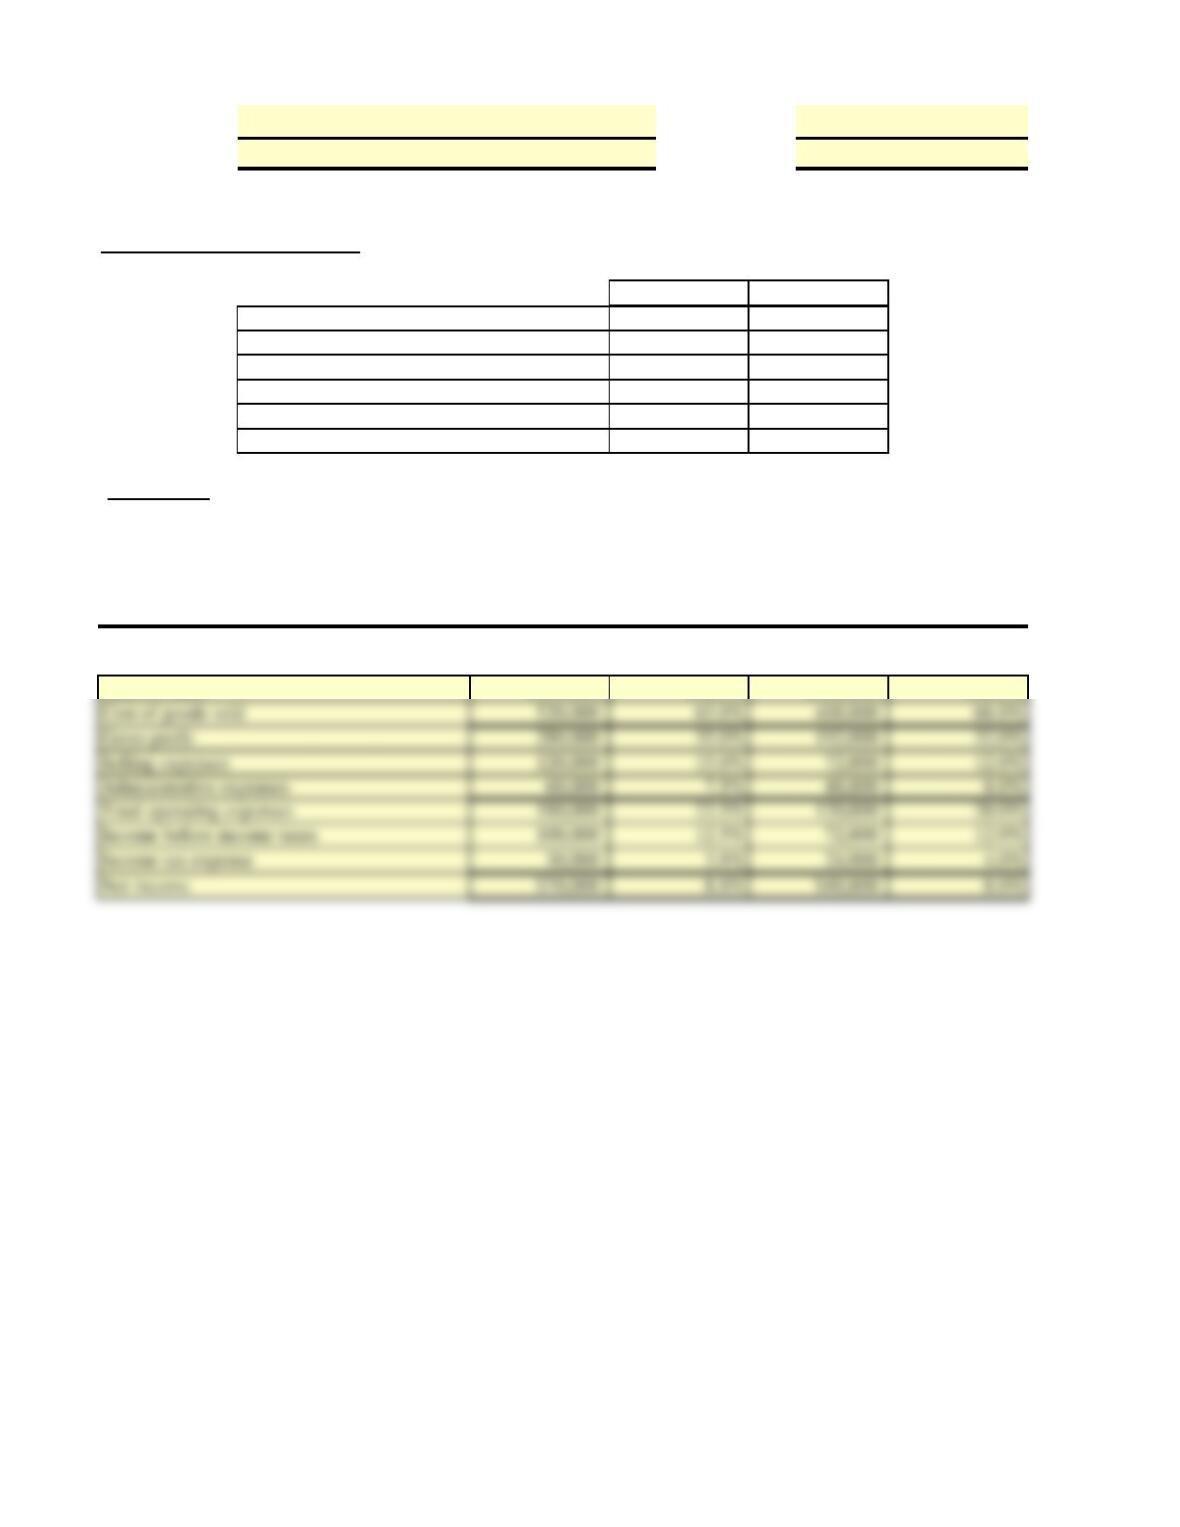
JACOBS CORPORATION
Condensed Income Statement
Prepare a schedule showing a vertical analysis for 2014 and 2013.
Administrative expenses
60,000
48,000
Income tax expense
30,000
24,000
Net income
70,000
48,000
2014
2013
Sales revenue
$800,000
$600,000
Cost of goods sold
520,000
Selling expenses
120,000
408,000
Name:
Solution
Date:
Instructor:
Course:
Instructions:
72,000
Financial Accounting, Seventh Edition by Kimmel, Weygandt, and Kieso
Primer on Using Excel in Accounting by Rex A Schildhouse
E13-4, Prepare vertical analysis.
Operating data for Jacobs Corporation are presented below.
KimFin_7e_SET_Ch13.xlsx, Page 4 of 10 Page(s), 4/15/202212:00 PM
1. , and
2.
Amount
=
Formula
Amount
=
Formula
Amount
Amount
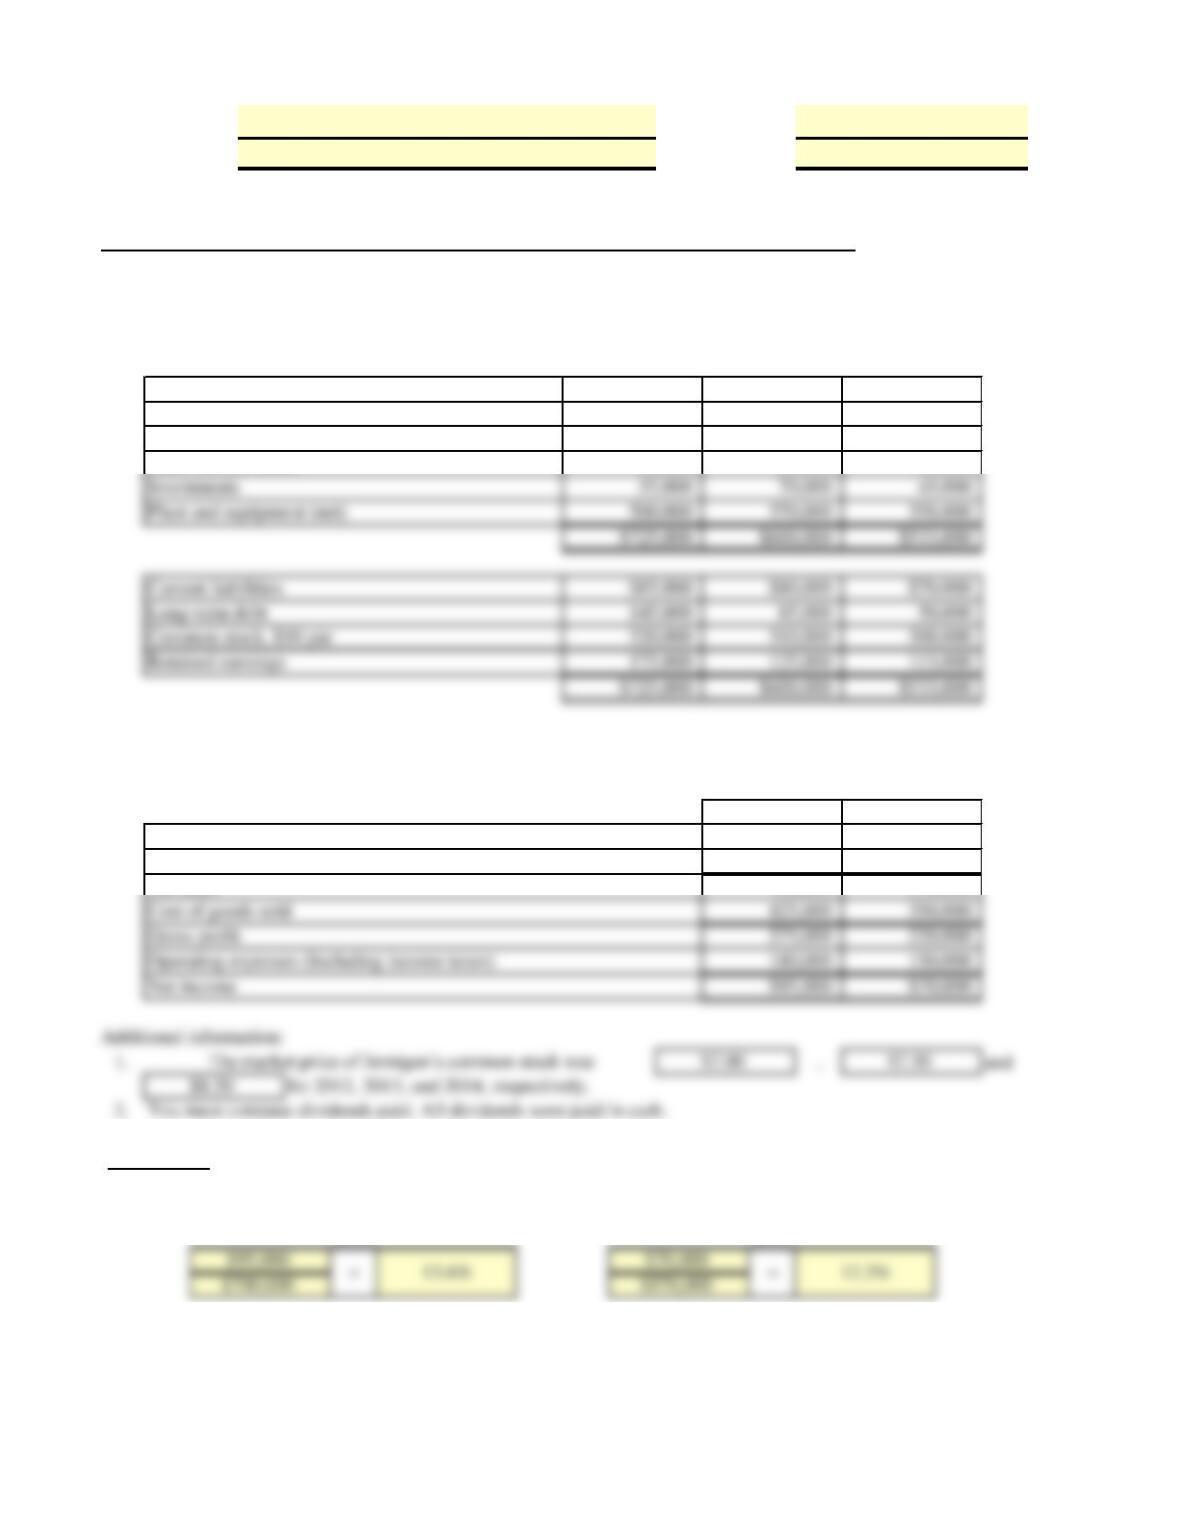
You must compute dividends paid. All dividends were paid in cash.
Instructions:
(a) (1) Compute the profit margin ratios for 2013 and 2014.
2014
2013
Additional information:
The market price of Jernigan’s common stock was
$7.00
$7.50
$8.50
for 2012, 2013, and 2014, respectively.
Operating expenses (Including income taxes)
180,000
150,000
Net income
$95,000
$70,000
Cost of goods sold
425,000
350,000
Gross profit
275,000
220,000
Less: Sales returns and allowances
40,000
30,000
Net sales
700,000
570,000
Income Statement
For the Years Ended December 31
2014
2013
Sales revenue
$740,000
$600,000
$725,000
$600,000
$533,000
JERNIGAN CORPORATION
Common stock, $10 par
320,000
310,000
300,000
Retained earnings
175,000
125,000
113,000
Current liabilities
$85,000
$80,000
$70,000
Long-term debt
145,000
85,000
50,000
Plant and equipment (net)
500,000
370,000
358,000
$725,000
$600,000
$533,000
Other current assets
90,000
95,000
64,000
Investments
55,000
70,000
45,000
Cash
$30,000
$20,000
$18,000
Accounts receivables (net)
50,000
45,000
48,000
Balance Sheets
December 31
2014
2013
2012
Financial Accounting, Seventh Edition by Kimmel, Weygandt, and Kieso
Primer on Using Excel in Accounting by Rex A Schildhouse
P13-3A, Perform ratio analysis, and discuss change in financial position and operating results.
Condensed balance sheet and income statement data for Jernigan Corporation are presented here.
JERNIGAN CORPORATION
Name:
Date:
Instructor:
Course:
KimFin_7e_SET_Ch13.xlsx, Page 5 of 10 Page(s), 4/15/202212:00 PM
Financial Accounting, Seventh Edition by Kimmel, Weygandt, and Kieso
Name:
Date:
Instructor:
Course:
+
+
+
+
+ +
$85,000
Amount
2014
2013
$80,000
$85,000
=
#VALUE!
Amount
Formula
Amount
Amount
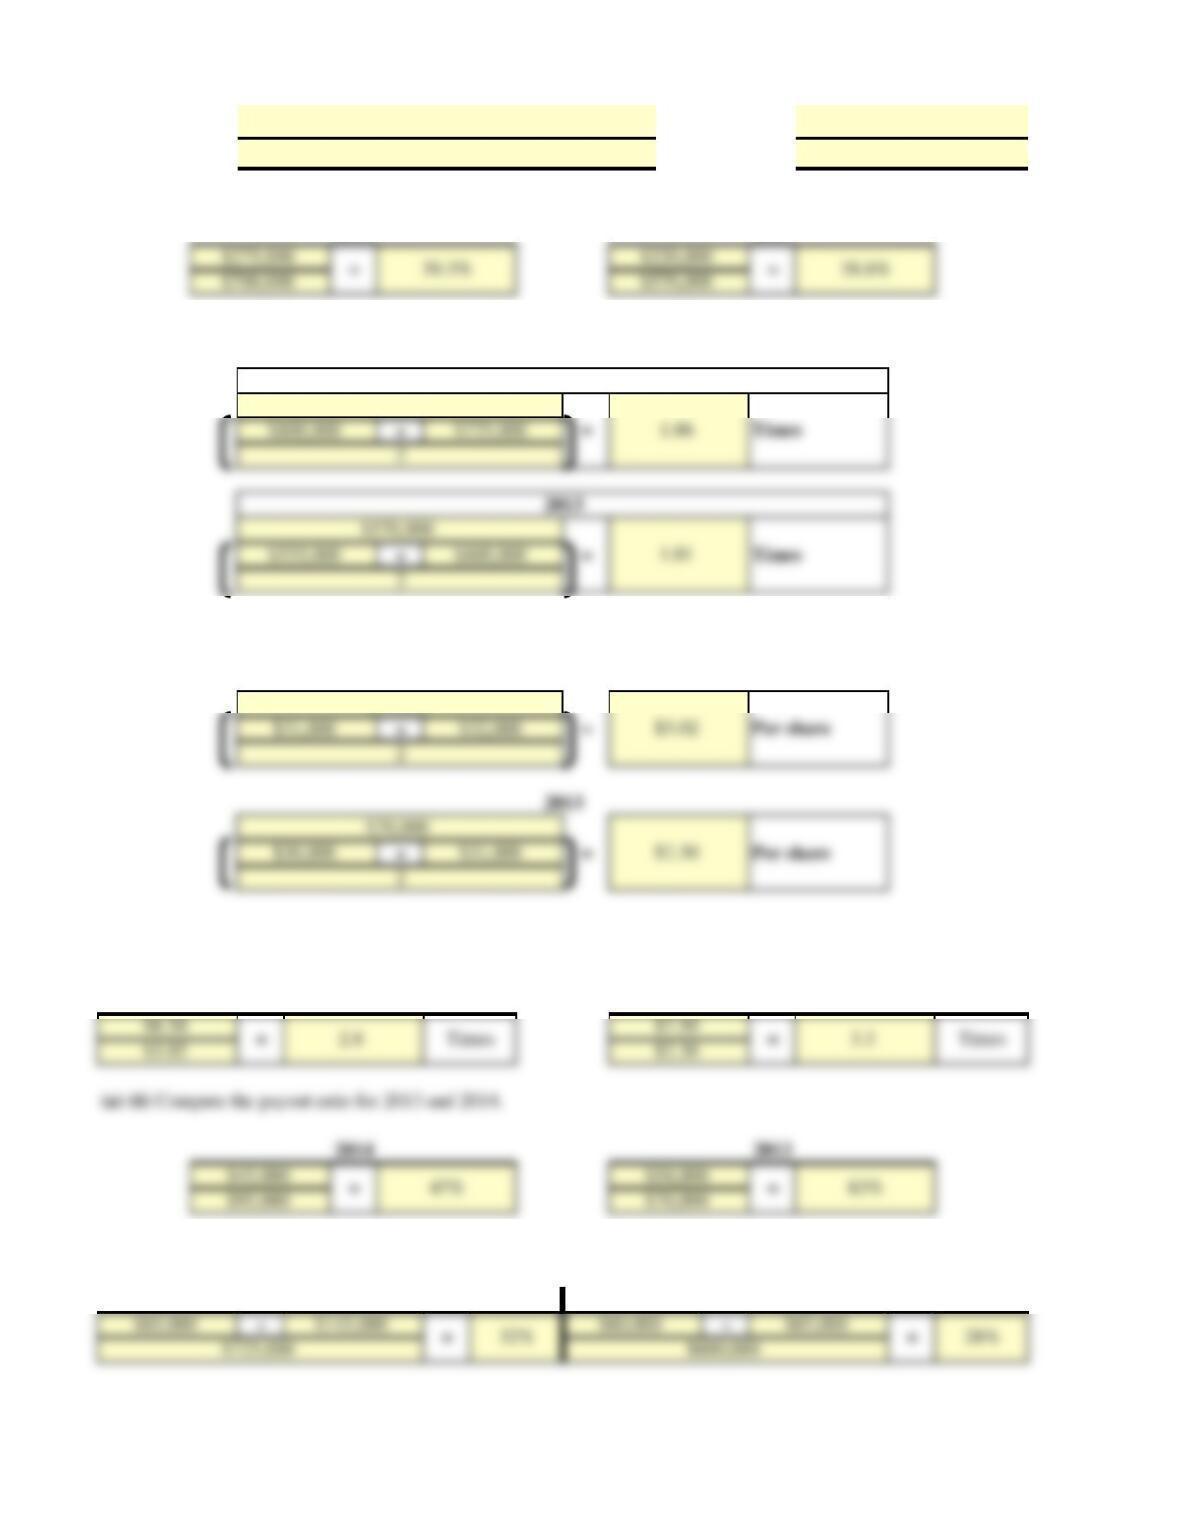
(a) (7) Compute the debt to assets ratio for 2013 and 2014.
2014
2013
Amount
=
Formula
Amount
=
#VALUE!
=
$145,000
Times
Amount
Amount
(a) (6) Compute the payout ratio for 2013 and 2014.
2014
2013
Amount
=
Formula
Times
Amount
=
Formula
Amount
Number
(a) (5) Compute the price-earnings ratio for 2013 and 2014.
Number
2013
Amount
=
Formula
Per share
Amount
2014
Amount
=
Formula
Per share
Amount
Amount
Times
Amount
Amount
Number
(a) (4) Compute the earnings per share ratio for 2013 and 2014.
Amount
Amount
Number
2013
Amount
=
Formula
(a) (3) Compute the asset turnover ratio for 2013 and 2014.
2014
Amount
=
Formula
Times
Formula
Amount
=
Formula
Amount
Amount
(a) (2) Compute the gross profit rate for 2013 and 2014.
2014
2013
Amount
=
KimFin_7e_SET_Ch13.xlsx, Page 6 of 10 Page(s), 4/15/202212:00 PM
Financial Accounting, Seventh Edition by Kimmel, Weygandt, and Kieso
Name:
Date:
Instructor:
Course:
Enter text answer here.
(b) Based on the ratios calculated, discuss briefly the improvement or lack thereof in the financial position and
operating results from 2013 to 2014 of Jernigan Corporation.
KimFin_7e_SET_Ch13.xlsx, Page 7 of 10 Page(s), 4/15/202212:00 PM
You must compute dividends paid. All dividends were paid in cash.
Additional information:
for 2012, 2013, and 2014, respectively.
Operating expenses (Including income taxes)
Net income
Cost of goods sold
Gross profit
275,000
220,000
Instructions:
(a) (1) Compute the profit margin ratios for 2013 and 2014.
2014
2013
Less: Sales returns and allowances
40,000
30,000
Net sales
700,000
570,000
Income Statement
For the Years Ended December 31
2014
2013
Sales revenue
$740,000
$600,000
Common stock, $10 par
320,000
310,000
300,000
Retained earnings
Current liabilities
$85,000
$80,000
$70,000
Long-term debt
145,000
85,000
50,000
Plant and equipment (net)
Investments
55,000
70,000
45,000
JERNIGAN CORPORATION
Other current assets
90,000
95,000
64,000
Cash
$30,000
$20,000
$18,000
Accounts receivables (net)
50,000
45,000
48,000
Balance Sheets
December 31
2014
2013
2012
Financial Accounting, Seventh Edition by Kimmel, Weygandt, and Kieso
Primer on Using Excel in Accounting by Rex A Schildhouse
P13-3A, Perform ratio analysis, and discuss change in financial position and operating results.
Condensed balance sheet and income statement data for Jernigan Corporation are presented here.
JERNIGAN CORPORATION
Name:
Solution
Date:
Instructor:
Course:
KimFin_7e_SET_Ch13.xlsx, Page 8 of 10 Page(s), 4/15/202212:00 PM
Financial Accounting, Seventh Edition by Kimmel, Weygandt, and Kieso
Name:
Solution
Date:
Instructor:
Course:
2013
$570,000
2013
$70,000
2014
2013
2014
2013
(a) (6) Compute the payout ratio for 2013 and 2014.
(a) (7) Compute the debt to assets ratio for 2013 and 2014.
2014
2013
(a) (5) Compute the price-earnings ratio for 2013 and 2014.
2014
$95,000
(a) (4) Compute the earnings per share ratio for 2013 and 2014.
(a) (3) Compute the asset turnover ratio for 2013 and 2014.
2014
$700,000
(a) (2) Compute the gross profit rate for 2013 and 2014.
2014
2013
KimFin_7e_SET_Ch13.xlsx, Page 9 of 10 Page(s), 4/15/202212:00 PM
Financial Accounting, Seventh Edition by Kimmel, Weygandt, and Kieso
Name:
Solution
Date:
Instructor:
Course:
(b) Based on the ratios calculated, discuss briefly the improvement or lack thereof in the financial position and
operating results from 2013 to 2014 of Jernigan Corporation.
KimFin_7e_SET_Ch13.xlsx, Page 10 of 10 Page(s), 4/15/202212:00 PM