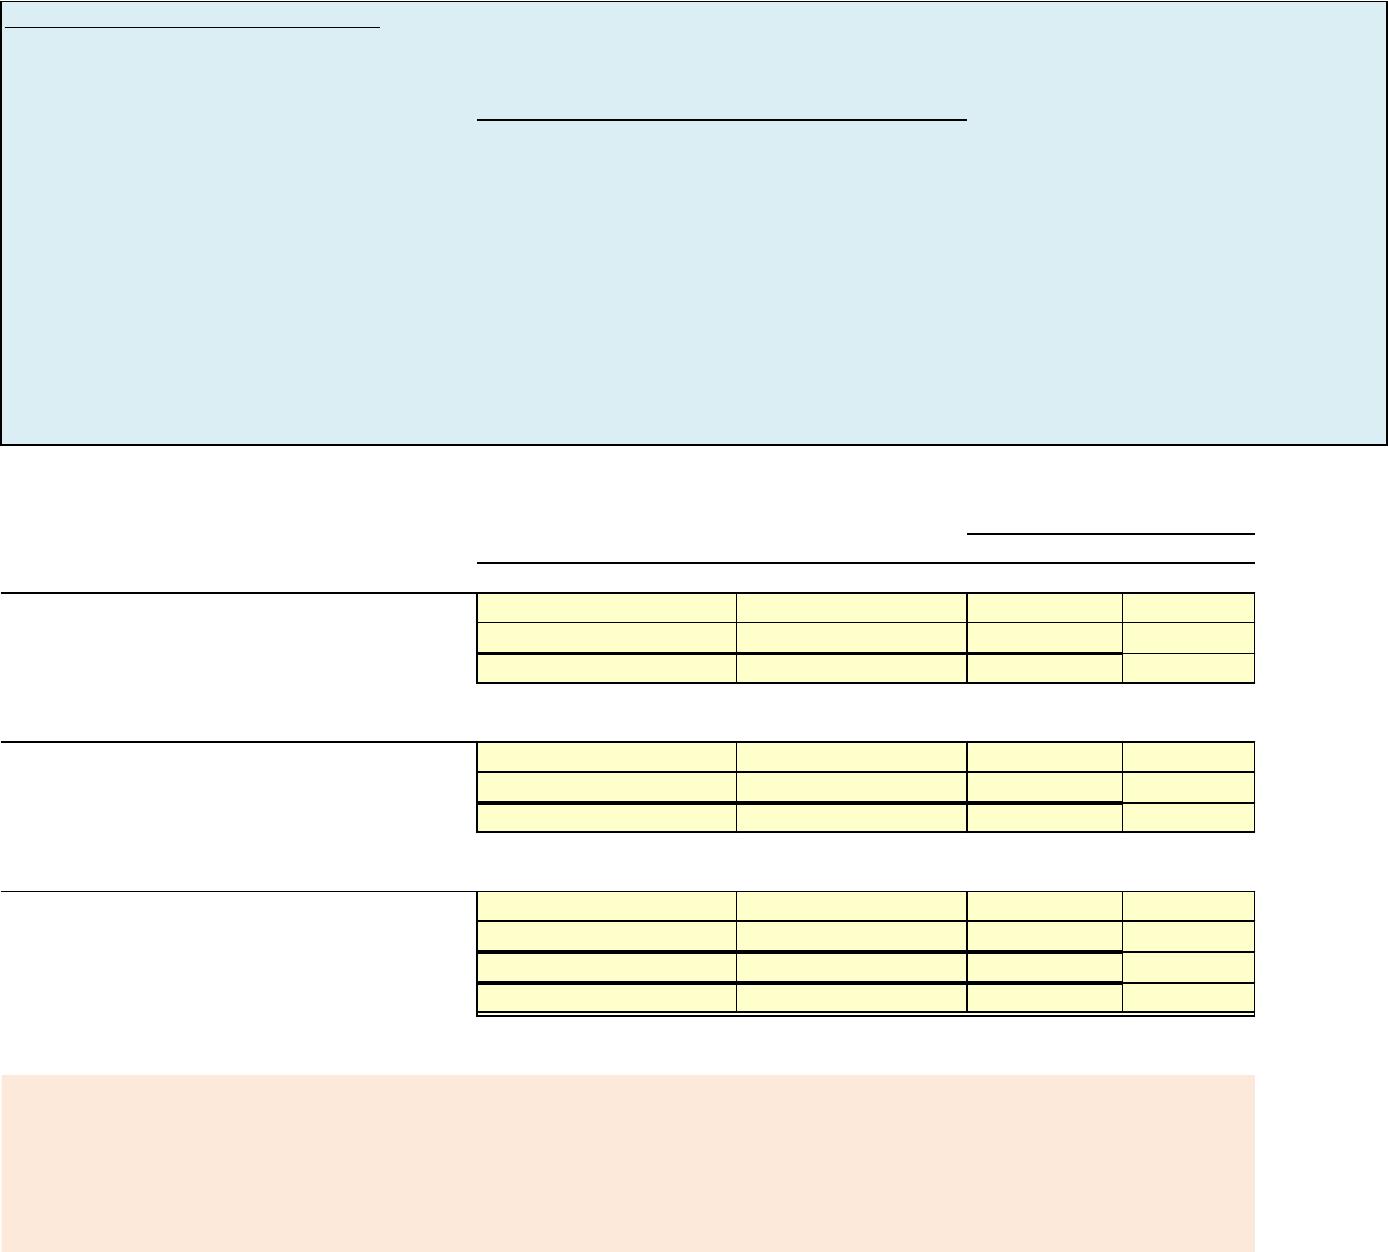
E13-3 Prepare horizontal analysis
Here is financial information for Glitter, Inc.
December 31, 2017 December 31, 2016
Current assets $106,000 $90,000
Plant assets (net) 400,000 350,000
Current liabilities 99,000 65,000
Long-term liabilities 122,000 90,000
Common stock, $1 par 130,000 115,000
Reained earnings 155,000 170,000
Instructions
Prepare a schedule showing a horizontal analysis for 2017, using 2016 as the base year.
NOTE: Enter a number in cells requesting a value; enter either a number or a formula in cells with a “?” .
2017 2016 Amount Percentage
Value Value Value ?
Value Value Value ?
? ? ? ?
Value Value Value ?
Value Value Value ?
? ? ? ?
Value Value Value ?
Value Value Value ?
? ? ? ?
Value Value Value ?
After you have completed E13-3, consider the additional question.
1. Assume that the 2017 balances for plant assets(net, long-term liabilities and retained earnings changed to
$435,000, $147.0000, and $165,000 respectively. Show the impact of these changes on the horizontal
analysis.
Common stock, $1 par
Retained earnings
Total stockholders’ equity
Total liabilities and stockholders’ equity
Increase or (Decrease)
Assets
Liabilities
Stockholders’ equity
Current assets
Plant assets (net)
Total assets
Current liabilities
Long-term liabilities
Total liabilities
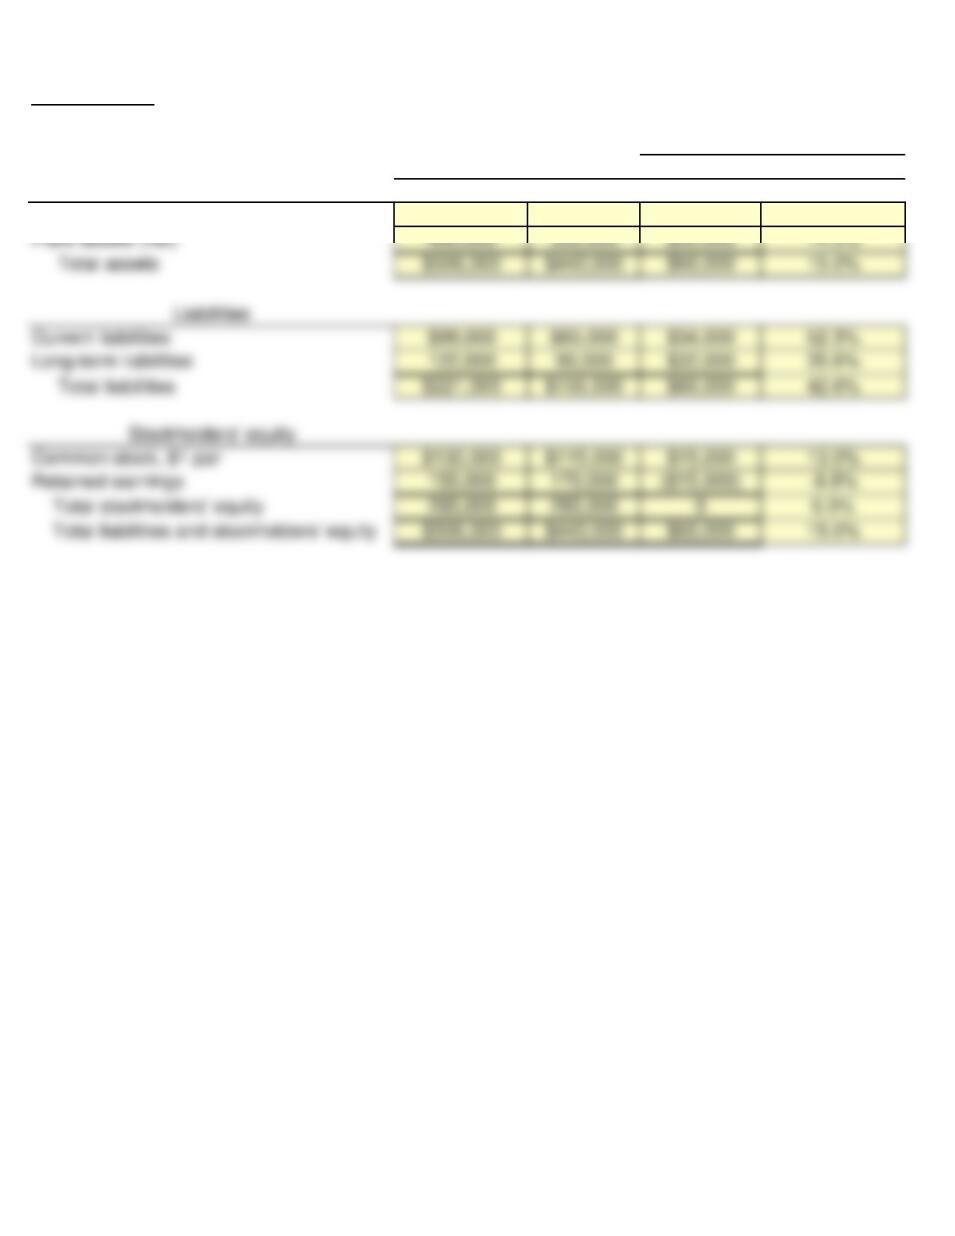
E13-3 Solution
2017 2016 Amount Percentage
$106,000 $90,000 $16,000 17.8%
Increase or (Decrease)
Assets
Current assets
Current liabilities
Total liabilities
Common stock, $1 par
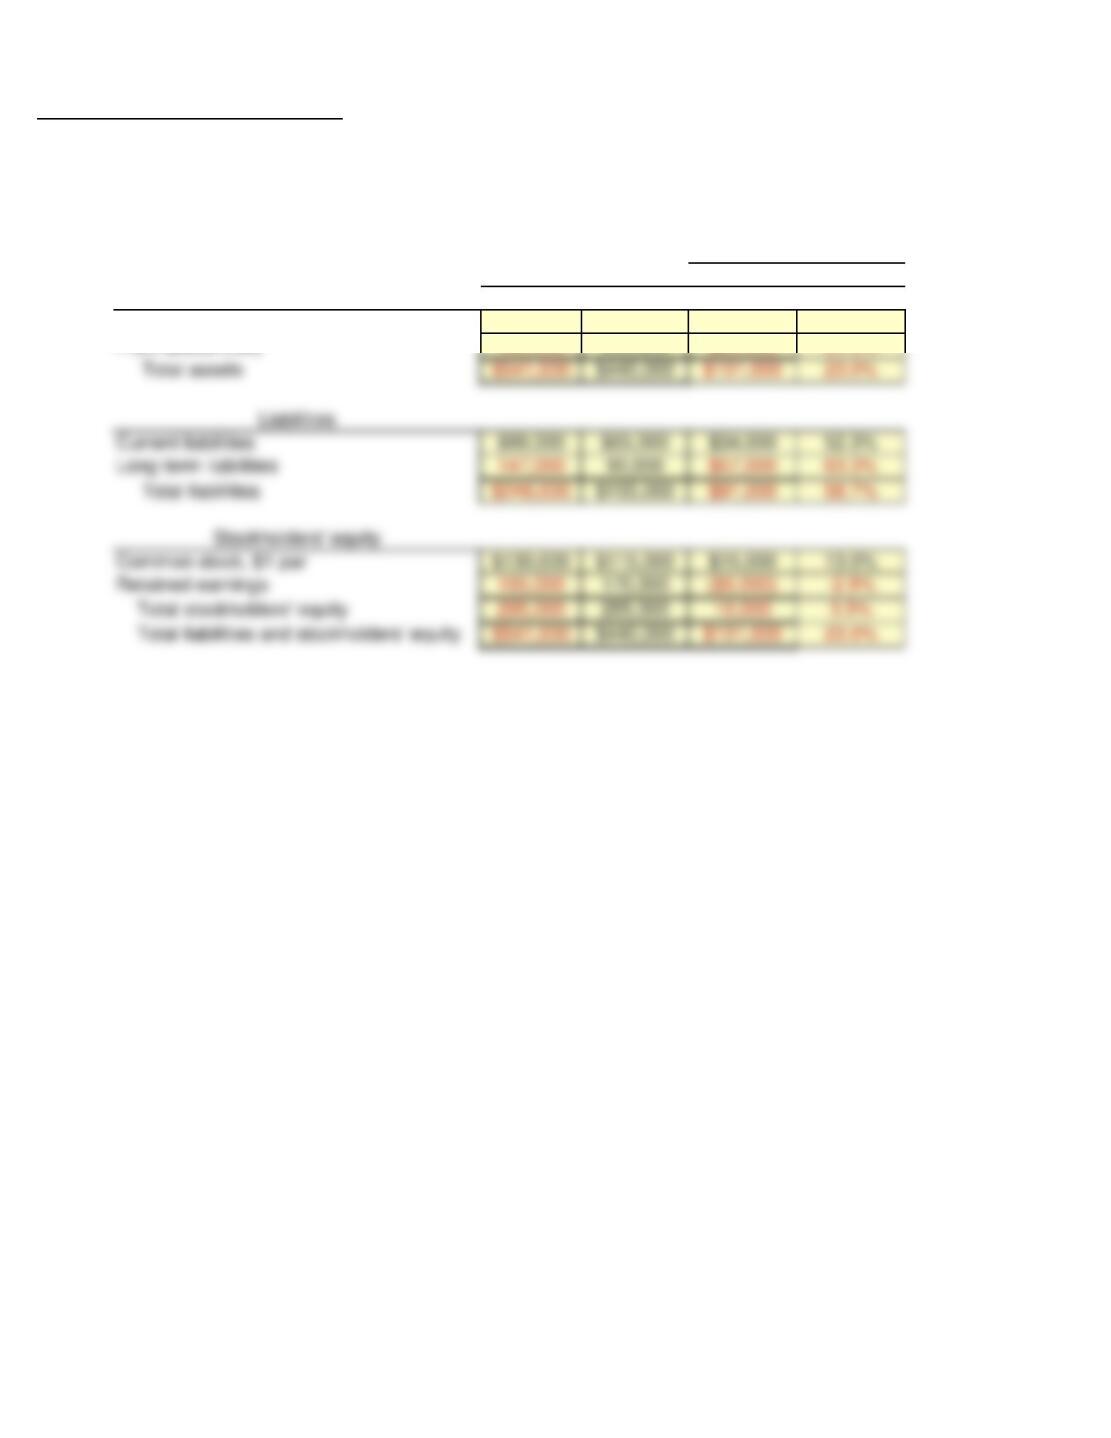
E13-3 Solution to additional question
1. Assume that the 2017 balances for plant assets(net, long-term liabilities and retained earnings changed to
$435,000, $147.0000, and $165,000 respectively. Show the impact of these changes on the horizontal
analysis.
2017 2016 Amount Percentage
$106,000 $90,000 $16,000 17.8%
435,000 350,000 $85,000 24.3%
Increase or (Decrease)
Assets
Current assets
Plant assets (net)
Current liabilities
Total liabilities
Common stock, $1 par
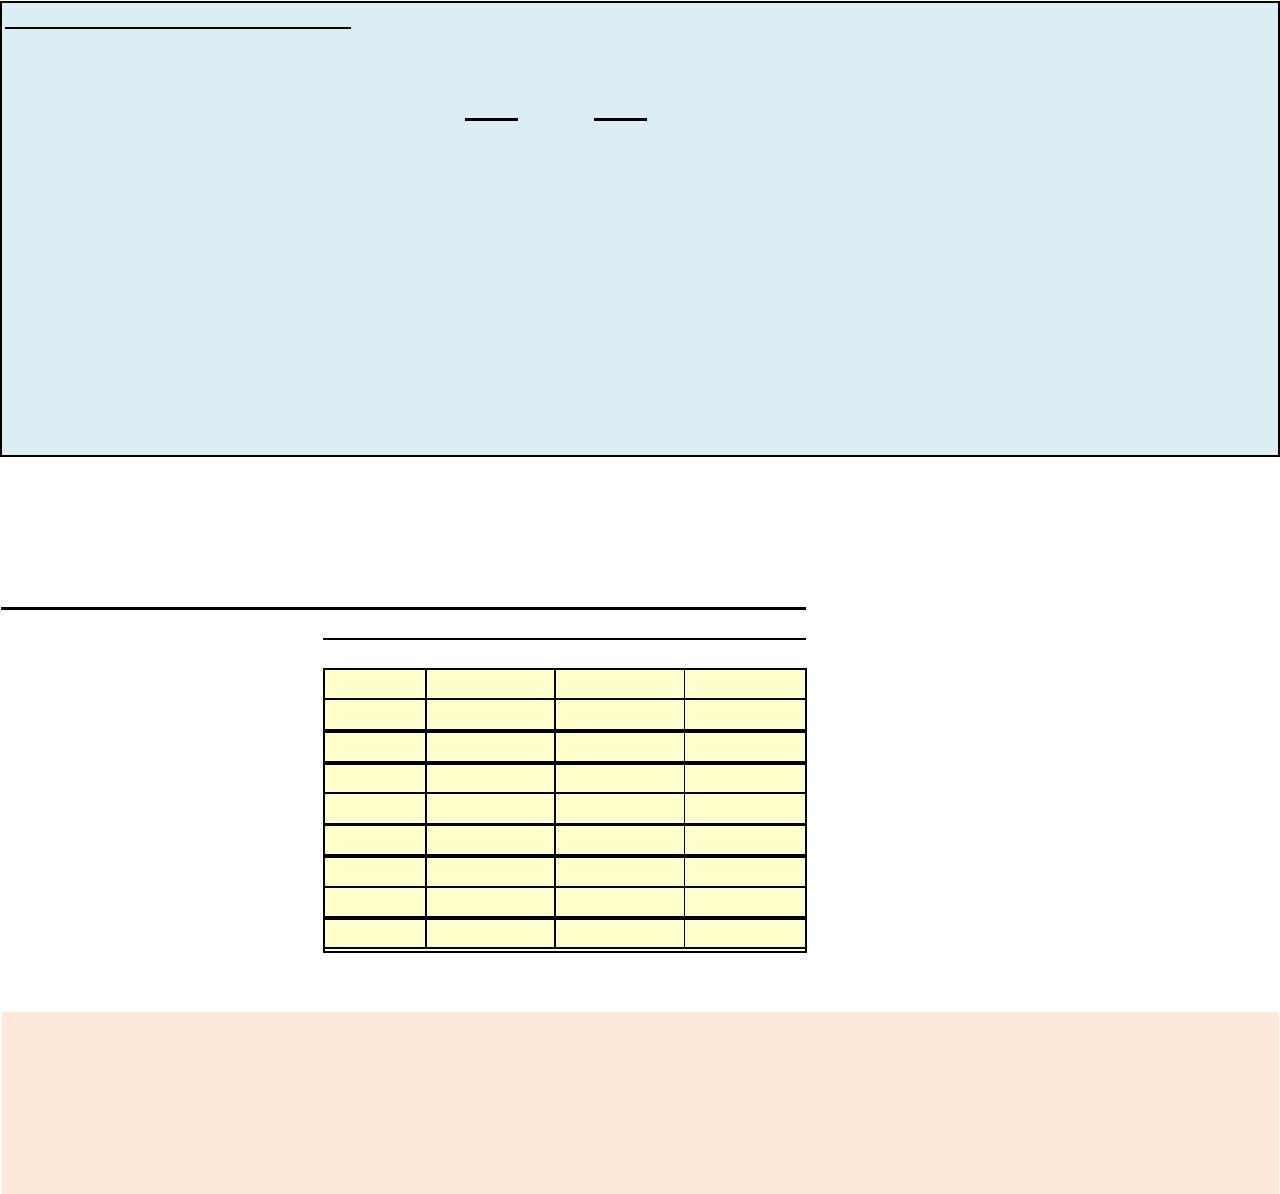
E13-4 Prepare vertical analysis
Operating data for Joshua Corporation are presented below.
2017 2016
Sales revenue $800,000 $600,000
Cost of goods sold 520,000 408,000
Selling expenses 120,000 72,000
Administrative expenses 60,000 48,000
Income tax expense
30,000 24,000
Net income 70,000 48,000
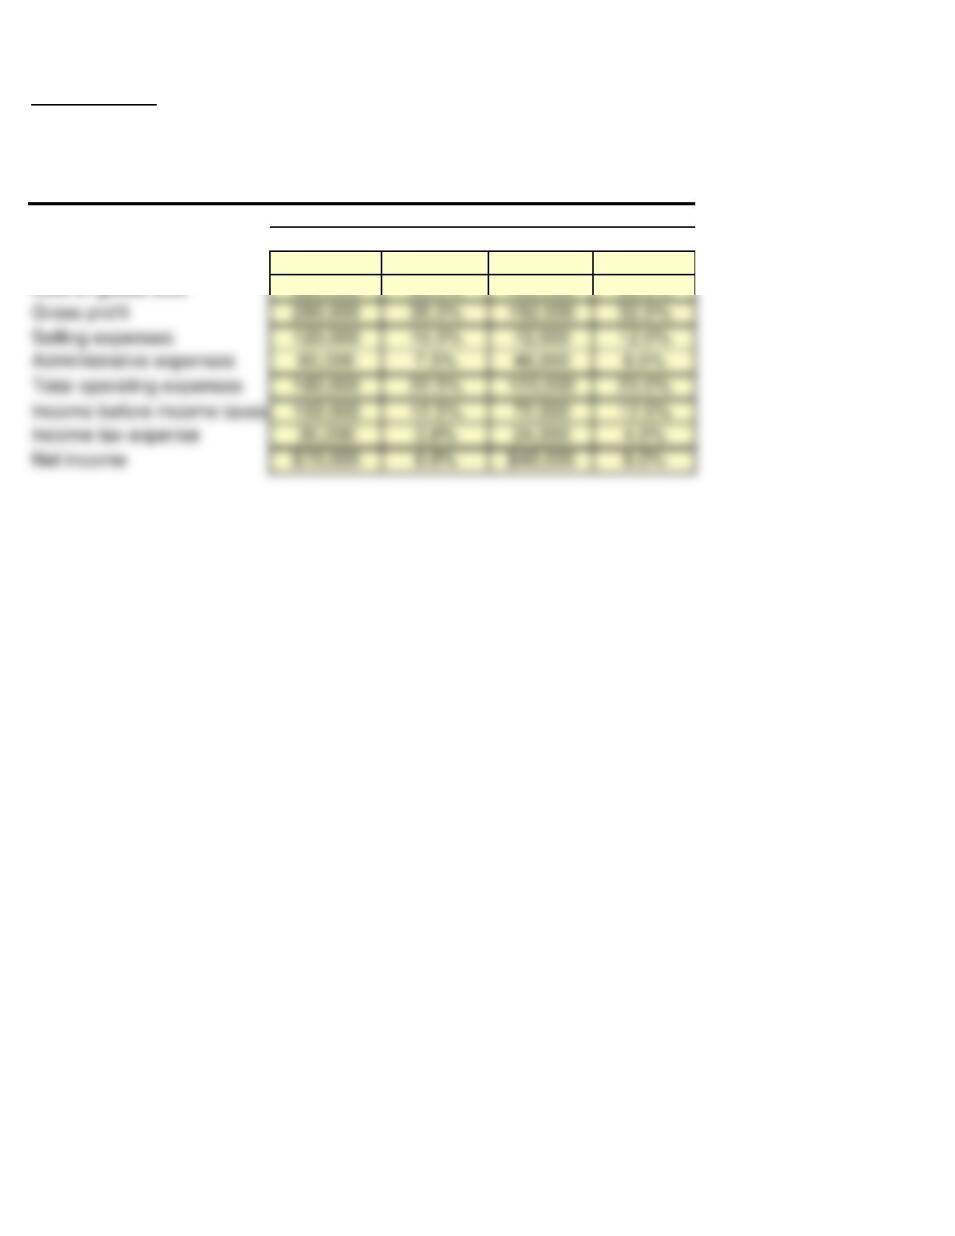
Instructions
Prepare a schedule showing a vertical analysis for 2017 and 2016.
NOTE: Enter a number in cells requesting a value; enter either a number or a formula in cells with a “?” .
Amount Percent Amount Percent
Sales Revenue Value ? Value ?
Cost of goods sold
Value ? Value ?
Gross profit ? ? ? ?
Selling expenses Value ? Value ?
Administrative expenses Value ? Value ?
Total operating expenses ? ? ? ?
Income before income taxes ? ? ? ?
Income tax expense Value ? Value ?
Net income ? ? ? ?
After you have completed E13-4, consider the additional question.
1. Assume that sales revenue in 2017 changed to $755,00 and cost of goods changed to $512,000.
Income tax rate is 30%. Show the impact of these changes on the vertical analysis of the income
statement.
2017
2016
JOSHUA CORPORATION
Condensed Income Statement
For the Years Ended December 31
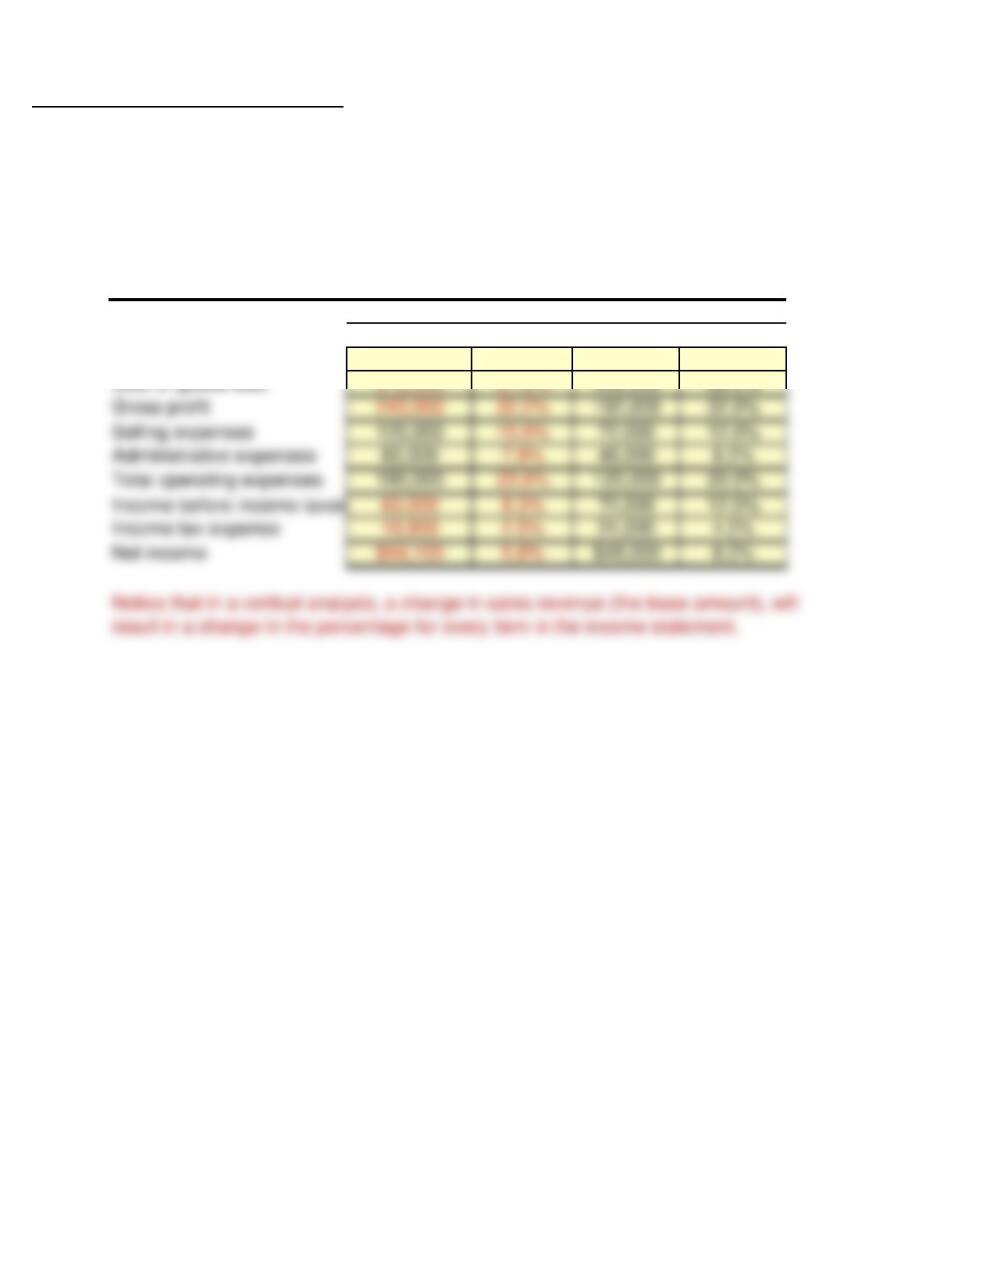
E13-4 solution
Amount Percent Amount Percent
Sales Revenue $800,000 100.0% $600,000 100.0%
Cost of goods sold
520,000 65.0% 408,000 68.0%
JOSHUA CORPORATION
Condensed Income Statement
For the Years Ended December 31
2017
2016
E13-4 Solution to additional question
1. Assume that sales revenue in 2017 changed to $755,00 and cost of goods changed to $512,000.
Income tax rate is 30%. Show the impact of these changes on the vertical analysis of the income
statement.
Amount Percent Amount Percent
Sales Revenue $755,000 100.0% $600,000 100.0%
Cost of goods sold 512,000 67.8% 408,000 68.0%
JOSHUA CORPORATION
Condensed Income Statement
For the Years Ended December 31
2017
2016
Total operating expenses 180,000 23.8% 120,000 20.0%
Income tax expense 18,900 2.5% 24,000 4.0%
P13-3A Perform ratio analysis, and discuss change in financial position and operating results
Condensed balance sheet and income statement data for Jergan Corporation are presented here.
2017 2016 2015
Cash $30,000 $20,000 $18,000
Accounts receivable (net) 50,000 45,000 48,000
Other current assets 90,000 95,000 64,000
Investments 55,000 70,000 45,000
Plant and equipment (net) 500,000 370,000 358,000
$725,000 $600,000 $533,000
Current liabilities $85,000 $80,000 $70,000
Long-term debt 145,000 85,000 50,000
Common stock, $10 par 320,000 310,000 300,000
Retained Earnings 175,000 125,000 113,000
$725,000 $600,000 $533,000
2017 2016
Sales revenue $740,000 $600,000
Less: Sales return and allowances 40,000 30,000
Net sales 700,000 570,000
Cost of goods sold 425,000 350,000
Gross profit 275,000 220,000
Operating expenses (including income taxes) 180,000 150,000
Net income 95,000 70,000
Additional information:
1. The market price of Jergan’s common stock was $7.00, $7.50, and $8.50 for 2012,
2016, and 2017, respectively.
2. You must compute dividends paid. All dividends were paid in cash.
Instructions
(a) Compute the following ratios for 2016 and 2017.
(1) Profit margin. 5. Price-earnings ratio.
(2) Gross profit rate. 6. Payout ratio.
(3) Asset turnover. 7. Debt to assets ratio.
(4) Earnings per share.
(b) Based on the ratios calculated, discuss briefly the improvement or lack thereof in the
financial position and operating results from 2016 to 2017 of Jergan Corporation.
NOTE: Enter a number in cells requesting a value; enter either a number or a formula in cells with a “?” .
(a)(1) Profit margin
2017 2016
Net income Value Value
Net sales Value Value
Profit margin ? ?
For the Year Ended December 31
JERGAN CORPORATION
Balance Sheet
December 31
JERGAN CORPORATION
Income Statement
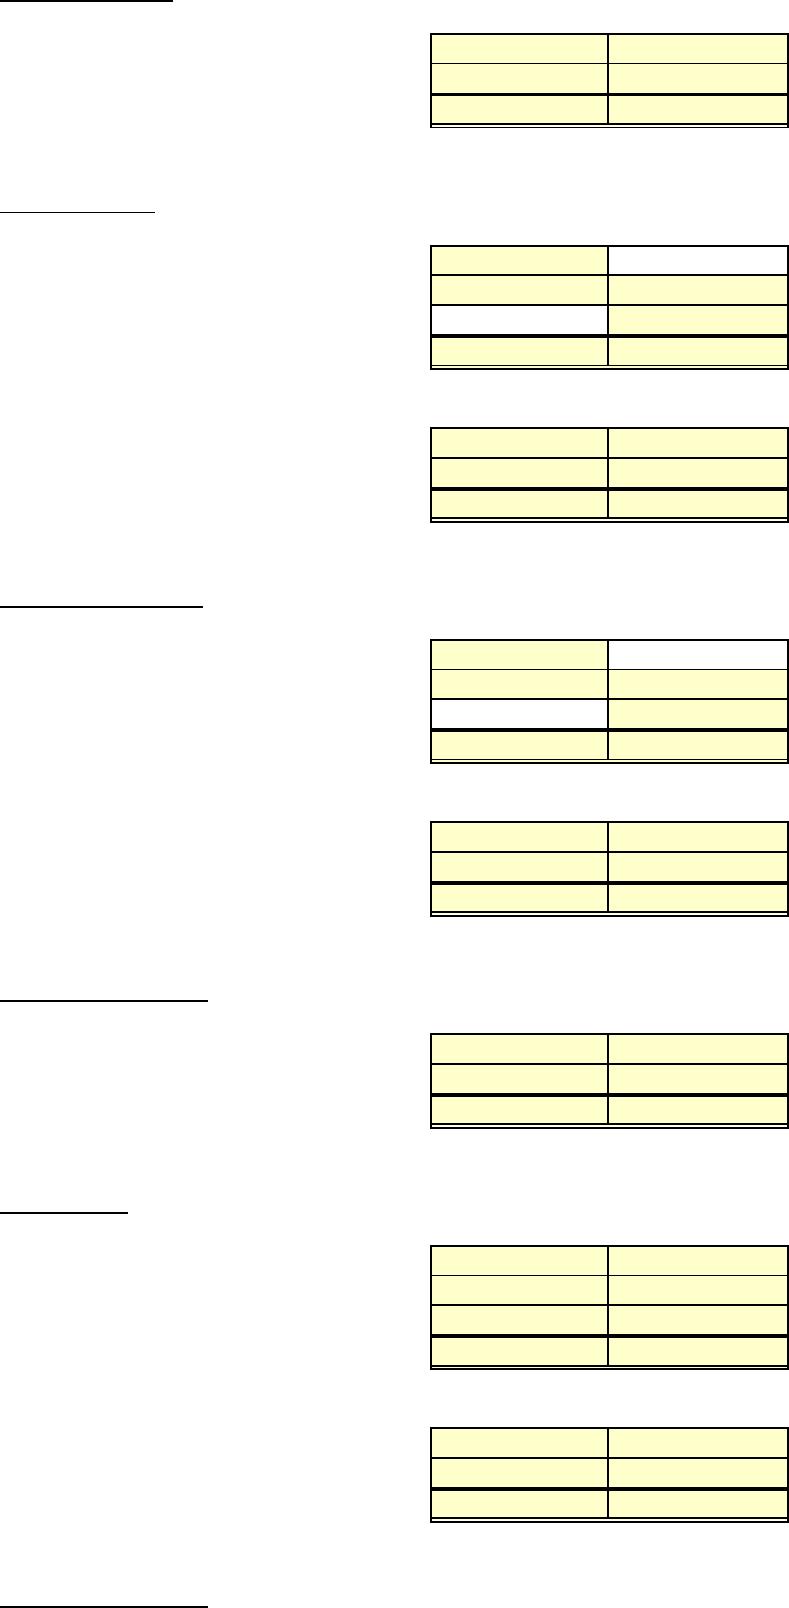
(a)(2) Gross profit rate
2017 2016
Gross profit Value Value
Net sales Value Value
Gross profit rate ? ?
(a)(3) Asset turnover
2017 2016
Total assets, 2017 Value
Total assets, 2016 Value Value
Total assets, 2015 Value
Average total assets ? ?
2017 2016
Net sales Value Value
Average total assets Value Value
Asset turnover ? ?
(a)(4) Earnings per share
2017 2016
Common shares outstanding, 2017 Value
Common shares outstanding, 2016 Value Value
Common shares outstanding, 2015 Value
Average common shares outstanding ? ?
2017 2016
Net income – Pfd. Dividends Value Value
Average common shares outstanding Value Value
Earnings per share ? ?
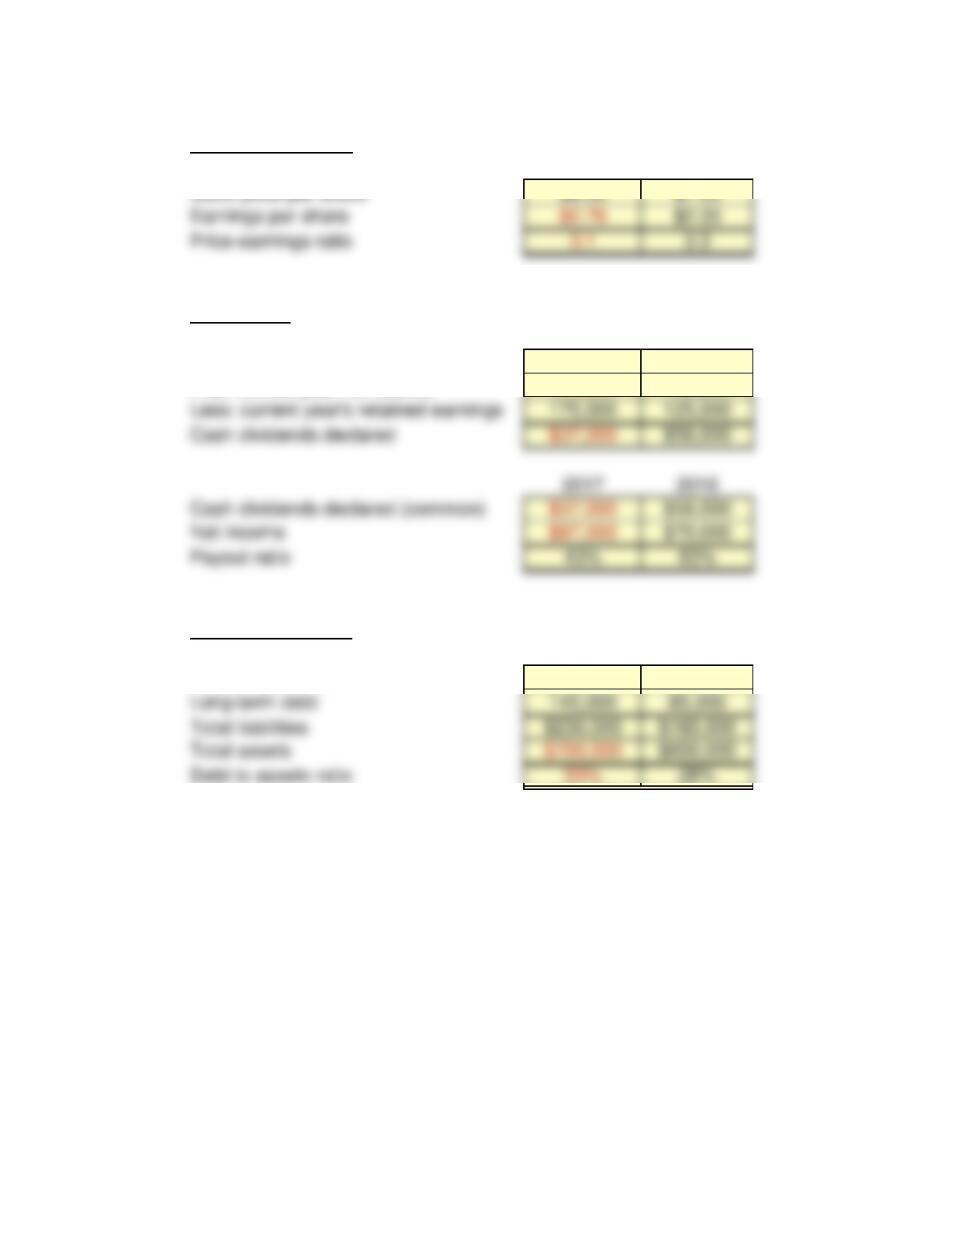
(a)(5) Price-earnings ratio
2017 2016
Stock price per share Value Value
Earnings per share Value Value
Price-earnings ratio ? ?
(a)(6) Payout ratio
2017 2016
Prior year’s retained earnings Value Value
Plus: current year net income Value Value
Less: current year’s retained earnings Value Value
Cash dividends declared ? ?
2017 2016
Cash dividends declared (common) Value Value
Net income Value Value
Payout ratio ? ?
(a)(7) Debt to assets ratio
2017 2016
Current Liabilities Value Value
Long-term debt Value Value
Total liabilities ? ?
Total assets Value Value
Debt to assets ratio ? ?
After you have completed P13-3A, consider the additional question.
1. Assume that 2017 net income and total assets changed to $87,000 and total assets to
$700,000. Show the impact of these changes on the ratios.
P13-3A Solution
(a)(1) Profit margin
2017 2016
Net income $95,000 $70,000
(a)(2) Gross profit rate
2017 2016
Gross profit $275,000 $220,000
(a)(3) Asset turnover
2017 2016
Total assets, 2017 $725,000
(a)(4) Earnings per share
2017 2016
Common shares outstanding, 2017 32000
Common shares outstanding, 2016 31000 31000
(a)(5) Price-earnings ratio
2017 2016
Stock price per share $8.50 $7.50
(a)(6) Payout ratio
2017 2016
Prior year’s retained earnings $125,000 $113,000
Plus: current year net income 95,000 70,000
Less: current year’s retained earnings 175,000 125,000
Cash dividends declared $45,000 $58,000
Net income $95,000 $70,000
(a)(7) Debt to assets ratio
2017 2016
Current Liabilities $85,000 $80,000
Long-term debt 145,000 85,000
Total assets $725,000 $600,000
Debt to assets ratio 32% 28%
was a wise move.
Price-earnings ratio 2.8 3.3
1. Assume that 2017 net income and total assets changed to $87,000 and total assets to
$700,000. Show the impact of these changes on the ratios.
(a)(1) Profit margin
2017 2016
Net income $87,000 $70,000
(a)(2) Gross profit rate
2017 2016
Gross profit $275,000 $220,000
(a)(3) Asset turnover
2017 2016
Total assets, 2017 $700,000
Total assets, 2016 $600,000 $600,000
(a)(4) Earnings per share
2017 2016
Common shares outstanding, 2017 32,000
Common shares outstanding, 2016 31,000 31,000
(a)(5) Price-earnings ratio
2017 2016
(a)(6) Payout ratio
2017 2016
Prior year’s retained earnings $125,000 $113,000
Plus: current year net income 87,000 70,000
(a)(7) Debt to assets ratio
2017 2016
Current Liabilities $85,000 $80,000