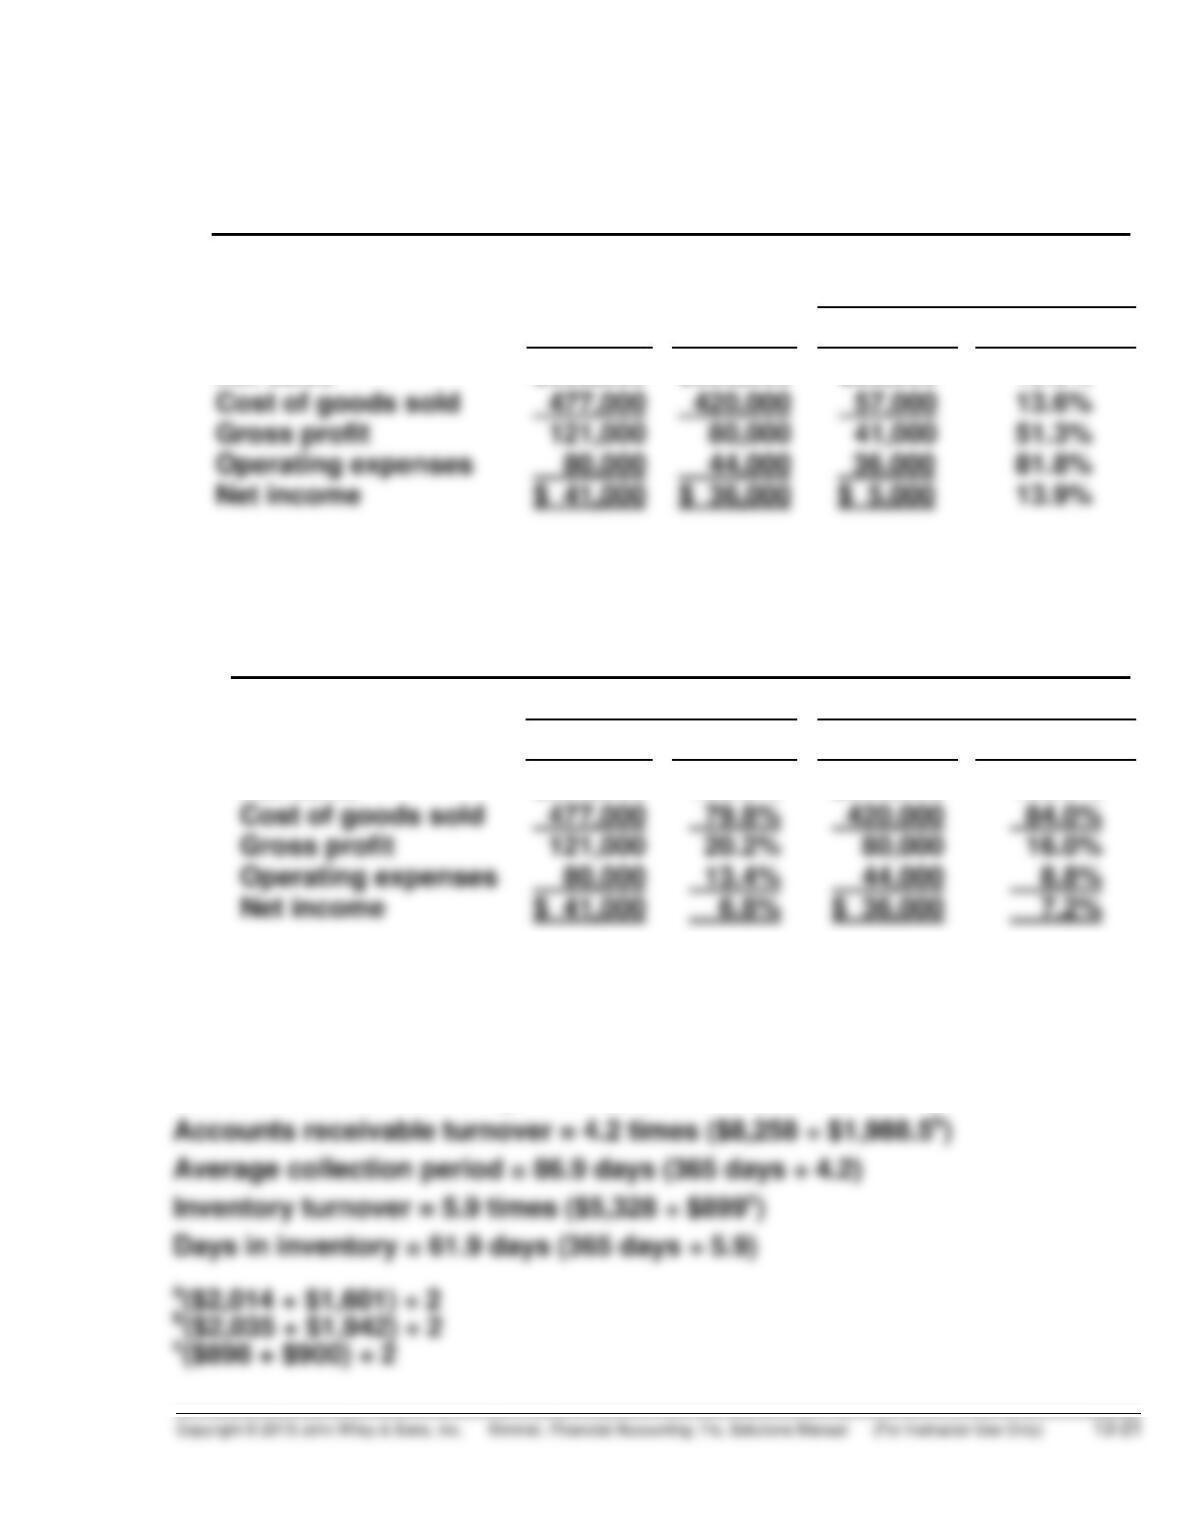
EXERCISE 13-6
(a) EUDALEY CORPORATION
Condensed Income Statement
For the Years Ended December 31
Increase or (Decrease)
During 2014
2014 2013 Amount Percentage
Net sales
$598,000
$500,000
$98,000
19.6%
(b) EUDALEY CORPORATION
Condensed Income Statements
For the Years Ended December 31
2014 2013
$ Percent $ Percent
Net sales
$598,000
100.0%
$500,000
100.0%
EXERCISE 13-7
Current ratio = 2.01:1 ($4,054 ÷ $2,014)
Current cash debt coverage = .69 ($1,251 ÷ $1,807.5a)
EXERCISE 13-8
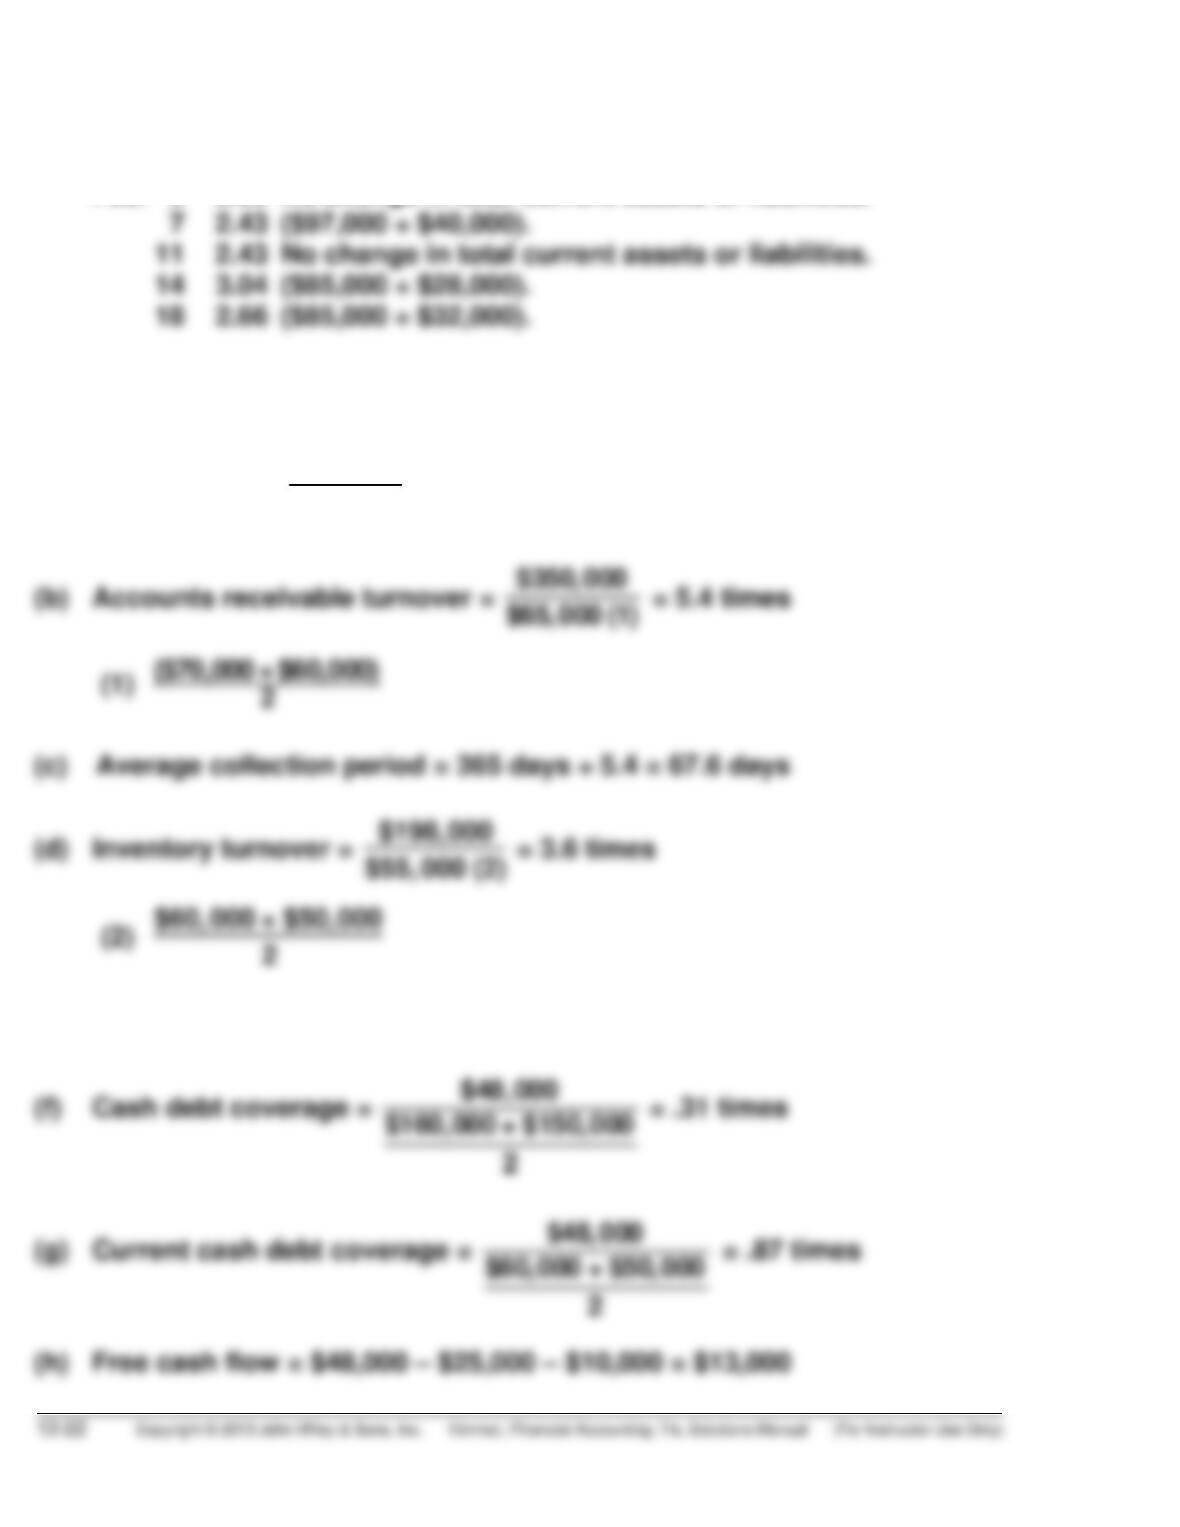
Current ratio as of February 1, 2014 = 3.00:1 ($120,000 ÷ $40,000).
Feb. 3 3.00 No change in total current assets or liabilities.
EXERCISE 13-9
(a) Current ratio = $145, 000
$50, 000 = 2.90:1
(e) Days in inventory = 365 days ÷ 3.6 = 101.4 days
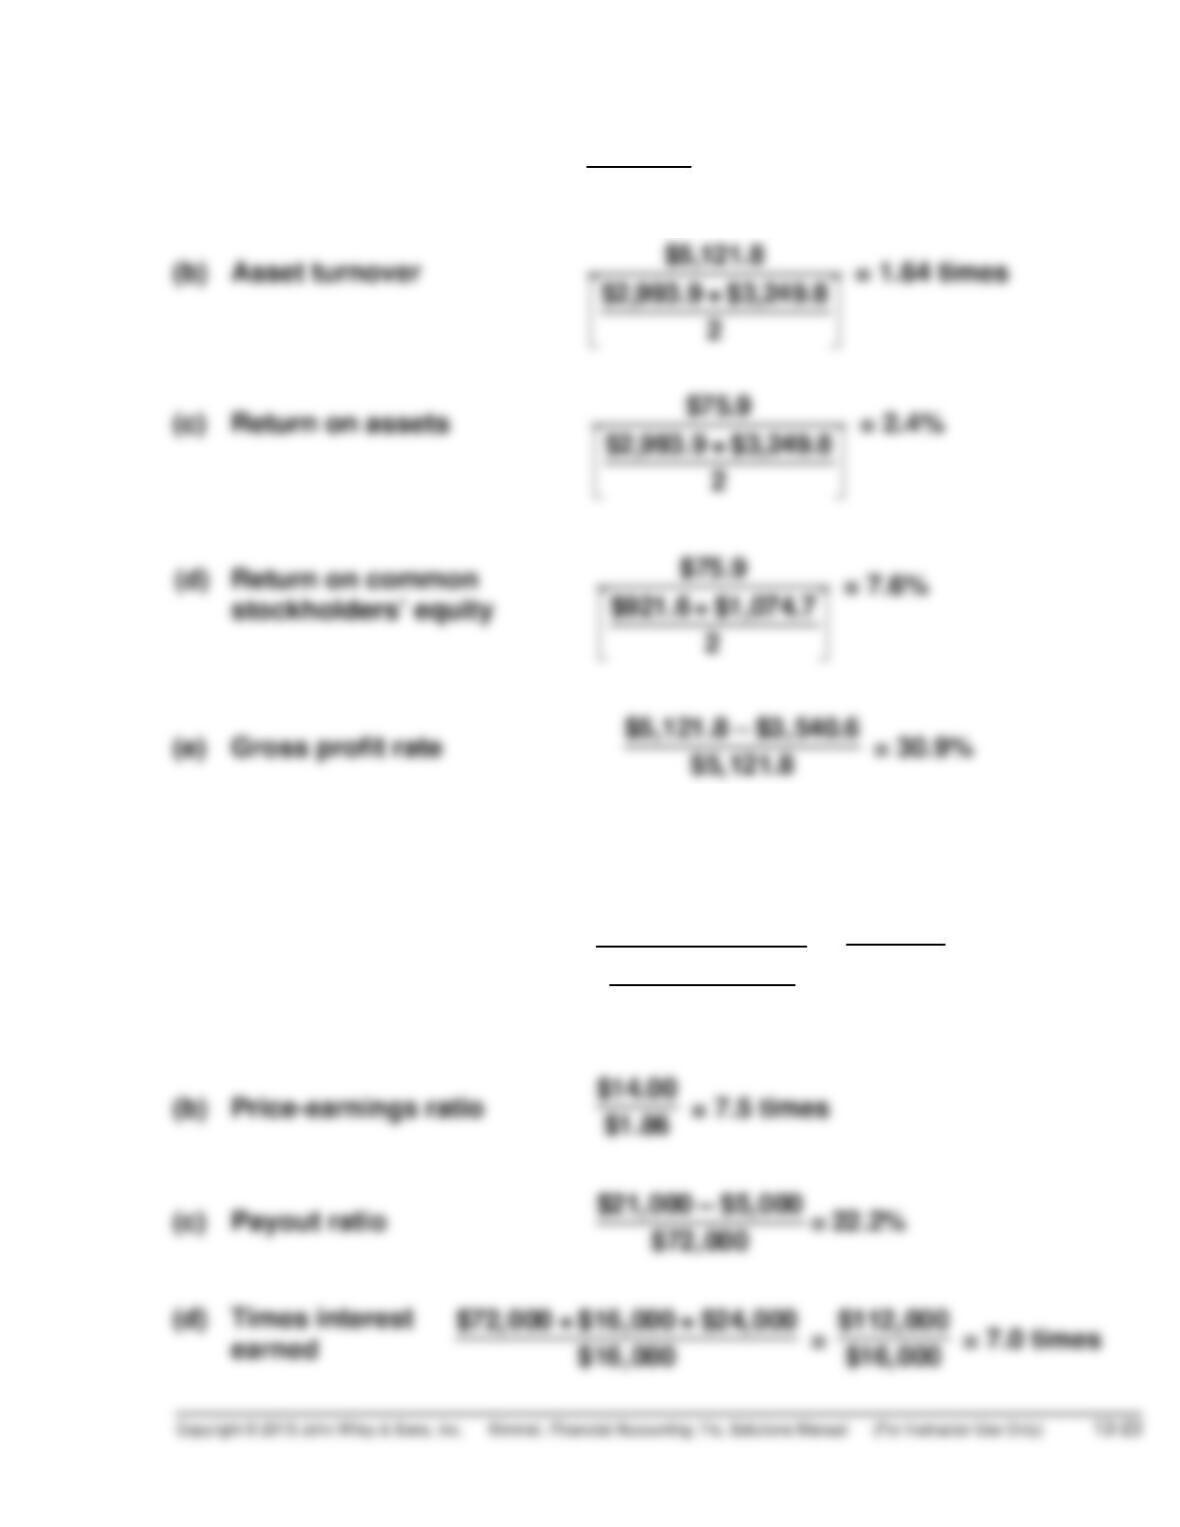
EXERCISE 13-10
(a) Profit margin $75.9
$5,121.8 = 1.5%
EXERCISE 13-11
(a) Earnings per share $72,000 – $5,000
32,000+ 40,000
2
⎡
⎣
⎢⎤
⎦
⎥
= $67, 000
36, 000 = $1.86
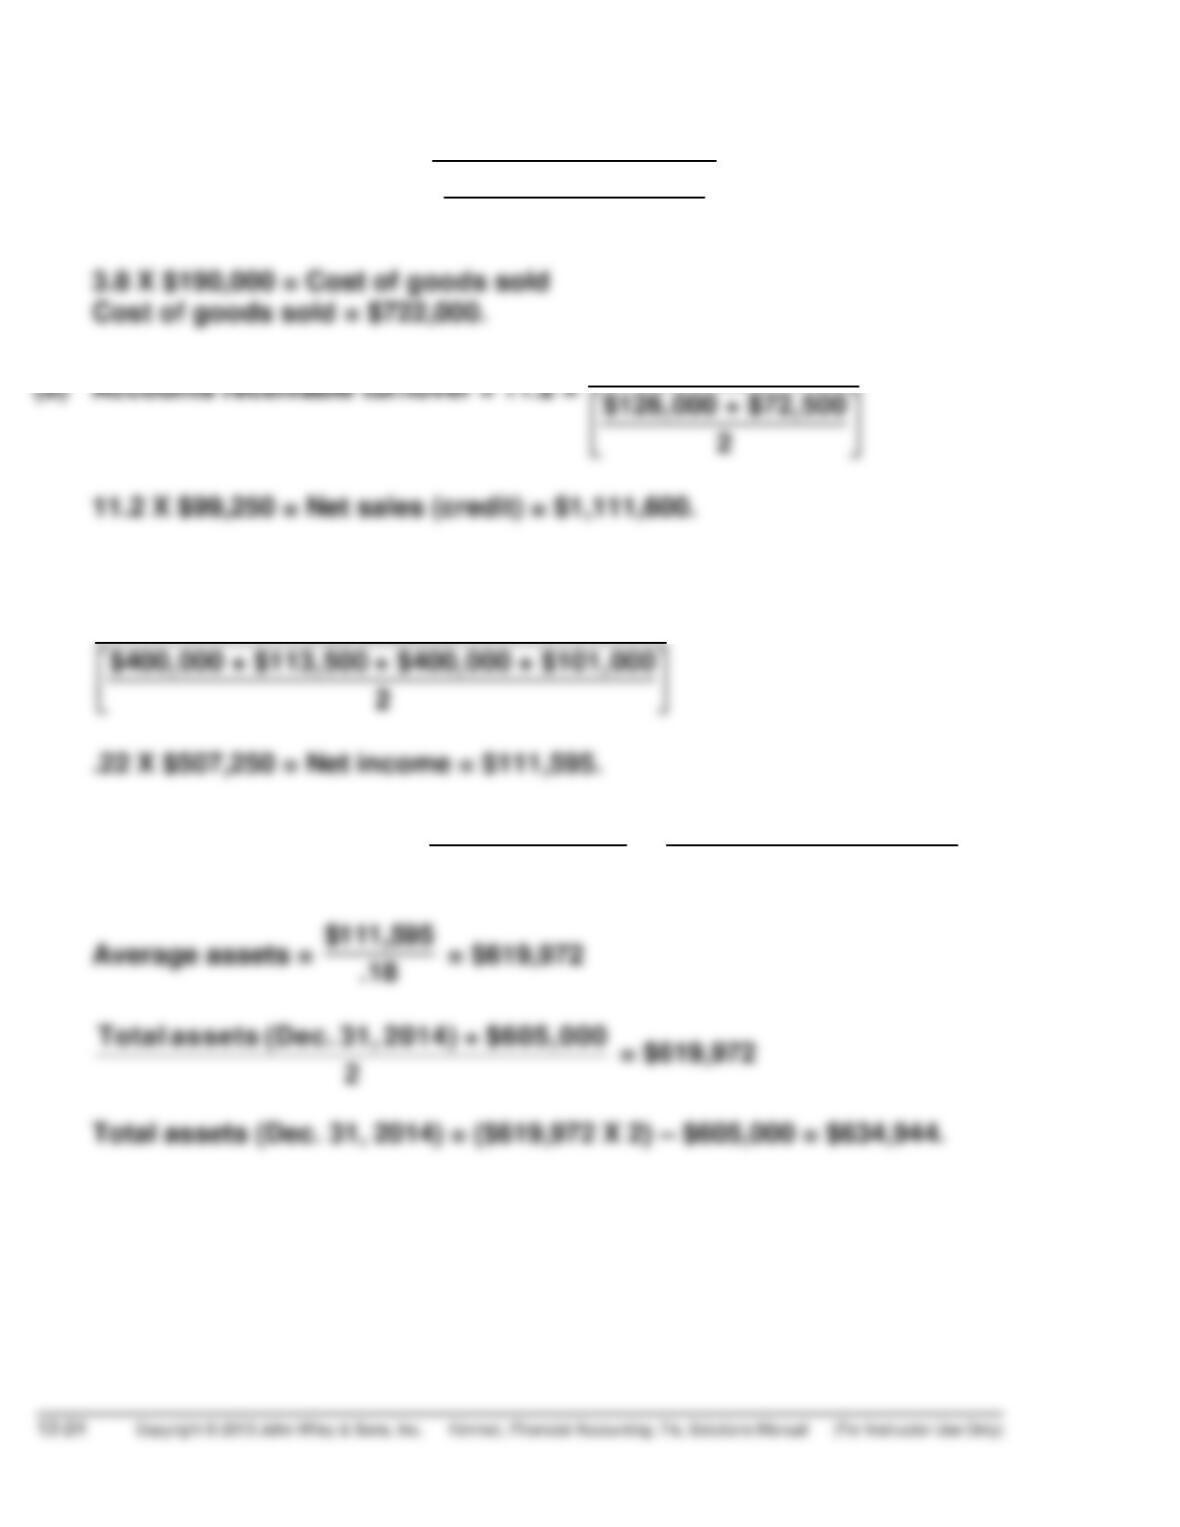
EXERCISE 13-12
(a) Inventory turnover = 3.8 = Cost of goods sold
$200,000 + $180,000
2
⎡
⎣
⎢ ⎤
⎦
⎥
(c) Return on common stockholders’ equity = 22% =
(d) Return on assets = 18% = Net income
Average assets = $111,595 [see (c) above]
Average assets
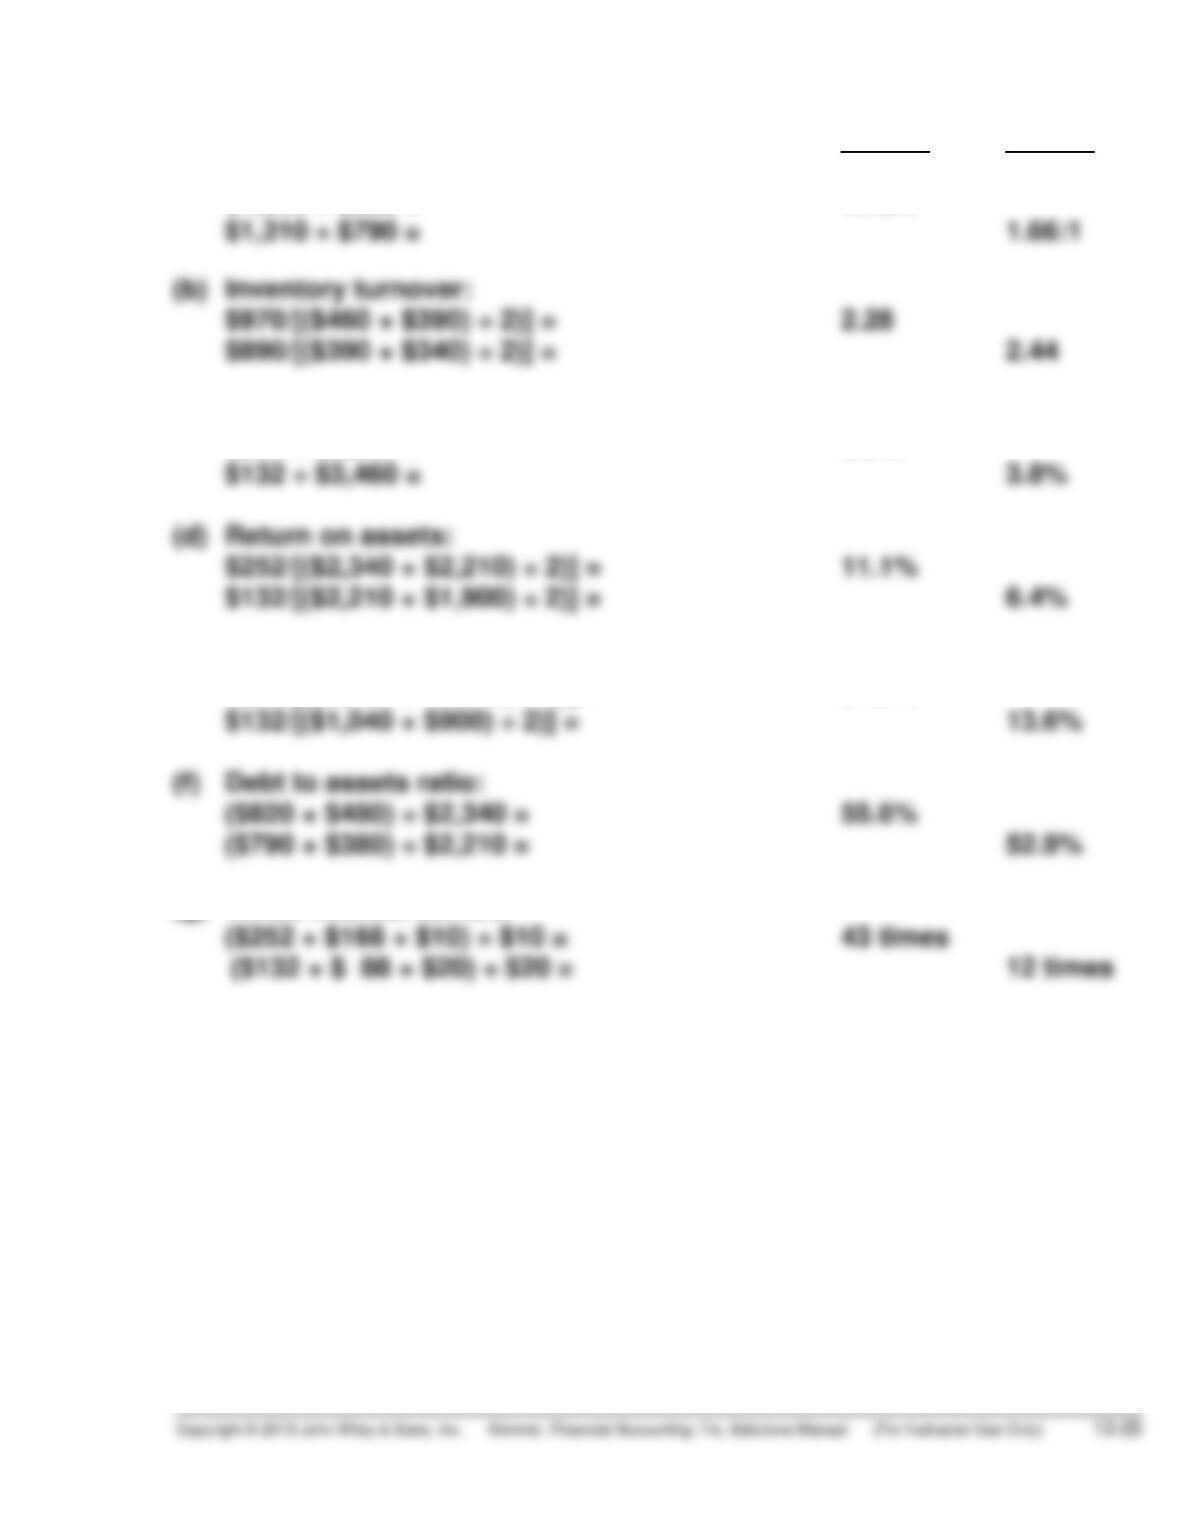
EXERCISE 13-13
2014 2013
(a) Current ratio:
$1,390 ÷ $820 = 1.70:1
(c) Profit margin:
$252 ÷ $3,800 = 6.6%
(e) Return on common stockholders’ equity:
$252/[($1,040 + $1,040) ÷ 2)] = 24.2%
(g) Times interest earned:
SOLUTIONS TO PROBLEMS
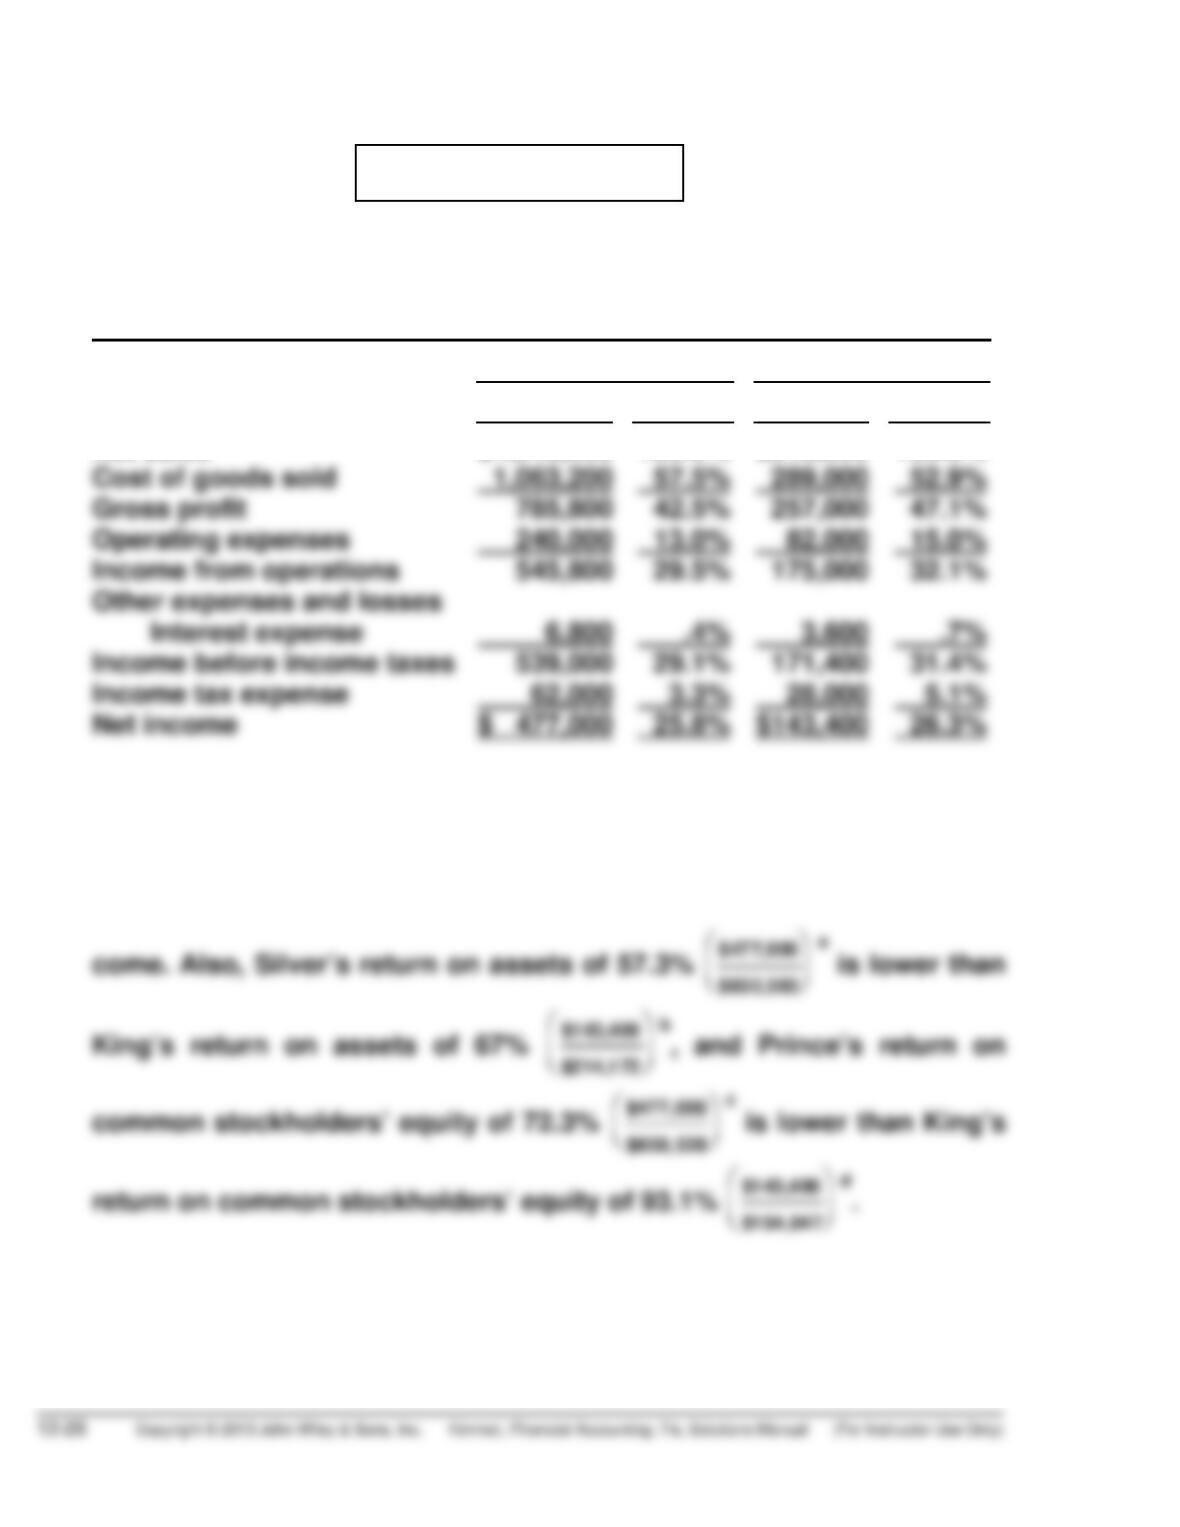
PROBLEM 13-1A
(a) Condensed Income Statement
For the Year Ended December 31, 2014
Prince Company King Company
Dollars Percent Dollars Percent
Net sales
$1,849,000
100.0%
$546,000
100.0%
(b) King Company appears to be more profitable. It has higher relative
gross profit, income from operations, income before taxes, and net in-
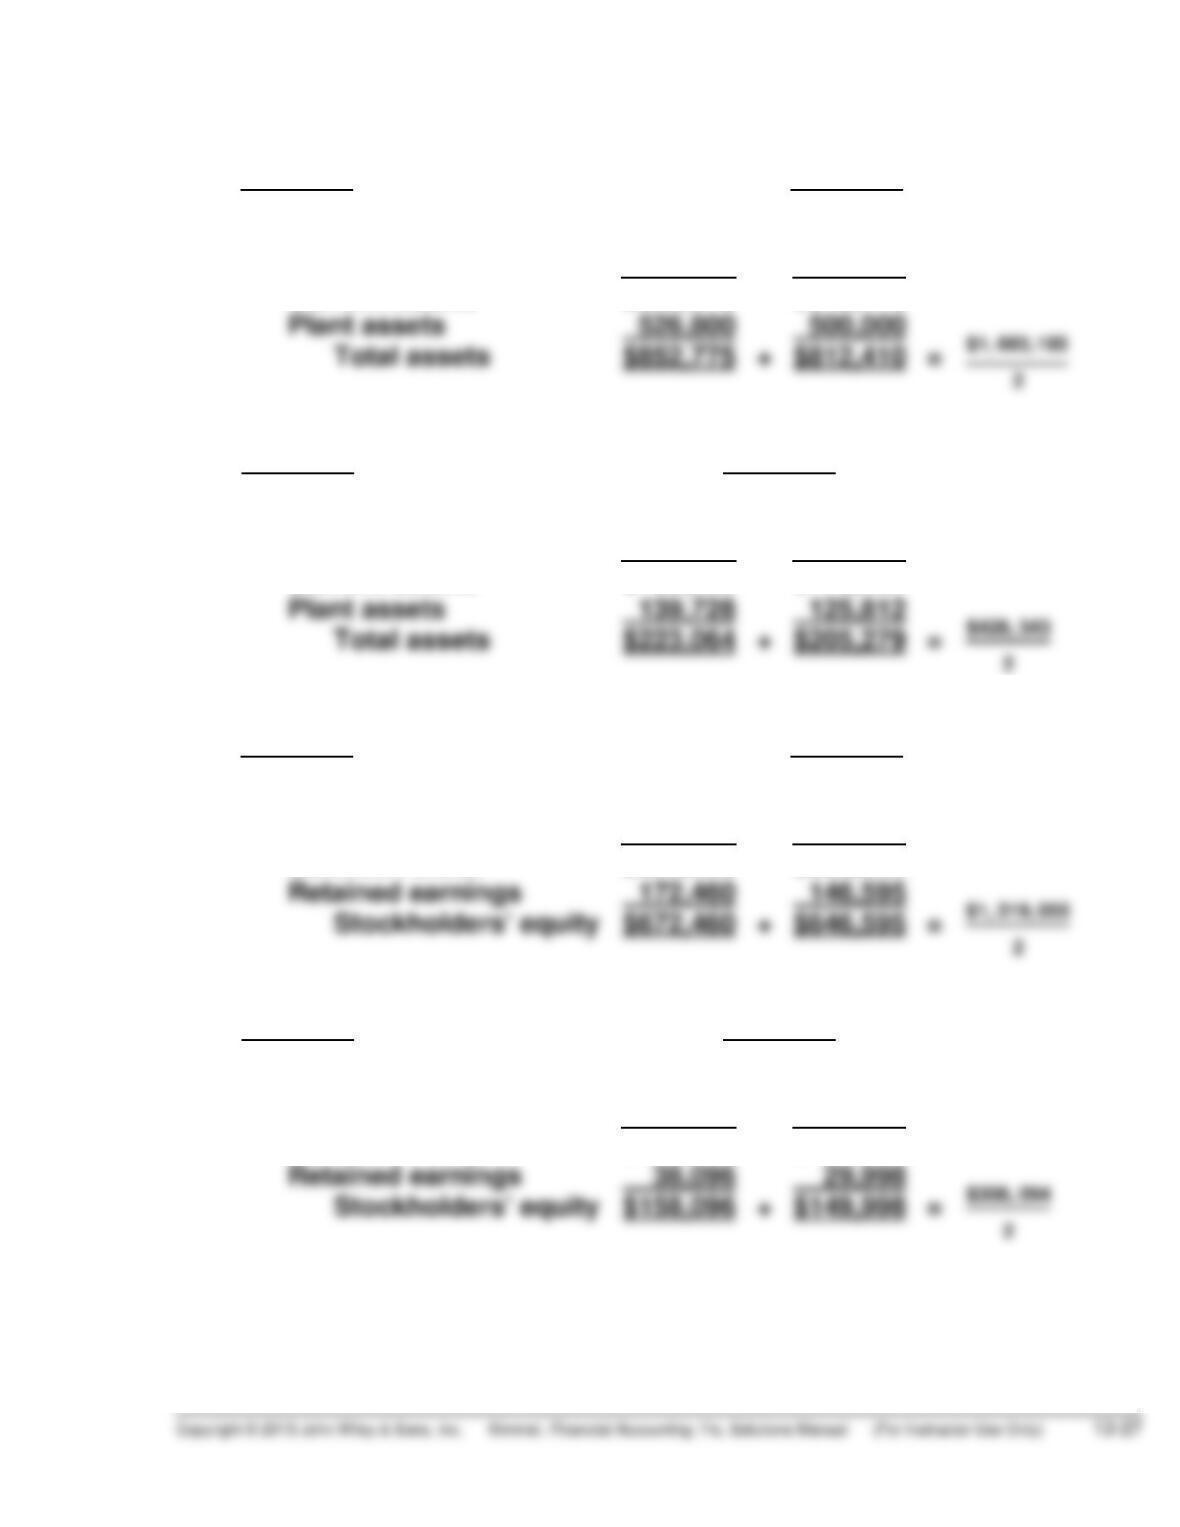
PROBLEM 13-1A (Continued)
a$477,000 is Prince’s 2014 net income. $832,593 is Prince’s 2014
average assets:
2014 2013
Current assets
$325,975
$312,410
b$143,400 is King’s 2014 net income. $214,172 is King’s 2014 average
aassets:
2014 2013
Current assets
$ 83,336
$ 79,467
c$477,000 is Prince’s 2014 net income. $659,528 is Prince’s 2014
average stockholders’ equity:
2014 2013
Common stock
$500,000
$500,000
d$143,400 is King’s 2014 net income. $154,047 is King’s 2014 average
dstockholders’ equity:
2014 2013
Common stock
$120,000
$120,000
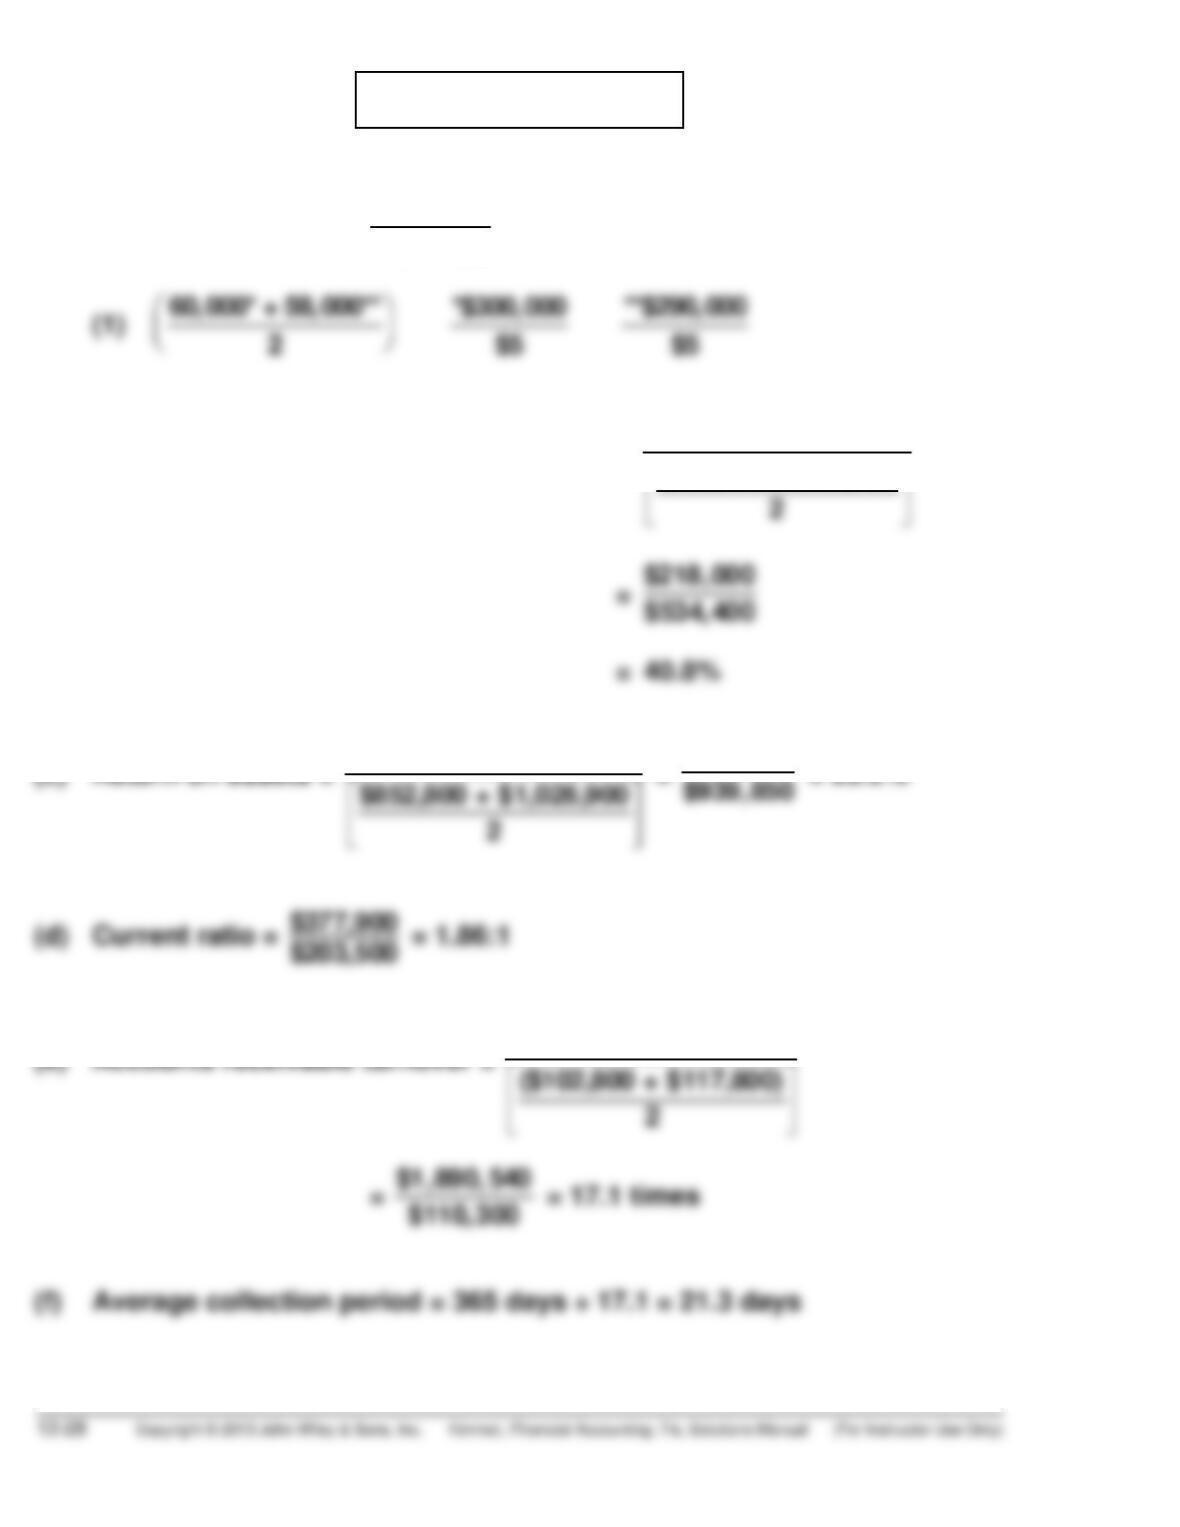
PROBLEM 13-2A
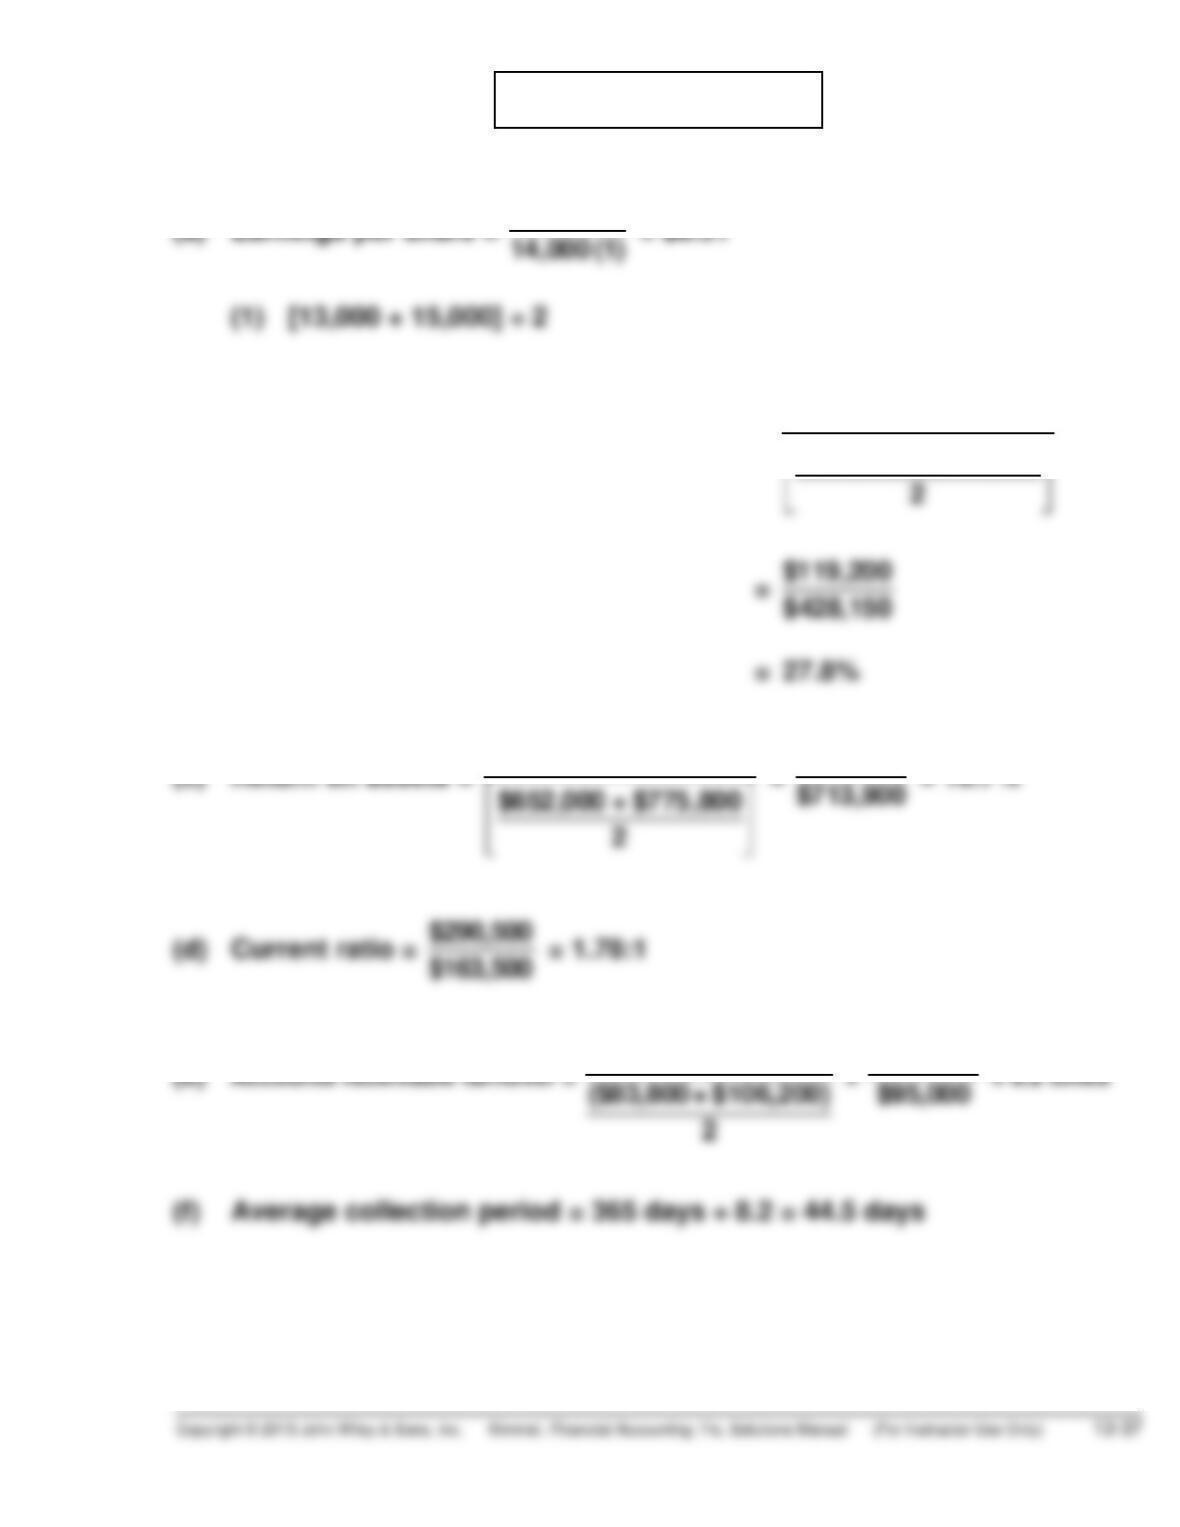
(a) Earnings per share = $218, 000
59, 000 (1) = $3.69
(b) Return on common stockholders’ equity = $218,000
$465,400 + $603,400
⎡
PROBLEM 13-2A (Continued)
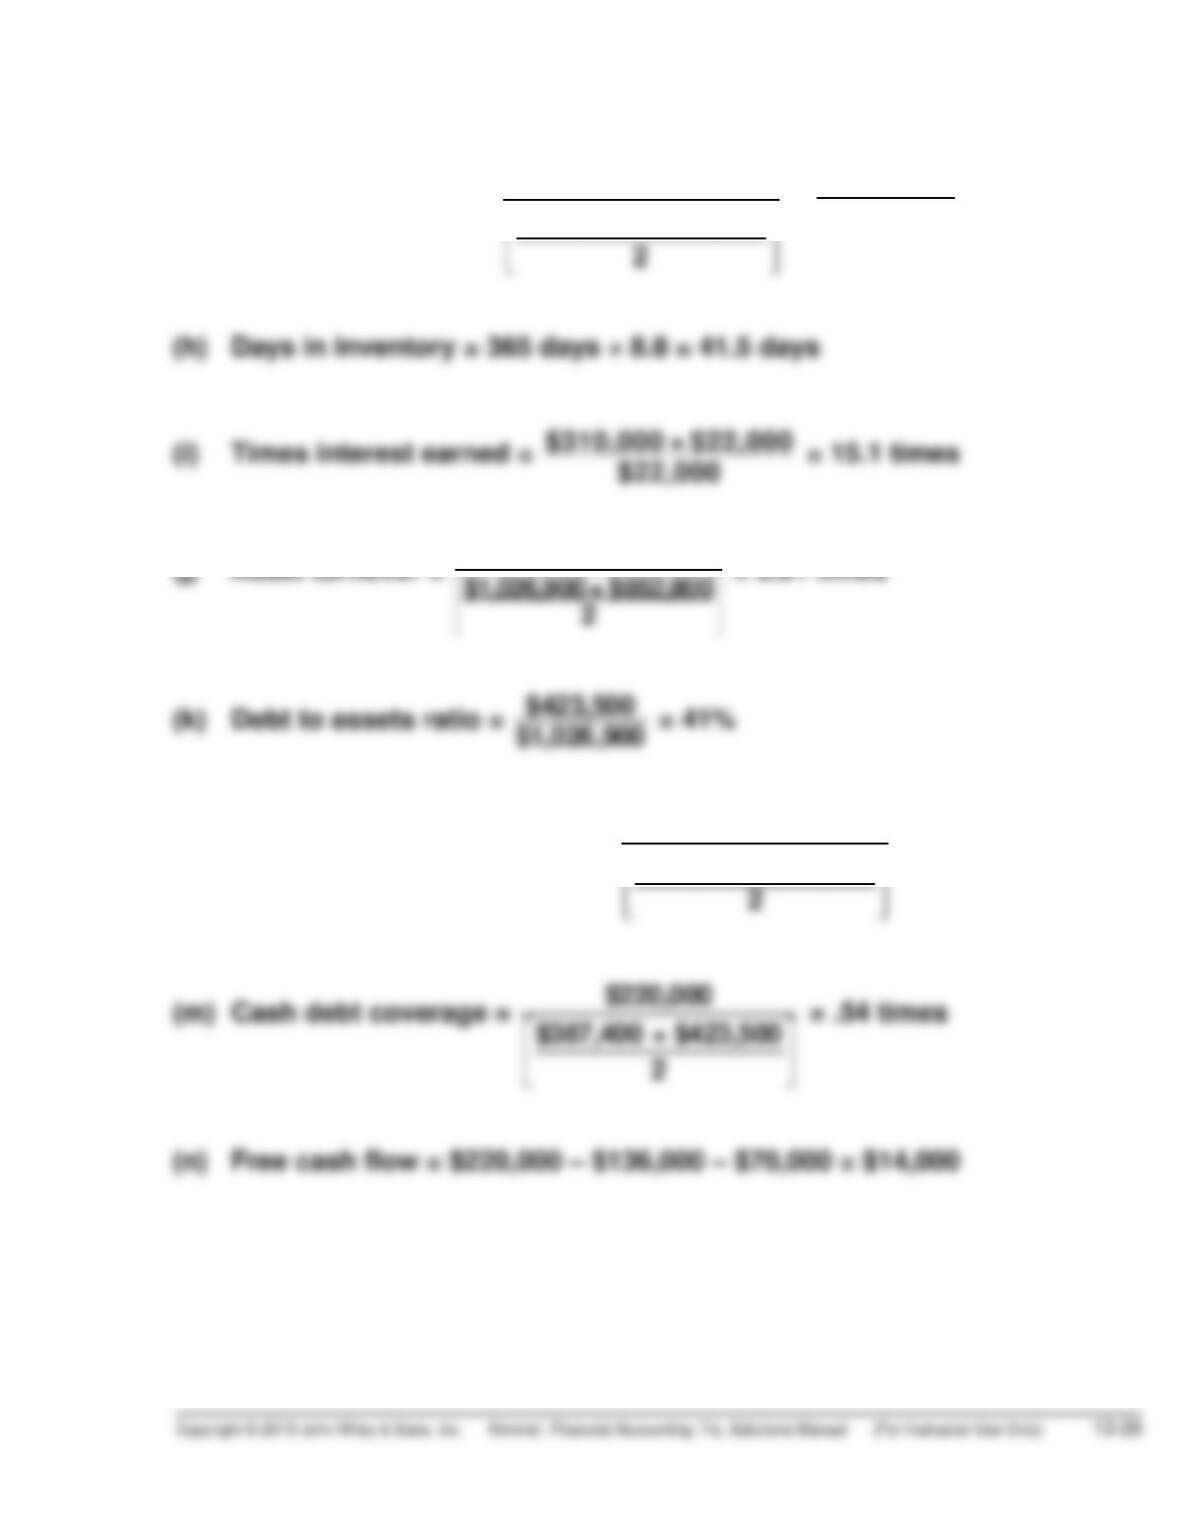
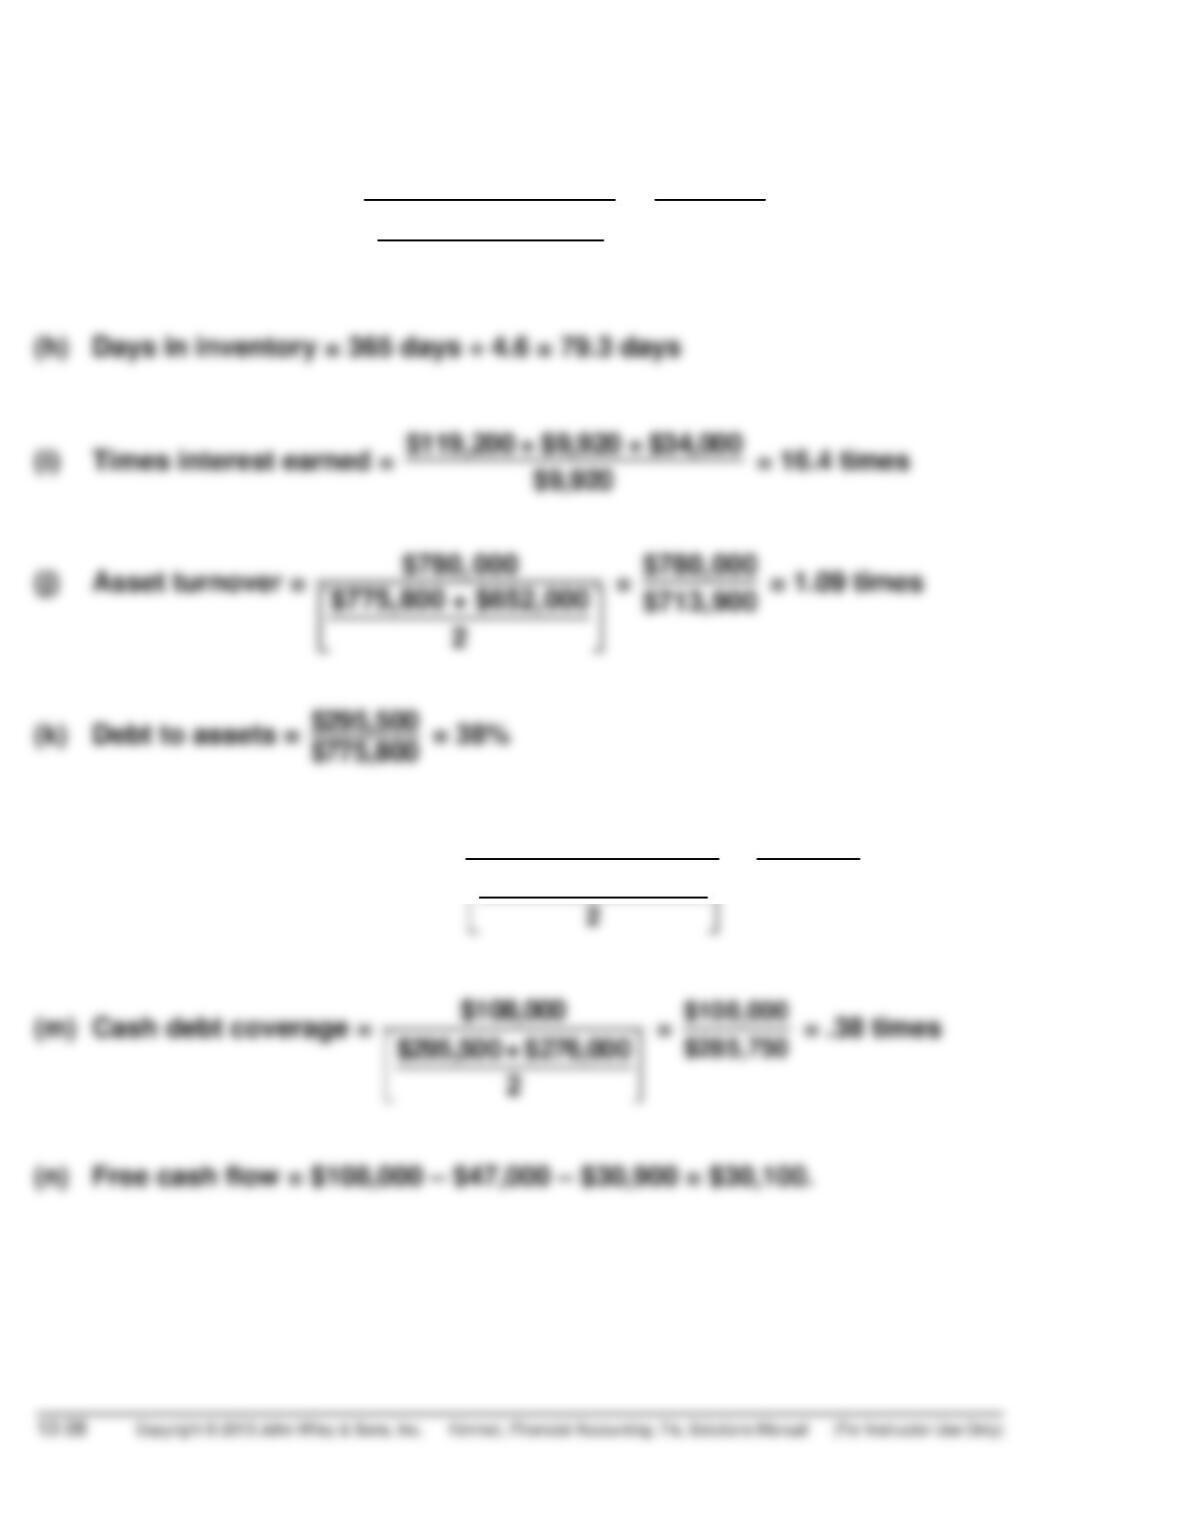
(g) Inventory turnover = $1,058,540
$115,500 + $126,000
⎡
= $1, 058, 540
$120,750 = 8.8 times
(l) Current cash debt coverage = $220,000
$187,400 + $203,500
⎡
= 1.13 times
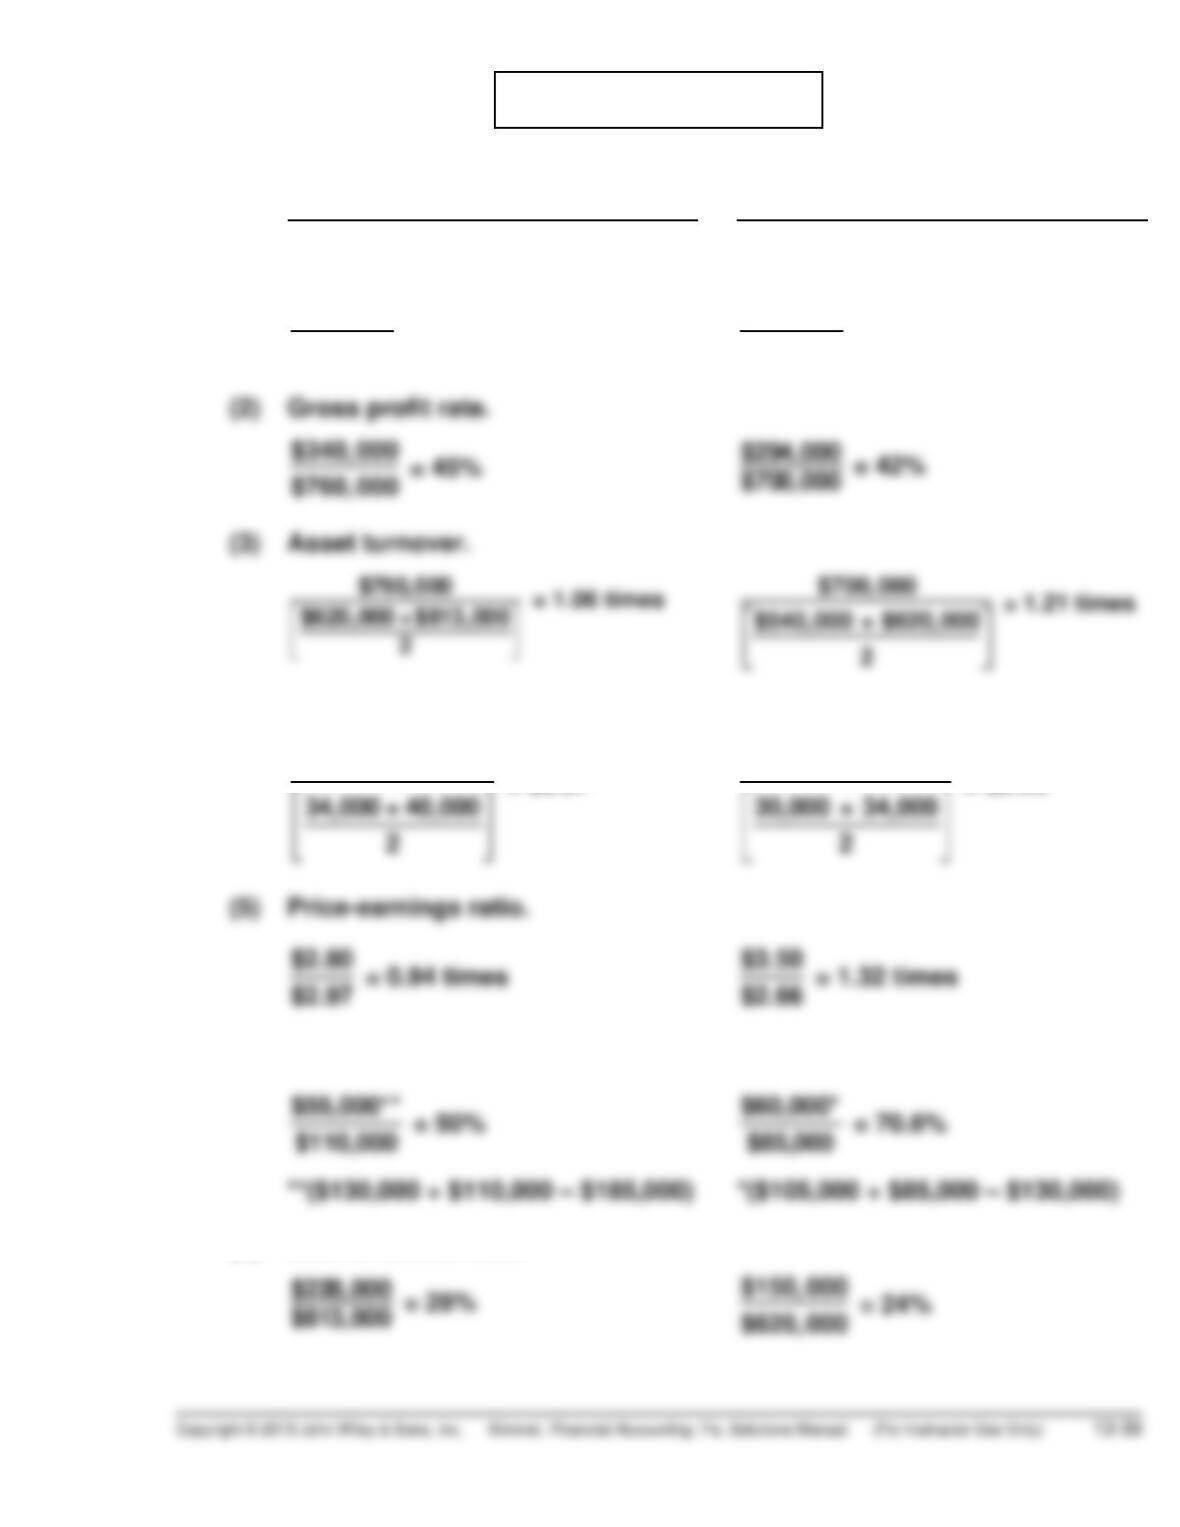
PROBLEM 13-3A
(a) 2014 2013
(1) Profit margin.
(2) Gross profit rate.
(3) Asset turnover.
(4) Earnings per share.
(5) Price-earnings ratio.
(6) Payout ratio.
(7) Debt to assets ratio.
PROBLEM 13-3A (Continued)
(b) The underlying profitability of the corporation appears to have improved.
For example, profit margin and earnings per share have both increased.
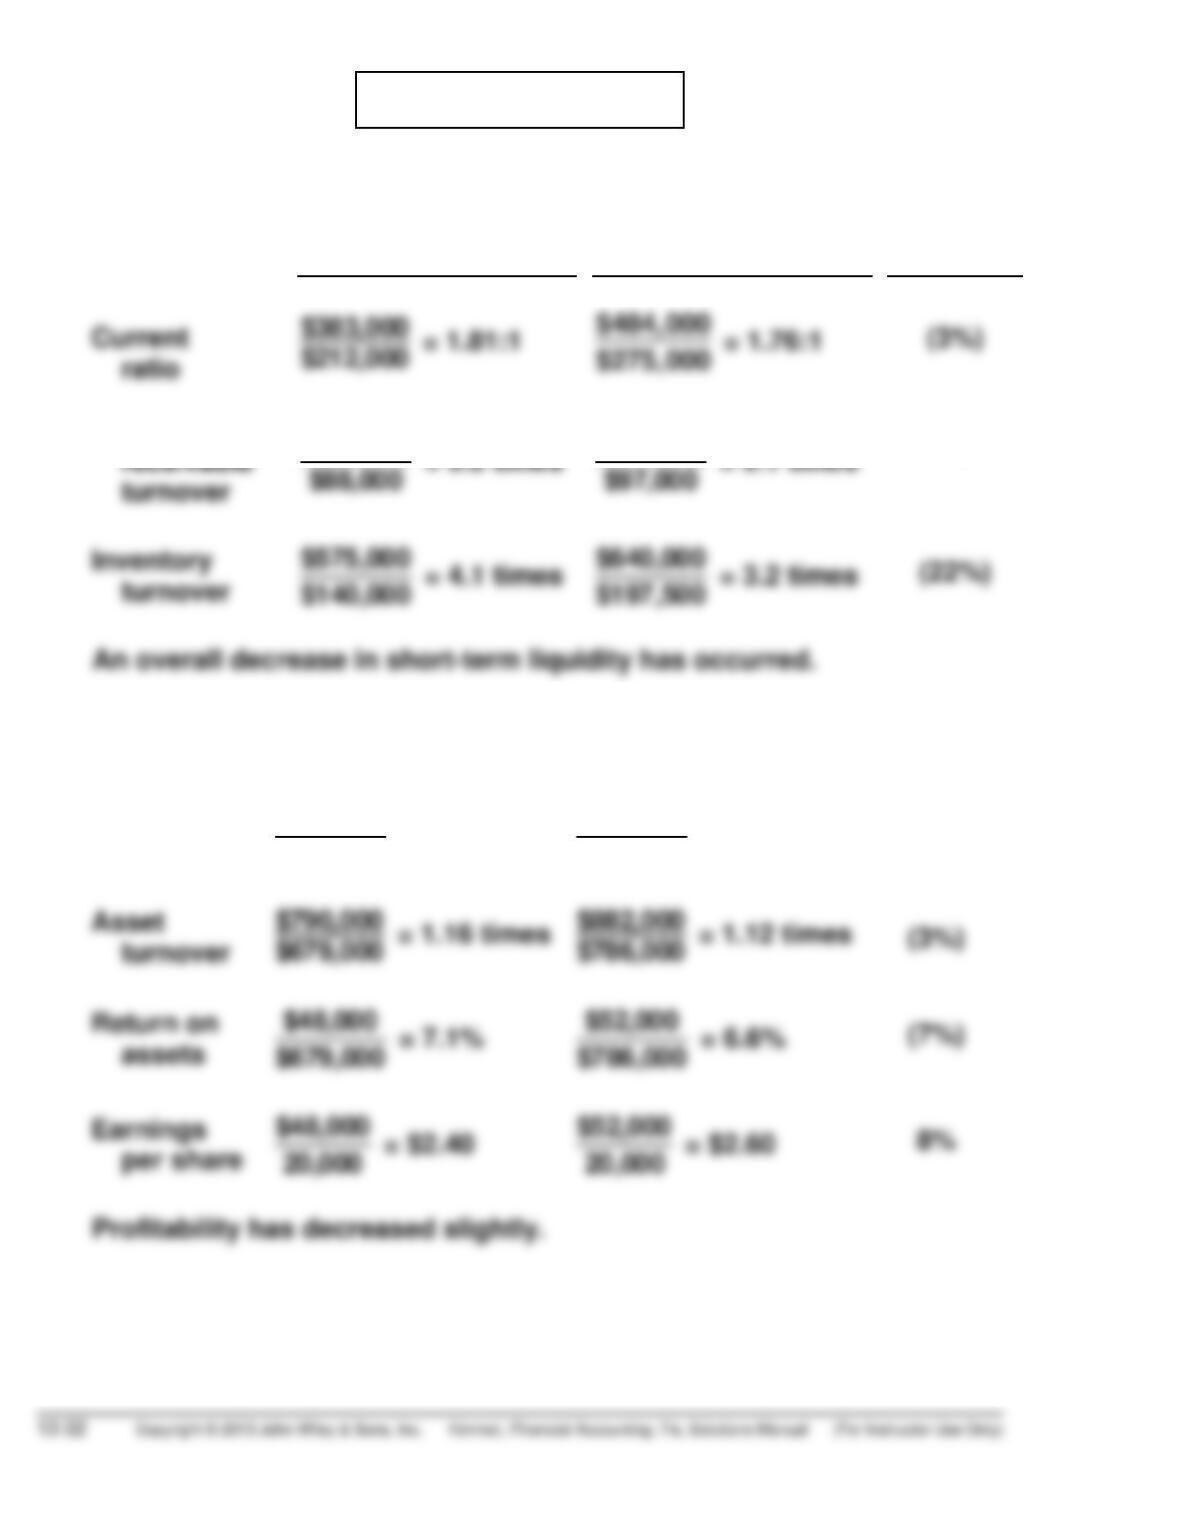
PROBLEM 13-4A
(a) LIQUIDITY
2013 2014 % Change
Accounts
$790,000
1%
PROFITABILITY
Profit
margin
$48,000
$790,000 = 6.1% $52,000
$882,000 = 5.9% (3%)
PROBLEM 13-4A (Continued)
(b) 2014 2015 %Change
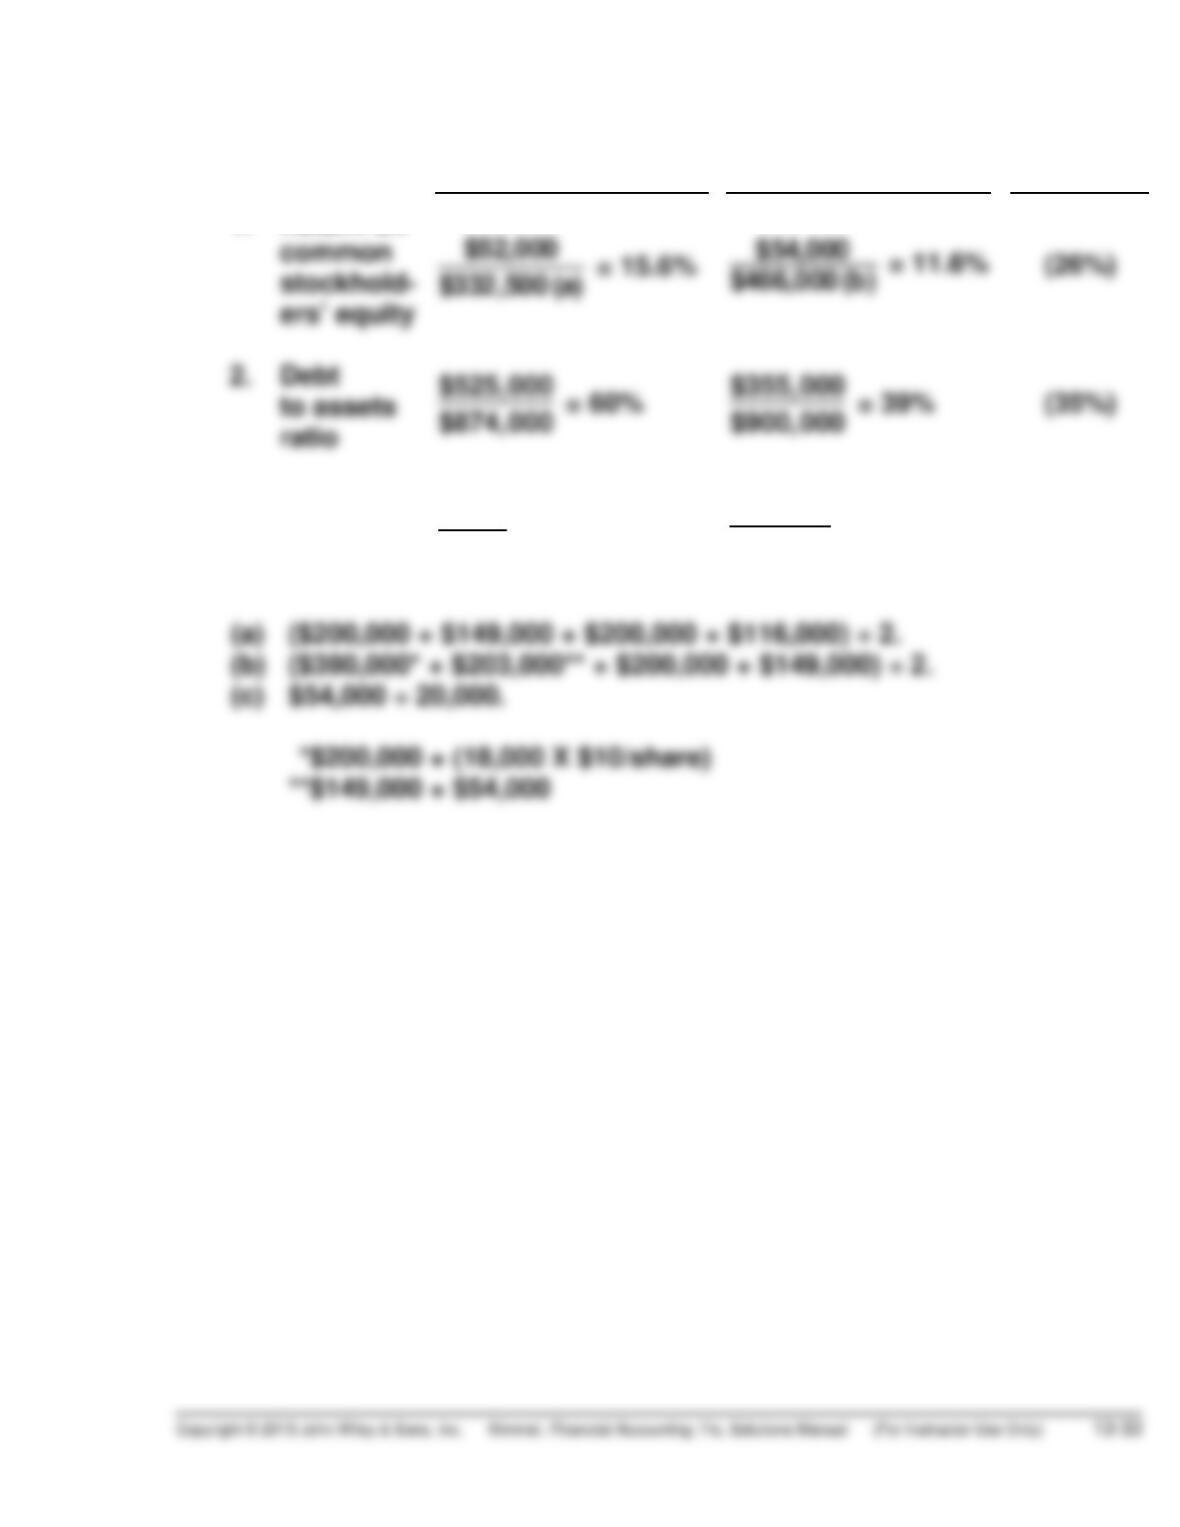
1. Return on
3. Price-
earnings
ratio
$9.00
$2.60 = 3.5 times $12.00
$2.70 (c) = 4.4 times 26%
PROBLEM 13-5A
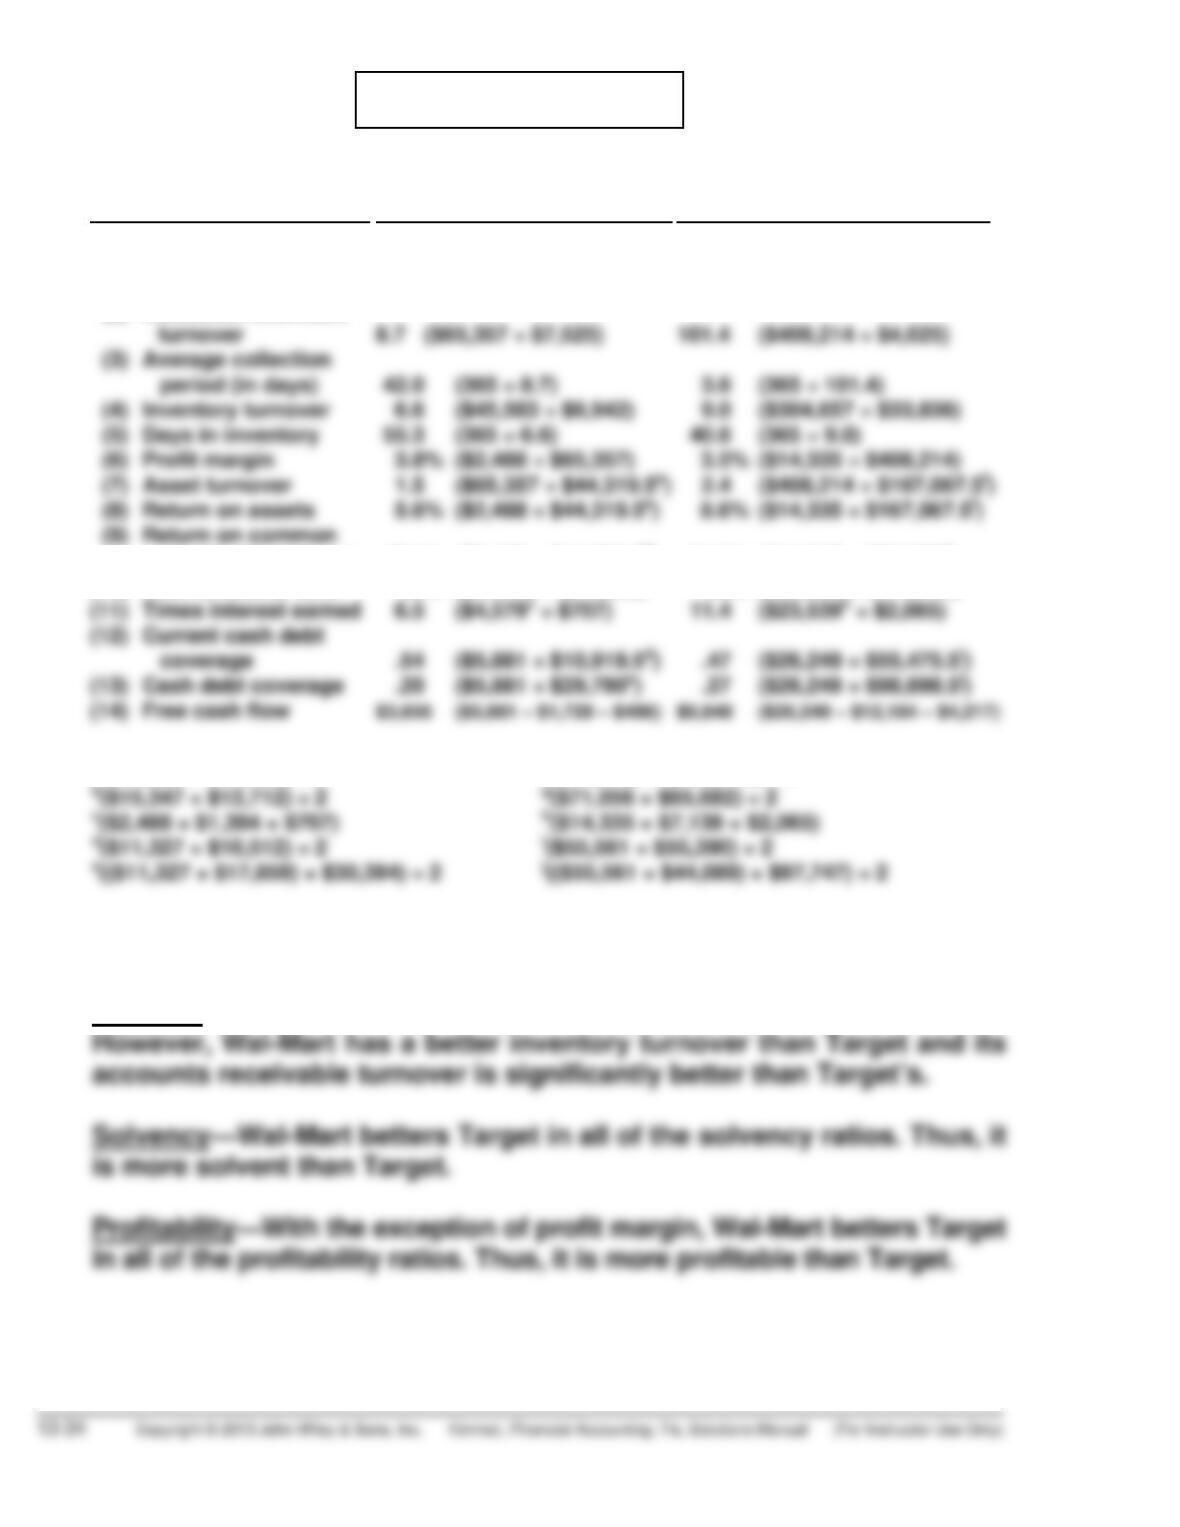
(a) Ratio Target Wal-Mart
(All Dollars Are in Millions)
(1) Current ratio
(2) Accounts receivable
stockholders’ equity
(10) Debt to assets ratio
1.63:1 ($18,424 ÷ $11,327)
17.1 % ($2,488 ÷ $14,529.5b)
66 % ($29,186 ÷ $44,533)
.87:1 ($48,331 ÷ $55,561)
21.0% ($14,335 ÷ $68,369g)
58% ($99,650 ÷ $170,706)
a
($44,533 + $44,106) ÷ 2 f($170,706 + $163,429) ÷ 2
(b) The comparison of the two companies shows the following:
Liquidity—Target’s current ratio of 1.63:1 is better than Wal-Mart’s .87:1.
PROBLEM 13-1B
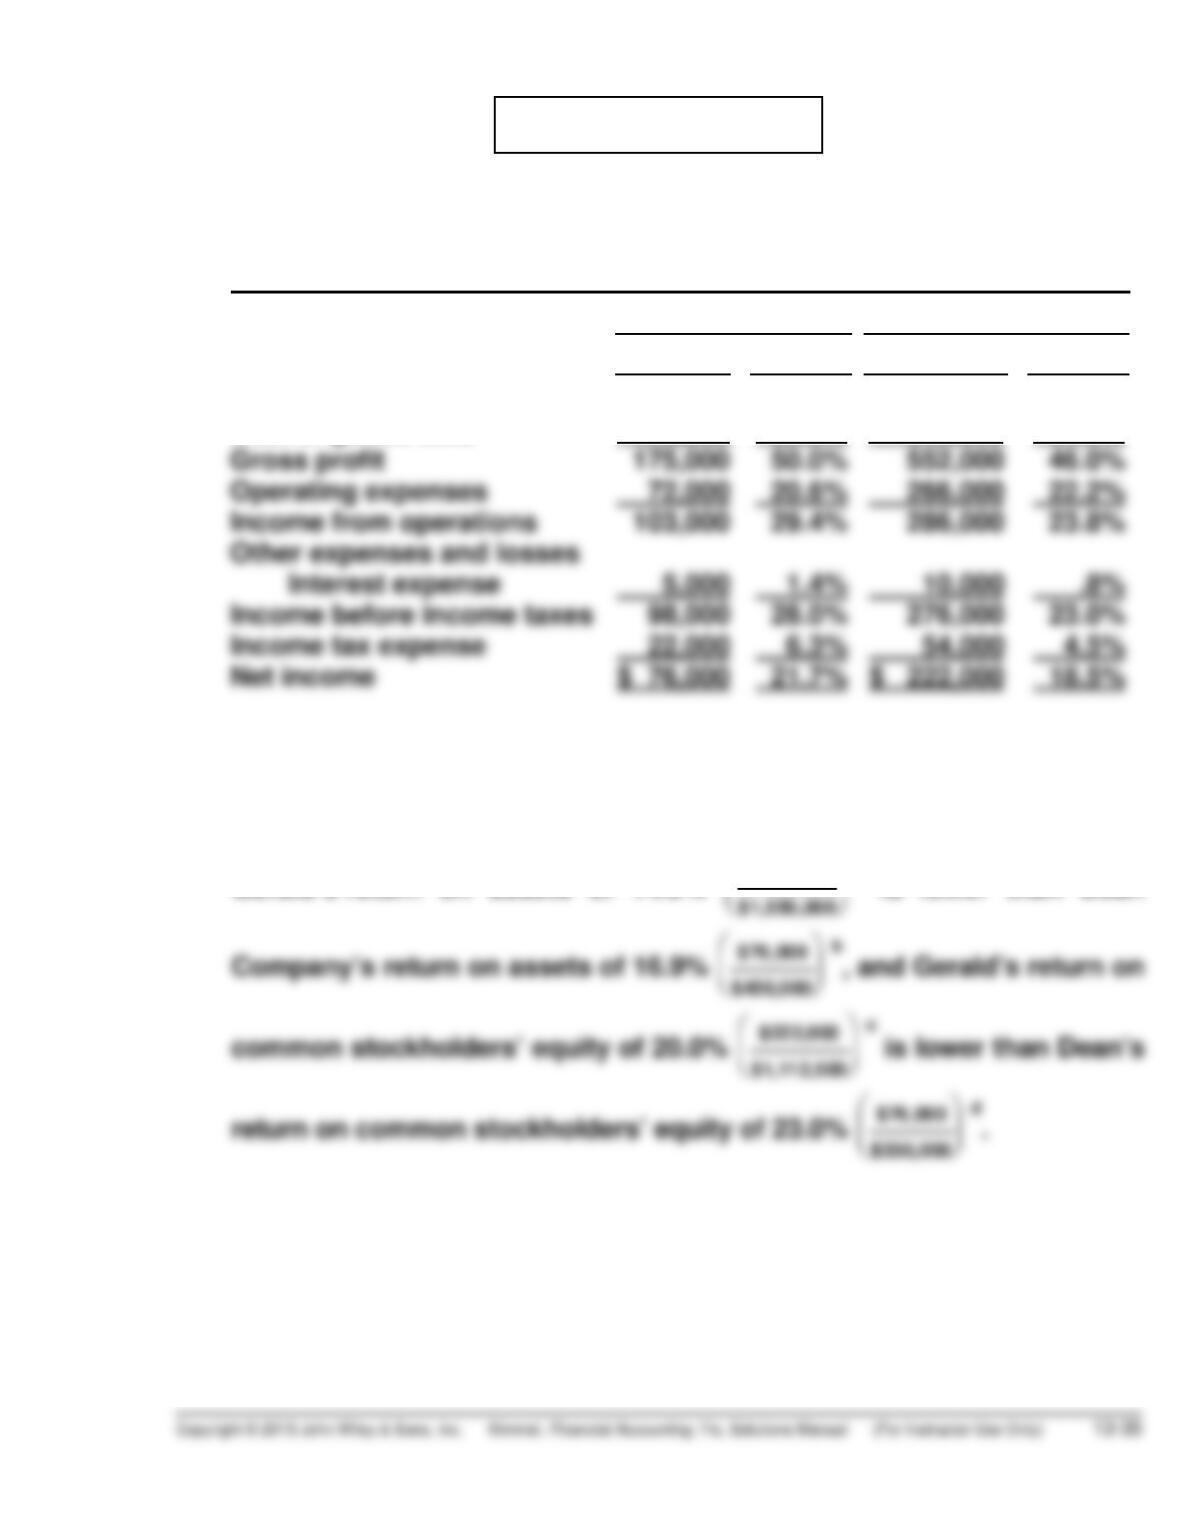
(a) Condensed Income Statement
For the Year Ended December 31, 2014
Dean Company Gerald Company
Dollars Percent Dollars Percent
Net sales
Cost of goods sold
$350,000
175,000
100.0%
50.0%
$1,200,000
648,000
100.0%
54.0%
(b) Dean Company appears to be more profitable. It has higher relative
income from operations, income before taxes, and net income.
Gerald’s return on assets of 14.3% $222,000
⎛
a is lower than Dean
PROBLEM 13-1B (Continued)
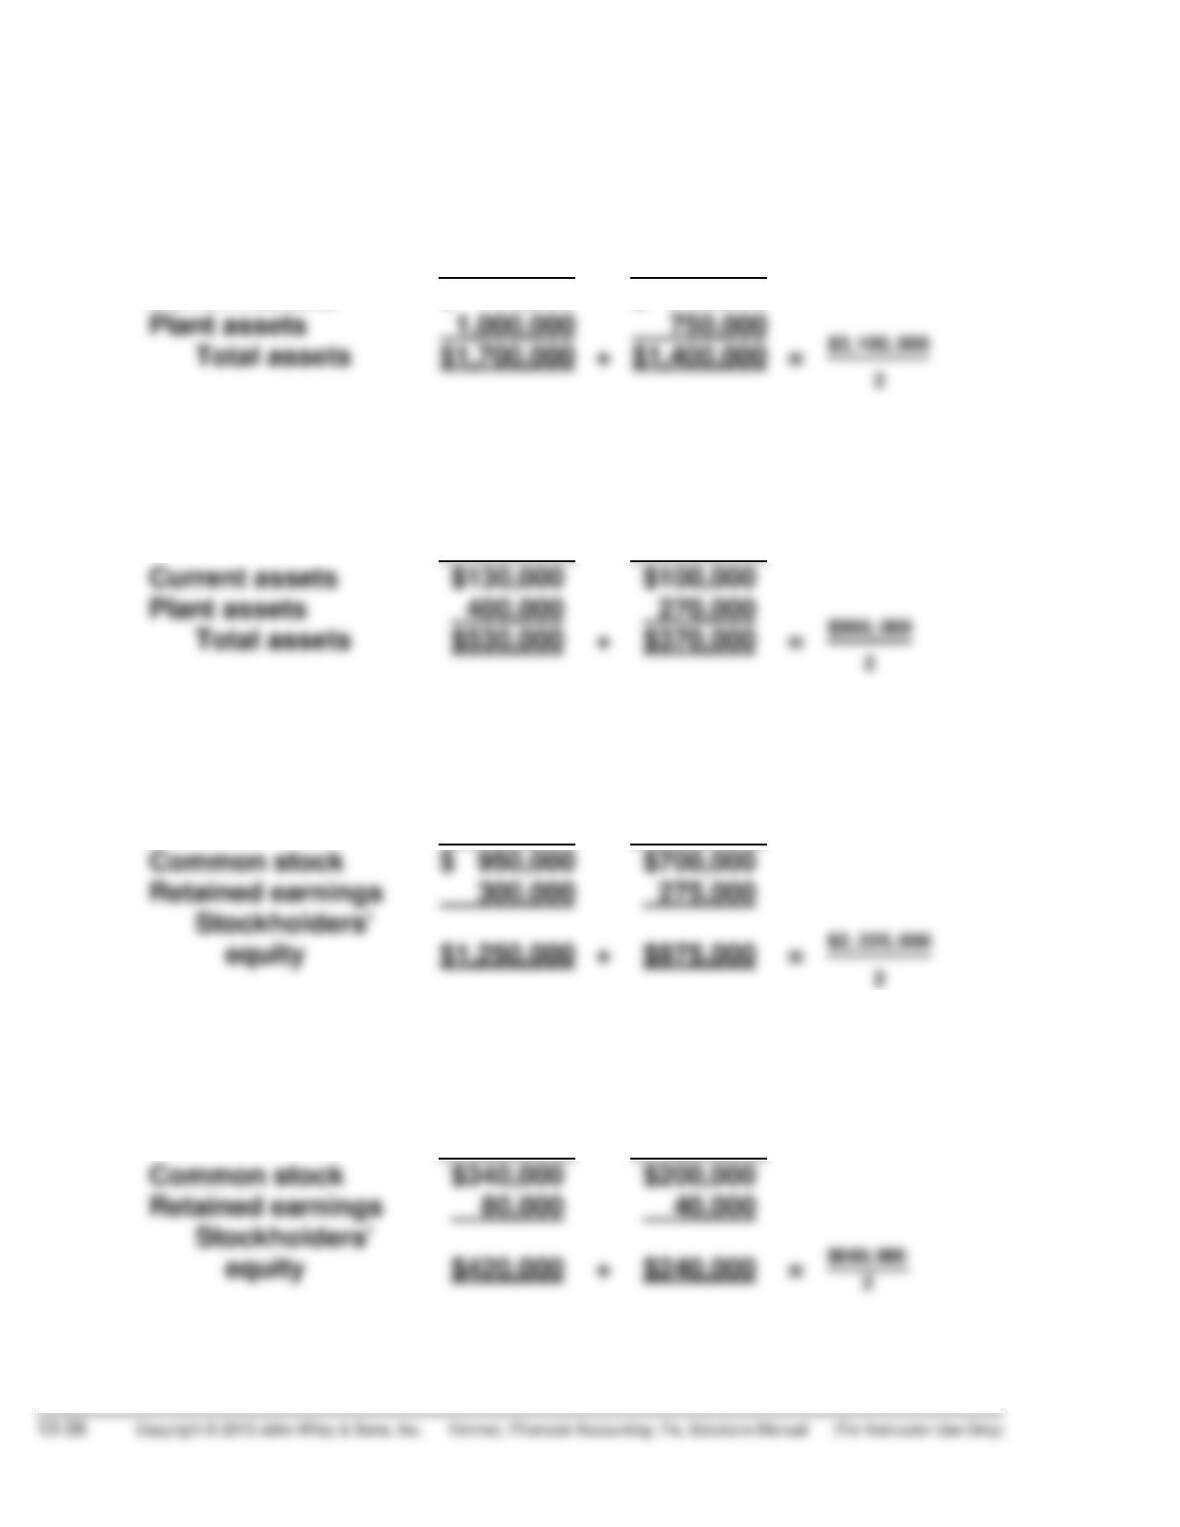
a$222,000 is Gerald’s 2014 net income. $1,550,000 is Dean’s 2014
average assets: Return on assets = ($222,000 ÷ $1,550,000) = 14.3%
2014 2013
Current assets
$ 700,000
$ 650,000
b$76,000 is Dean’s 2014 net income. $450,000 is Dean’s 2014 average
assets: Return on assets = ($76,000 ÷ $450,000) = 16.9%
2014 2013
c$222,000 is Gerald’s 2014 net income. $1,112,500 is Gerald’s 2014
average stockholders’ equity: Return = $222,000 ÷ $1,112,500 = 20.0%
2014 2013
d$76,000 is Dean’s 2014 net income. $330,000 is Dean’s 2014 average
stockholders’ equity: Return = $76,000 ÷ $330,000 = 23%
2014 2013
PROBLEM 13-2B
(b) Return on common stockholders’ equity = $119,200
$376,000 + $480,300
⎡
⎤
PROBLEM 13-2B (Continued)
(g) Inventory turnover = $440,000
$74,000 + $116,400
2
⎡
⎣
⎢⎤
⎦
⎥
= $440,000
$95,200 = 4.6 times
(l) Current cash debt coverage = $108,000
$163,500 + $156,000
⎡
= $108,000
$159,750 = .68 times
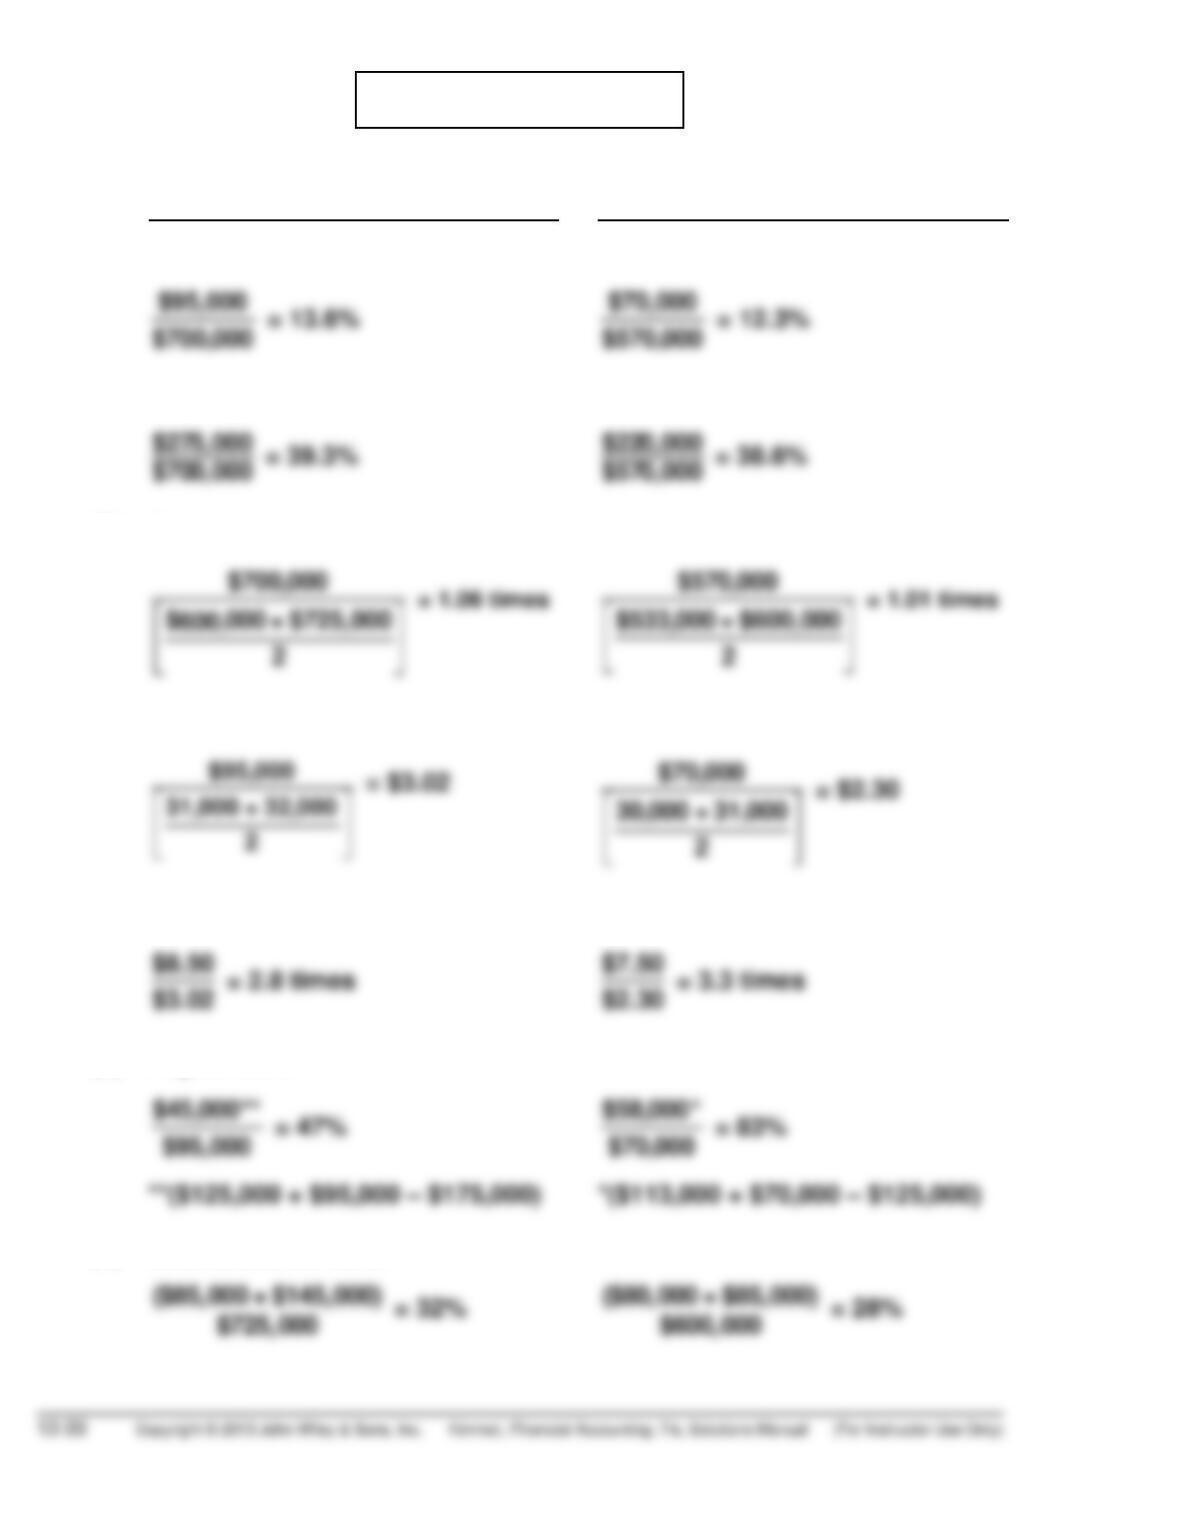
PROBLEM 13-3B
(a) 2014 2013
(1) Profit margin.
$110,000
$760,000 = 14.5% $85,000
$700,000 = 12.1%
(4) Earnings per share.
$110,000
= $2.97 $85,000
= $2.66
(6) Payout ratio.
(7) Debt to assets ratio.
PROBLEM 13-3B (Continued)
(b) The underlying profitability of the corporation has improved. For example,
the profit margin and gross profit rate have both improved. In addition,