(20-30 min.) P 13-51A
Chattanooga Flight’s statement of cash flows reveals only one strong
point, a continuing purchase of plant assets. The company’s
weaknesses include:
1. Net income and net cash provided by operations are down
significantly, with the company incurring a net loss during 2017.
3. The large payments on notes payable suggest that the company has a
lot of debt. Coupled with the loss during 2017 and the decrease in net
cash provided by operations, the payments on notes payable may
indicate that the company has too much debt.
(continued) P 13-51A
Eastern Airlines’ statement of cash flows reveals the following strengths
(no significant weaknesses):
The use of cash, coupled with increasing income and net cash
provided by operations, suggests successful operations.
3. The ending cash balance is much higher than that of the other
company and is increasing.
4. Net cash provided by operating activities exceeds net income.
(30-40 min.) P 13-52A
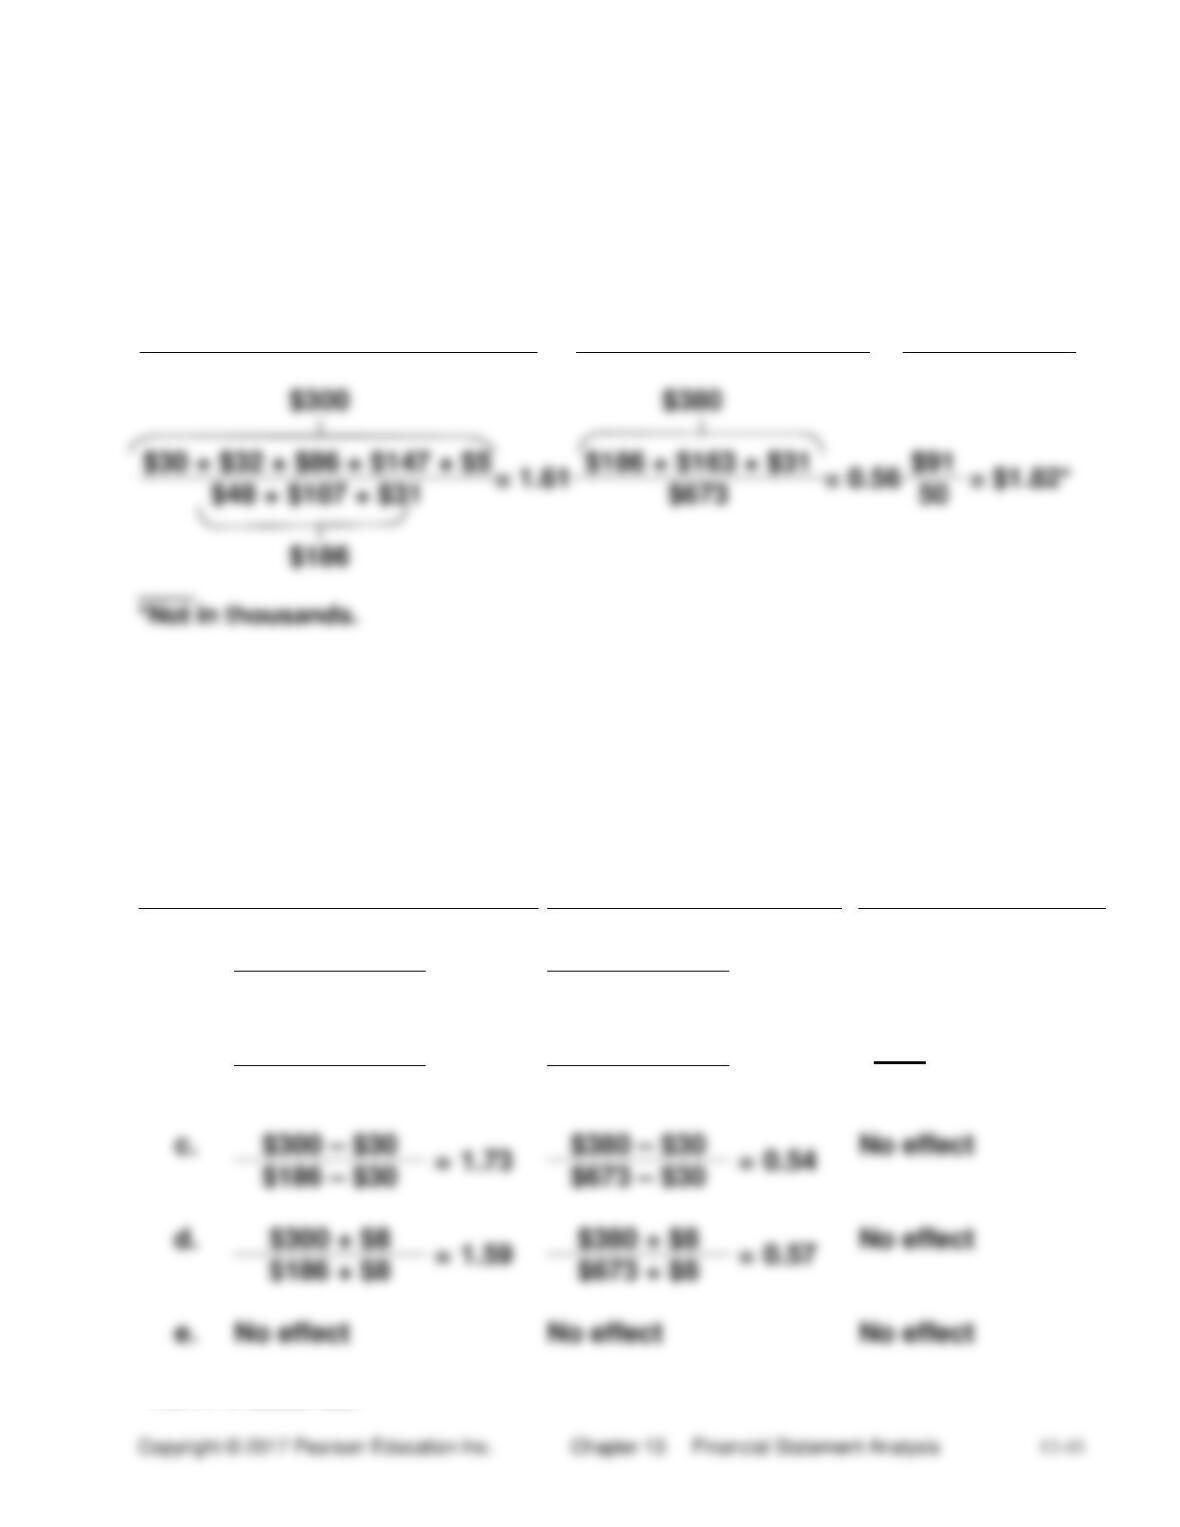
Req. 1 (ratios before the transactions)
(Dollar Amounts and Stock Quantities in Thousands)
Current Ratio
Debt Ratio
Earnings per
Share
$300
$380
= 0.56
$186
Req. 2 (ratios after the transactions)
(Dollar Amounts and Stock Quantities in Thousands)
Trans-
action
Current Ratio
Debt Ratio
Earnings per
Share
a.
$300 + $160
=
2.47
$380 + $160
=
0.65
No effect
$186
$673 + $160
b.
$300 + $308
=
3.27
$380
=
0.39
$91
$186
$673 + $308
50 + 18
=
$1.34*
c.
=
=
0.54
=
=
No effect
e.
No effect
No effect
No effect
*Not in thousands.
(40-50 min.) P 13-53A
Req. 1 (Dollar amounts and stock quantities in thousands)
2016
2015
a.
Current ratio
$563
=
1.98
$562
=
1.92
$285
$292
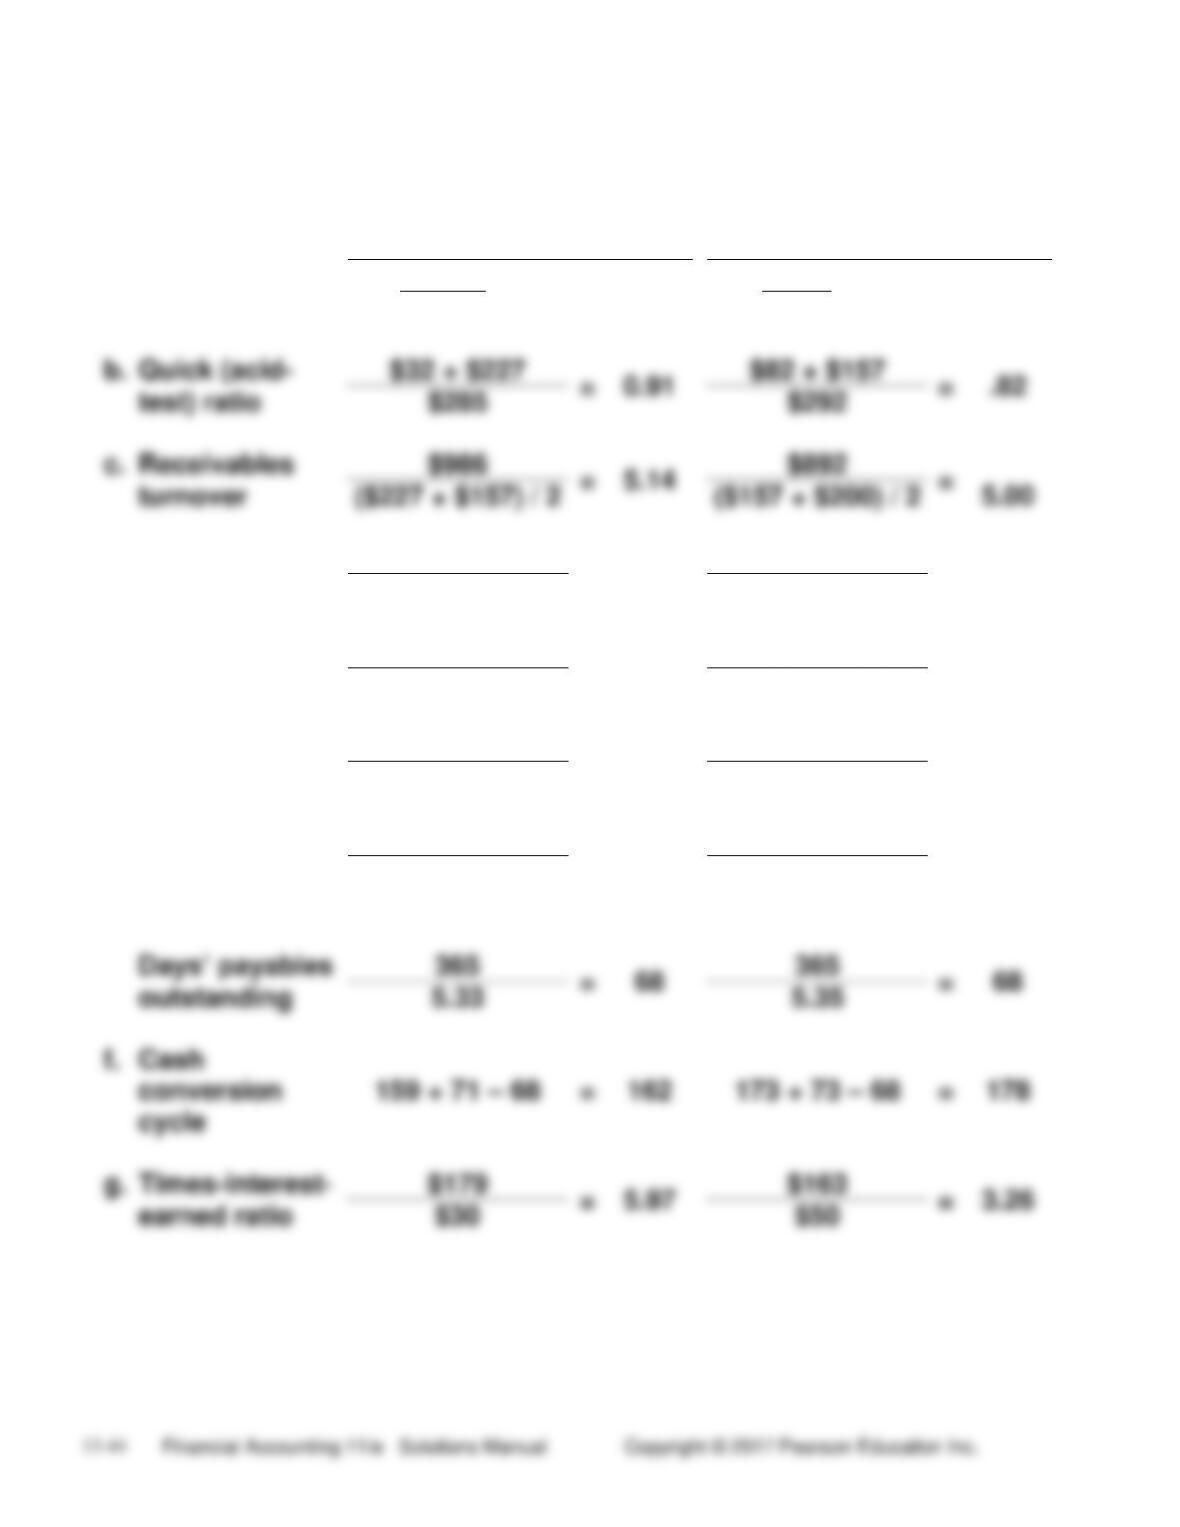
Quick (acid-
$32 + $227
=
0.91
$82 + $157
=
test) ratio
$285
$292
c.
Receivables
$986
=
$892
=
turnover
($227 + $157) / 2
($157 + $200) / 2
Days’ sales
365
=
71
365
=
73
outstanding
5.14
5.00
d.
Inventory
$680
=
2.30
$581
=
2.11
turnover
($297 + $294) / 2
($294 + $258) / 2
Days’ inventory
365
=
159
365
=
173
outstanding
2.30
2.11
e.
Accounts
$680
=
5.33
$581
=
5.35
payable
($150 + $105) / 2
($105 + $112) / 2
turnover
Days’ payables
365
=
68
365
=
68
outstanding
5.33
5.35
Cash
conversion
cycle
g.
Times-interest-
$179
=
5.97
$163
=
3.26
earned ratio
$30
(continued) P13-53A
h.
Return on
$108
=
0.110
$72
=
0.081
sales
$986
$892
Asset
=
=
turnover
($836 + $823) / 2
($823 + $701) / 2
Return on
11.0% x 1.189
=
13.08%
=
9.49%
assets
i.
Leverage
($836 + $823) / 2
=
2.724
($823 + $701) / 2
=
3.066
($311 + $298) / 2
($298 + $199) / 2
Return on
13.08% x 2.724
=
35.63%
9.49% x 3.066
=
29.1%
equity
j.
Earnings per
share
$108
=
$7.20*
$72
=
$7.20*
of common
stock
15
10
k.
Price/earnings
$89.38*
=
$85.67*
=
ratio
$7.20*
(continued) P 13-53A
Req. 2
Decisions:
a. The company’s financial position improved during 2016 as shown by
increases in the current ratio, the quick ratio, the receivables
b. The common stock’s attractiveness increased slightly during 2016, as
shown by the slight increase in the market price of the common
stock. Return on assets and return on equity both improved.
Earnings per share stayed the same.
Req. 3
This problem gives you practice in computing and evaluating several of
the ratios used in investment analysis. By analyzing the two-year trends
(45-60 min.) P 13–54A
Req. 1
(Dollar Amounts and Stock Quantities in Thousands)
Star.com
Westlake Shops
a.
Quick (acid-test)
$22 + $5 + $183
=
0.57
$36 + $15 + $165
=
0.64
ratio:
$371
$335
Inventory
turnover:
($184 + $196) / 2
c.
($183 + $144) / 2
($165 + $195) / 2
average
receivables:
Debt ratio:
e.
Times-interest-
Ratio is not meaningful
because Star.com
$69
=
6.27
earned ratio:
$11
has no interest expense.
f.
Return on
common
$68
=
0.236
$35 − ($30 × .10)
=
0.157
stockholders’
($312 + $265) / 2
[($247 − $30) +
equity:
($221 − $30)] / 2
Earnings per
share
$35 − ($30 × .10)
of common
Price/earnings
ratio:
(continued) P 13-54A
Decision:
Star.com’s common stock seems to fit the investment strategy better. Its
price/earnings ratio is lower than that of Westlake Shops, and Star.com
Req. 2
Star.com
Westlake Shops
EVA®
$68,000 − [($0 + $265,000) × .10]
$35,000 + $11,000 −
(20-30 min.) P 13-55B
Req. 1
Urbana Shipping, Inc.
Trend Percentages
2016
2015
2014
2013
2012
Net sales
172%
135%
122%
106%
100%
Net income
221
196
208
Total assets
142
129
118
Req. 2 Return on net sales Dollar amounts in thousands
2016
2015
2014
Net income
$53
=
10.4%
$47
=
11.8%
$50
=
13.8%
Net sales
$510
$400
$362
Return on sales measures the amount of net income for each dollar of
net sales.
Req. 3 Asset turnover Dollar amounts in thousands
2015
$400
$362
Asset turnover means the amount of net sales per dollar invested in
assets. High ratios mean high efficiency (low cost).
(continued) P 13-55B
Req. 4 Return on assets Dollar amounts in thousands
Req. 5
Urbana Shipping’s rate of return on net sales has declined from 2014 to
2016. However, the return compares favorably with the industry average
of 9%. Return on sales dropped below the excellent industry average of
11% in 2016.
Req. 6
(20-30 min.) P 13-56B
Req. 1
Gordon Products, Inc.
Common-Size Income Statement Compared
to Industry Average
Year Ended December 31, 2016
Gordon
Products
INDUSTRY
AVERAGE
Net sales ……………………………………………………
100.0%
100.0%
Cost of goods sold ……………………………………..
57.3
Gross profit ……………………………………………….
32.0
42.7
Operating income……………………………………….
10.0
13.3
Other expenses ………………………………………….
0.5
2.5
Net income…………………………………………………
9.5%
10.8%
Gordon Products, Inc.
Common-Size Balance Sheet Compared to Industry Average
December 31, 2016
Gordon
Products
INDUSTRY
AVERAGE
Current assets …………………………………………….
77.0%
72.1%
Fixed assets, net …………………………………………
18.8
19.0
Intangible assets, net ………………………………….
Other assets ……………………………………………….
4.1
Total assets ………………………………………………..
100.0%
Current liabilities …………………………………………
39.4%
47.2%
Long-term liabilities …………………………………….
21.2
21.0
31.8
100.0%
(continued) P 13-56B
Req. 2
Gordon Product’s common-size income statement shows that its ratios
Req. 3
Gordon Product’s common-size balance sheet shows that its (a) ratio of
current assets to total assets is better than the industry average. The
(20-30 min.) P 13-57B
Western Air’s statement of cash flows reveals few strengths. The
company’s weaknesses include:
3. Payments on debt are high and the company is still making
investments in new property, plant, and equipment. This is not
necessarily a weakness, for the company may have acquired fixed
assets in earlier years and may now be paying the debts incurred to
purchase those assets. However, the company’s downward trends of
income and net cash flow from operations suggest that its operations
are not very successful.
6. Overall, cash decreased in 2016 and 2017. We would expect cash to
increase.
(continued) P 13-57B
Tech Flight’s statement of cash flows reveals the following strengths (no
significant weaknesses):
2. The company’s heavy investments in property, plant, and equipment
suggests that the company is expanding. This investing activity,
coupled with increasing income and increasing net cash flow from
operating activities, suggests successful operations.
3. The ending cash balance is higher than that of the other company,
and cash increased during the current year 2017. It is interesting to
note that Tech Flights did not pay a dividend in either year. Rapidly
growing companies often reinvest operating cash flow into the
business.
Student wording may vary.
(30-40 min.) P 13-58B
Req. 1 (ratios before the transactions)
(Dollar Amounts and Stock Quantities in Thousands)
Current Ratio
Debt Ratio
Earnings per
Share
$298
$371
$178
Req. 2 (ratios after the transactions)
(Dollar Amounts and Stock Quantities in Thousands)
Trans-
action
Current Ratio
Debt Ratio
Earnings per Share
a.
$298 + $100
=
2.24
$371 + $100
=
0.61
No effect
$178
$677 + $100
b.
$298 + $362
=
3.71
$371
=
0.36
$94
$178
$677 + $362
46 + 20
=
$1.42*
c.
=
1.54
=
0.58
No effect
e.
No effect
No effect
No effect
(40-50 min.) P 13-59B
Req. 1
(Dollar Amounts and Stock Quantities in Thousands)
a.
Current ratio
=
=
Quick (acid-
$45 + $217
=
0.89
$49 + $158
=
0.69
test) ratio
$295
$298
c.
Receivables
$957
=
5.10
$875
=
4.89
turnover
($217 + $158) / 2
($158 + $200) / 2
Days’ sales
365
=
72
365
=
75
outstanding
5.10
4.89
d.
Inventory
$675
=
2.30
$576
=
2.47
turnover
($302 + $286) / 2
($286 + $181) / 2
Days’ inventory
365
=
159
365
=
148
outstanding
2.30
2.47
e.
Accounts
$675
=
$576
=
payable
turnover
Days’ payables
365
=
365
=
outstanding
5.00
5.19
Cash
g.
Times-interest-
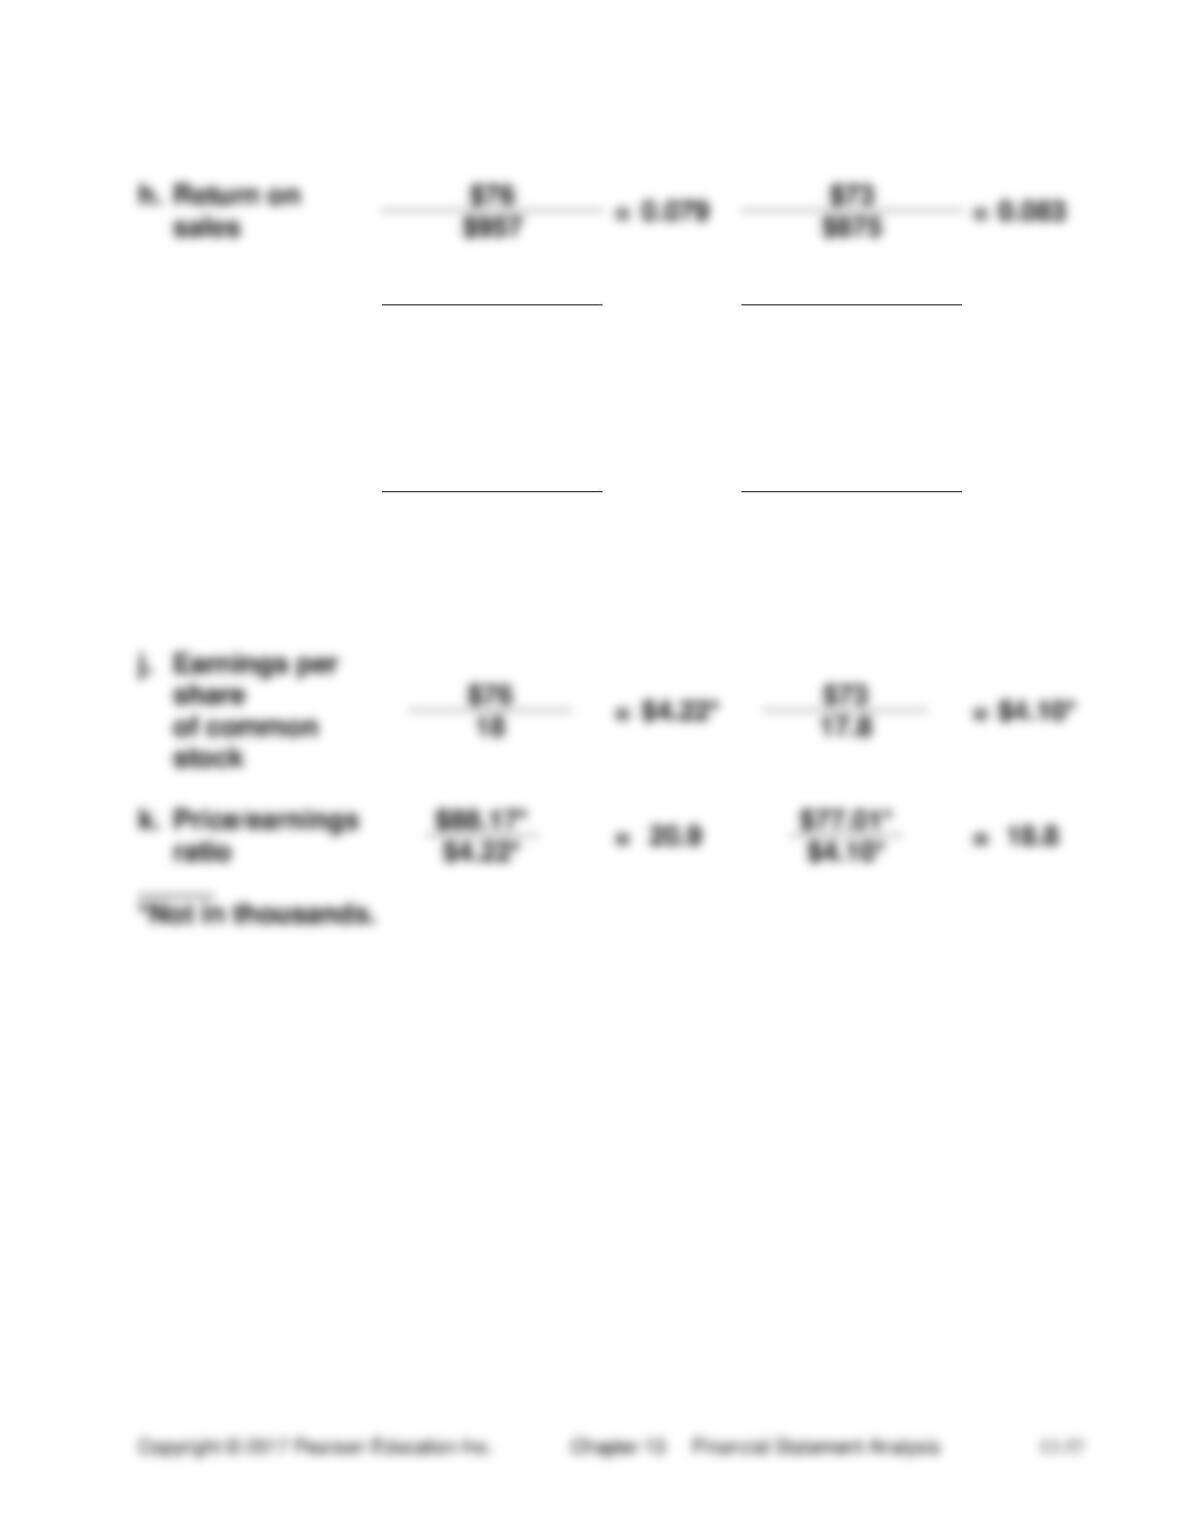
$153
=
$157
=
earned ratio
(continued) P13-59B
h.
Return on
=
=
sales
Asset
$957
=
1.159
$875
=
1.167
turnover
($853 + $799) / 2
($799 + $700) / 2
Return on
7.9% x 1.159
=
9.2%
8.3% x 1.167
=
9.7%
assets
i.
Leverage
($853 + $799) / 2
=
2.824
($799 + $700) / 2
=
3.196
($315 + $270) / 2
($270 + $199) / 2
Return on
9.2% x 2.824
=
26.0%
9.7% x 3.196
=
31.0%
equity
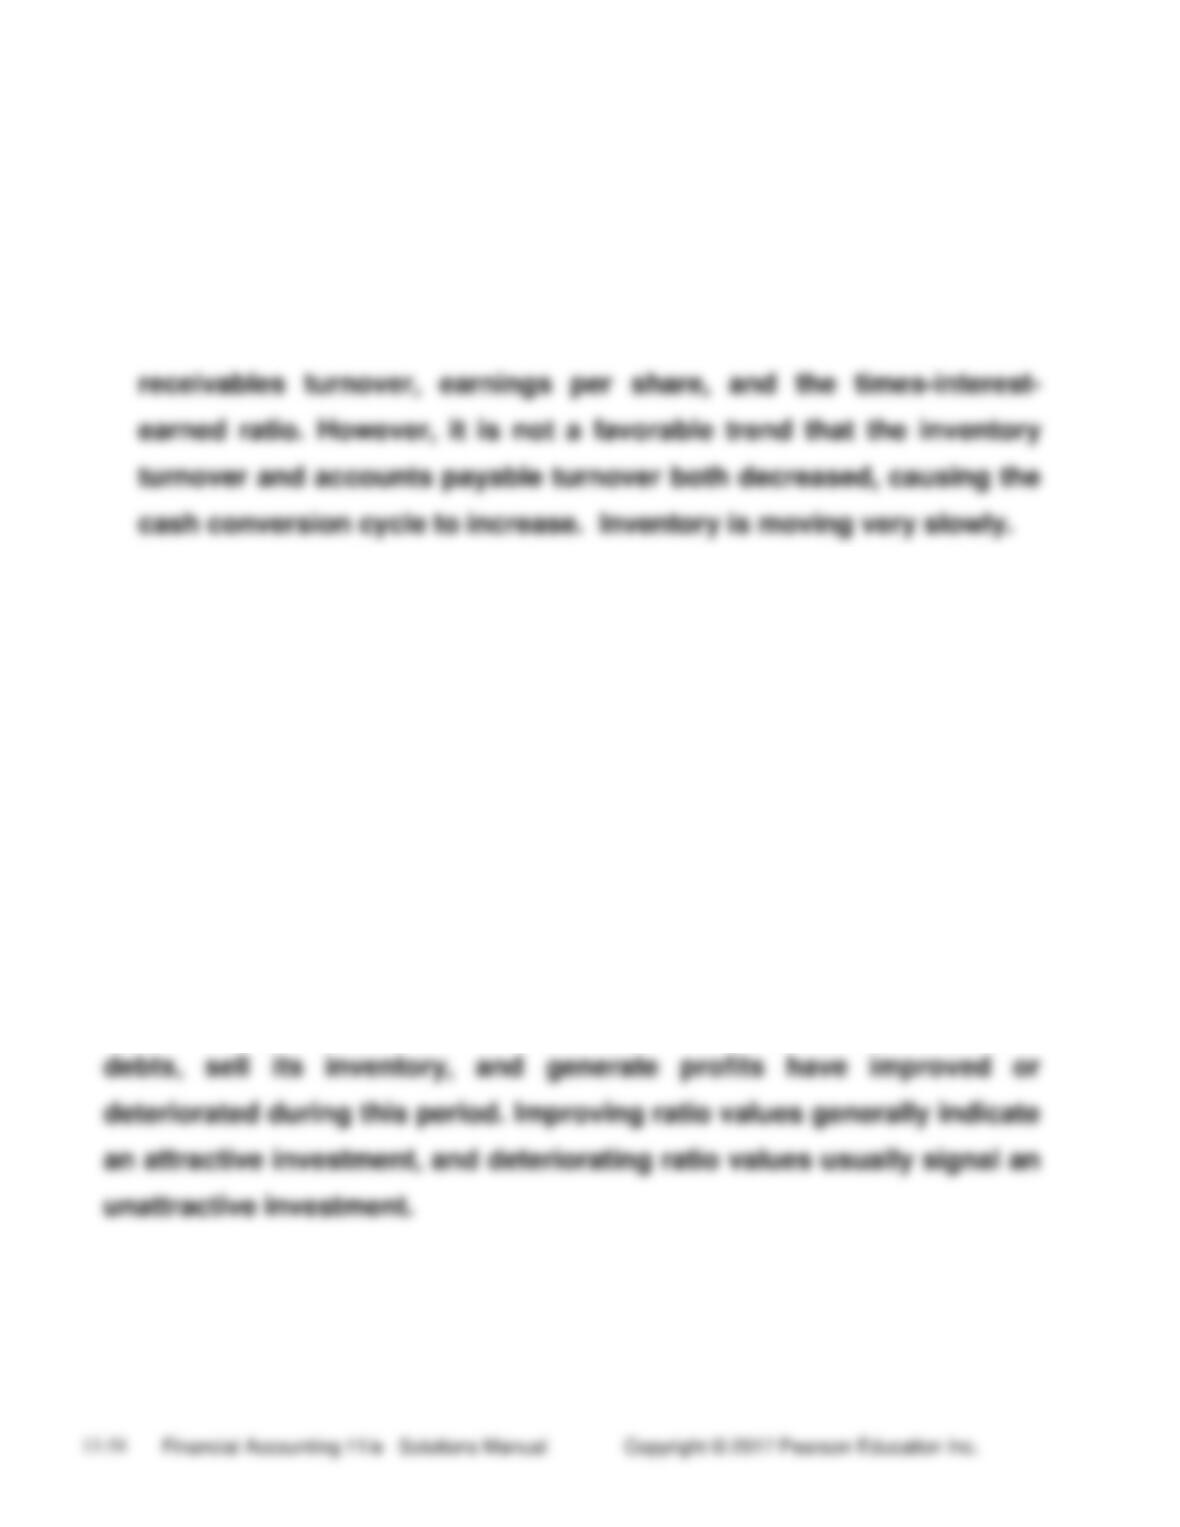
k.
Price/earnings
$88.17*
=
20.9
$77.01*
=
18.8
ratio
$4.22*
(continued) P 13-59B
Req. 2
Decisions:
a. The company’s financial position improved slightly during 2016 as
shown by increases in the current ratio, the quick ratio, the
b. In some ways, the common stock’s attractiveness declined during
2016, as shown by the decrease in the return on assets and return on
equity. However, the stock did appear to be slightly more attractive
due to the increase in the market price per share, earnings per share,
and the price/earnings ratio.
Req. 3
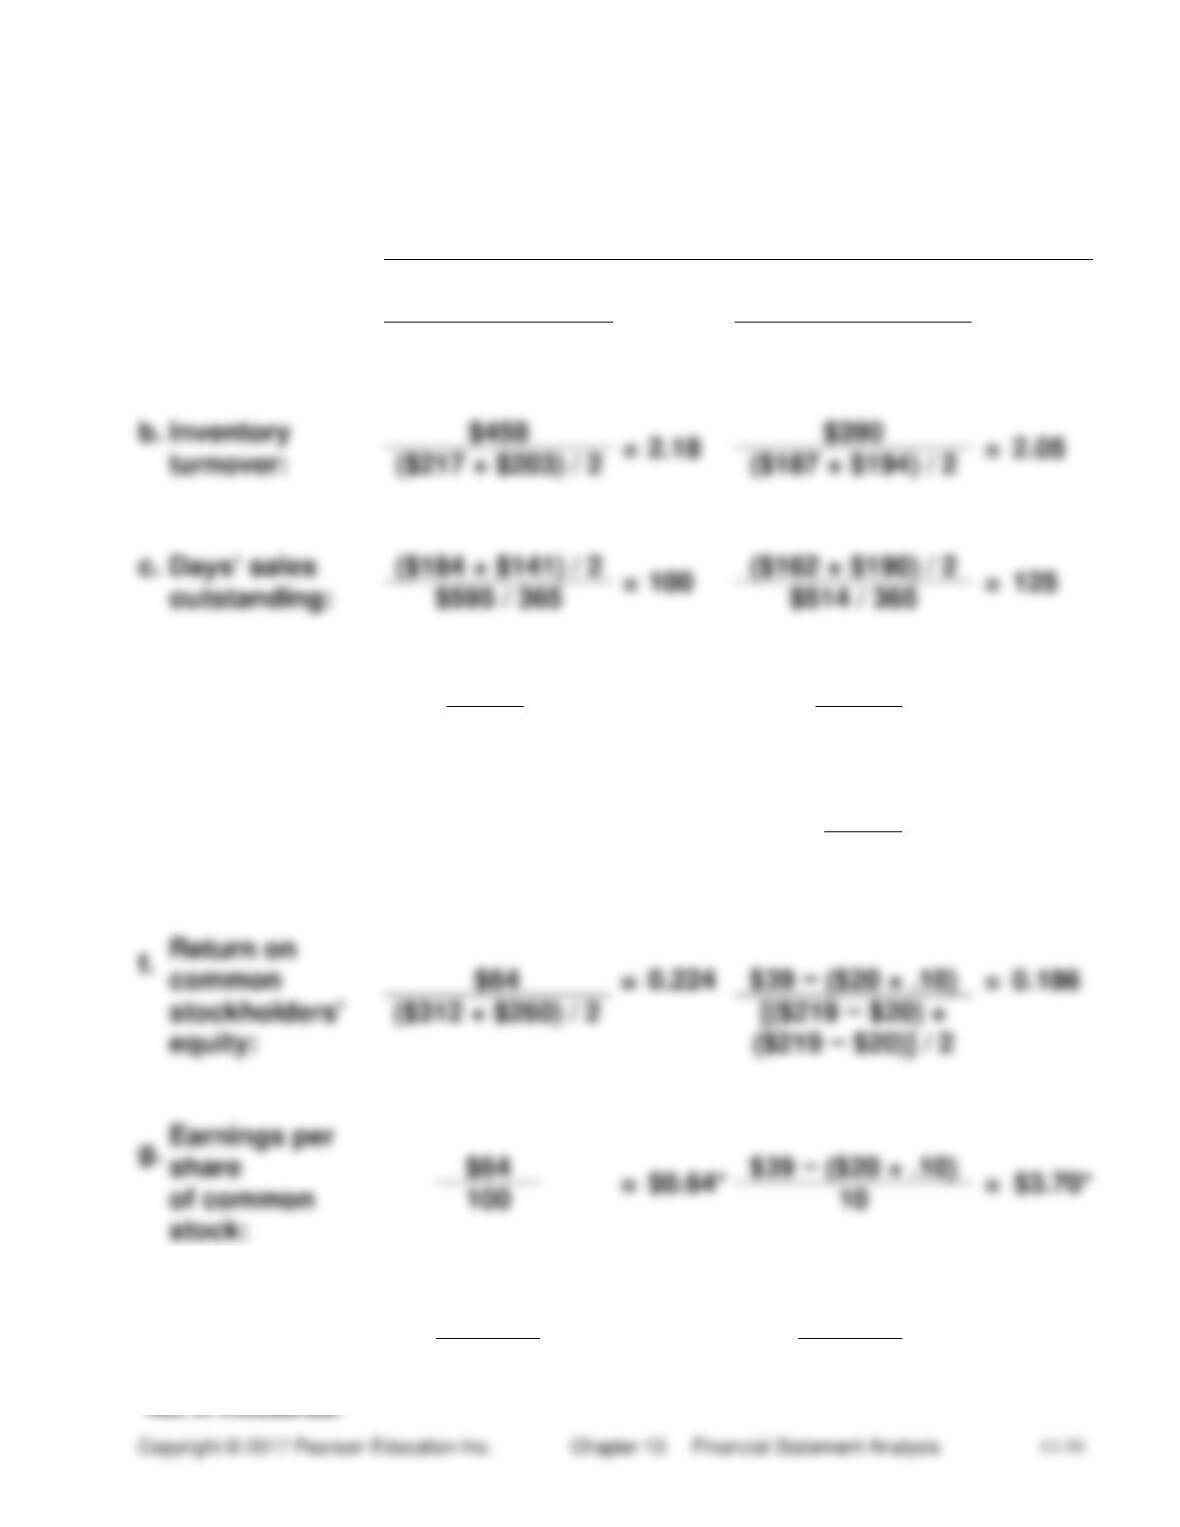
This problem gives you practice in computing and evaluating many of
the ratios used in investment analysis. By analyzing the two-year trends
in the ratios, you can see whether the company’s abilities to pay its
(45-60 min.) P 13-60B
Req. 1
(Dollar Amounts and Stock Quantities in Thousands)
Disc.com
Holiday Shops
a.
Quick (acid-test)
$26 + $7 + $184
=
0.59
$42 + $12 + $162
=
0.64
ratio:
$365
$335
b.
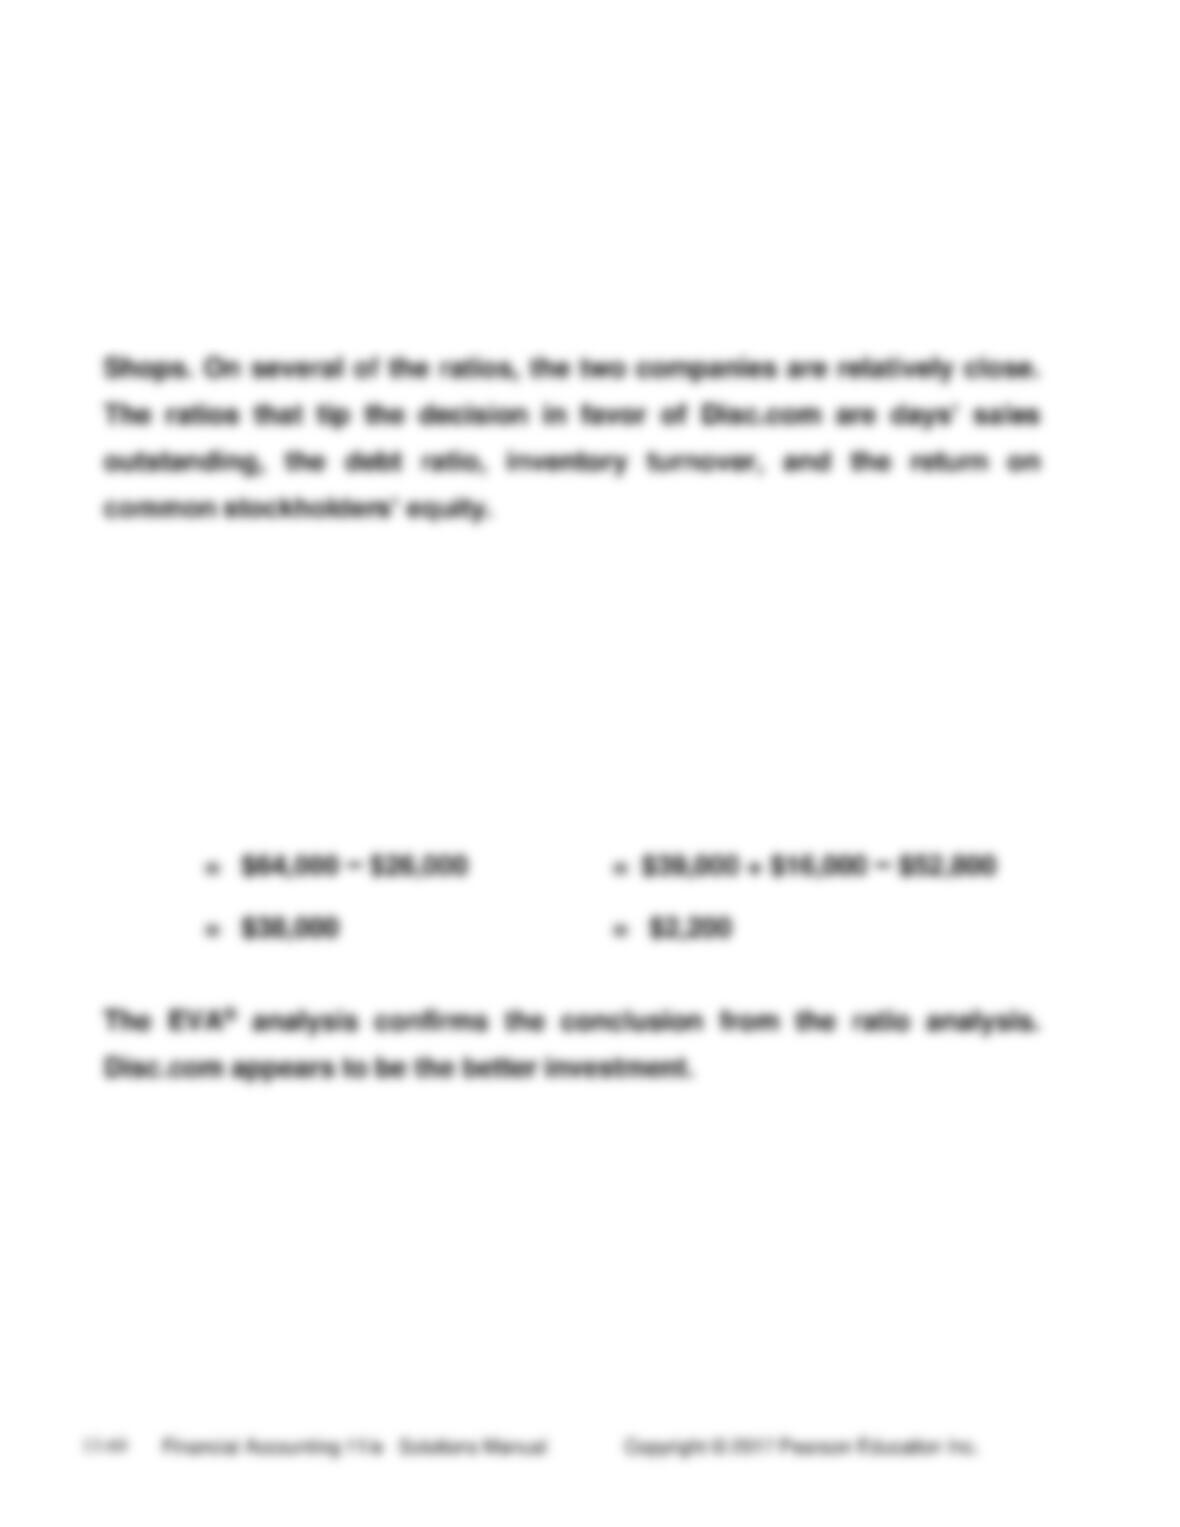
Inventory
=
=
2.05
turnover:
c.
=
100
=
125
outstanding:
d.
Debt ratio:
$670
=
0.68
$713
=
0.77
$982
$932
e.
Times-interest-
Ratio is not meaningful
$79
=
4.94
earned ratio:
because Disc.com has
$16
no interest expense.
Return on
stockholders’
equity:
Earnings per
share
of common
stock:
h.
Price/earnings
$6.40*
=
10
$66.60*
=
18
ratio:
$.64*
$3.70*
(continued) P 13-60B
Decision:
The common stock of Disc.com seems to fit the investment strategy
better. Its price/earnings ratio is lower than that of Holiday Shops, and
Disc.com appears to be in slightly better shape financially than Holiday
Req. 2
Disc.com
Holiday Shops
EVA®
$64,000 − ($260,000 × .10)
$39,000 + $16,000 − [($309,000
+ $219,000) × .10]
$2,200