Unlock document.
This document is partially blurred.
Unlock all pages and 1 million more documents.
Get Access
EXERCISE 13-3
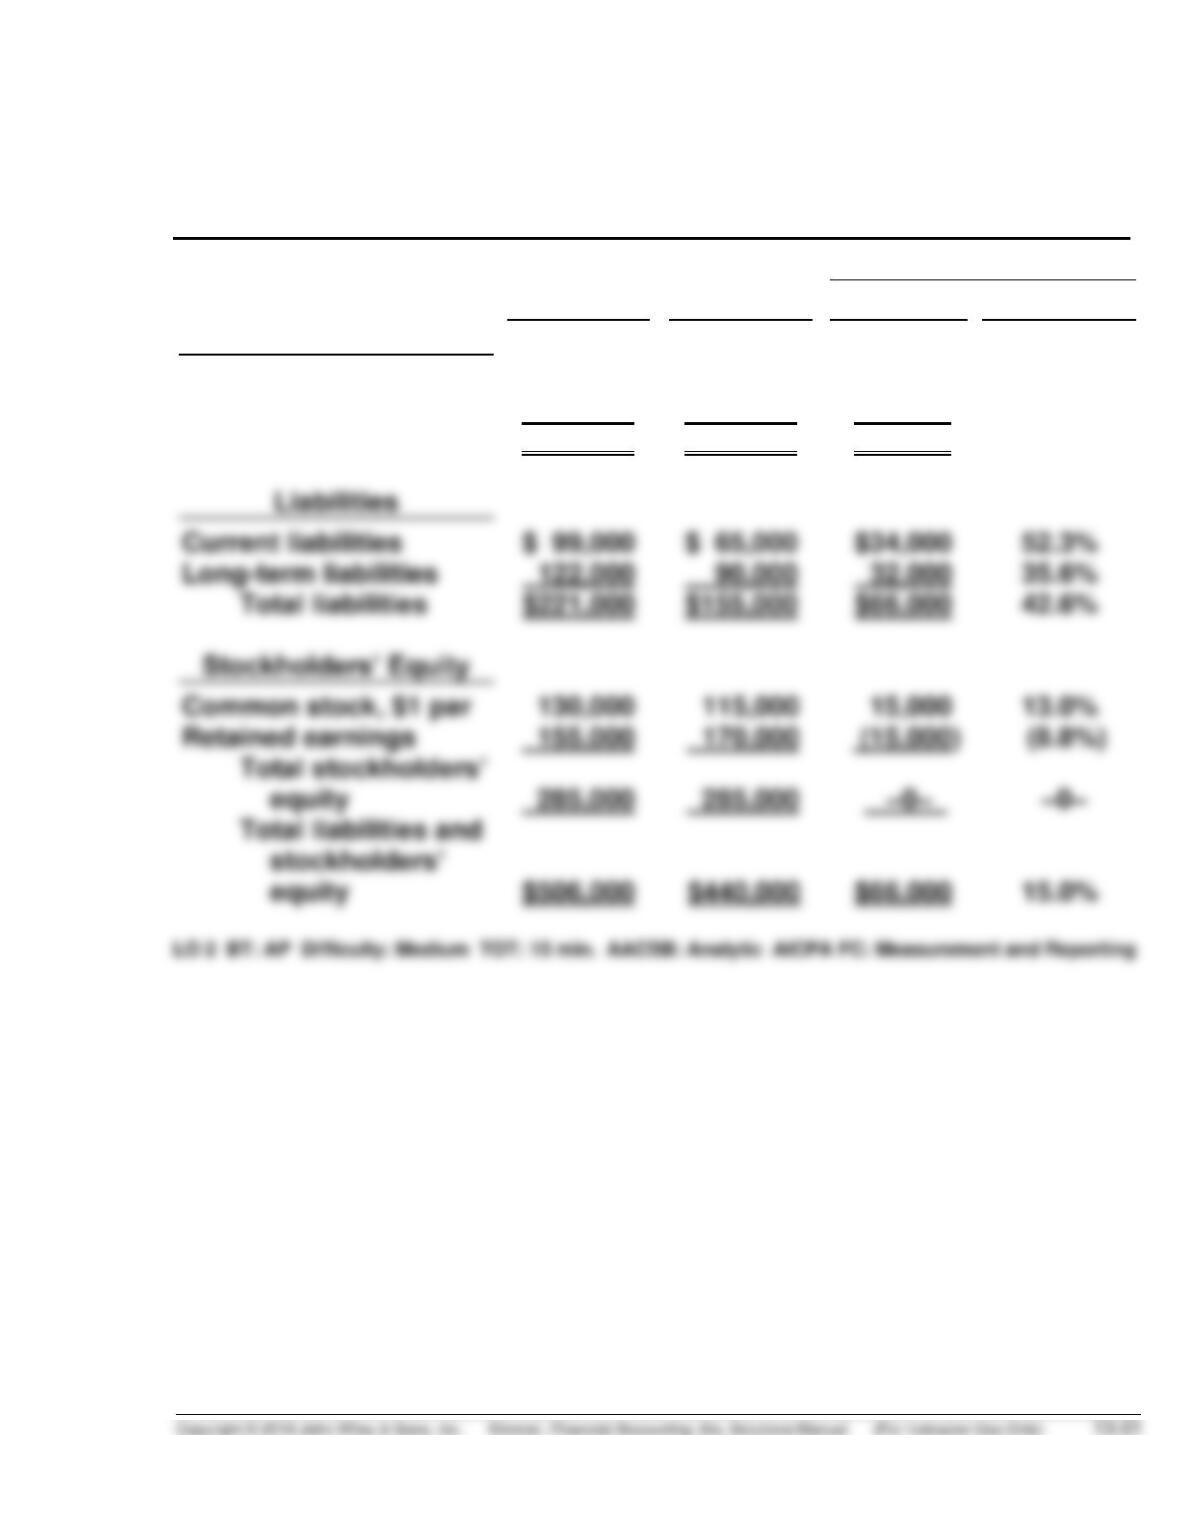
GLITTER INC.
Condensed Balance Sheet
December 31
Increase or (Decrease)
2017
2016
Amount
Percentage
Assets
Current assets
Plant assets (net)
Total assets
$106,000
400,000
$506,000
$ 90,000
350,000
$440,000
($16,000
50,000
($66,000
(17.8%)
(14.3%)
(15.0%)
EXERCISE 13-4
JOSHUA CORPORATION
Condensed Income Statement
For the Years Ended December 31
2017
2016
Amount
Percent
Amount
Percent
Sales revenue
Cost of goods sold
Gross profit
$800,000
520,000
280,000
100.0%
65.0%
35.0%
$600,000
408,000
192,000
100.0%
68.0%
32.0%
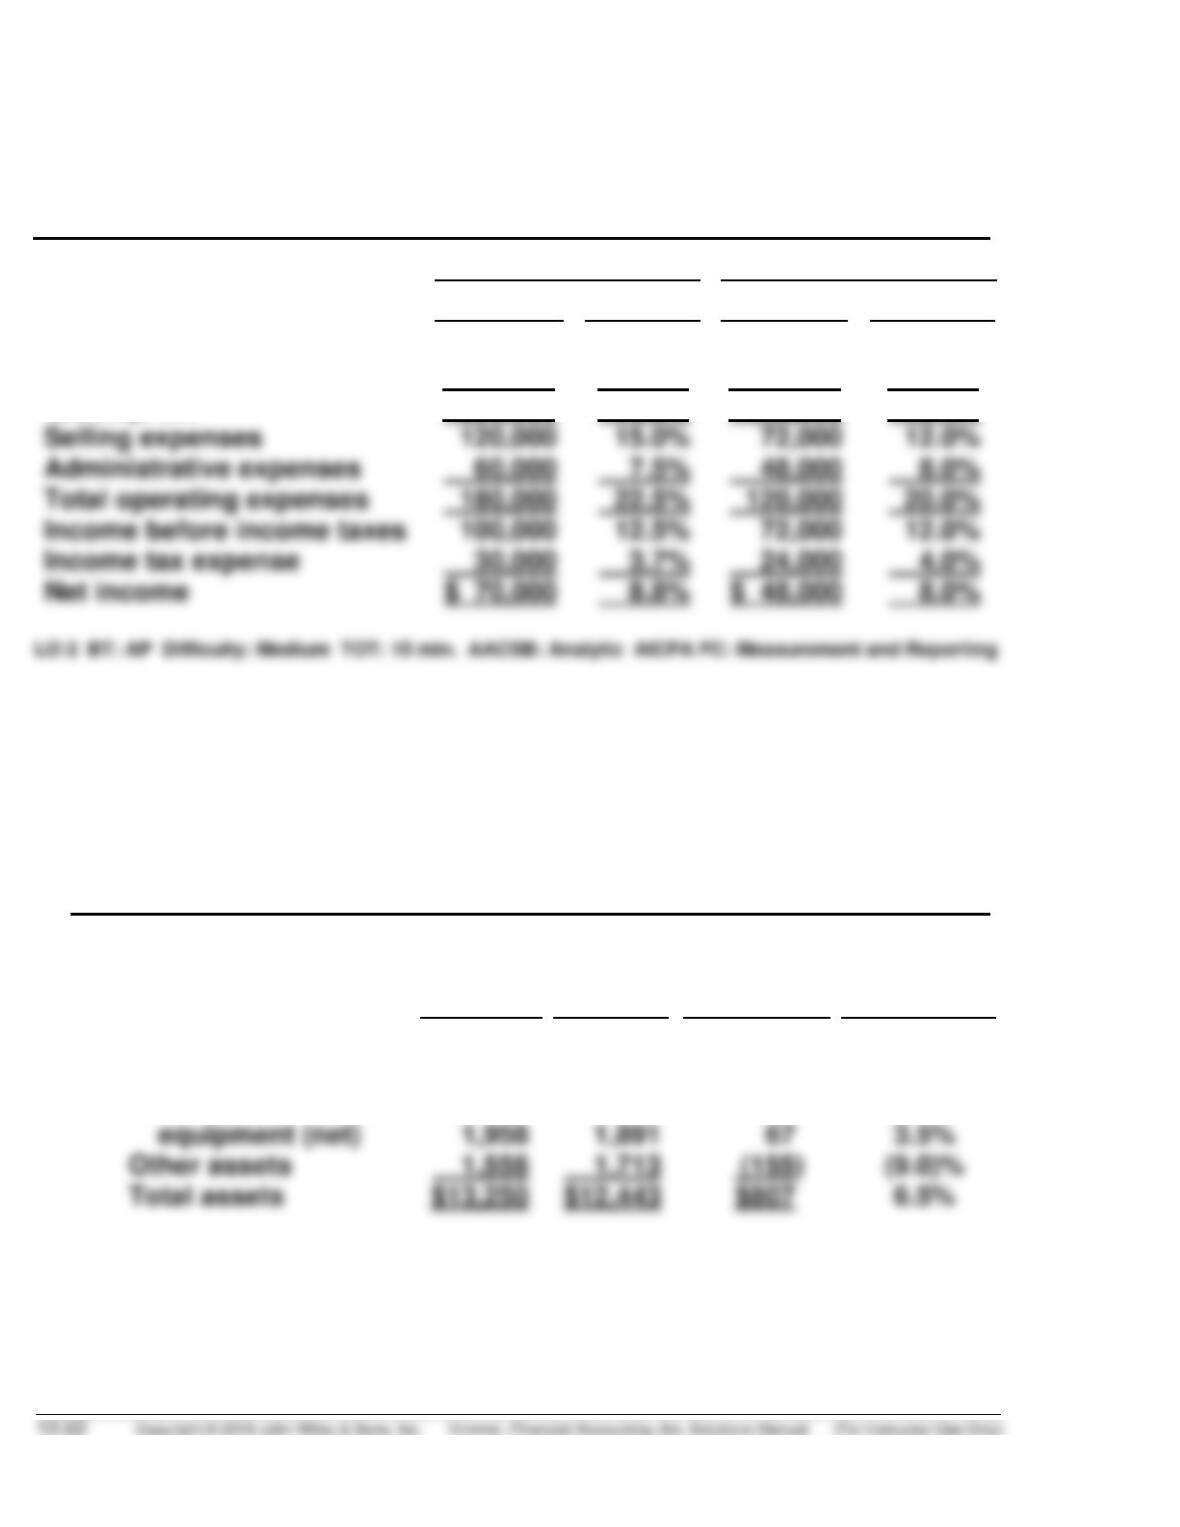
EXERCISE 13-5
(a) NIKE, INC.
Condensed Balance Sheet
May 31
($ in millions)
2017
2016
Increase
(Decrease)
Percentage
Change
from 2016
Assets
Current assets
Property, plant, and
$ 9,734
$ 8,839
$895
10.1%
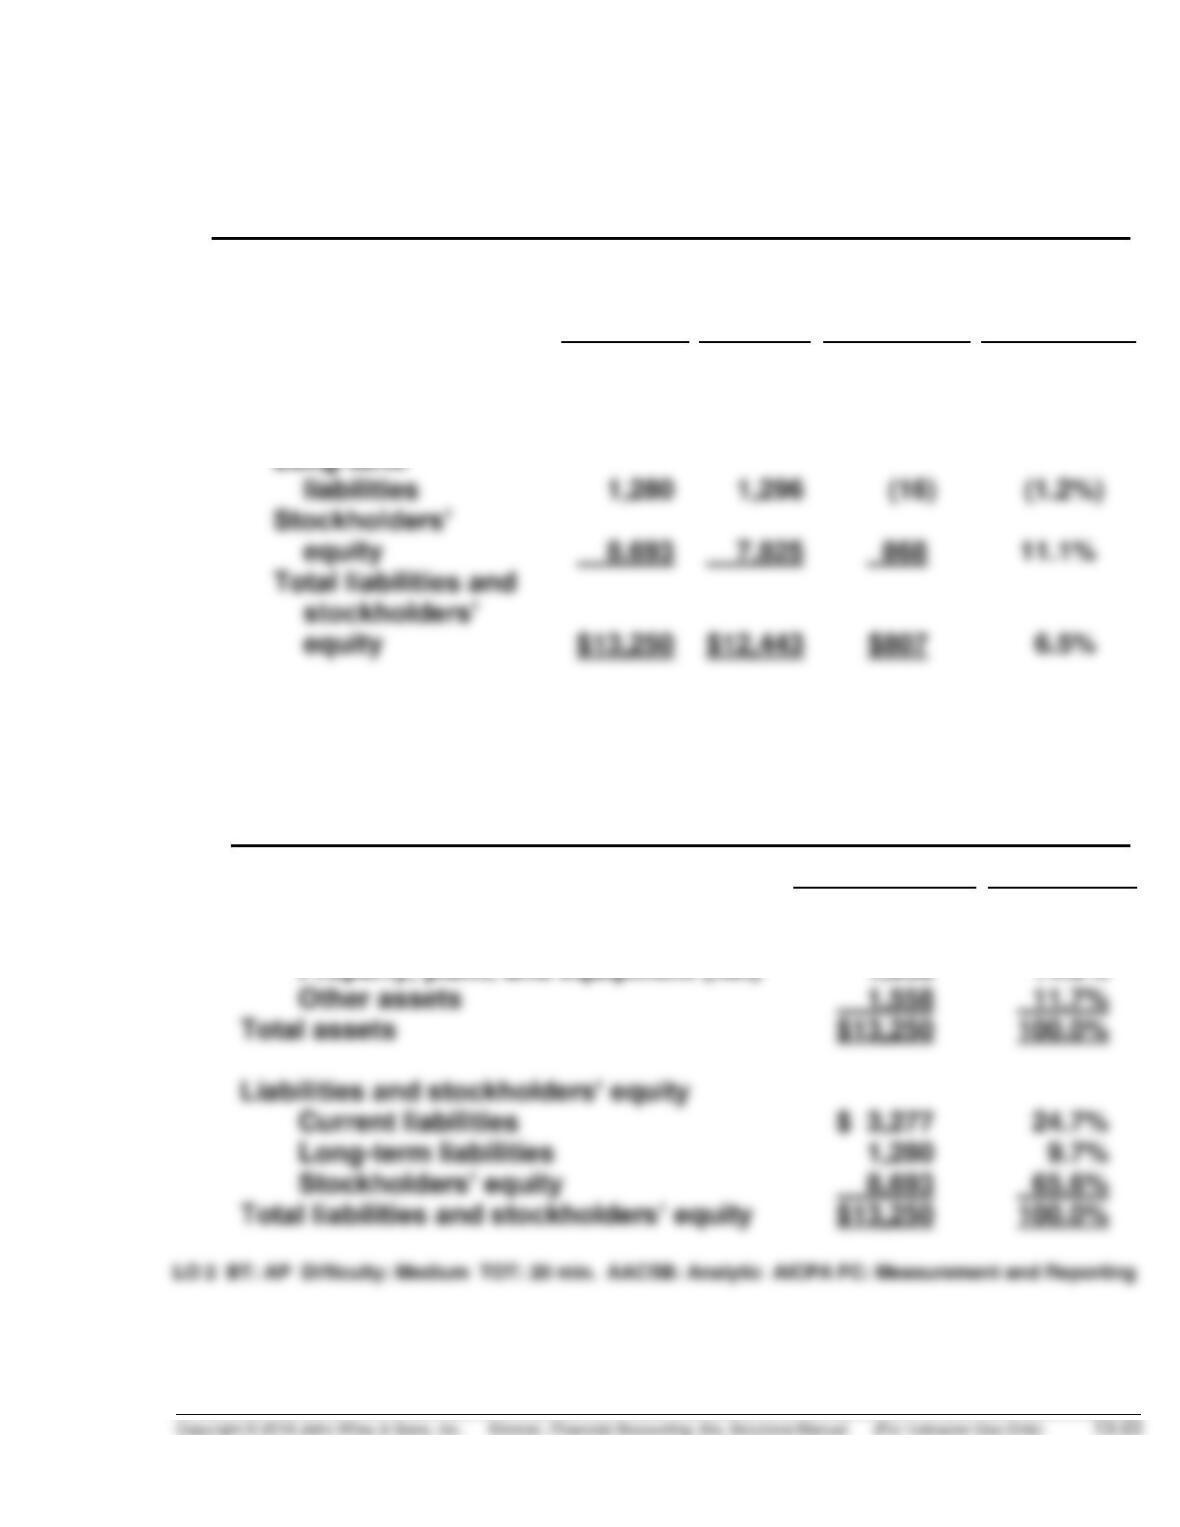
EXERCISE 13-5 (Continued)
NIKE, INC.
Condensed Balance Sheet (Continued)
May 31
2017
2016
Increase
(Decrease)
Percentage
Change
from 2016
Liabilities and stock-
holders’ equity
Current liabilities
$ 3,277
$ 3,322
$ (45)
(1.4%)
(b) NIKE, INC.
Condensed Balance Sheet
May 31, 2017
$ (in millions)
Percent
Assets
Current assets
Property, plant, and equipment (net)
$ 9,734
1,958
73.5%
14.8%
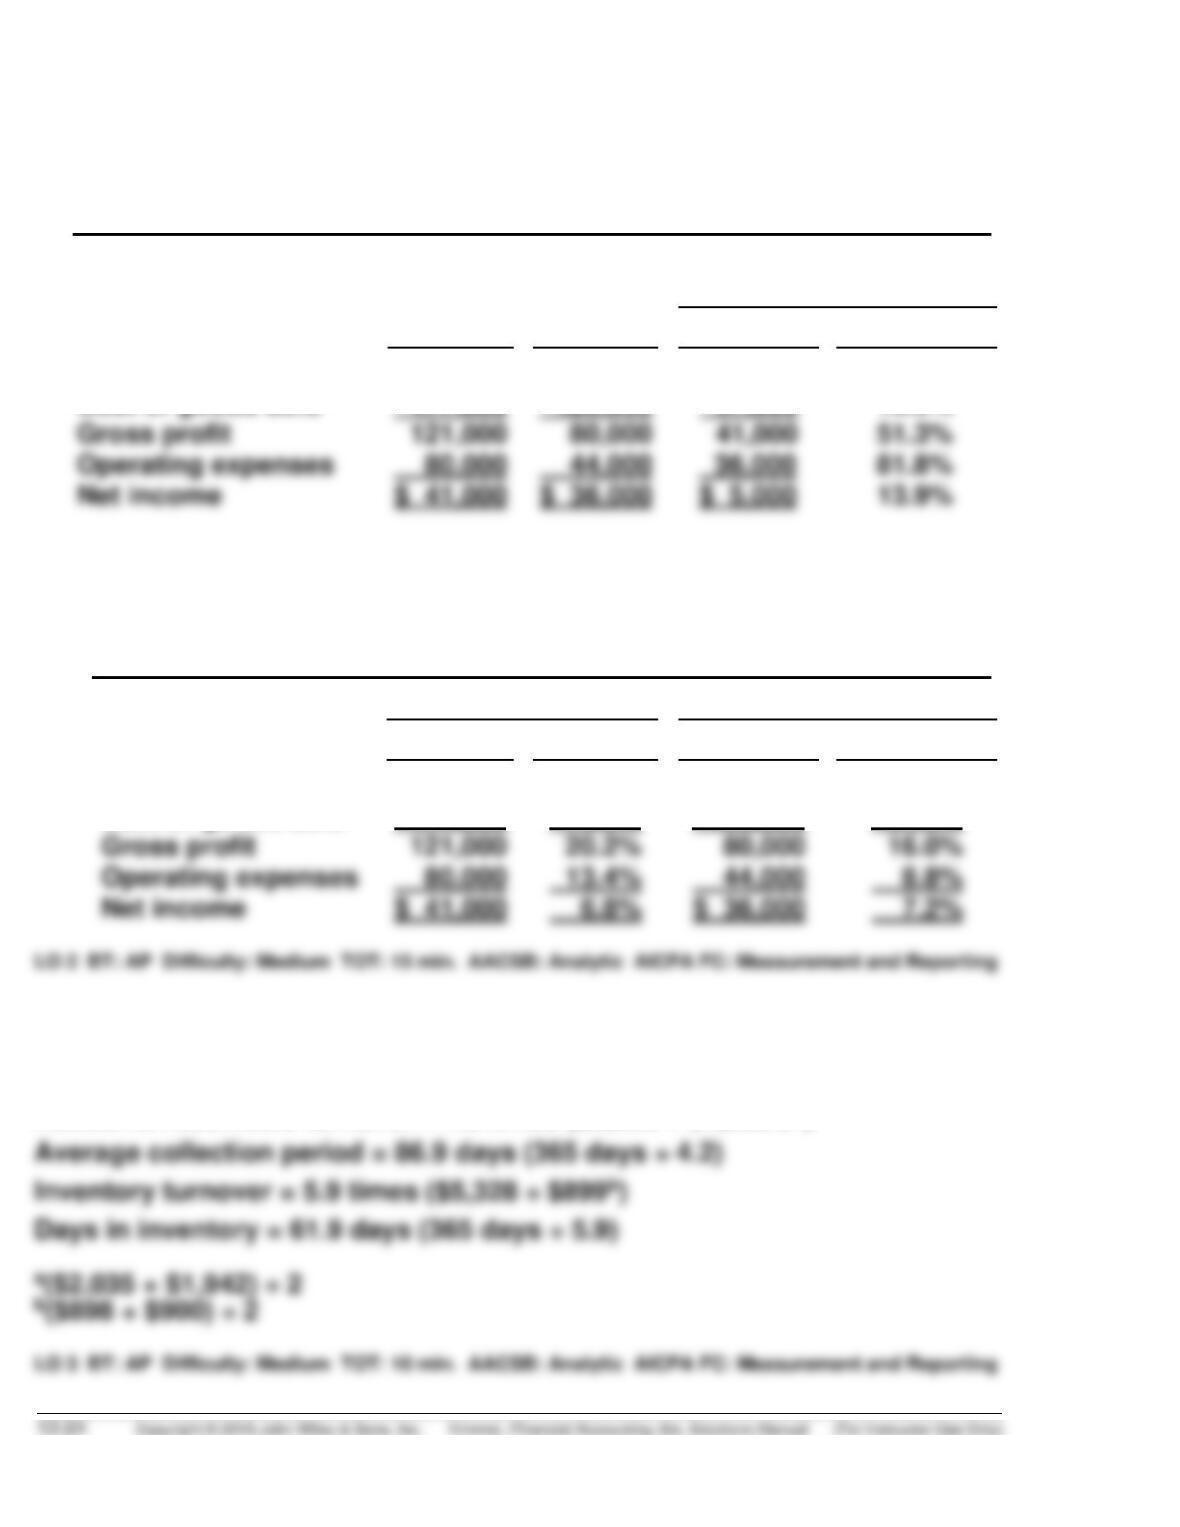
EXERCISE 13-6
(a) DELANEY CORPORATION
Condensed Income Statement
For the Years Ended December 31
Increase or (Decrease)
During 2017
2017
2016
Amount
Percentage
Net sales
Cost of goods sold
$598,000
477,000
$500,000
420,000
$98,000
57,000
19.6%
13.6%
(b) DELANEY CORPORATION
Condensed Income Statements
For the Years Ended December 31
2017
2016
$
Percent
$
Percent
Net sales
Cost of goods sold
$598,000
477,000
100.0%
79.8%
$500,000
420,000
100.0%
84.0%
EXERCISE 13-7
Current ratio = 2.01:1 ($4,054 ÷ $2,014)
Accounts receivable turnover = 4.2 times ($8,258 ÷ $1,988.5a)
EXERCISE 13-8
Current ratio as of February 1, 2017 = 3.00:1 ($120,000 ÷ $40,000).
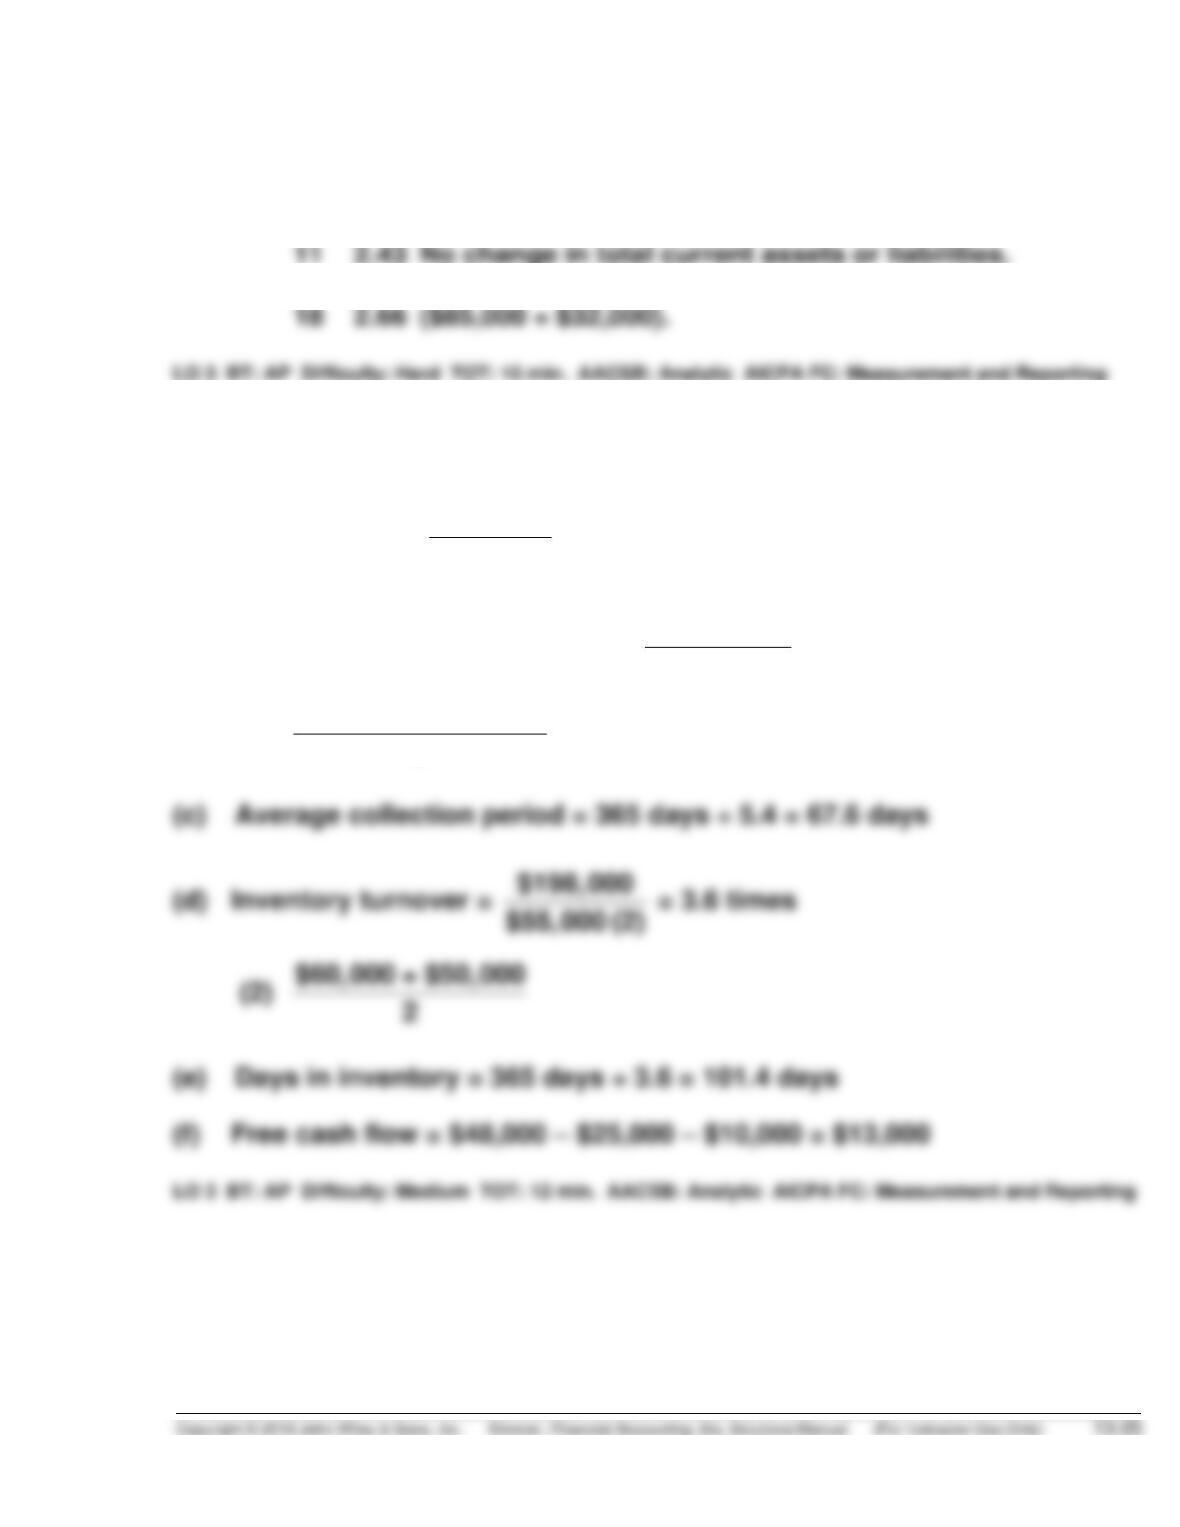
Feb. 3 3.00 No change in total current assets or liabilities.
7 2.43 ($97,000 ÷ $40,000).
14 3.04 ($85,000 ÷ $28,000).
EXERCISE 13-9
(a) Current ratio =
$145,000
$50,000
= 2.90:1
(b) Accounts receivable turnover =
$350,000
$65,000 (1)
= 5.4 times
(1)
($70,000 + $60,000)
2
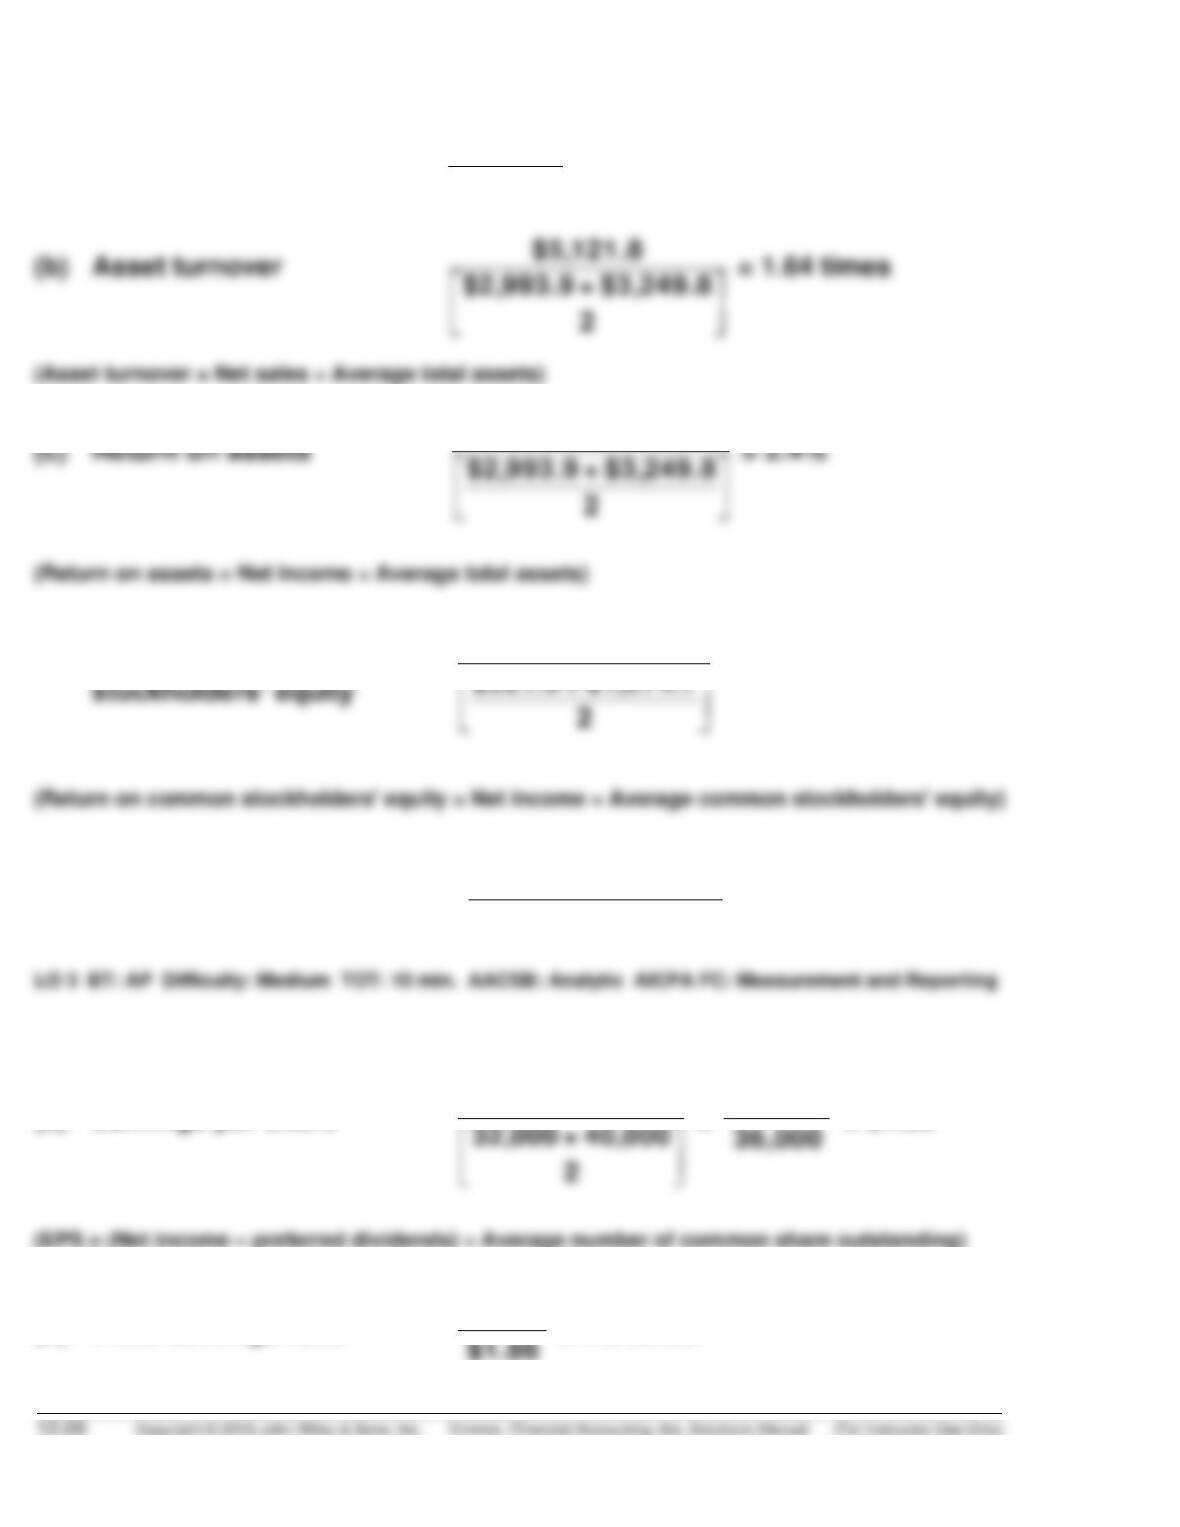
EXERCISE 13-10
(a) Profit margin
$75.9
$5,121.8
= 1.5%
$75.9
(d)
Return on common
$75.9
= 7.6%
(e) Gross profit rate
$5,121.8 – $3,540.6
$5,121.8
= 30.9%
EXERCISE 13-11
(a) Earnings per share
$72,000 – $5,000
=
$67,000
= $1.86
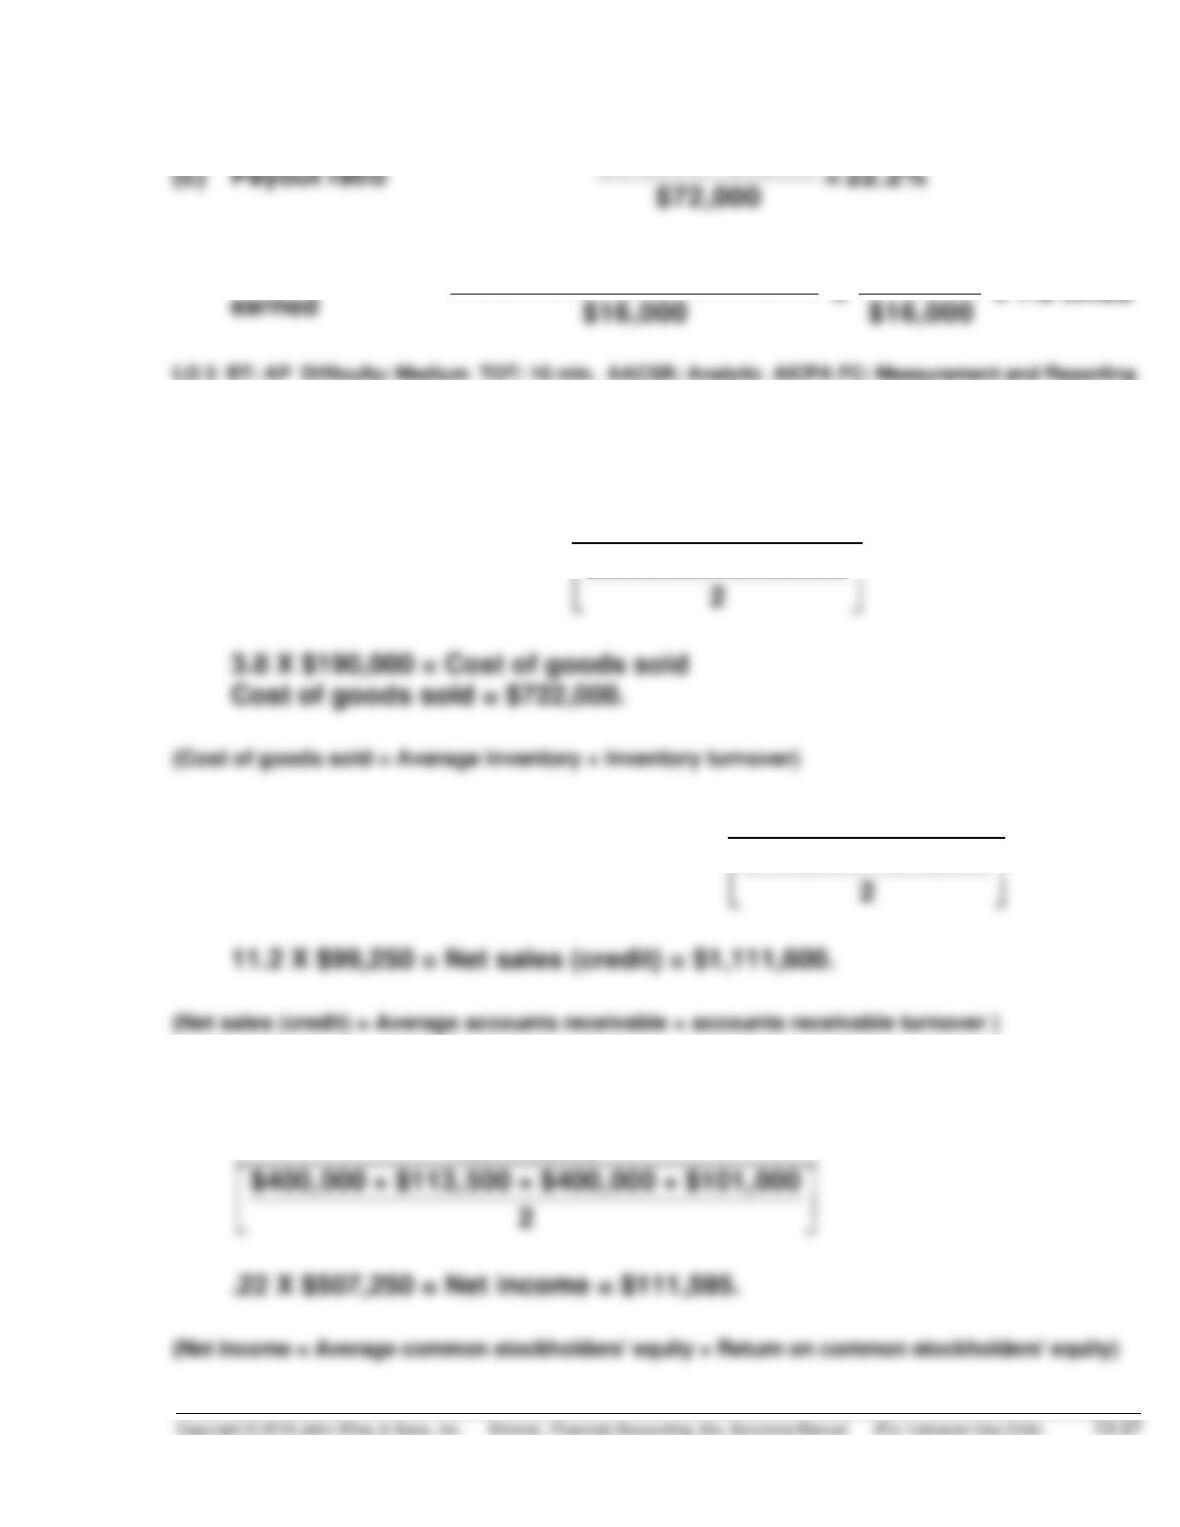
(b) Price-earnings ratio
$14.00
= 7.5 times
EXERCISE 13-11 (Continued)
$21,000 – $5,000 = 22.2%
(d)
Times interest
$72,000 + $16,000 + $24,000
$112,000
EXERCISE 13-12
(a) Inventory turnover = 3.8 =
Cost of goods sold
$200,000 + $180,000
(b) Accounts receivable turnover = 11.2 =
Net sales (credit)
$126,000 + $72,500
(c) Return on common stockholders’ equity = 22% =
Net income
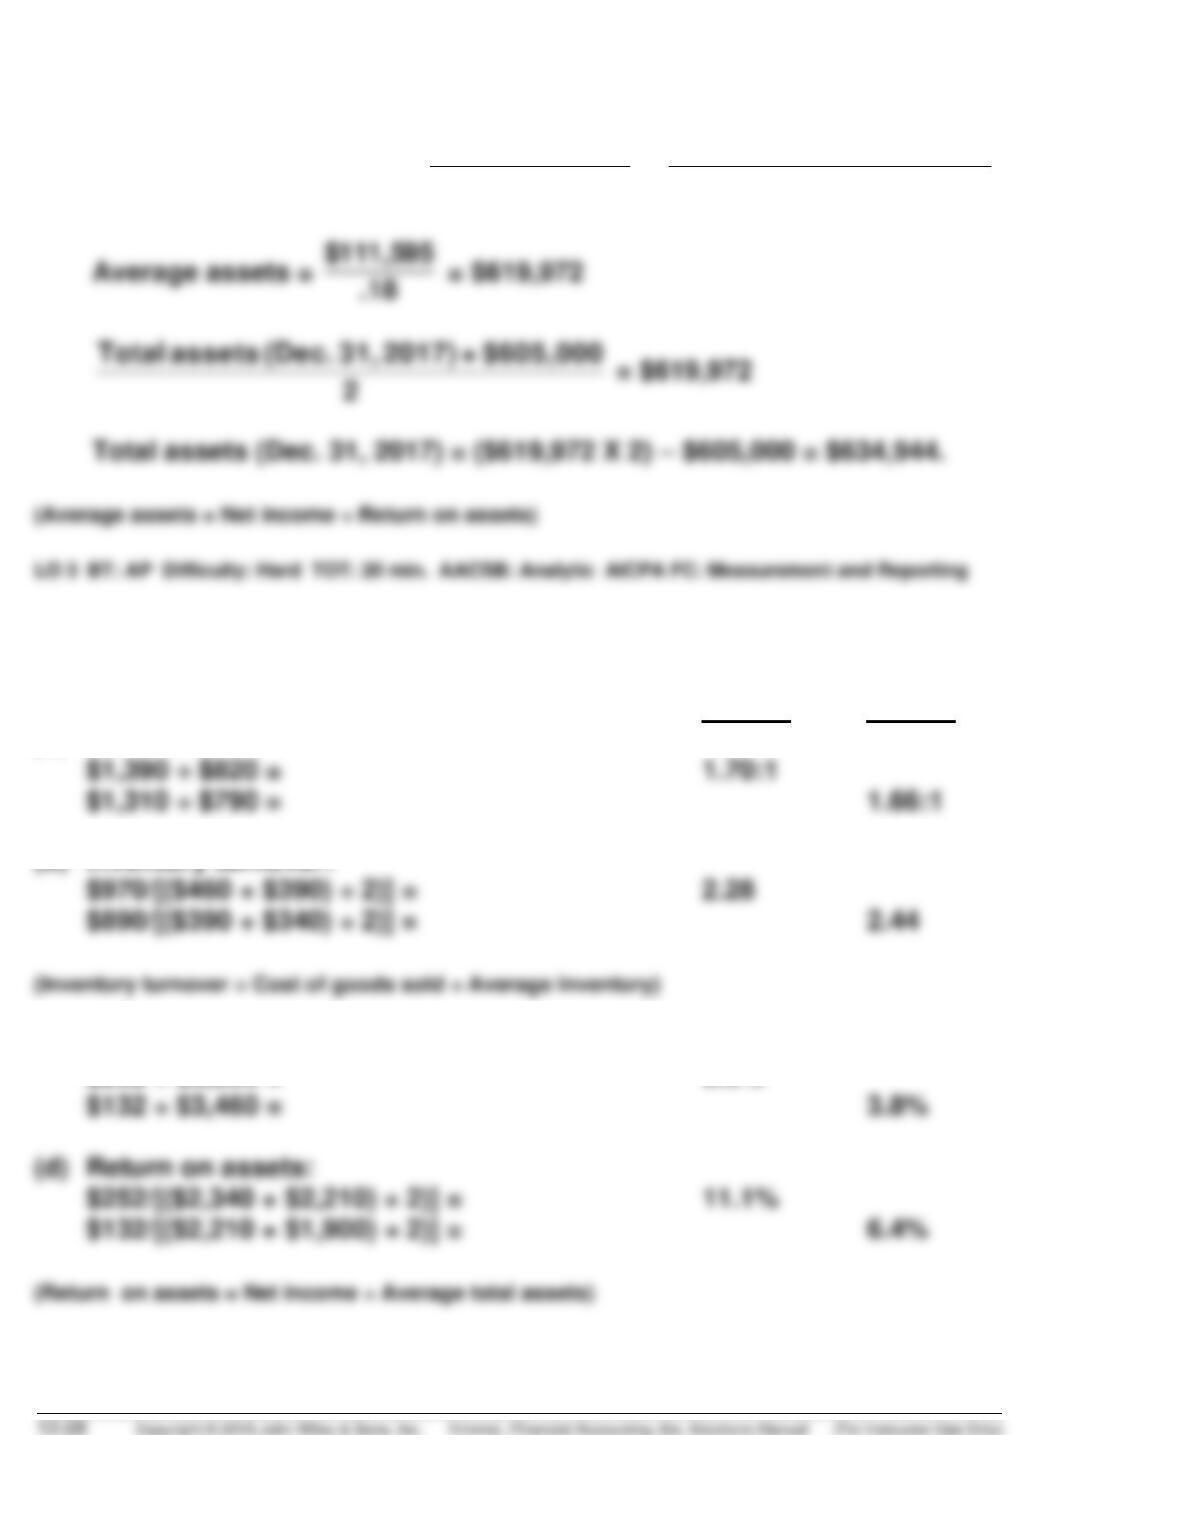
EXERCISE 13-12 (Continued)
(d) Return on assets = 18% =
Net income
Average assets
=
$111,595 [see (c) above]
Average assets
EXERCISE 13-13
2017 2016
(a) Current ratio:
(b) Inventory turnover:
(c) Profit margin:
$252 ÷ $3,800 = 6.6%
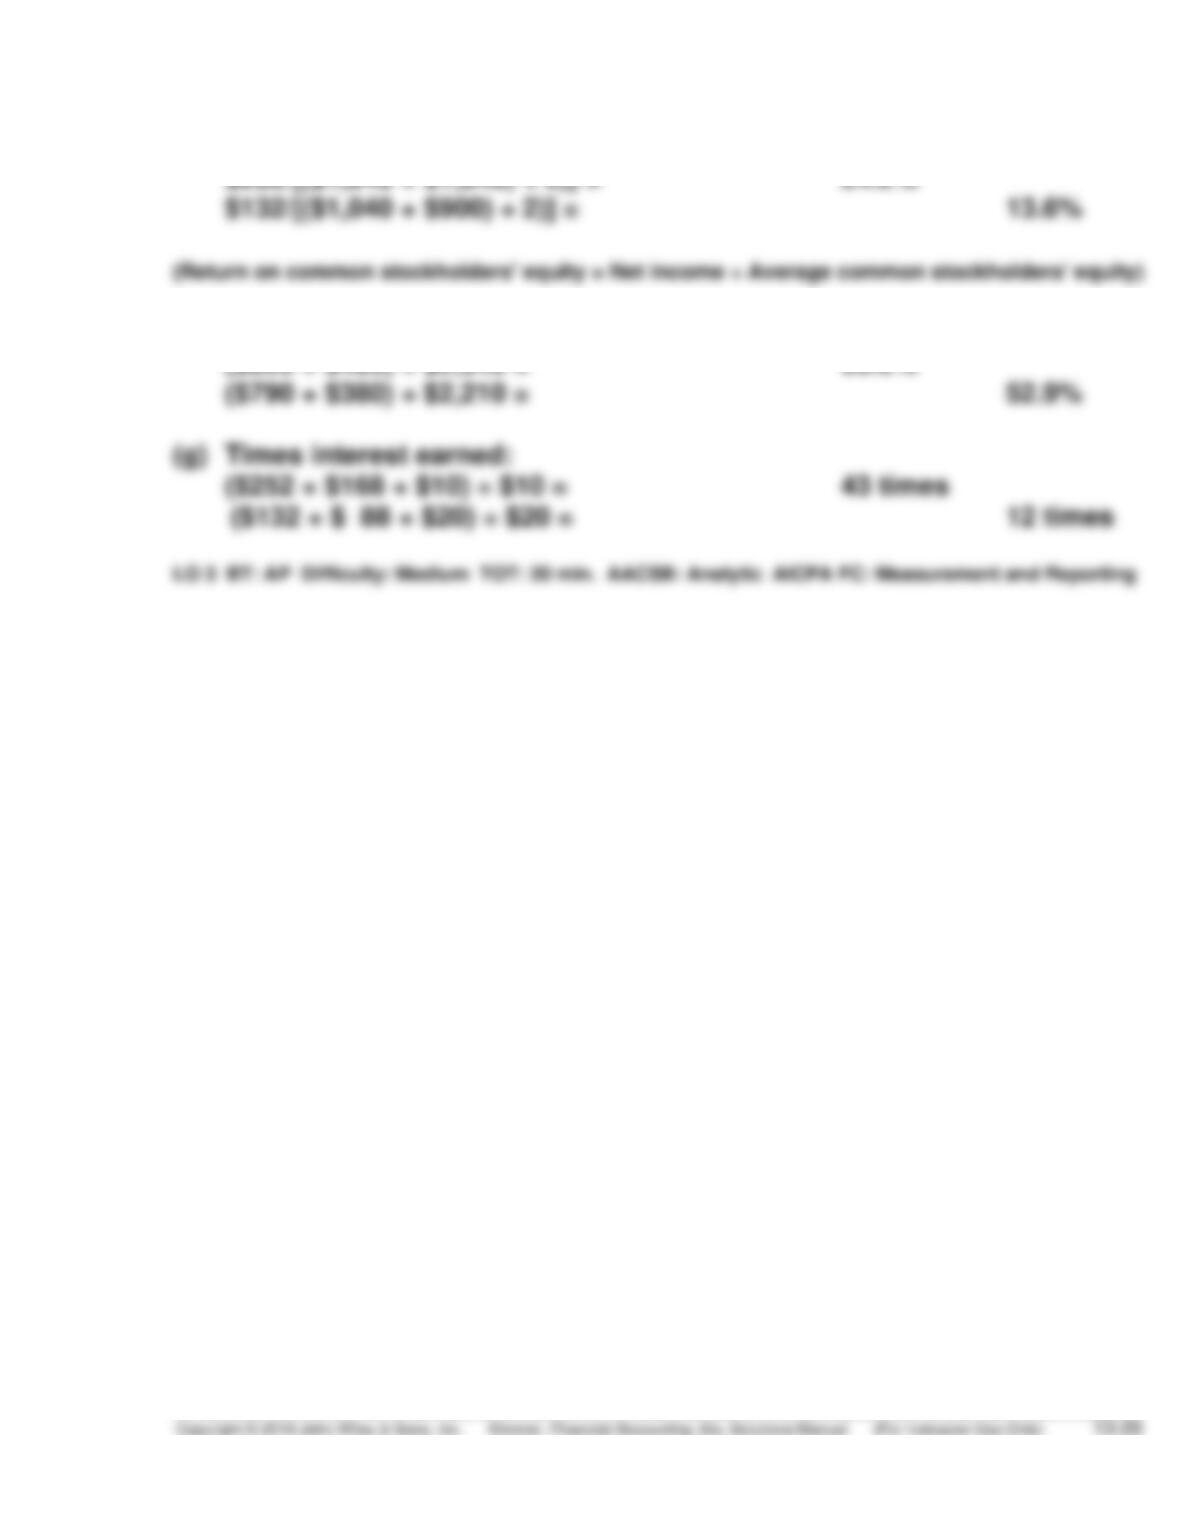
EXERCISE 13-13 (Continued)
(e) Return on common stockholders’ equity:
(f) Debt to assets ratio:
SOLUTIONS TO PROBLEMS
PROBLEM 13-1A
(a) Condensed Income Statement
For the Year Ended December 31, 2017
Duke Company
Lord Company
Dollars
Percent
Dollars
Percent
Net sales
Cost of goods sold
$1,849,000
1,063,200
100.0%
57.5%
$546,000
289,000
100.0%
52.9%
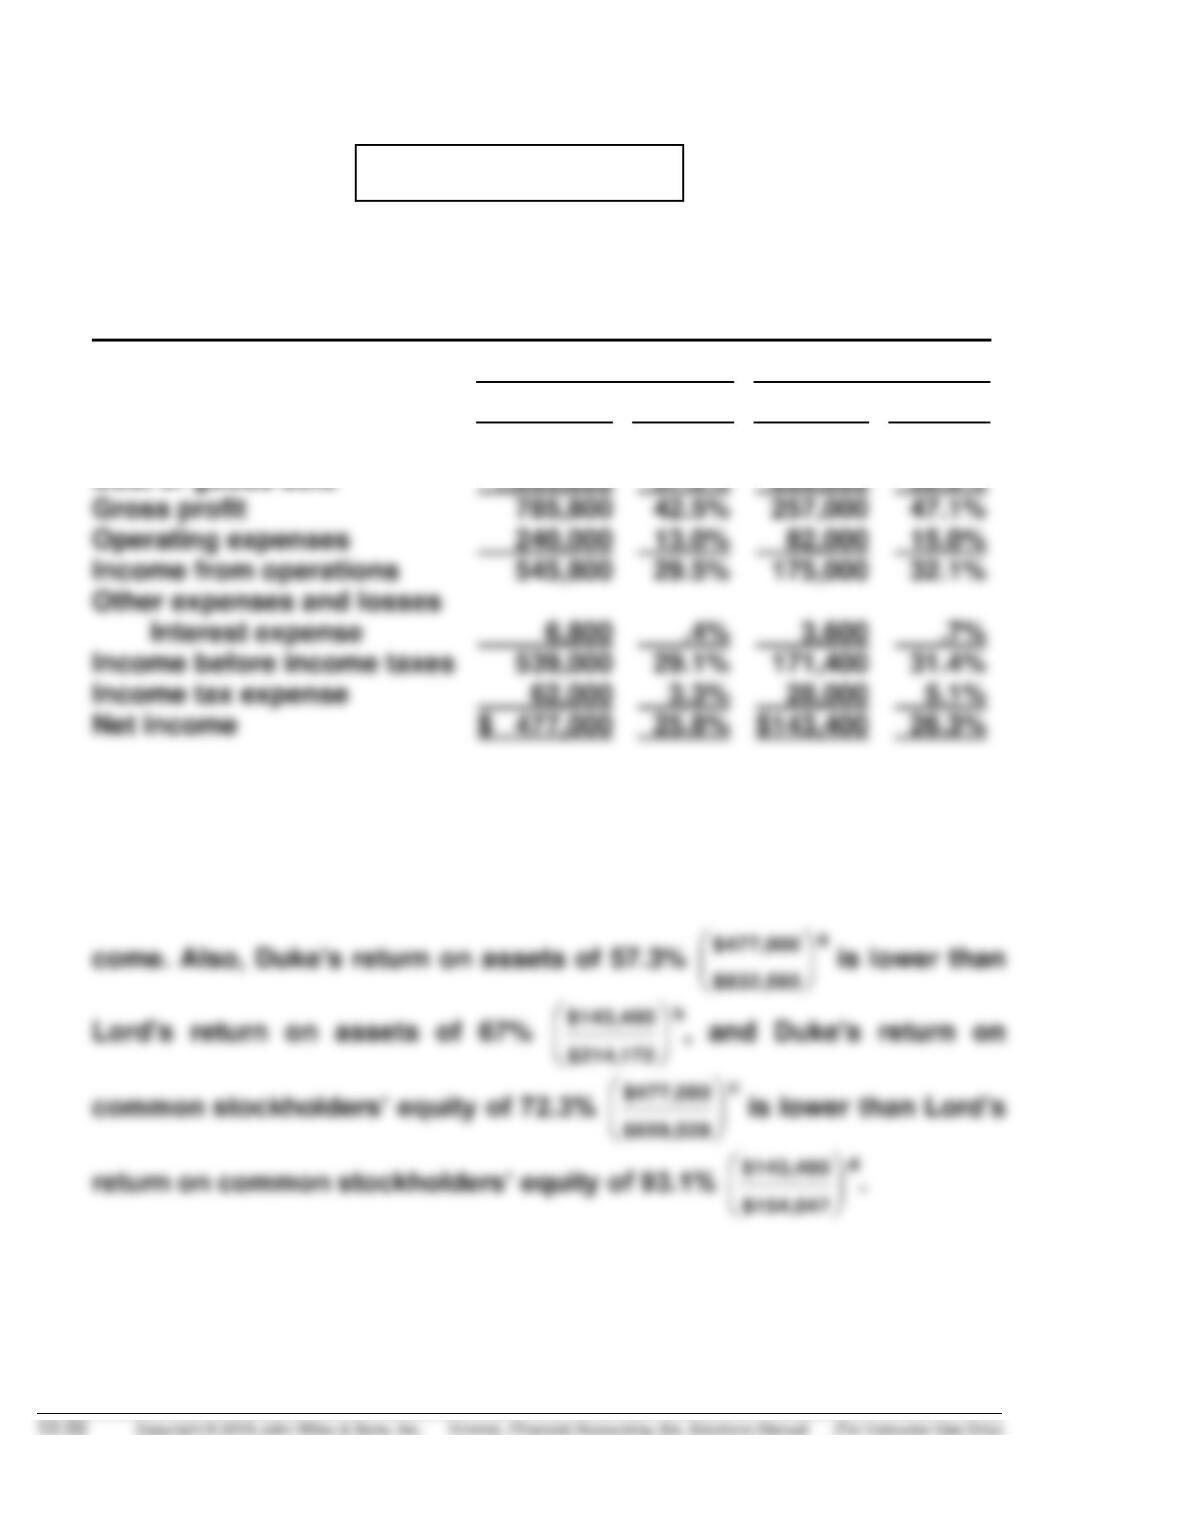
(b) Lord Company appears to be more profitable. It has higher relative
gross profit, income from operations, income before taxes, and net in-
PROBLEM 13-1A (Continued)
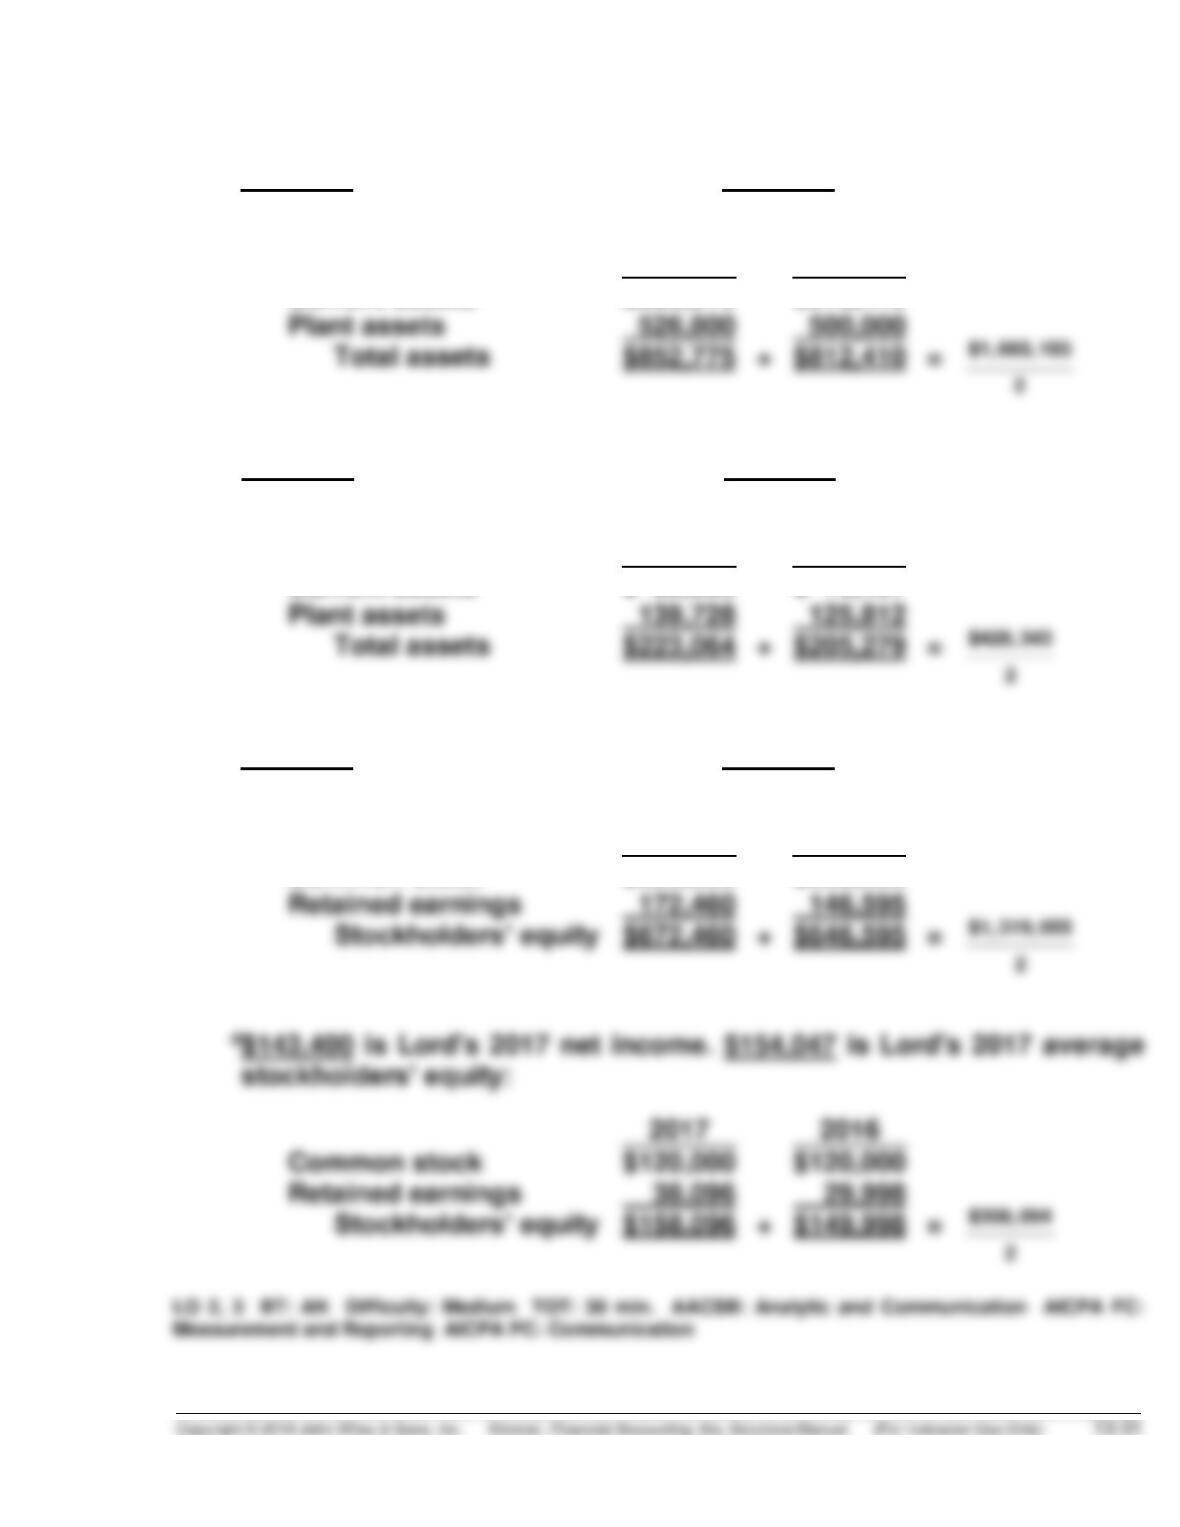
a$477,000 is Duke's 2017 net income. $832,593 is Duke's 2017 average
assets:
2017
2016
Current assets
$325,975
$312,410
b$143,400 is Lord's 2017 net income. $214,172 is Lord's 2017 average
aassets:
2017
2016
Current assets
$ 83,336
$ 79,467
c$477,000 is Duke's 2017 net income. $659,528 is Duke's 2017 average
stockholders’ equity:
2017
2016
Common stock
$500,000
$500,000
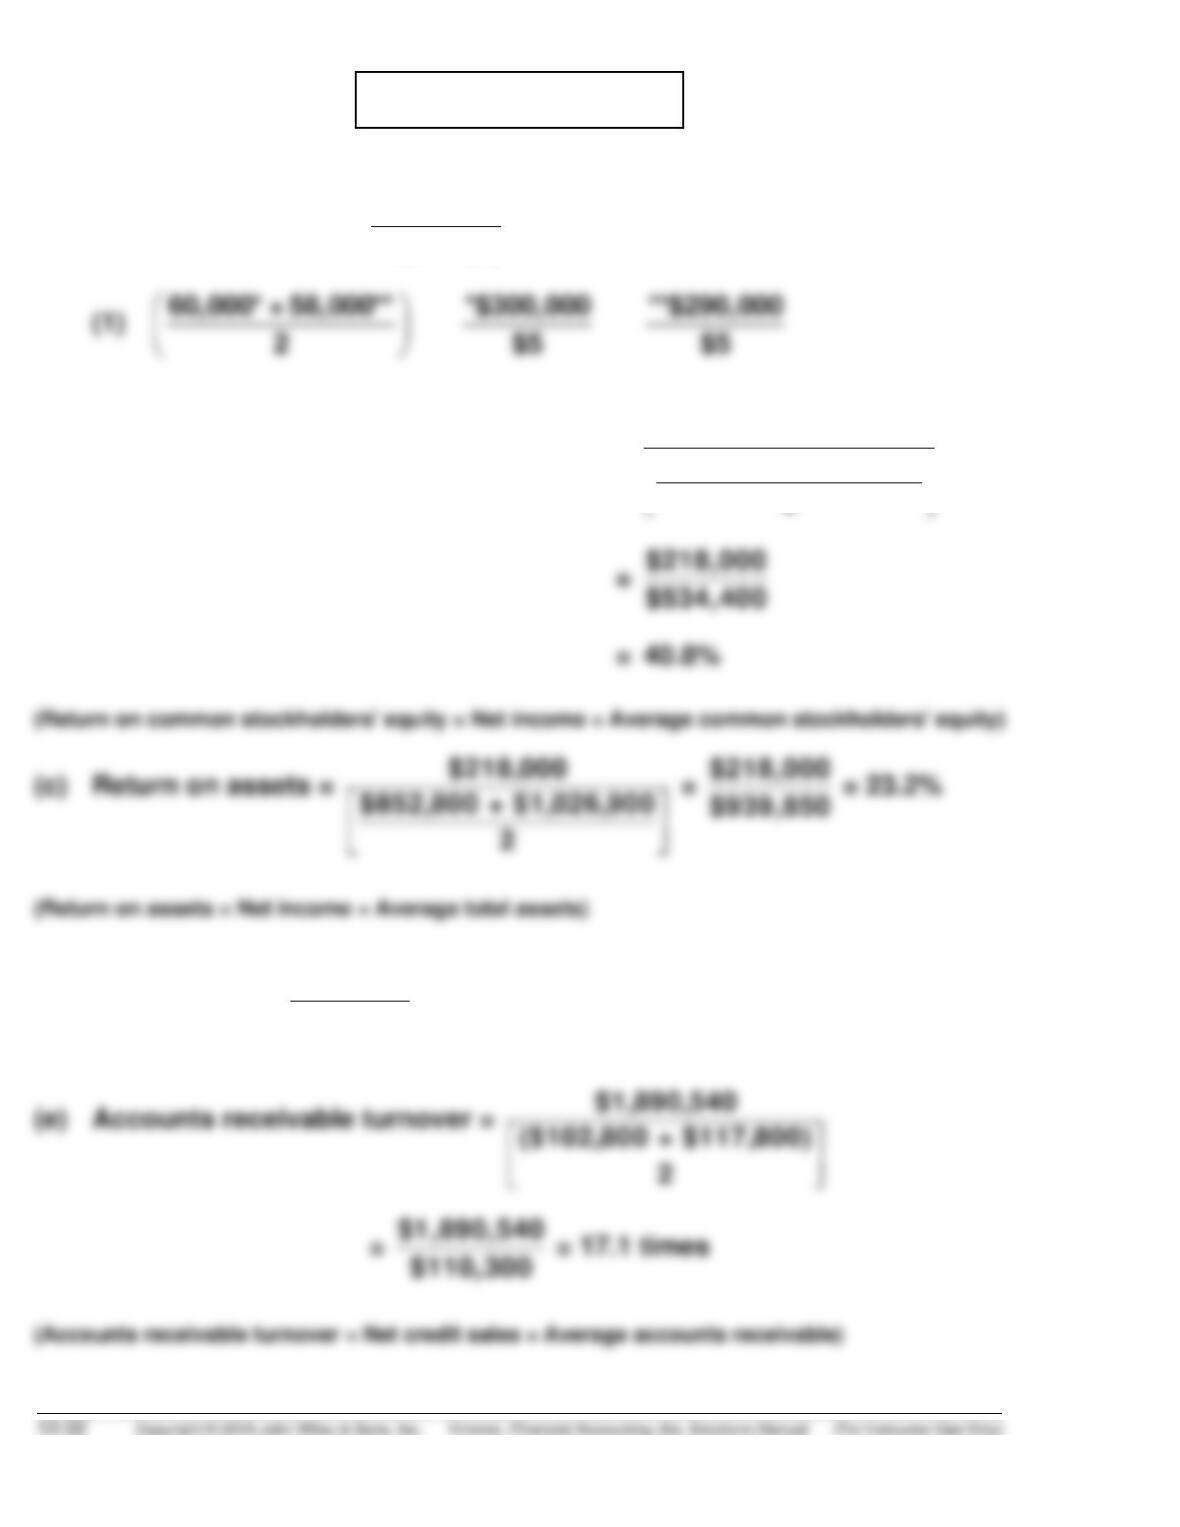
PROBLEM 13-2A
(a) Earnings per share =
$218,000
59,000 (1)
= $3.69
(b) Return on common stockholders’ equity =
$218,000
$465,400 + $603,400
2
(d) Current ratio =
$377,900
$203,500
= 1.86:1
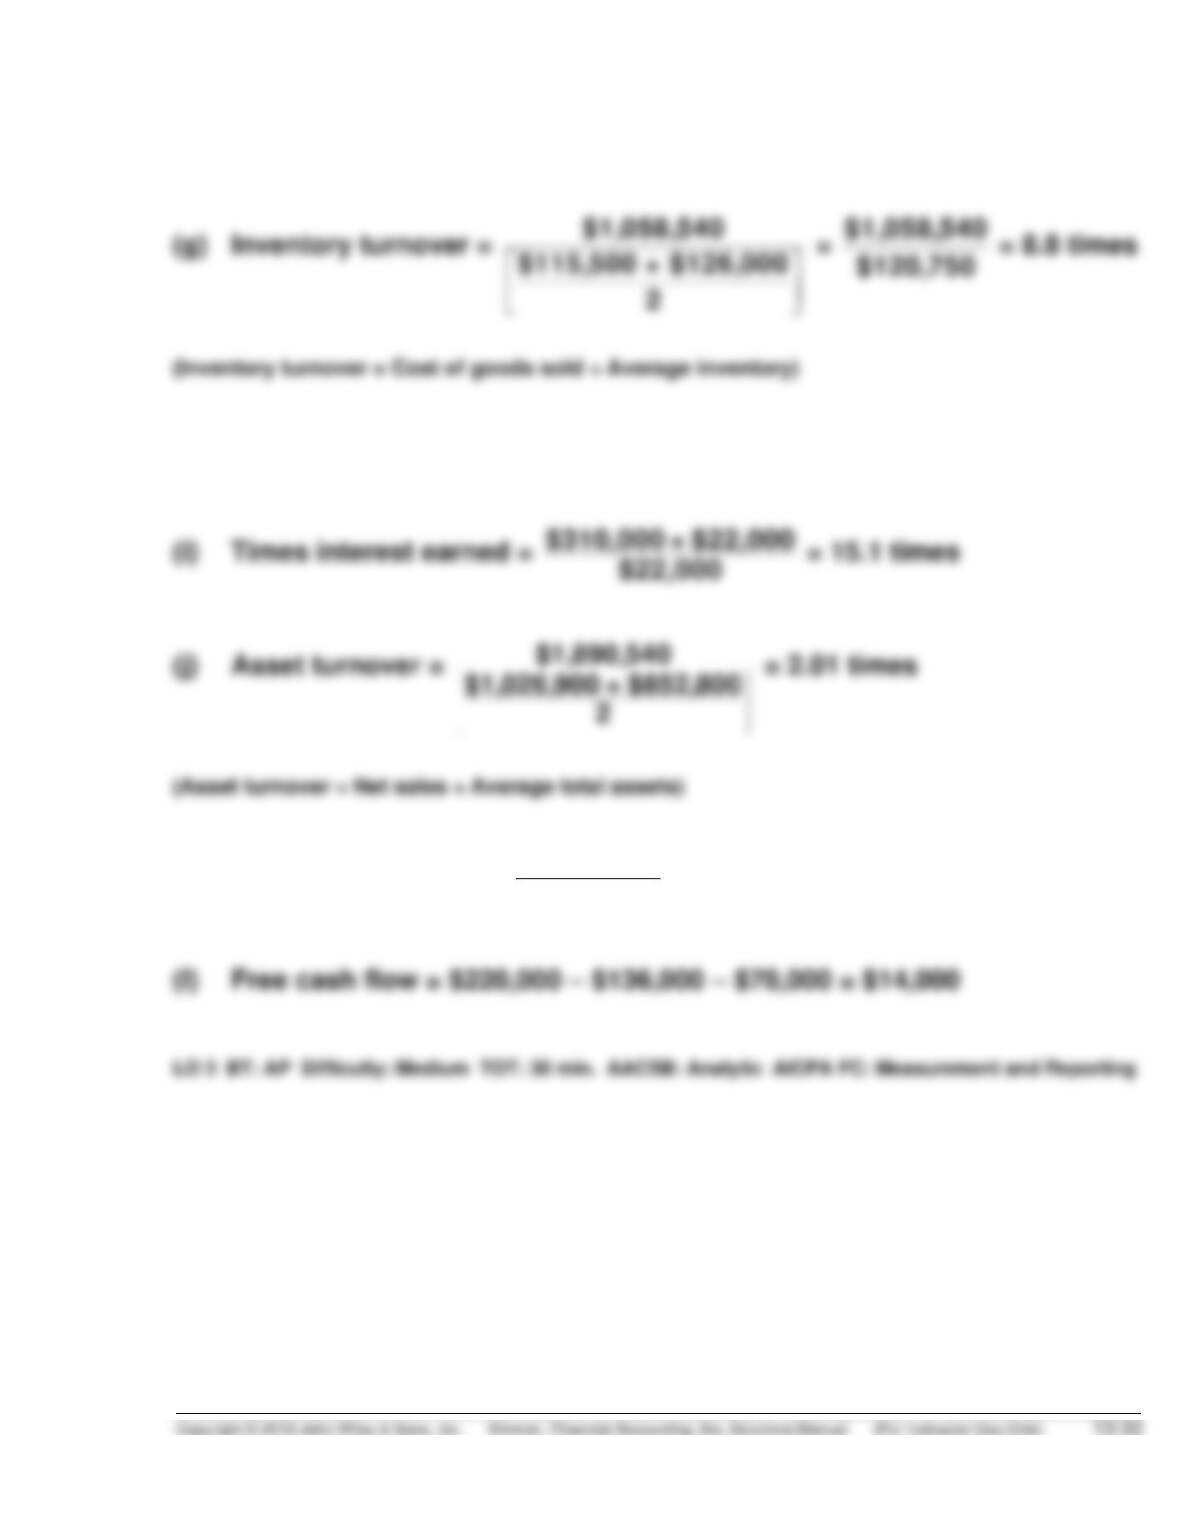
PROBLEM 13-2A (Continued)
(f) Average collection period = 365 days ÷ 17.1 = 21.3 days
(h) Days in inventory = 365 days ÷ 8.8 = 41.5 days
(k) Debt to assets ratio =
$423,500
$1,026,900
= 41%
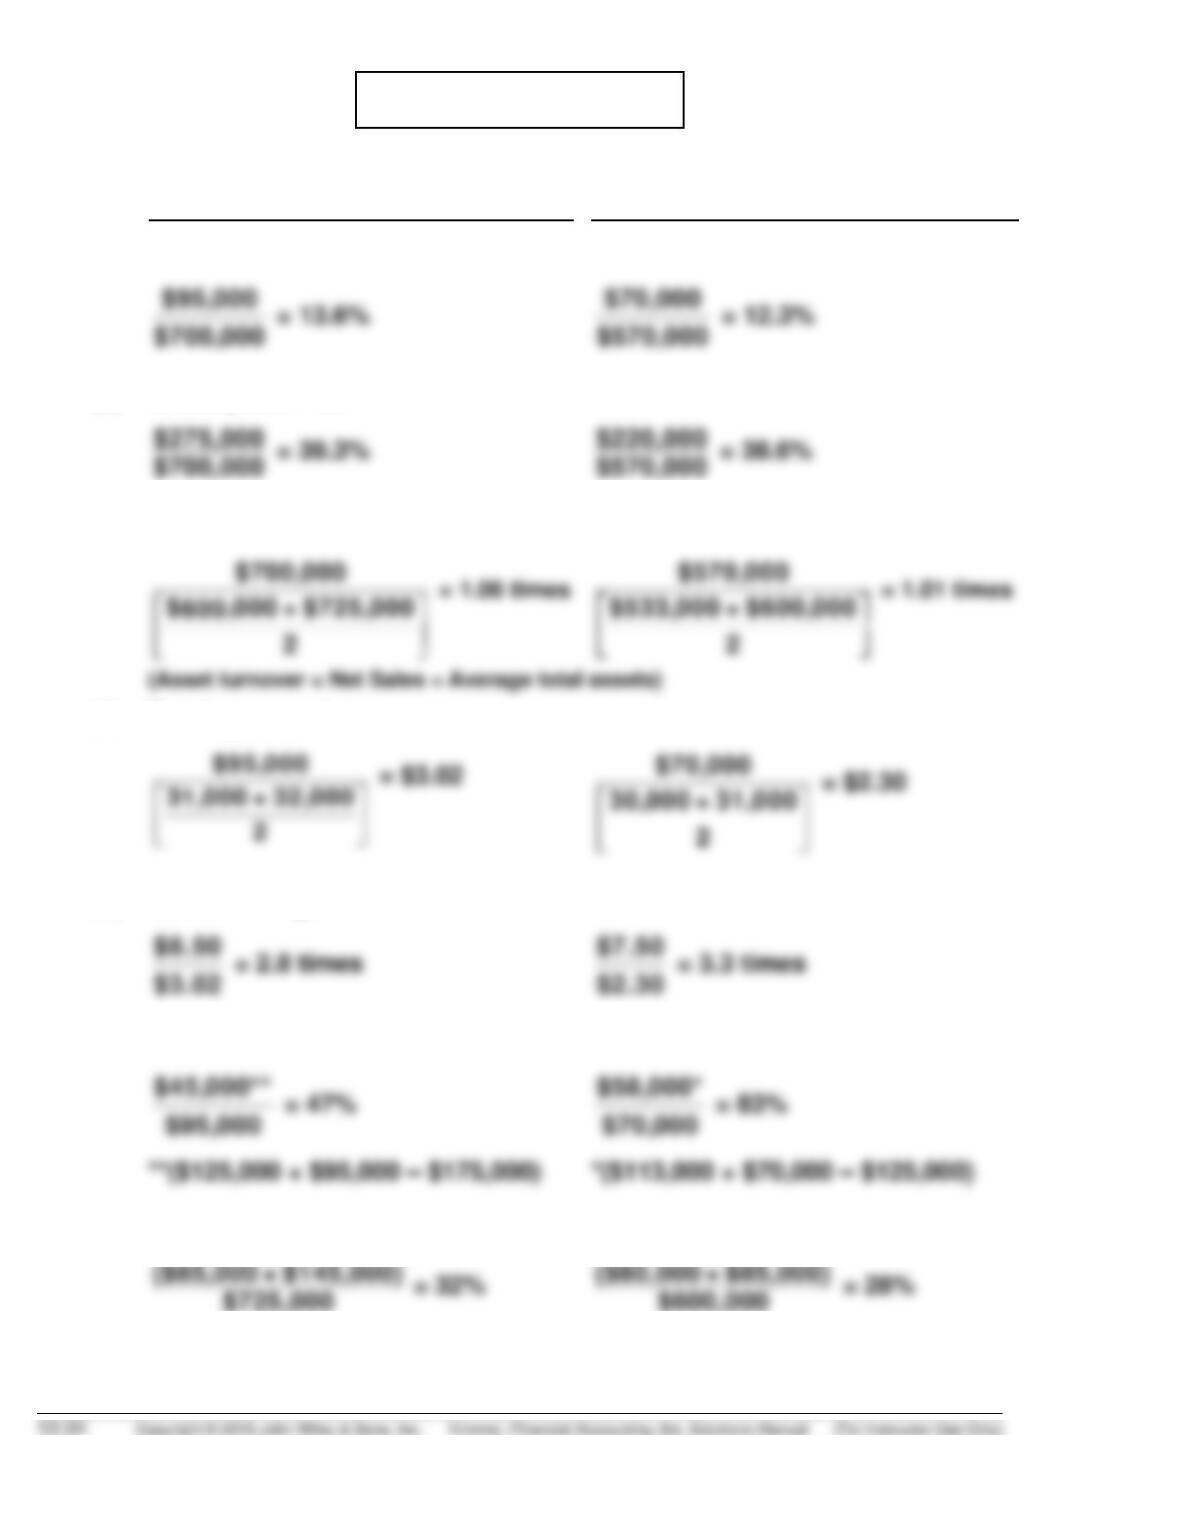
PROBLEM 13-3A
(a)
2017
2016
(1)
Profit margin.
(2)
Gross profit rate.
(3)
Asset turnover.
(4)
Earnings per share.
(5)
Price-earnings ratio.
(6)
Payout ratio.
(7)
Debt to assets ratio.
PROBLEM 13-3A (Continued)
(b) The underlying profitability of the corporation appears to have improved.
For example, profit margin and earnings per share have both increased.
The corporation’s debt to assets ratio has increased but the
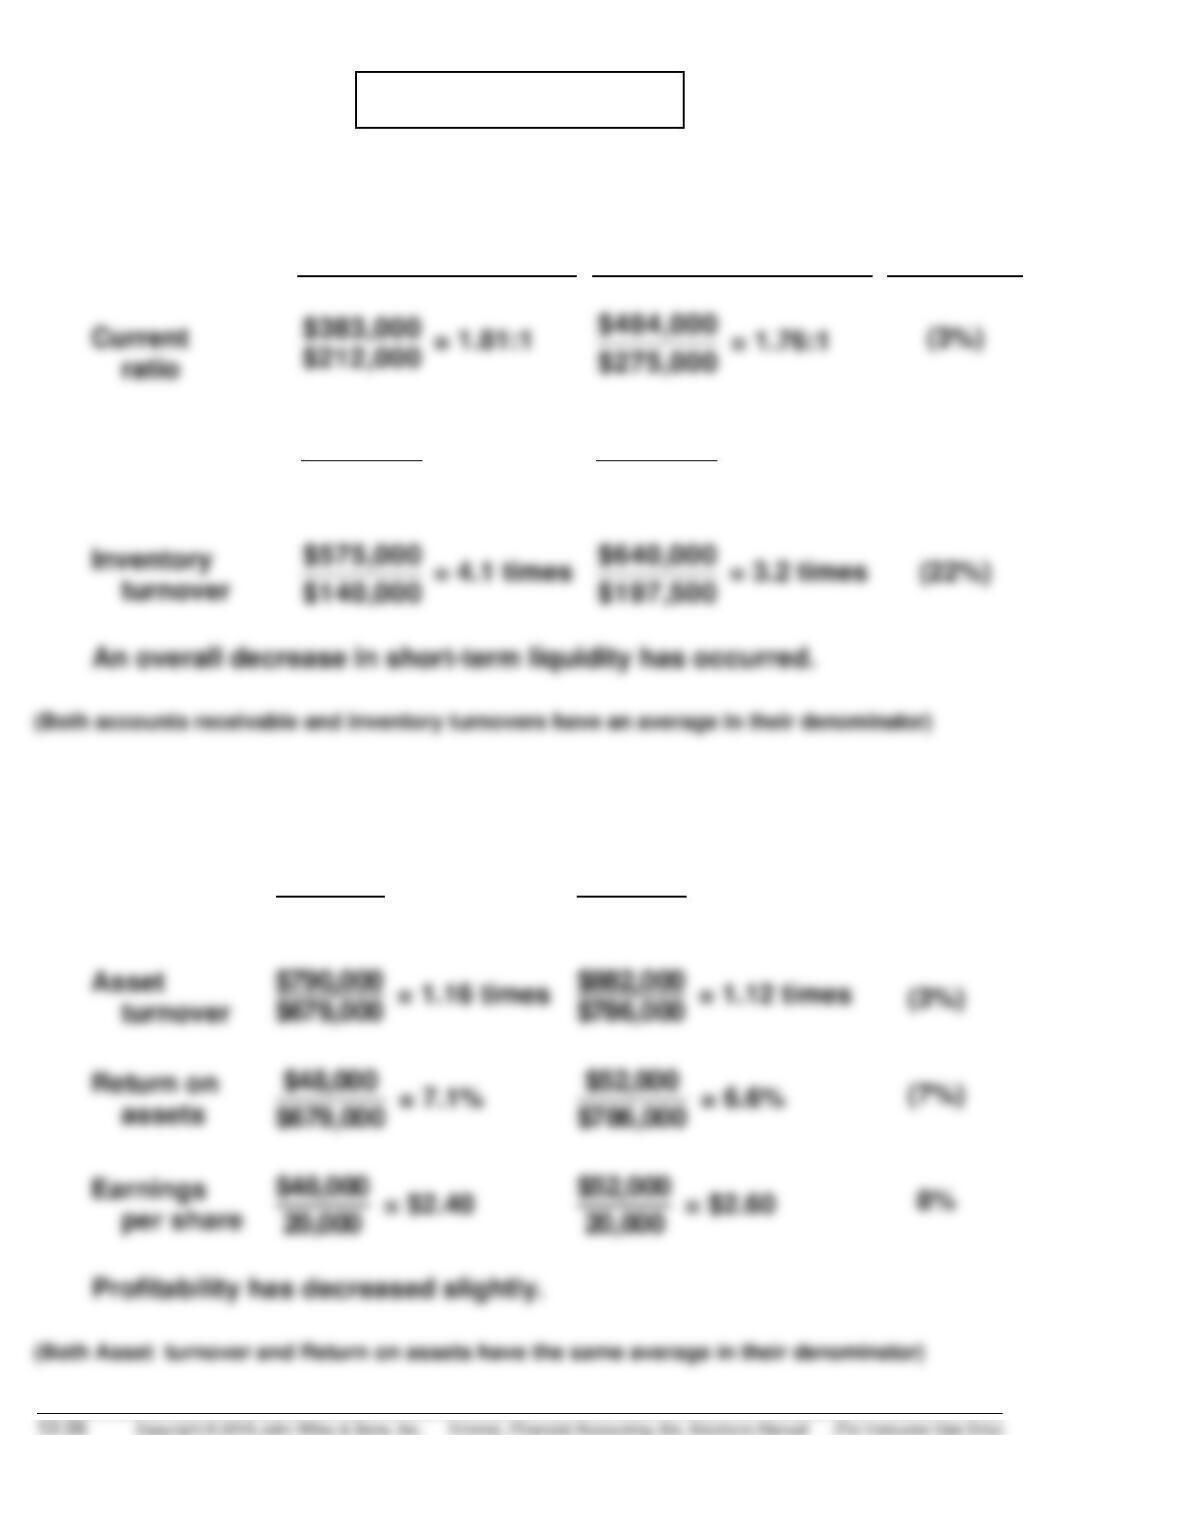
PROBLEM 13-4A
(a) LIQUIDITY
2016
2017
% Change
Accounts
receivable
turnover
$790,000
$88,000
= 9.0 times
$882,000
$97,000
= 9.1 times
1%
PROFITABILITY
Profit
margin
$48,000
$790,000
= 6.1%
$52,000
$882,000
= 5.9%
(3%)
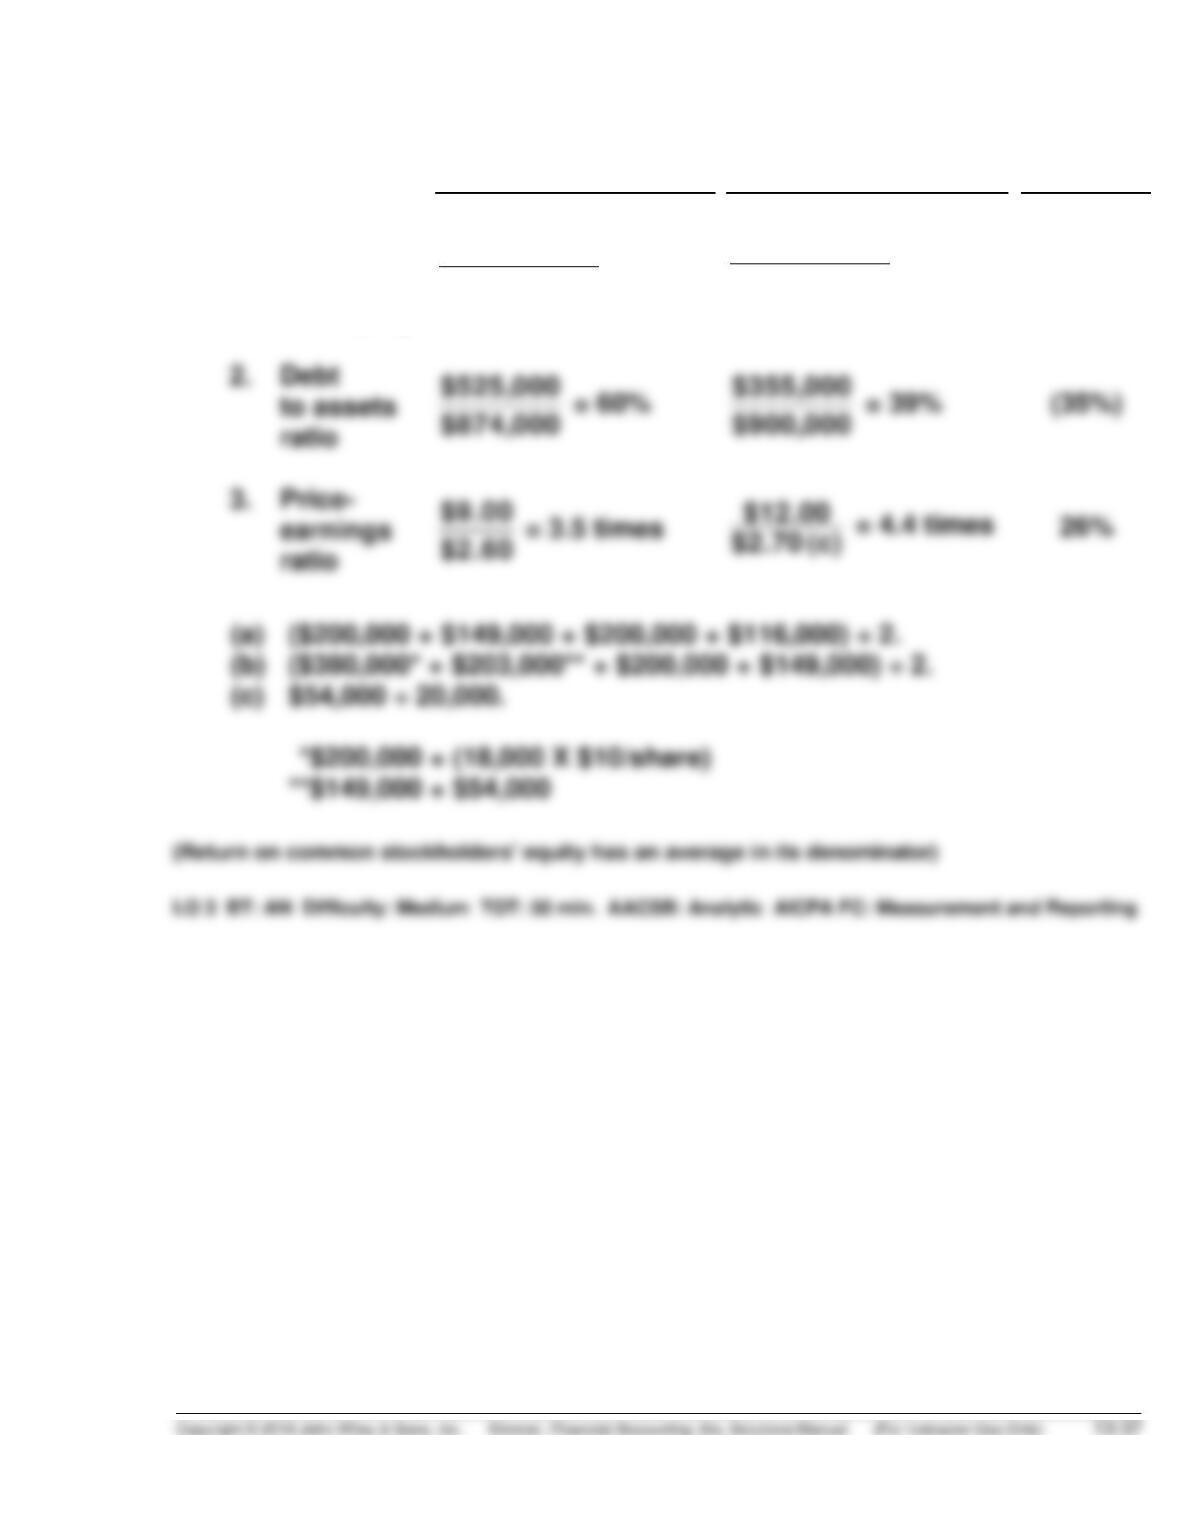
PROBLEM 13-4A (Continued)
(b)
2017
2018
%Change
1.
Return on
common
stockhold-
ers’ equity
$52,000
$332,500 (a)
= 15.6%
$54,000
$466,000 (b)
= 11.6%
(26%)


