FINANCIAL ACCOUNTING – Eleventh Edition Solutions Manual
f.
Gross profit percentage:
2016:
$ 127,000 = 0.51 2015: $ 97,000 = 0.49
$ 250,000 $ 199,000
Chapter 13: Financial Statement Analysis Page 41 of 94
Operating income percentage:
$ 72,000 = 0.29 2015: $ 46,000 = 0.23
$ 250,000 $ 199,000
Earnings per share of common stock:
FINANCIAL ACCOUNTING – Eleventh Edition Solutions Manual
E13-35B
(10-15 min.)
Solution:
a. Price/earnings ratio:
= 25.000 = 17.500
2016
2015
$22.00
$16.80
($91,000 − $6,300*) /
($98,700 − $6,300*) /
Evaluate the common stock of Bastille Distributing Company as an investment.
Specifically, use the three common stock ratios to determine whether the common
stock increased or decreased in attractiveness during the past year. (The number of
common stock shares was the same in 2015 and 2016.) Round calculations and
your final answer to three decimal places.
Chapter 13: Financial Statement Analysis Page 42 of 94
96,250
96,250
$22.00
$16.80
FINANCIAL ACCOUNTING – Eleventh Edition Solutions Manual
E13-36B
(15-20 min.)
Requirements
Solution:
Req. 1
1. Before performing any calculations, which company do you think represents the better
investment? Give your reason.
2. Compute the EVA® for each company, and then decide which company’s stock you
would rather hold as an investment. Assume that both companies’ cost of capital is
12.5%. (Round your EVA® calculation to the nearest whole number.)
Granger Bank Limited appears to represent the better investment. Granger Bank earns a
greater net profit and has significantly more stockholders’ equity than does Daniels
Company, Inc.
Chapter 13: Financial Statement Analysis Page 43 of 94
FINANCIAL ACCOUNTING – Eleventh Edition Solutions Manual
Quiz
Q13-37 a
($19,186 − $15,144 = $4,042 increase;
$4,042 / $15,144 = 0.267)
Chapter 13: Financial Statement Analysis Page 44 of 94
Q13-38 b
FINANCIAL ACCOUNTING – Eleventh Edition Solutions Manual
P13-49A
(20-30 min.)
Requirements
Solution:
Req. 1
2016 2015 2014 2013 2012
Net sales 167% 140% 122% 103% 100%
Net income 189 144 159 126 100
Trend Percentages
Abacus Shipping, Inc.
1. Compute trend percentages for each item for 2013 through 2016. Use 2012 as
the base year and round to the nearest percent.
2. Compute the rate of return on net sales for 2014 through 2016, rounding to
three decimal places. Explain what this means.
3. Compute asset turnover for 2014 through 2016. Explain what this means.
4. Use DuPont Analysis to compute rate of return on average total assets (ROA)
for 2014 through 2016.
5. How does Abacus Shipping’s return on net sales for 2016 compare with
previous years? How does it compare with that of the industry? In the shipping
industry, rates above 9% are considered good, and rates above 11% are
outstanding.
6. Evaluate Abacus Shipping, Inc.’s, ROA for 2016, compared with previous years
and against an 18% benchmark for the industry.
Chapter 13: Financial Statement Analysis Page 45 of 94
Total assets 148 130 124 111 100
FINANCIAL ACCOUNTING – Eleventh Edition Solutions Manual
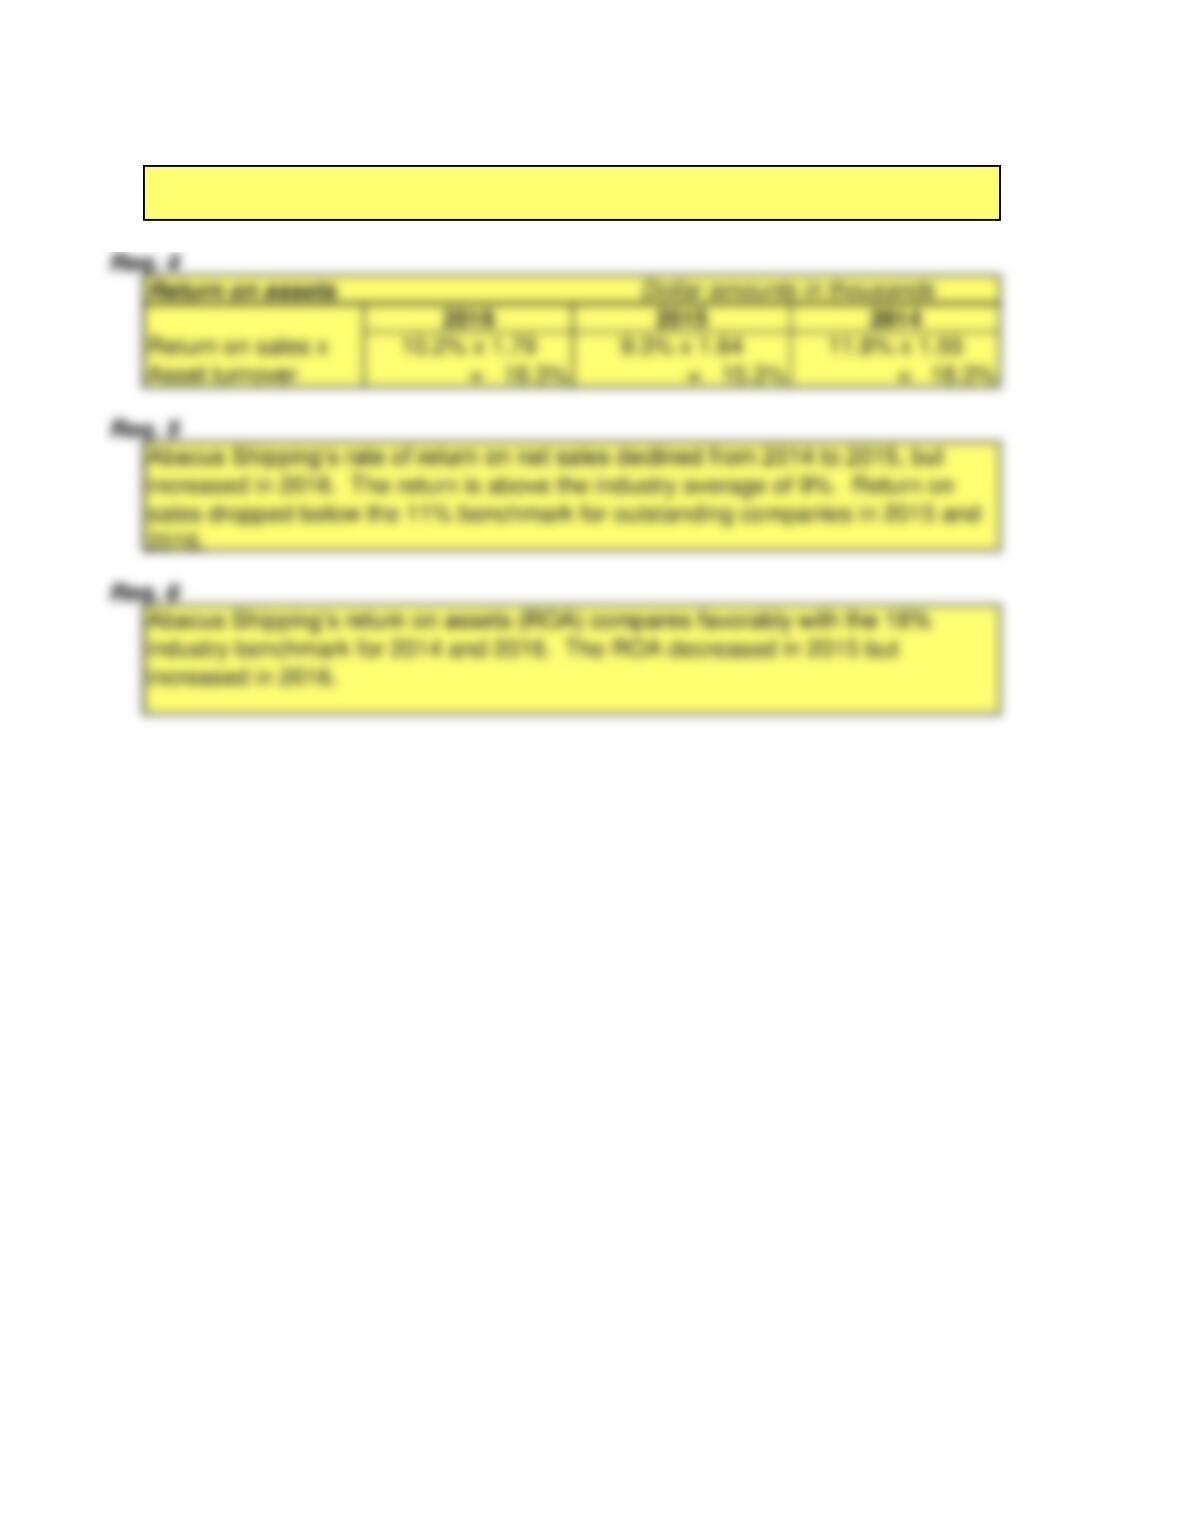
Asset turnover means the amount of net sales per dollar invested in assets. High
ratios mean high efficiency (low cost).
Chapter 13: Financial Statement Analysis Page 46 of 94
FINANCIAL ACCOUNTING – Eleventh Edition Solutions Manual
P13-50A
(20-30 min.)
Requirements
Solution:
Req. 1
Net sales 100.0% 100.0%
1. Prepare a common-size income statement and balance sheet for Bryan Products.
The first column of each statement should present Bryan Products’ common-size
statement, and the second column should show the industry averages.
2. For the profitability analysis, compare Bryan Products’ (a) ratio of gross profit to net
sales, (b) ratio of operating income to net sales, and (c) ratio of net income to net sales
with the industry averages. Is Bryan Products’ profit performance better or worse than
the average for the industry?
3. For the analysis of financial position, compare Bryan Products’ (a) ratios of current
assets and current liabilities to total assets and (b) ratio of stockholders’ equity to total
assets. Compare these ratios with the industry averages. Is Bryan Products’ financial
position better or worse than the average for the industry?
Bryan
Products
INDUSTRY
AVERAGE
Bryan Products, Inc.
Common-Size Income Statement Compared to Industry Average
Year Ended December 31, 2016
Chapter 13: Financial Statement Analysis Page 47 of 94
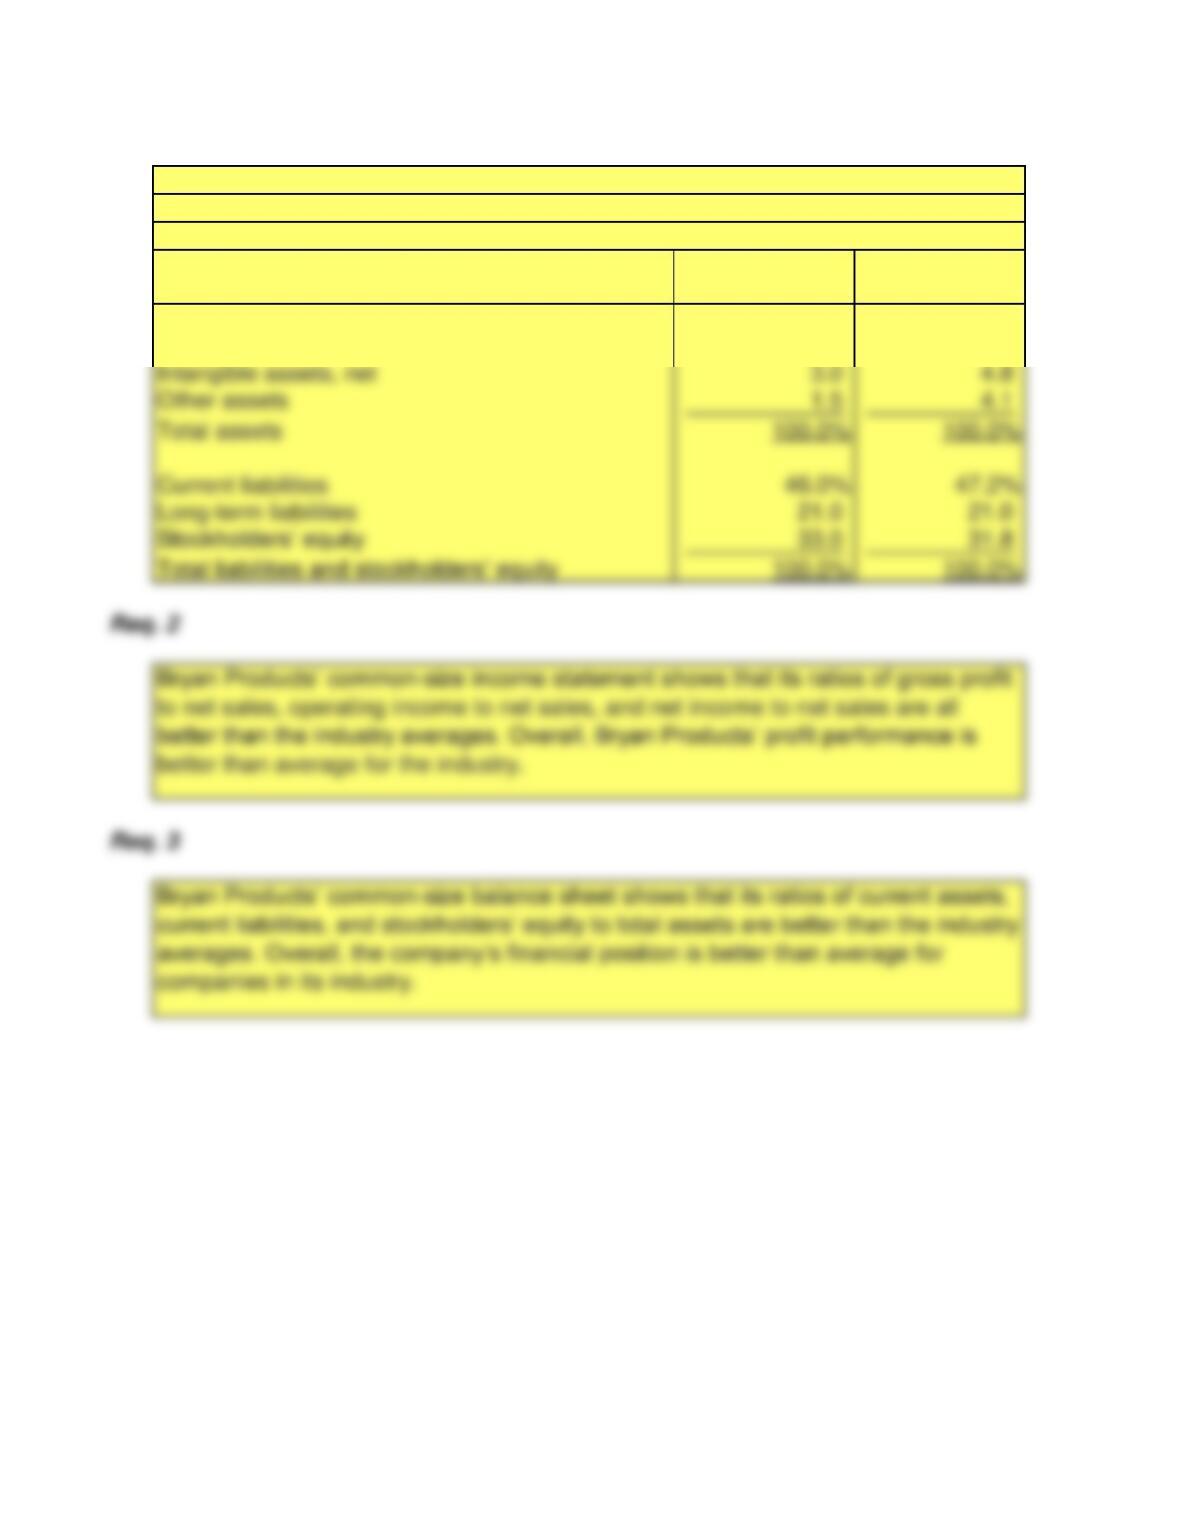
Gross profit 48.0 42.7
Operating income 26.0 13.3
Net income 24.5% 10.8%
FINANCIAL ACCOUNTING – Eleventh Edition Solutions Manual
Current assets 77.0% 72.1%
Fixed assets, net 18.5 19.0
Bryan Products, Inc.
Common-Size Income Statement Compared to Industry Average
December 31, 2016
Bryan
Products
INDUSTRY
AVERAGE
Chapter 13: Financial Statement Analysis Page 48 of 94
Intangible assets, net 3.0 4.8
Total assets 100.0% 100.0%
Current liabilities 46.0% 47.2%
Long-term liabilities 21.0 21.0
FINANCIAL ACCOUNTING – Eleventh Edition Solutions Manual
P13-51A
(20-30 min.)
Requirement
Solution:
1. Discuss the relative strengths and weaknesses of Chattanooga Flights, Inc.,
and Eastern Airlines. Conclude your discussion by recommending one of the
companies’ stocks as an investment.
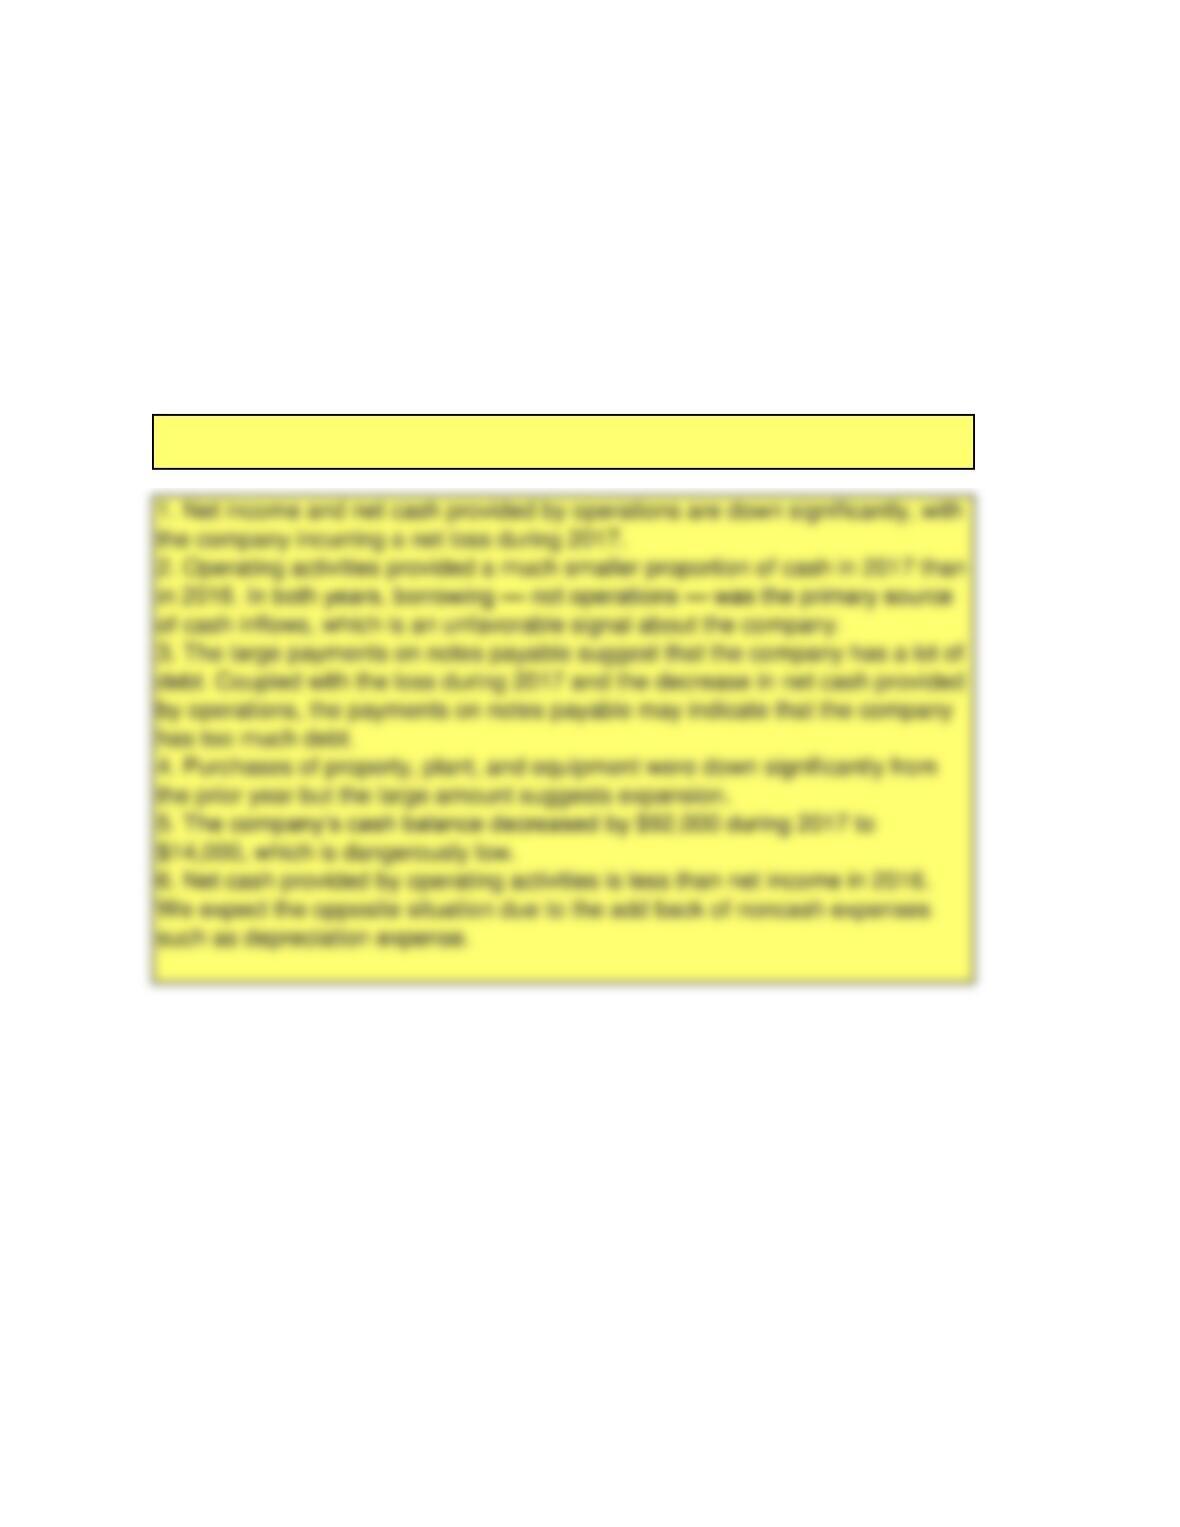
Chattanooga Flight’s statement of cash flows reveals only one strong point, a
continuing purchase of plant assets. The company’s weaknesses include:
Chapter 13: Financial Statement Analysis Page 49 of 94
FINANCIAL ACCOUNTING – Eleventh Edition Solutions Manual
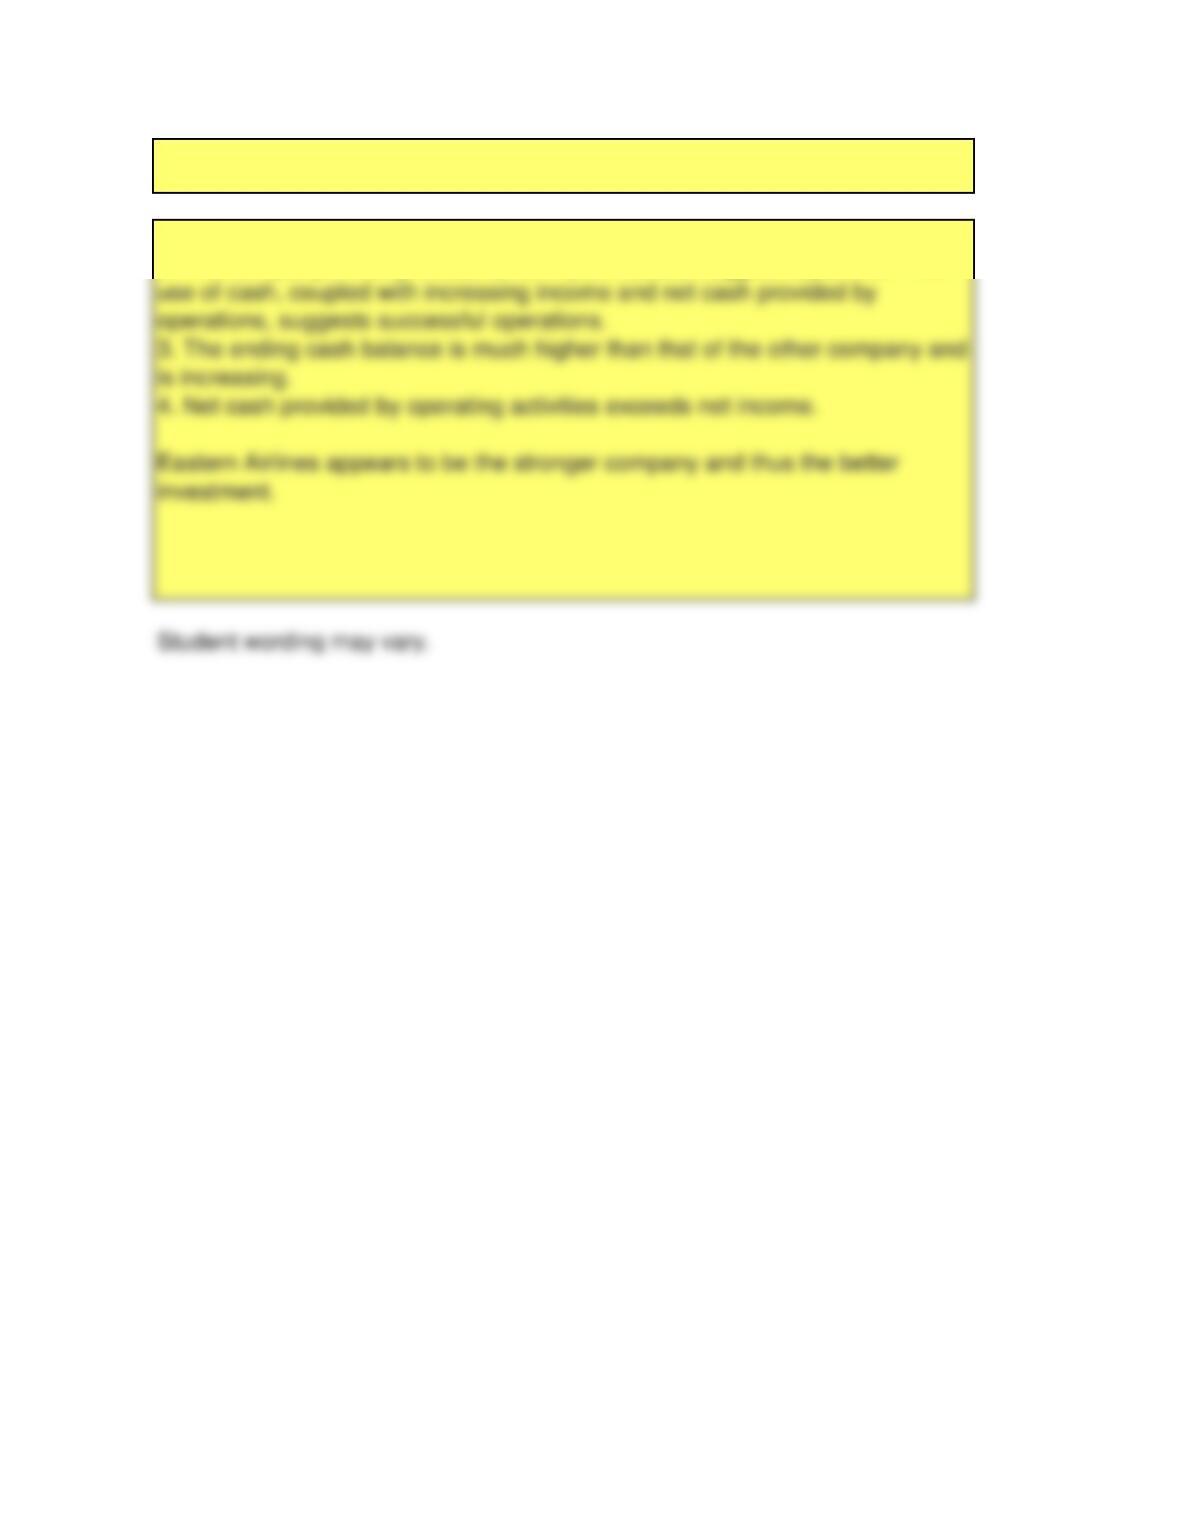
Eastern Airlines’ statement of cash flows reveals the following strengths (no
significant weaknesses):
1. During both years, operating activities were the major source of cash.
2. The company’s heavy investments in plant assets suggest expansion. The
Chapter 13: Financial Statement Analysis Page 50 of 94
FINANCIAL ACCOUNTING – Eleventh Edition Solutions Manual
P13-52A
(30-40 min.)
Requirements
Solution:
Req. 1
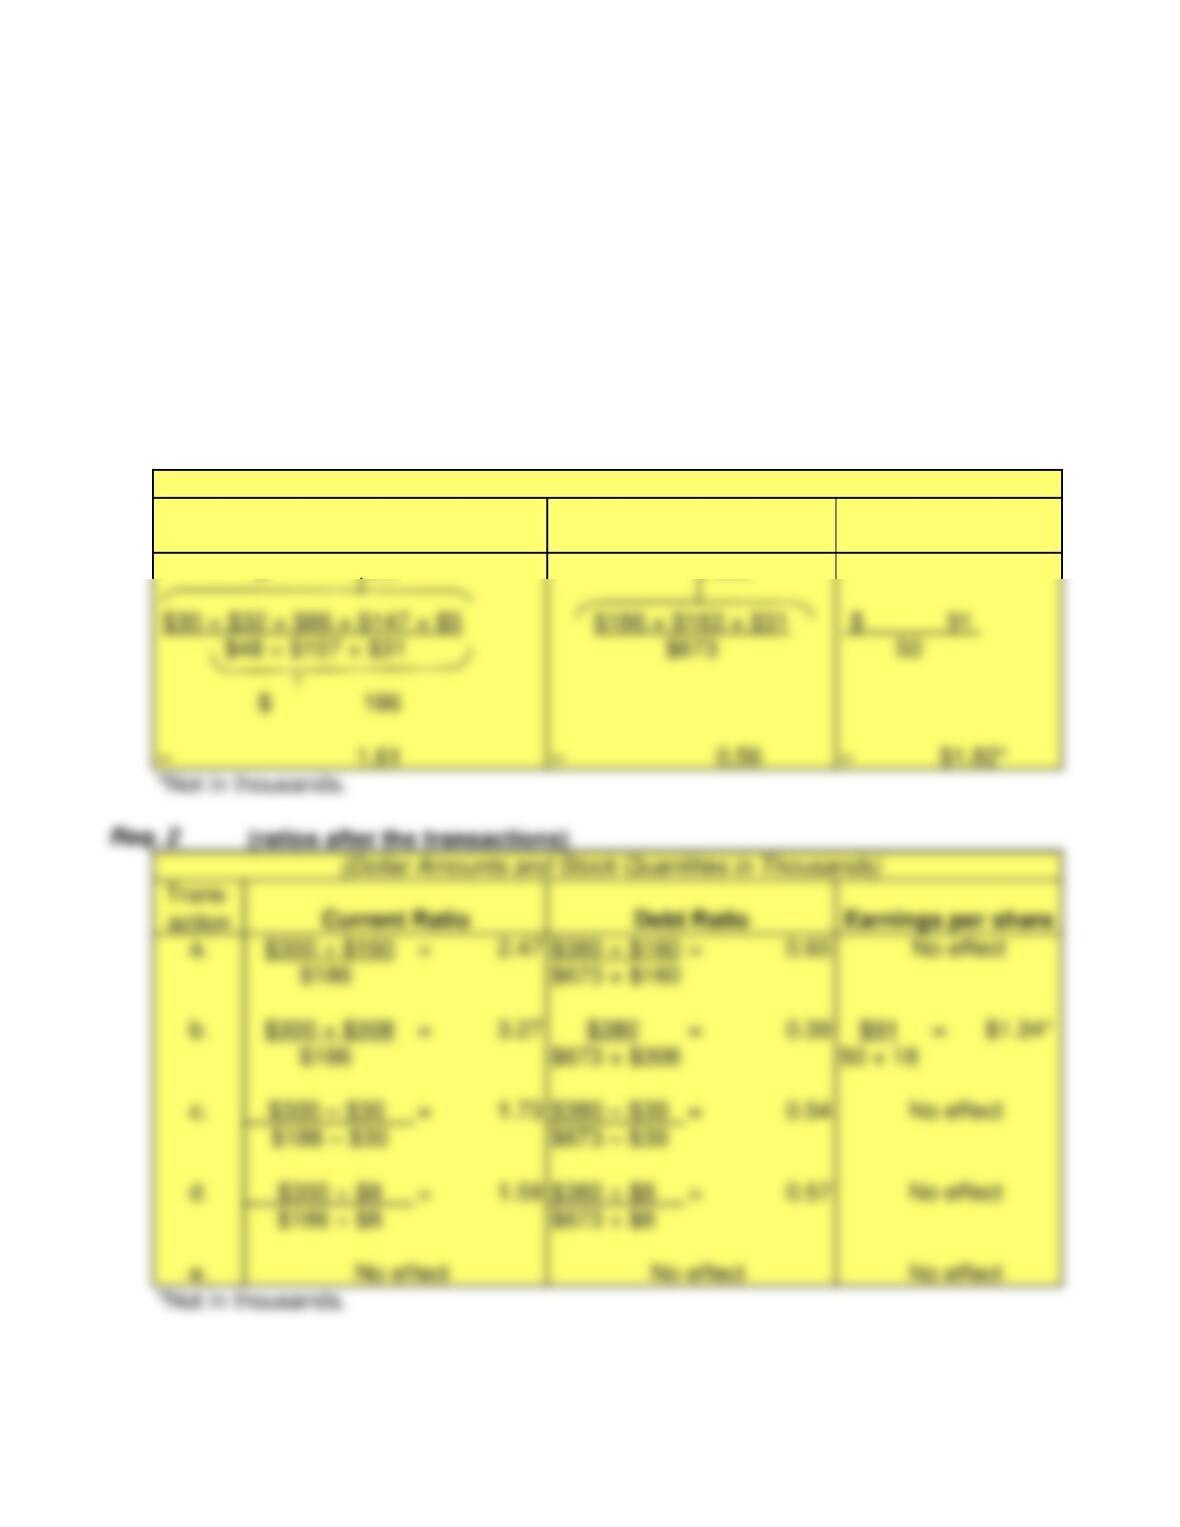
$ 300 $ 380
1. Compute Morgan’s current ratio, debt ratio, and earnings per share. Round
all ratios to two decimal places.
2. Compute the three ratios after evaluating the effect of each transaction that
follows. Consider each transaction separately.
(Dollar Amounts and Stock Quantities in Thousands)
Debt Ratio
Current Ratio
Earnings per share
Chapter 13: Financial Statement Analysis Page 51 of 94
Earnings per share
FINANCIAL ACCOUNTING – Eleventh Edition Solutions Manual
P13-53A
(40-50 min.)
Requirements
Solution:
Req. 1
a. Current ratio 563$ = 1.98 562$ = 1.92
285$ 292$
(Dollar Amounts and Stock Quantities in Thousands)
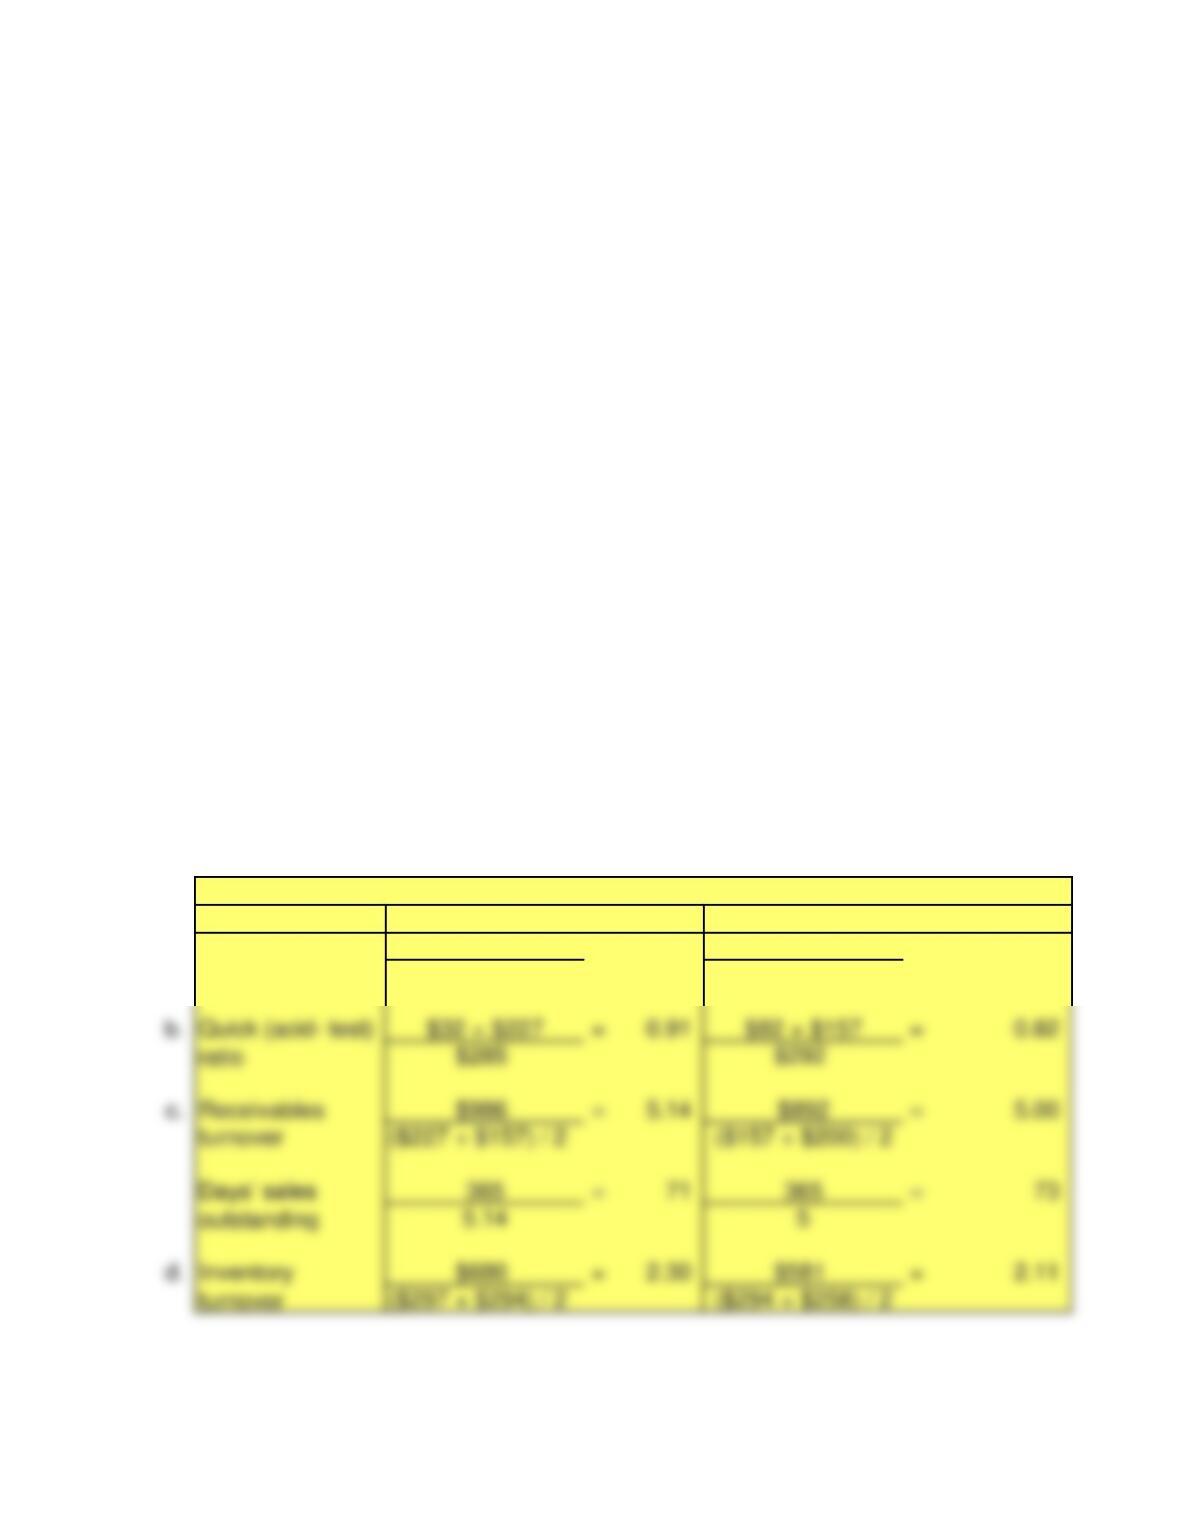
1. Compute the following ratios for 2016 and 2015:
a. Current ratio
b. Quick (acid-test) ratio
c. Receivables turnover and days’ sales outstanding (DSO) (round to the nearest whole
day)
d. Inventory turnover and days’ inventory outstanding (DIO) (round to the nearest whole
day)
e. Accounts payable turnover and days’ payable outstanding (DPO) (use cost of goods
sold in the numerator of the turnover ratio and round DPO to the nearest whole day).
f. Cash conversion cycle (in days)
g. Times-interest-earned ratio
h. Return on assets (use DuPont Analysis)
i. Return on common stockholders’ equity (use DuPont Analysis)
j. Earnings per share of common stock
k. Price-earnings ratio
2. Decide whether (a) Sanfield’s financial position improved or deteriorated during 2016
and (b) whether the investment attractiveness of Sanfield’s common stock appears to
have increased or decreased.
3. How will what you learned in this problem help you evaluate an investment?
2015
2016
Chapter 13: Financial Statement Analysis Page 52 of 94
FINANCIAL ACCOUNTING – Eleventh Edition Solutions Manual
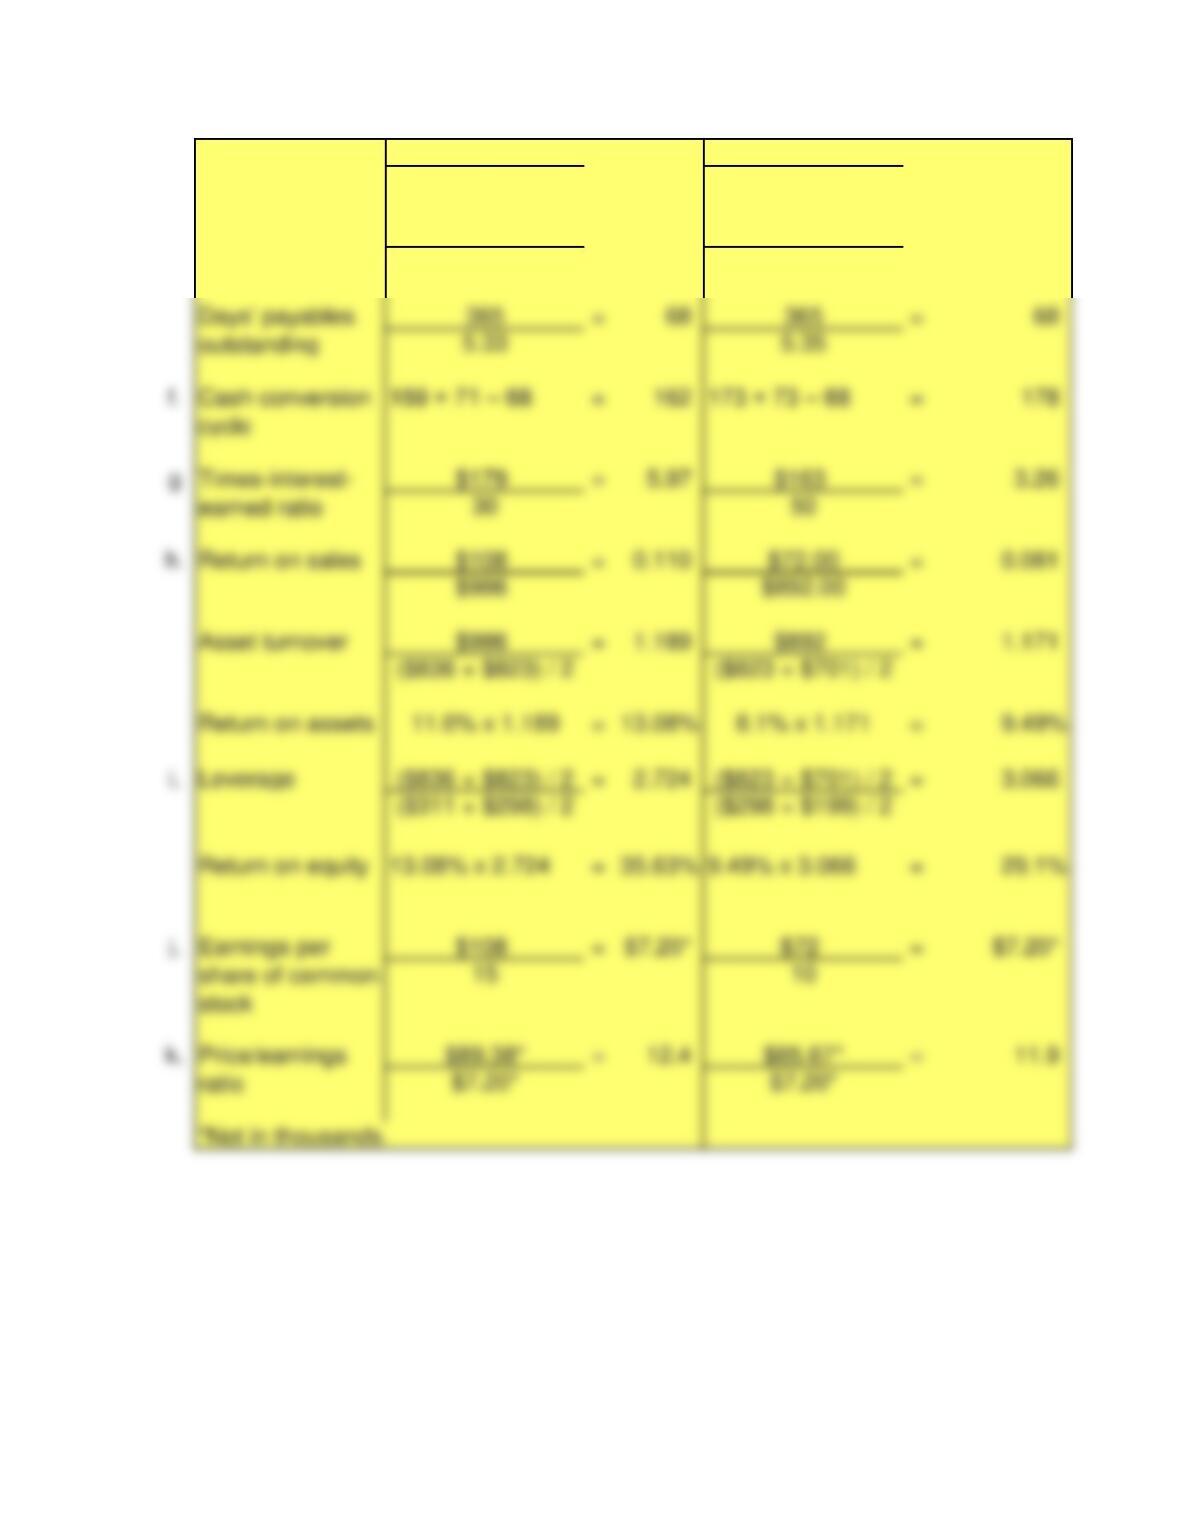
365 =159 365 =173
2.30 2.11
e. $680 = 5.33 $581
=
5.35
($150 + $105) / 2 ($105 + $112) / 2
Req. 2
Days’ inventory
outstanding
Accounts
payable turnover
Chapter 13: Financial Statement Analysis Page 53 of 94
365 =68 365
=
5.33 5.35
=
=
3.26
h. $108 = 0.110 $72.00
=
13.08% x 2.724 = 35.63% 9.49% x 3.066 = 29.1%
Return on sales
Return on equity
Price/earnings
earned ratio
Cash conversion
Days’ payables
FINANCIAL ACCOUNTING – Eleventh Edition Solutions Manual
Decisions:
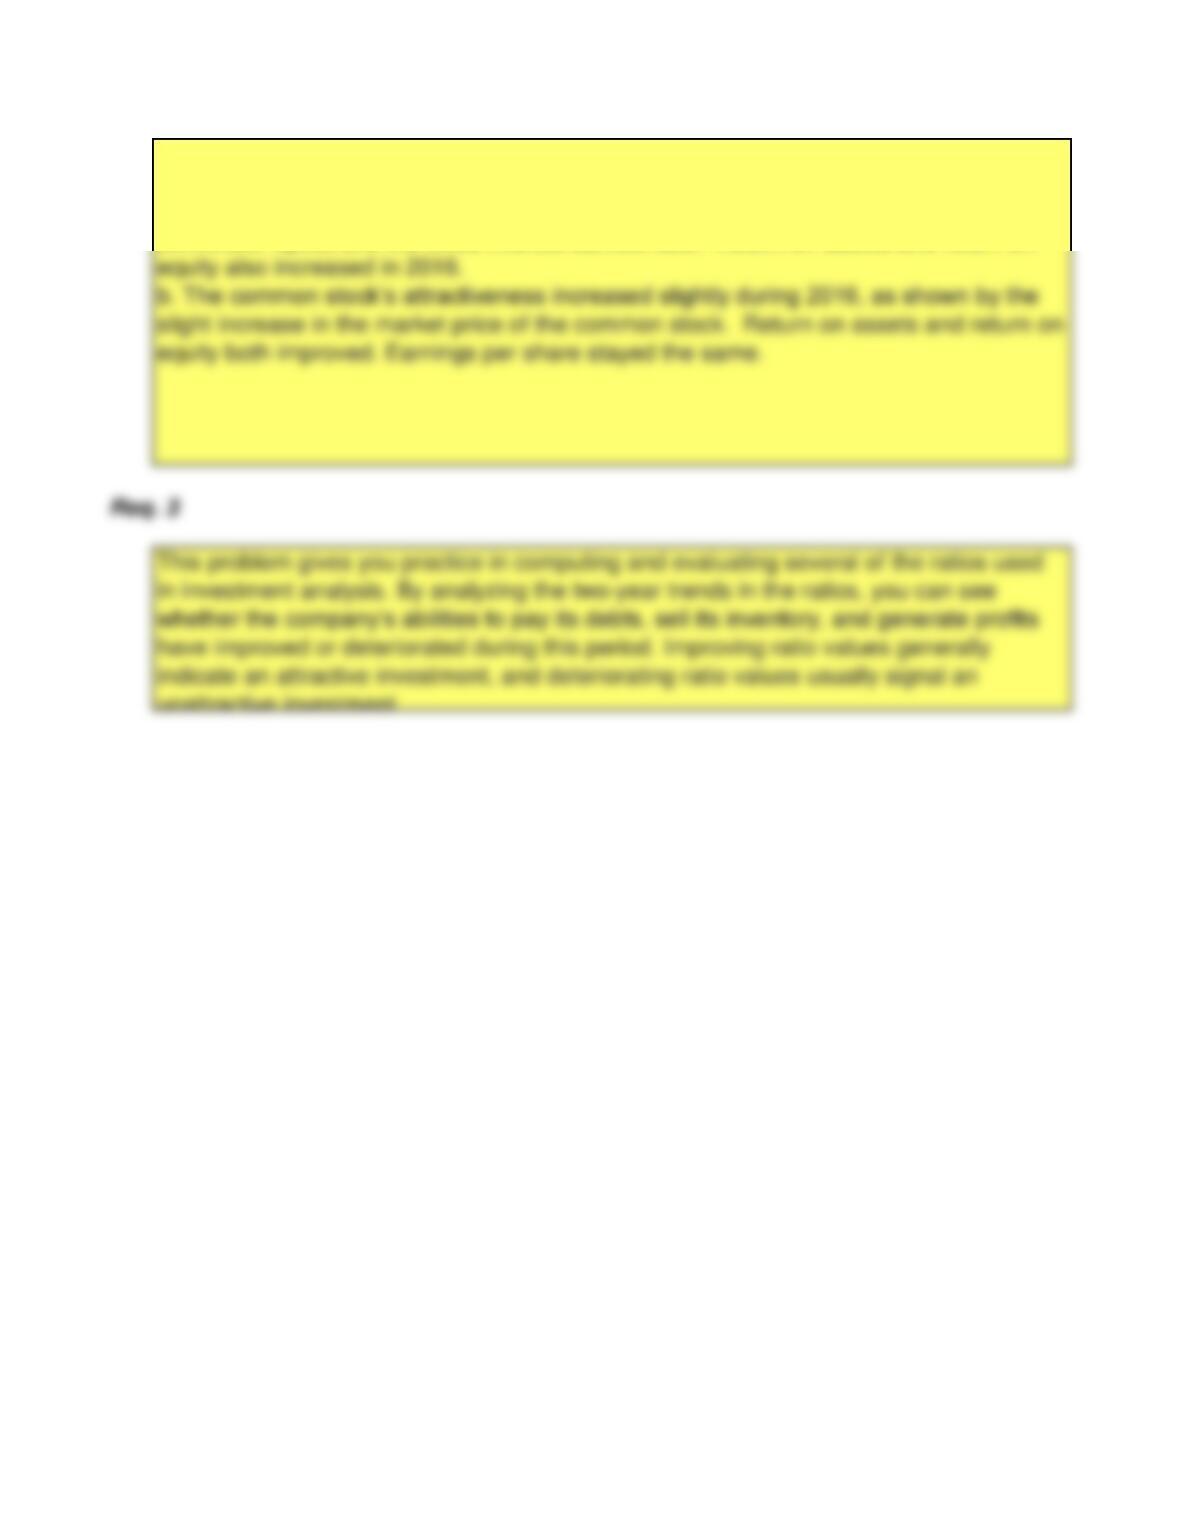
a. The company’s financial position improved during 2016 as shown by increases in the
current ratio, the quick ratio, the receivables turnover, the inventory turnover, the cash
conversion cycle, and the times-interest-earned ratio. Return on assets and return on
Chapter 13: Financial Statement Analysis Page 54 of 94
FINANCIAL ACCOUNTING – Eleventh Edition Solutions Manual
P13-54A
(45-60 min.)
Requirements
Solution:
Req. 1
a. $22 + $5 + $183 = 0.57 $36 + $15 + $165 = 0.64
$371 $335
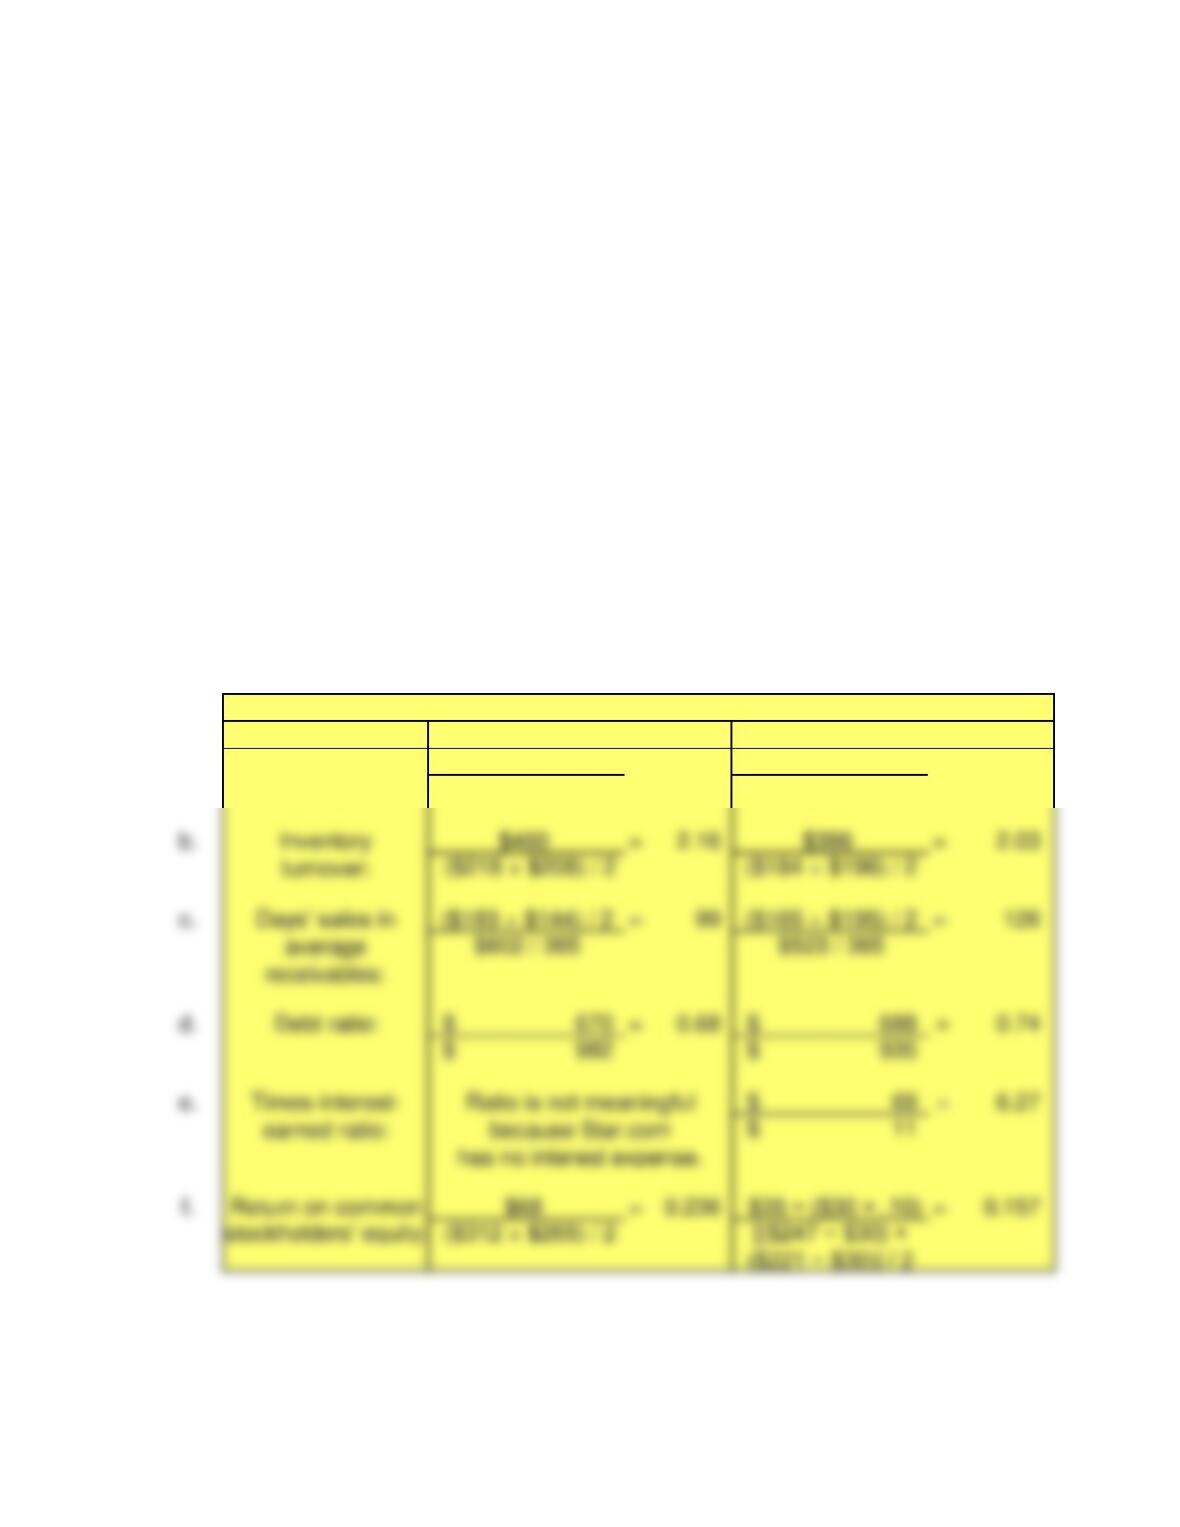
1. Compute the following ratios for both companies for the current year, and decide which
company’s stock better fits your investment strategy.
a. Quick (acid-test) ratio
b. Inventory turnover
c. Days’ sales in average receivables
d. Debt ratio
e. Times-interest-earned ratio
f. Return on common stockholders’ equity
g. Earnings per share of common stock
h. Price-earnings ratio
2. Compute each company’s economic-value-added (EVA®) measure and determine
whether the companies’ EVA®s confirm or alter your investment decision. Each
company’s cost of capital is 10%.
(Dollar Amounts and Stock Quantities in Thousands)
Star.com
Westlake Shops
Quick (acid-test)
ratio:
Chapter 13: Financial Statement Analysis Page 55 of 94
FINANCIAL ACCOUNTING – Eleventh Edition Solutions Manual
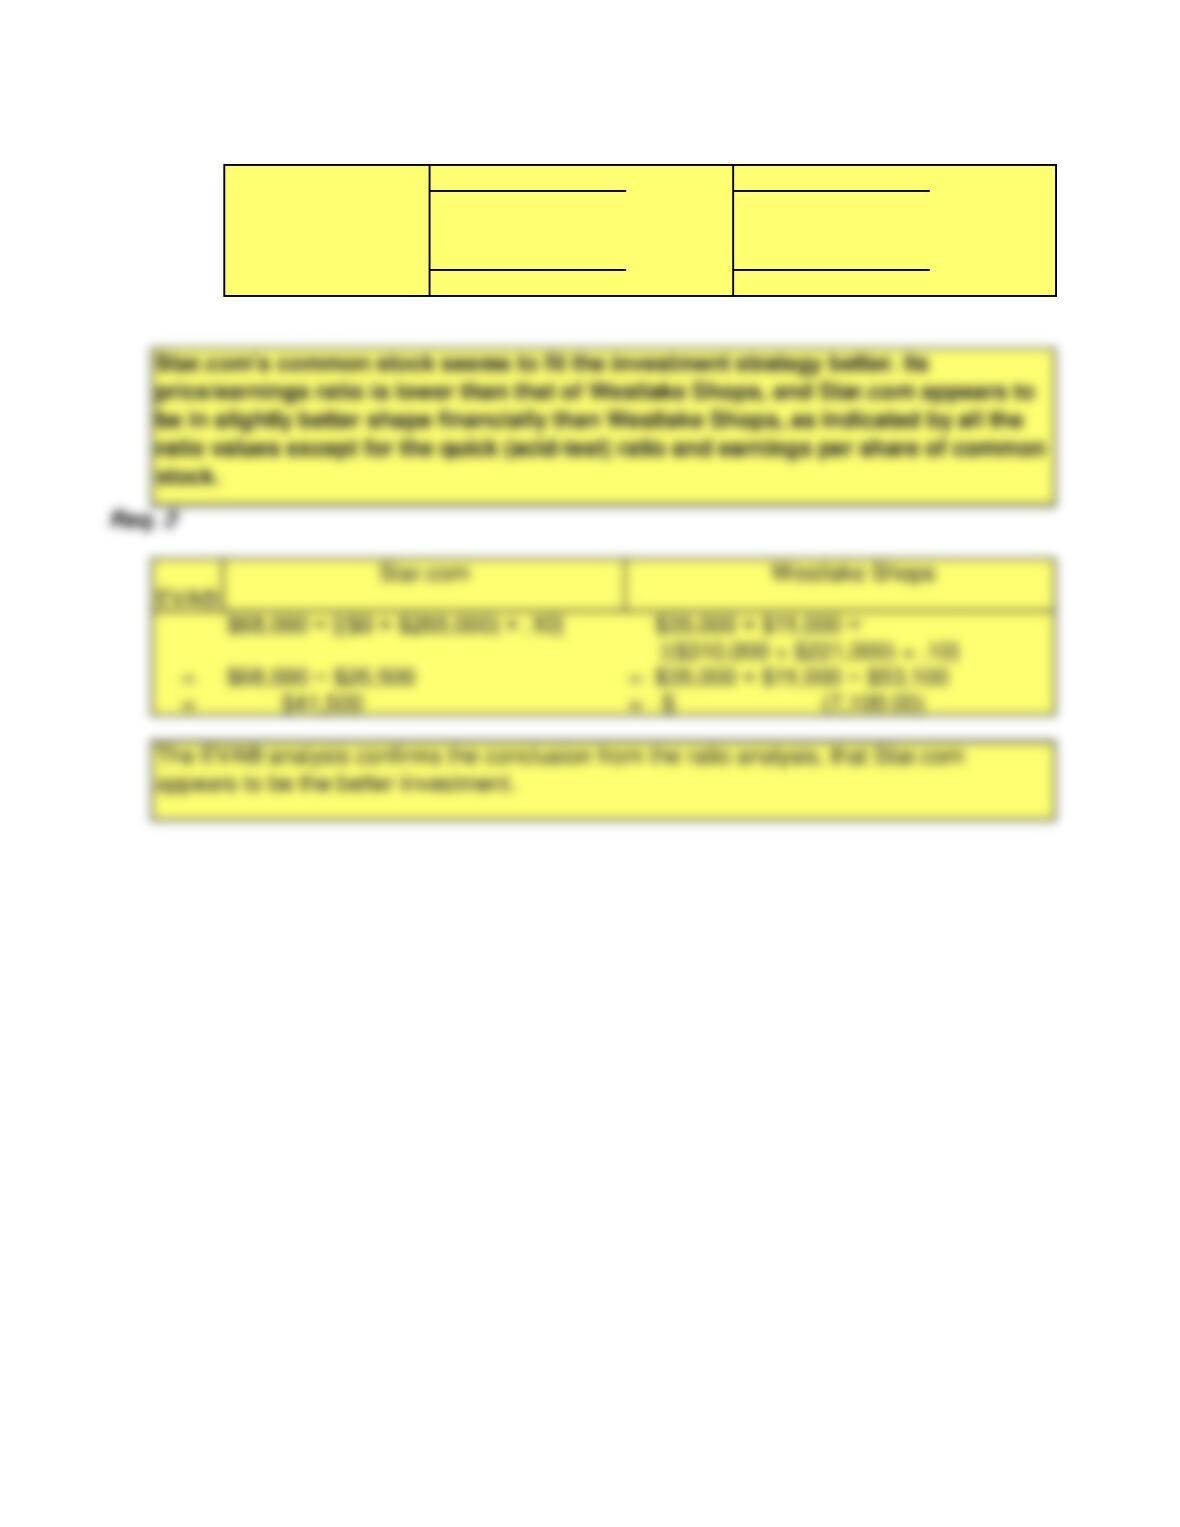
g. Earnings per share $68 $0.68* $35 − ($30 × .10) =$2.13*
of common stock: 100 =15
h. Price/earnings $7.48* =11 $36.21* = 17
ratio: $.68* $2.13*
*Not in thousands.
Chapter 13: Financial Statement Analysis Page 56 of 94
FINANCIAL ACCOUNTING – Eleventh Edition Solutions Manual
P13-55B
(20-30 min)
Requirements
Solution:
Req. 1
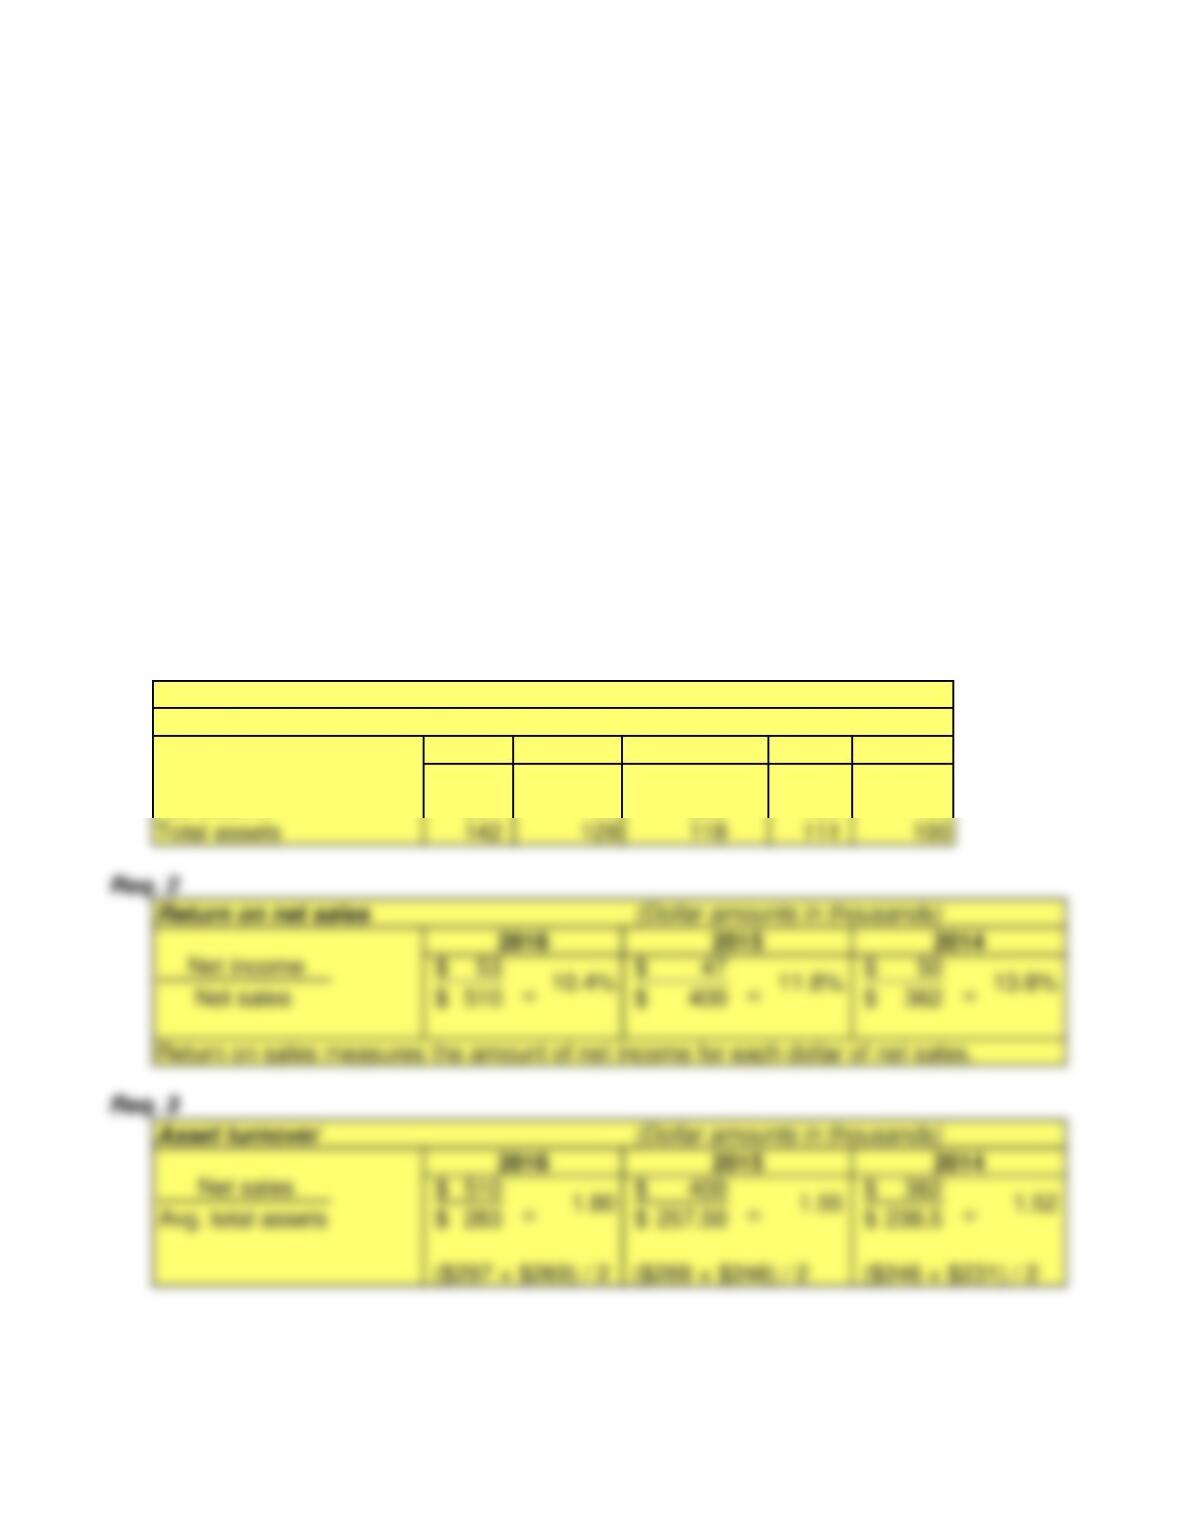
2016 2015 2014 2013 2012
Net sales 172% 135% 122% 106% 100%
Net income 221 196 208 154 100
1. Compute trend percentages for each item for 2013 through 2016. Use 2012 as the
base year and round to the nearest percent.
2. Compute the rate of return on net sales for 2014 through 2016, rounding to three
decimal places. Explain what this means.
3. Compute asset turnover for 2014 through 2016. Explain what this means.
4. Use DuPont Analysis to compute rate of return on average total assets (ROA) for
2014 through 2016.
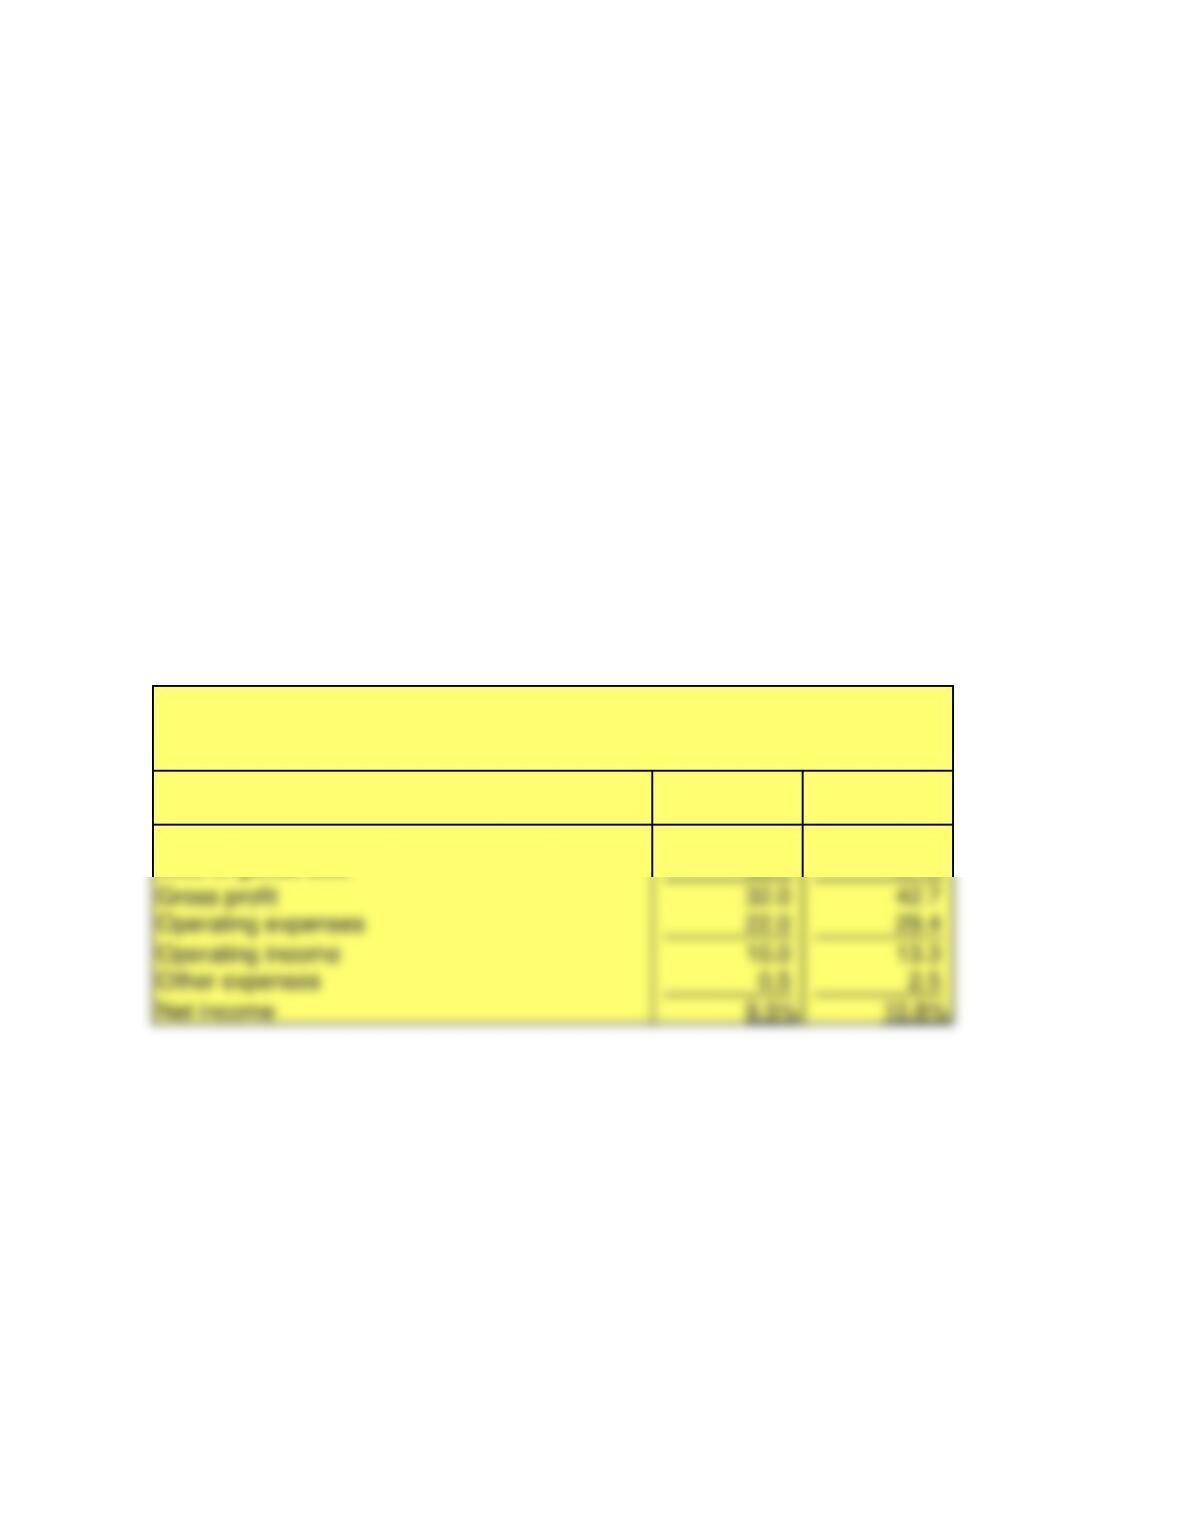
5. How does Urbana Shipping’s return on net sales for 2016 compare with previous
years? How does it compare with that of the industry? In the shipping industry, rates
above 9% are considered good, and rates above 11% are outstanding.
6. Evaluate Urbana Shipping, Inc.’s, ROA for 2016, compared with previous years and
against an 18% benchmark for the industry.
Lloyd Shipping, Inc.
Trend Percentages
Chapter 13: Financial Statement Analysis Page 57 of 94
Total assets 142 129 118 111 100
FINANCIAL ACCOUNTING – Eleventh Edition Solutions Manual
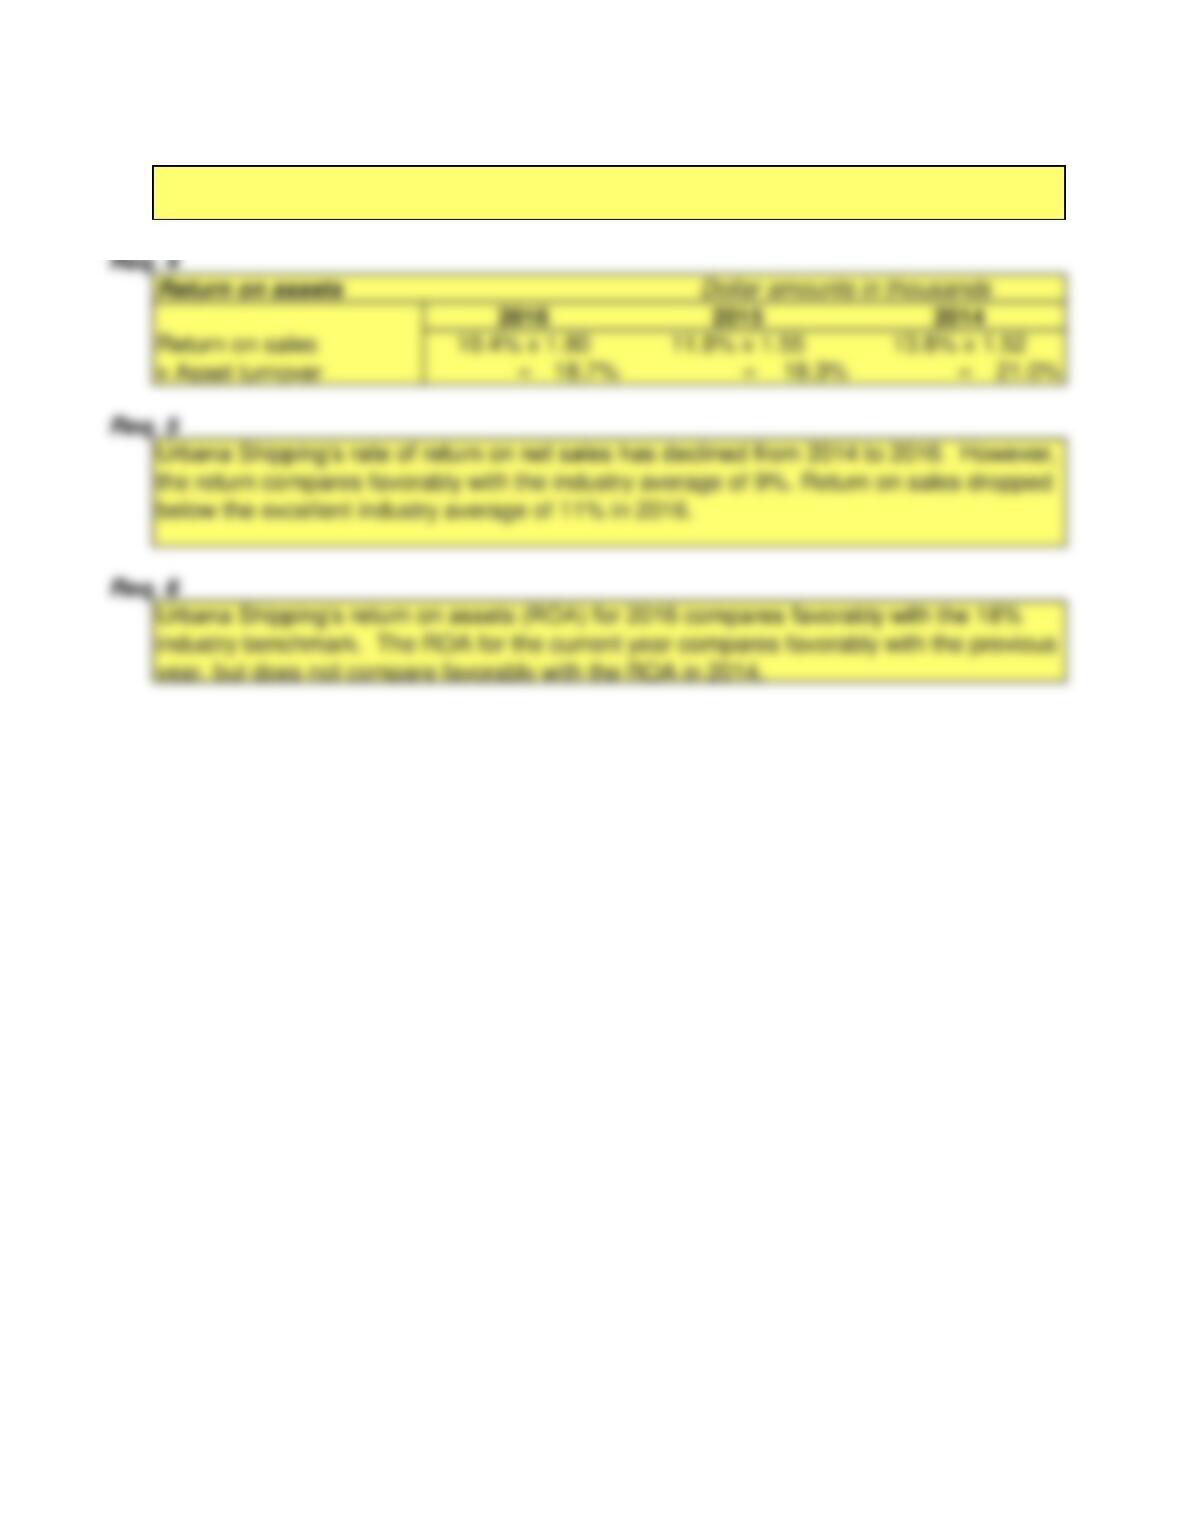
Asset turnover means the amount of net sales per dollar invested in assets. High ratios
mean high efficiency (low cost).
Chapter 13: Financial Statement Analysis Page 58 of 94
FINANCIAL ACCOUNTING – Eleventh Edition Solutions Manual
P13-56B
(20-30 min.)
Requirements
Solution:
Req. 1
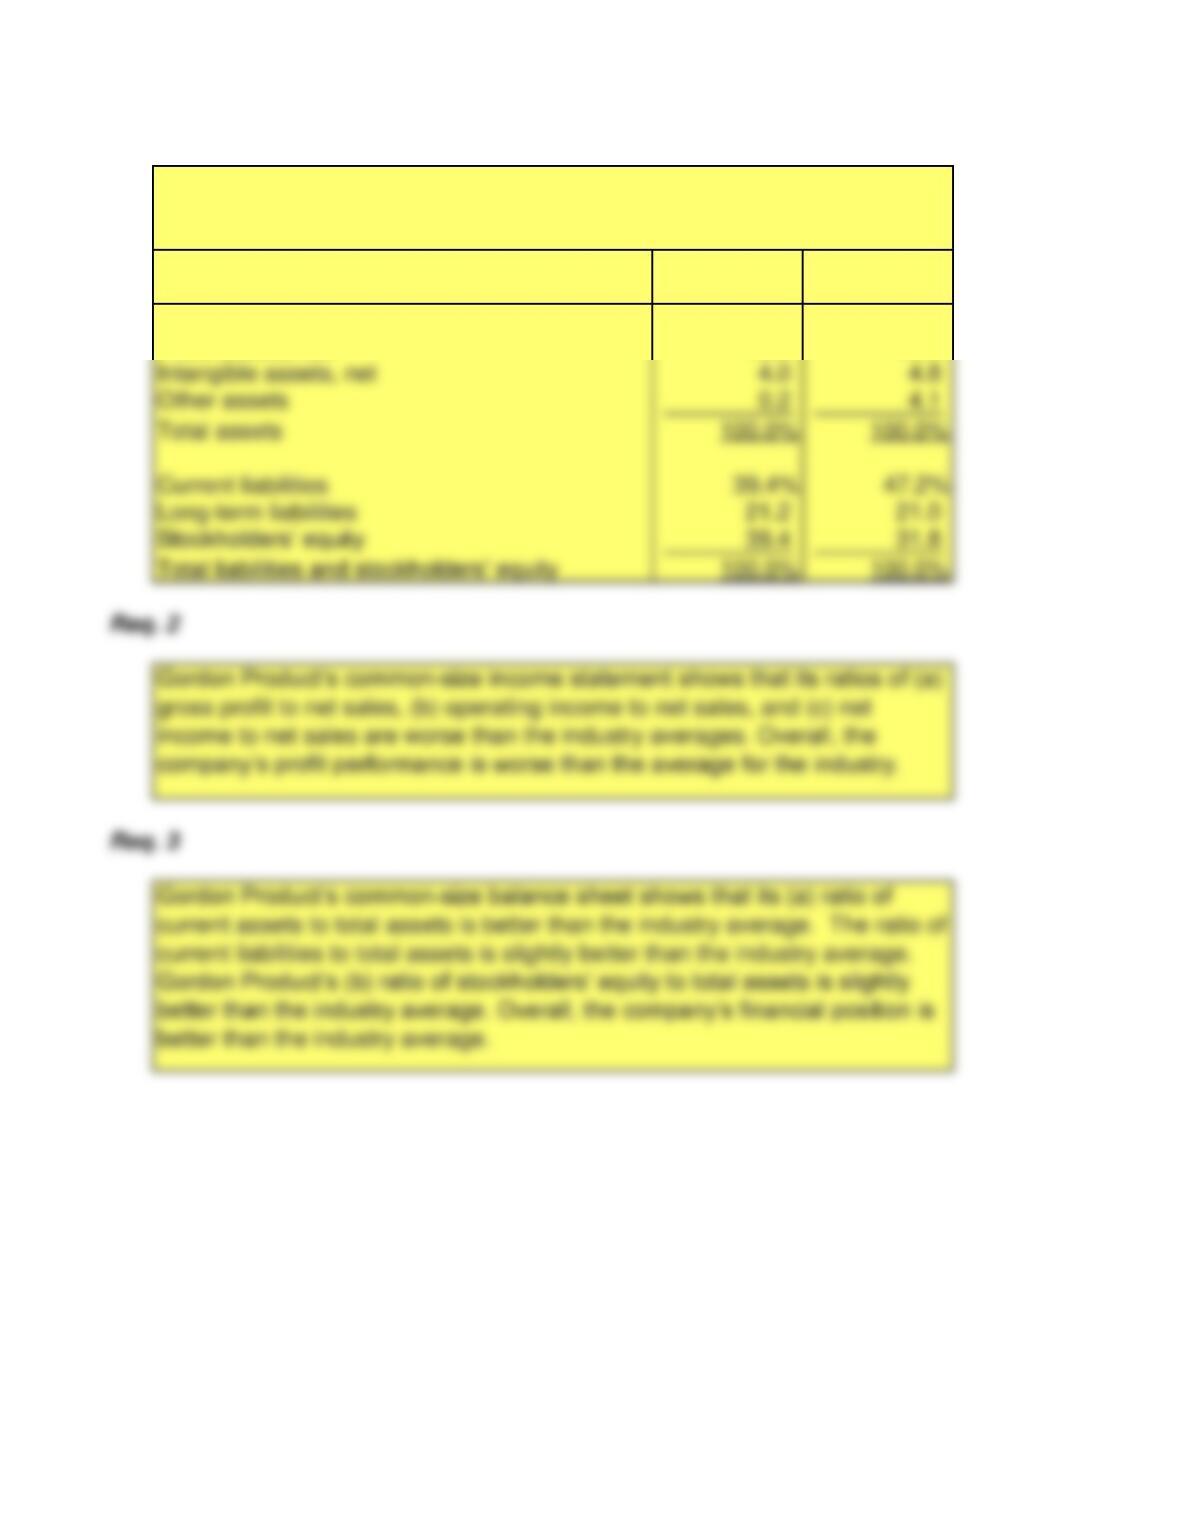
Net sales 100.0% 100.0%
Cost of goods sold 68.0 57.3
1. Prepare a common-size income statement and balance sheet for Gordon Products.
The first column of each statement should present Gordon Products’ common-size
statement, and the second column should show the industry averages.
2. For the profitability analysis, compare Gordon Products’ (a) ratio of gross profit to
net sales, (b) ratio of operating income to net sales, and (c) ratio of net income to net
sales with the industry averages. Is Gordon Products’ profit performance better or
worse than the average for the industry?
3. For the analysis of financial position, compute Gordon Products’ (a) ratios of
current assets and current liabilities to total assets and (b) ratio of stockholders’ equity
to total assets. Compare these ratios with the industry averages. Is Gordon Products’
financial position better or worse than the average for the industry?
Gordon Products, Inc.
Common-Size Income Statement Compared to Industry Average
Year Ended December 31, 2016
Gordon
Products
INDUSTRY
AVERAGE
Chapter 13: Financial Statement Analysis Page 59 of 94
Gross profit 32.0 42.7
Operating income 10.0 13.3
Net income 9.5% 10.8%
FINANCIAL ACCOUNTING – Eleventh Edition Solutions Manual
Current assets 77.0% 72.1%
Fixed assets, net 18.8 19.0
Gordon Products, Inc.
Common-Size Income Statement Compared to Industry Average
December 31, 2016
Gordon
Products
INDUSTRY
AVERAGE
Chapter 13: Financial Statement Analysis Page 60 of 94
Intangible assets, net 4.0 4.8
Total assets 100.0% 100.0%
Current liabilities 39.4% 47.2%
Long-term liabilities 21.2 21.0