Student Name:
Class:
2,850,000$
168,000$
142,400
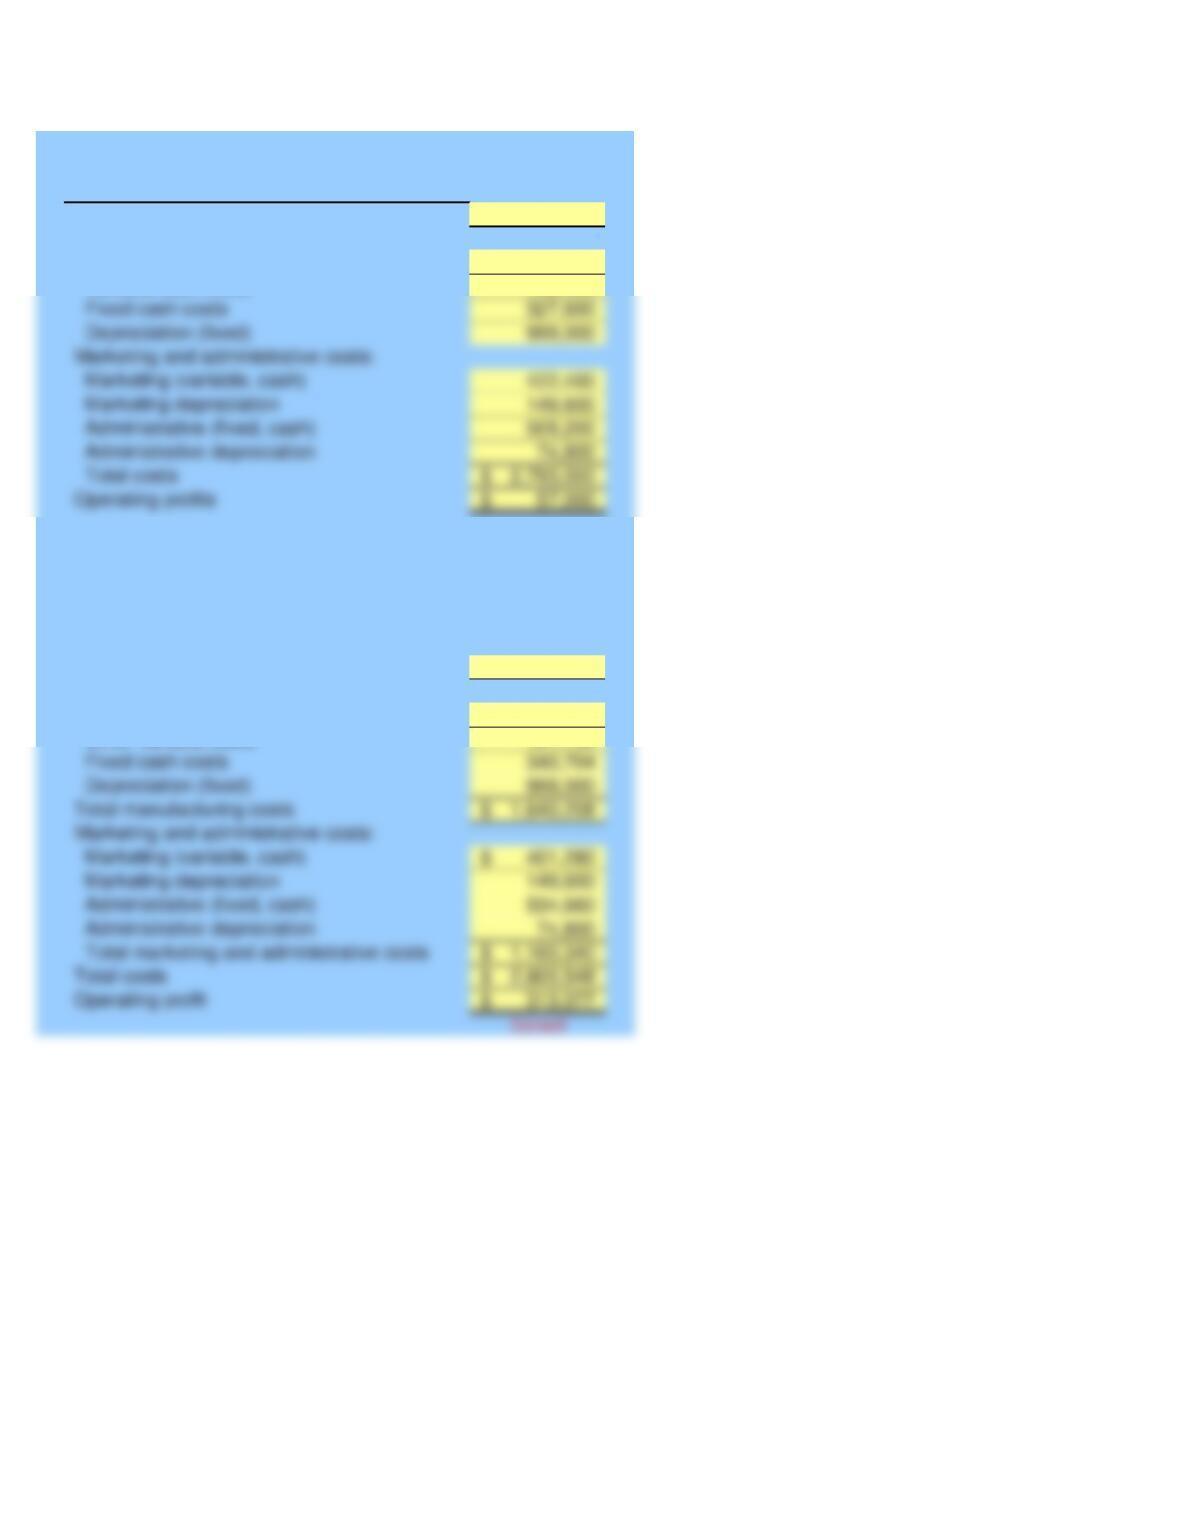
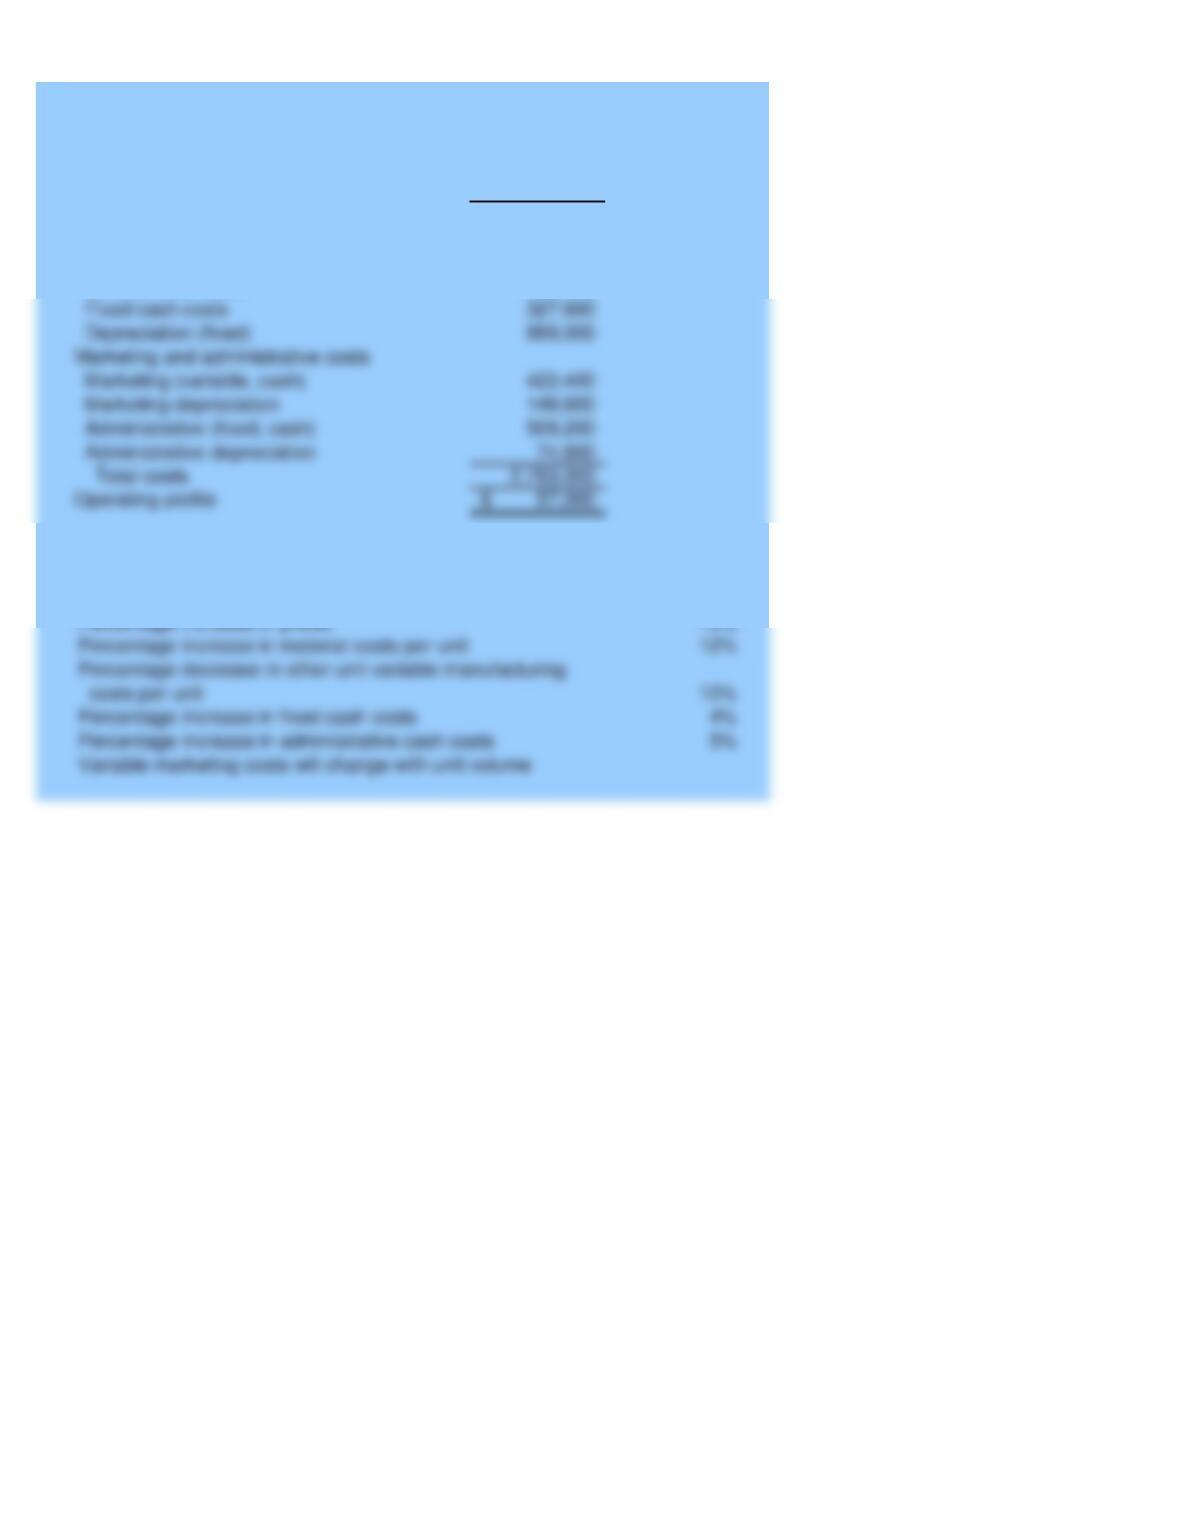
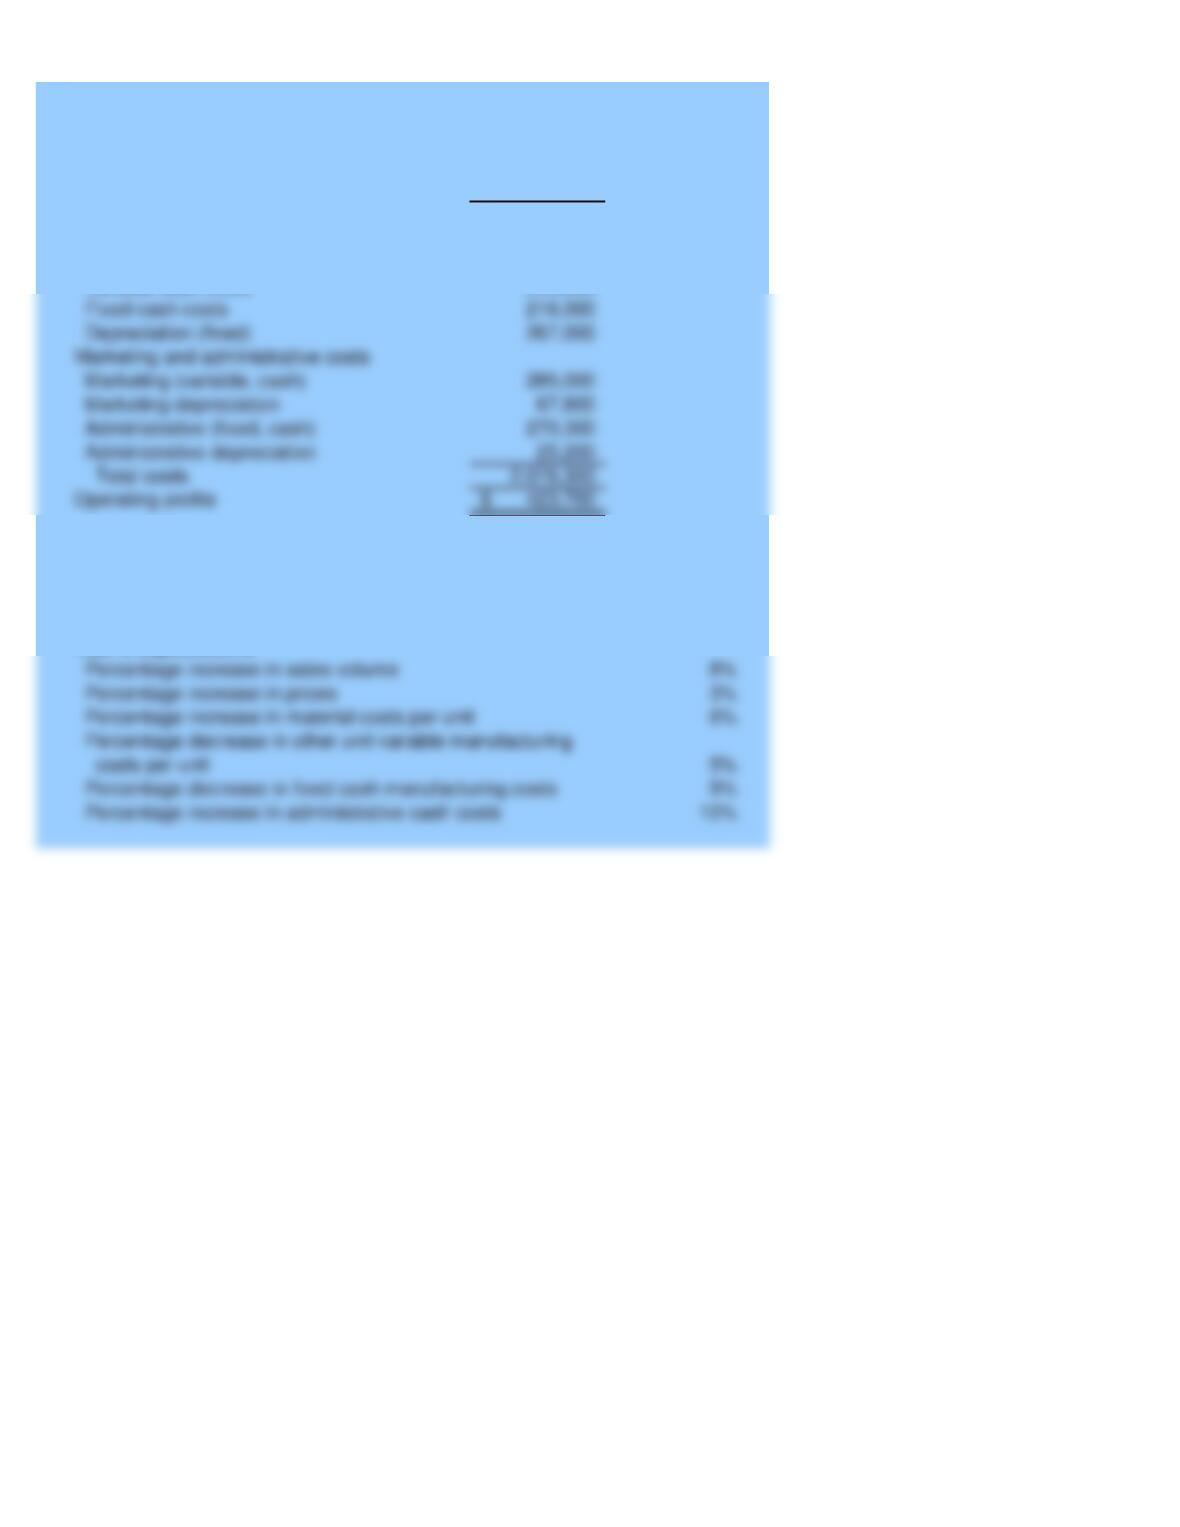
Fixed cash costs
Depreciation (fixed)
Total marketing and administrative costs
Total costs
Operating profit
Total manufacturing costs
Marketing and administrative costs:
Marketing (variable, cash)
Marketing depreciation
Administrative (fixed, cash)
Administrative depreciation
3,113,625$
178,752$
121,752
Manufacturing costs:
Materials
Variable cash costs
Problem 13-47
McGraw-Hill/Irwin
Instructor
Sales revenue (200,000 units)
Data from Year 1
PEPPER PRODUCTS
Budgeted Income Statement
For Year 2
Pepper Products
Sales revenue
Manufacturing costs:
Materials
Other variable costs
Fixed cash costs
Depreciation (fixed)
Marketing and administrative costs:
Marketing (variable, cash)
Marketing depreciation
Administrative (fixed, cash)
Administrative depreciation
Operating profits
2,850,000$
168,000$
142,400
5%
Percentage increase in prices
Percentage increase in material costs per unit
Variable marketing costs will change with unit volume
Percentage decrease in other unit variable manufacturing
costs per unit
Percentage increase in fixed cash costs
Percentage increase in administrative cash costs
PEPPER PRODUCTS
Given Data P13-47:
Year 1 information:
Sales revenues (200,000 units)
Manufacturing costs
Materials
Variable cash costs
Percentage decrease in sales volume
Year 2 expectations
Additional Information:
Fixed cash costs
Depreciation (fixed)
Marketing and administrative costs
Marketing (variable, cash)
Marketing depreciation
Administrative (fixed, cash)
Administrative depreciation
Student Name:
Class:
2,500,000$
423,700$
589,320$
Variable cash costs
Fixed cash costs
Depreciation (fixed)
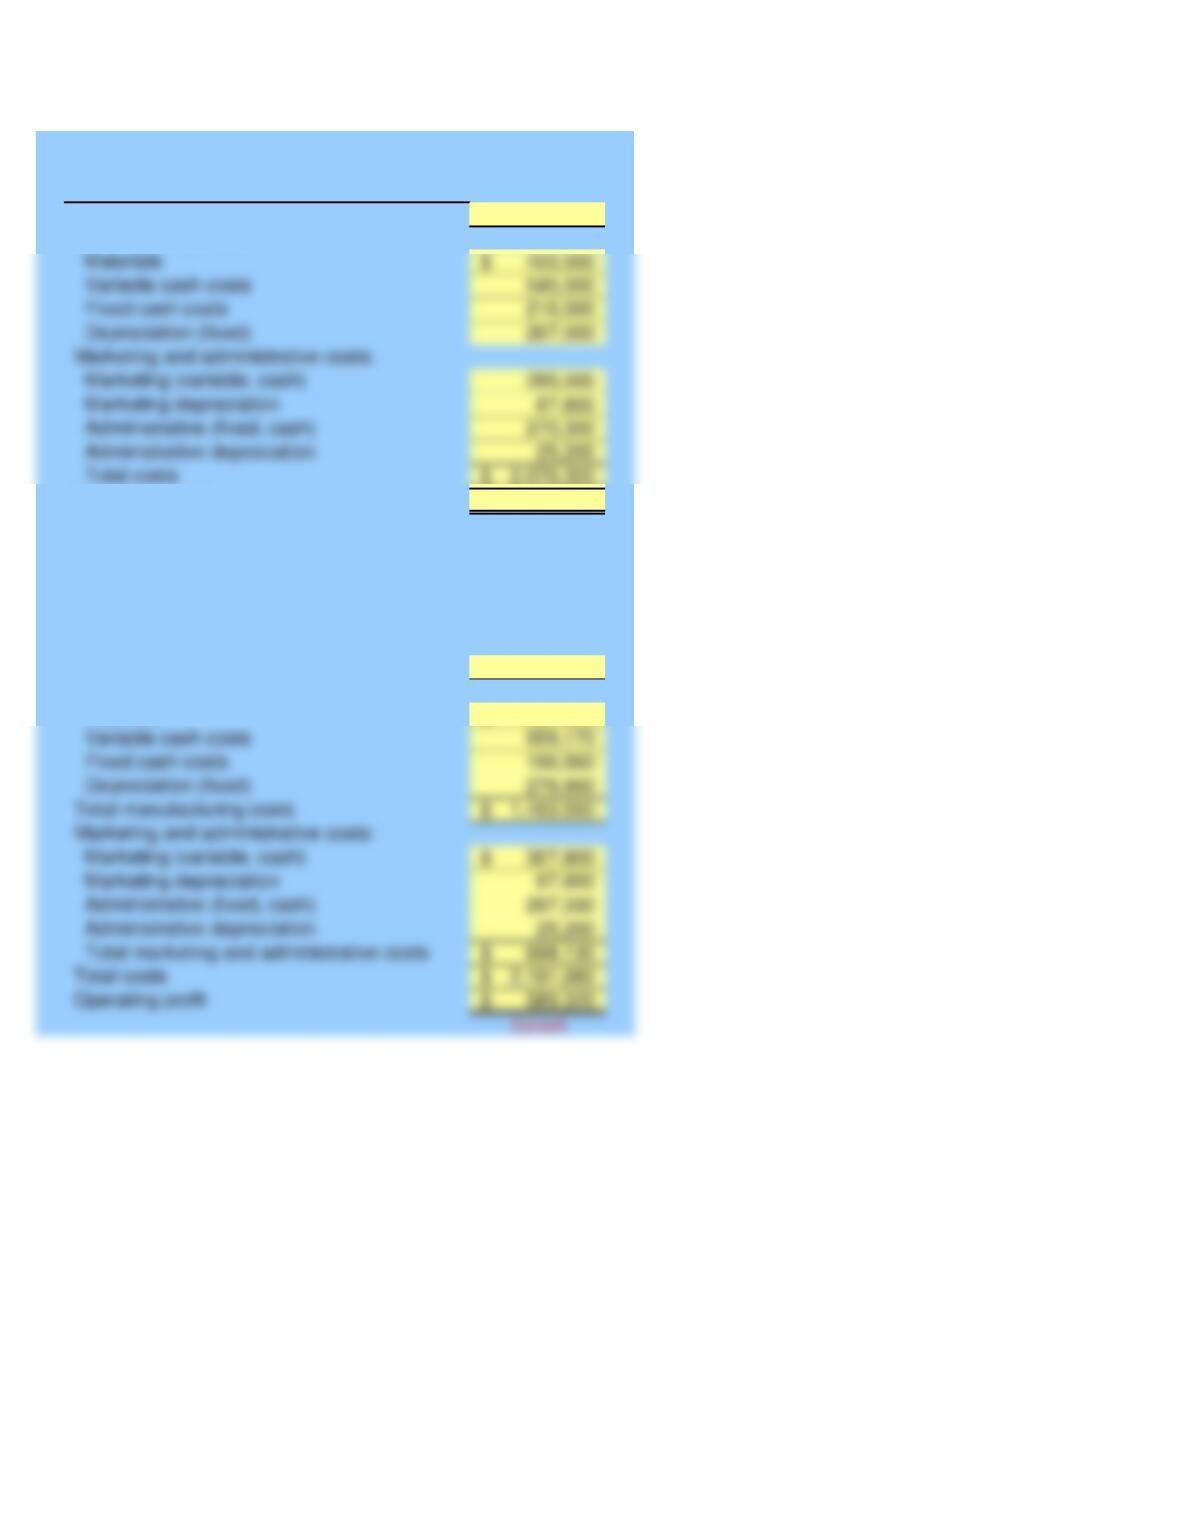
Total manufacturing costs
Total costs
Operating profit
Marketing and administrative costs:
Marketing (variable, cash)
Marketing depreciation
Administrative (fixed, cash)
Administrative depreciation
Total marketing and administrative costs
2,781,000$
457,920$
Problem 13-49
McGraw-Hill/Irwin
Instructor
Manufacturing costs:
Sales Revenue
Data from Year 1
GULF STATES MANUFACTURING
Operating profits
Sales Revenue
Budgeted Income Statement
For Year 2
Gulf States Manufacturing
Manufacturing costs:
Materials
Materials
Variable cash costs
Fixed cash costs
Depreciation (fixed)
Marketing and administrative costs:
Marketing (variable, cash)
Marketing depreciation
Administrative (fixed, cash)
Administrative depreciation
2,500,000$
400,000$
545,000
29,100$
42,000$
Percentage increase in administrative cash costs
Percentage increase in sales volume
Percentage increase in prices
Percentage increase in material costs per unit
Percentage decrease in other unit variable manufacturing
costs per unit
Percentage decrease in fixed cash manufacturing costs
GULF STATES MANUFACTURING
Year 1 information:
Sales Revenue (37,500 units)
Manufacturing costs
Materials
Variable cash costs
Given Data P13-49:
Annual depreciation on new equipment acquired in year 2
Year 2 expectations
Annual depreciation on old manufacturing equipment
Additional Information:
Administrative depreciation
Depreciation (fixed)
Marketing and administrative costs
Marketing (variable, cash)
Marketing depreciation
Administrative (fixed, cash)
Fixed cash costs
Student Name:
Class:
4.00
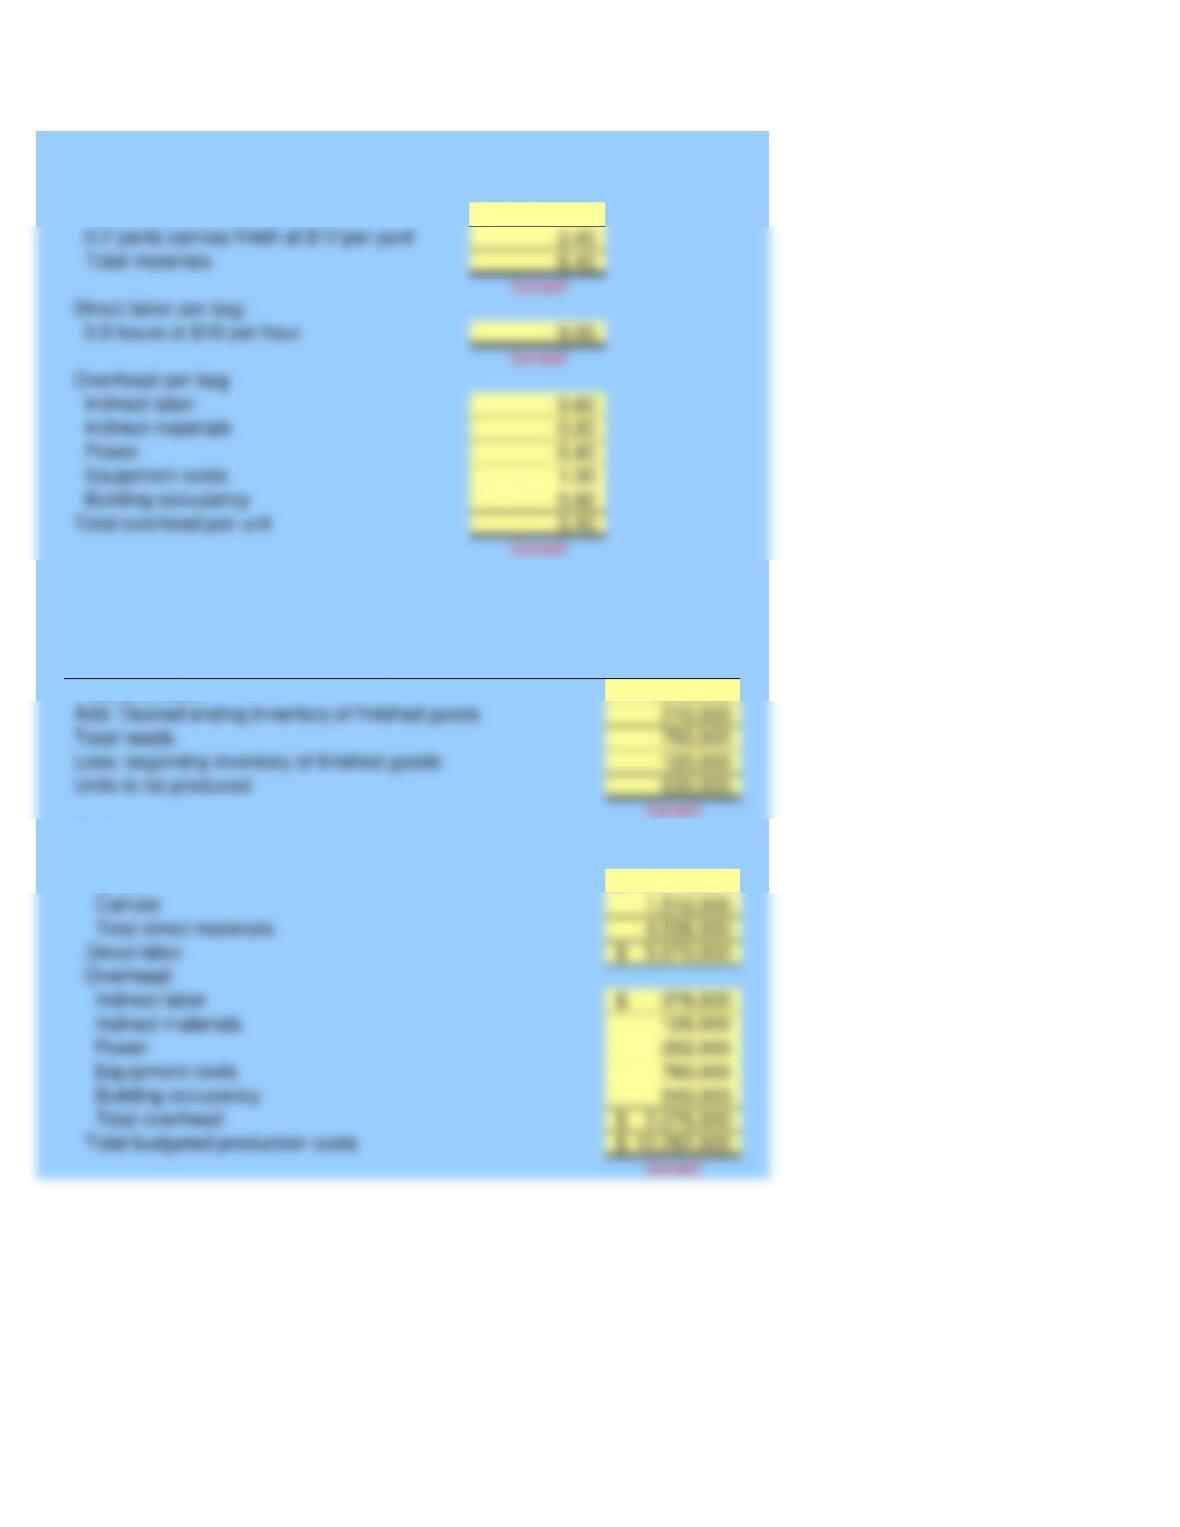
Add: Desired ending inventory of finished goods
Total needs
Less: beginning inventory of finished goods
Units to be produced
540,000
Total direct materials
Direct labor
Overhead:
Building occupancy
Total budgeted production costs
Power
Equipment costs
Canvas
3,024,000$
Instructor
McGraw-Hill/Irwin
Problem 13-51
ECOSACKS
Direct Materials per bag:
1.0 yard cotton at $4 per yard
EcoSacks
Production Budget
Coming Year
Expected sales
Estimate of costs:
Direct materials:
Cotton
0.2 yards canvas finish at $12 per yard
Total materials
Direct labor per bag:
Overhead per bag
Indirect labor
Indirect materials
Power
Building occupancy
Total overhead per unit
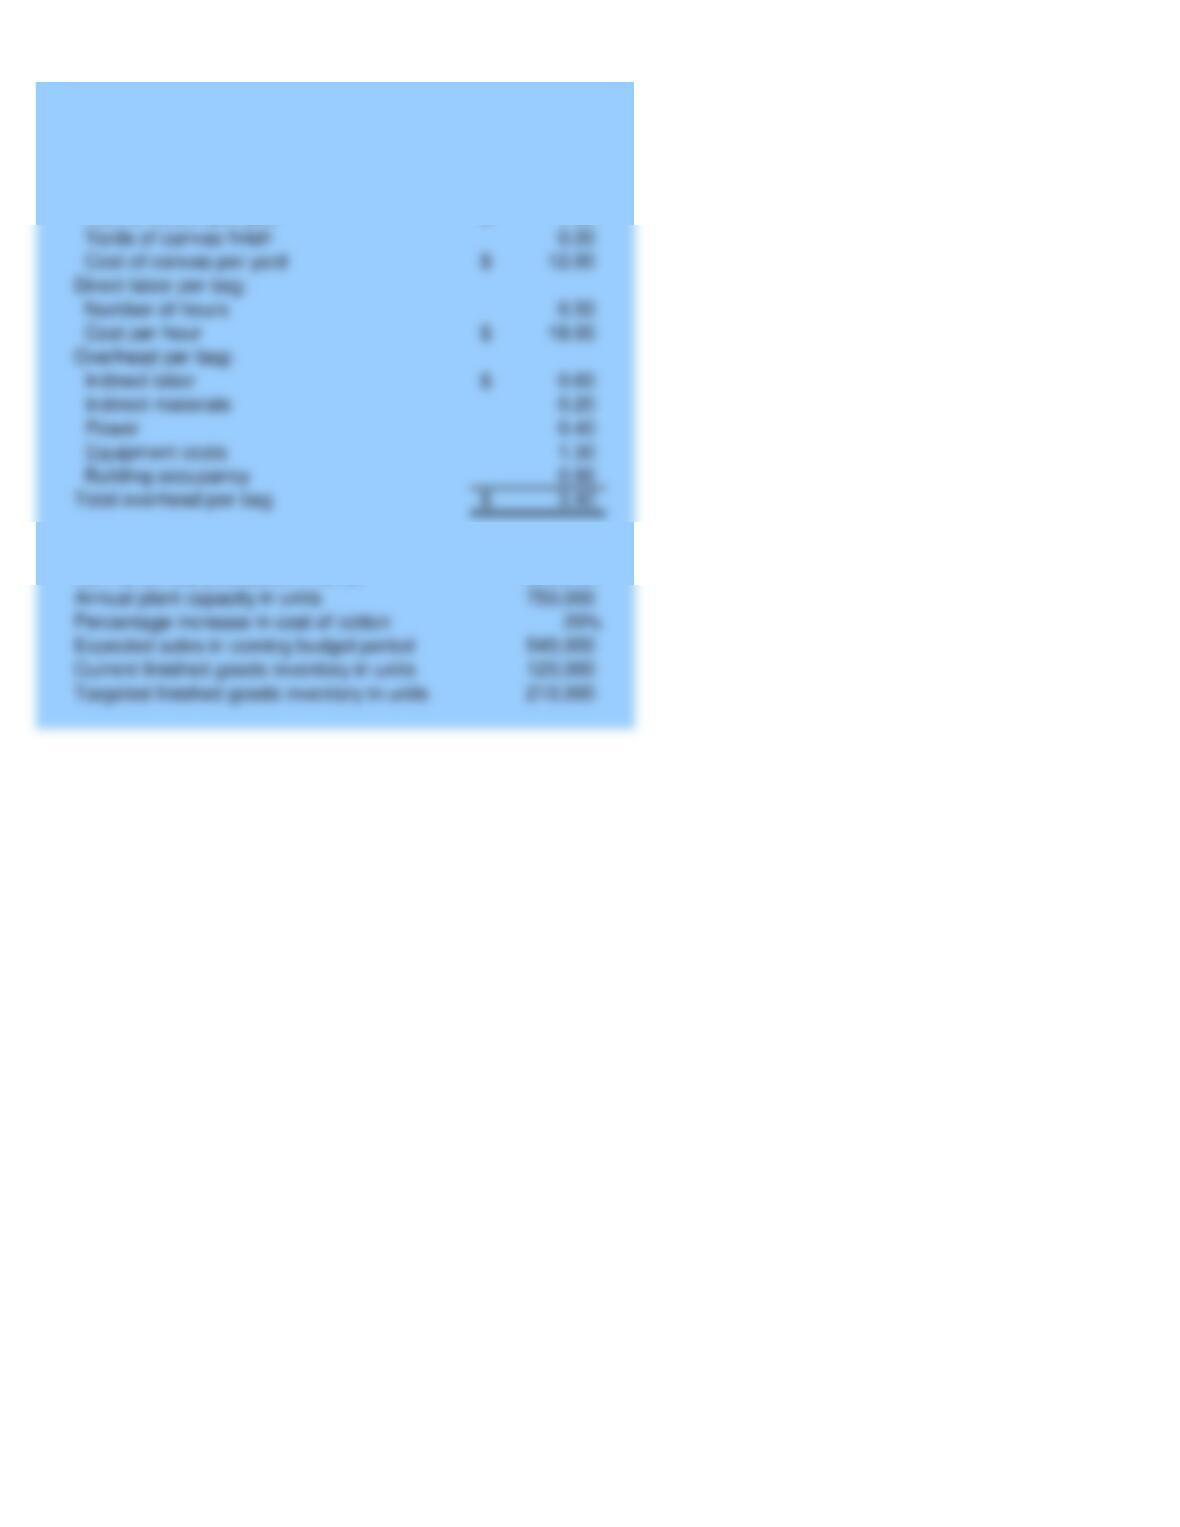
1.00
4.00$
600,000
Targeted finished goods inventory in units
Annual plant capacity in units
Percentage increase in cost of cotton
Expected sales in coming budget period
Current finished goods inventory in units
ECOSACKS
Given Data P13-51:
Additional Information:
Bag production cost data:
Direct materials per bag:
Yards of cotton
Cost of cotton per yard
Normal annual production in units
Yards of canvas finish
Cost of canvas per yard
Direct labor per bag:
Number of hours
Cost per hour
Overhead per bag:
Indirect labor
Indirect materials
Power
Equipment costs
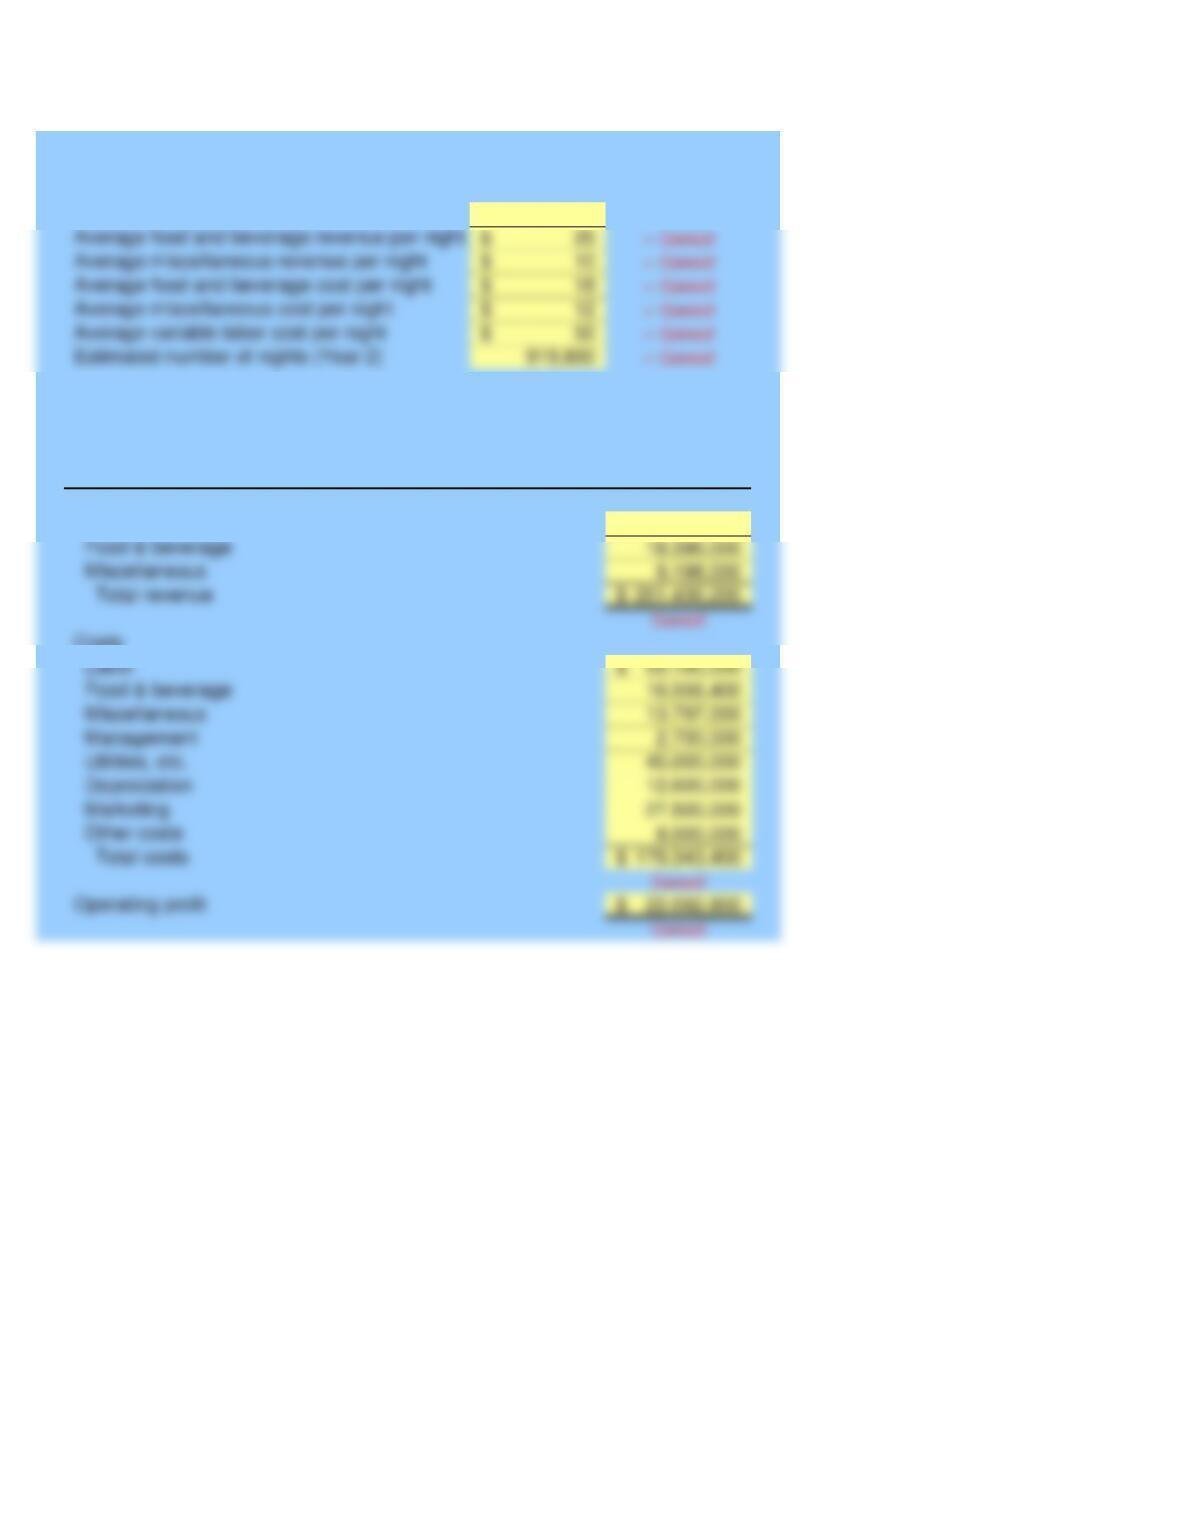
Food & beverage
Miscellaneous
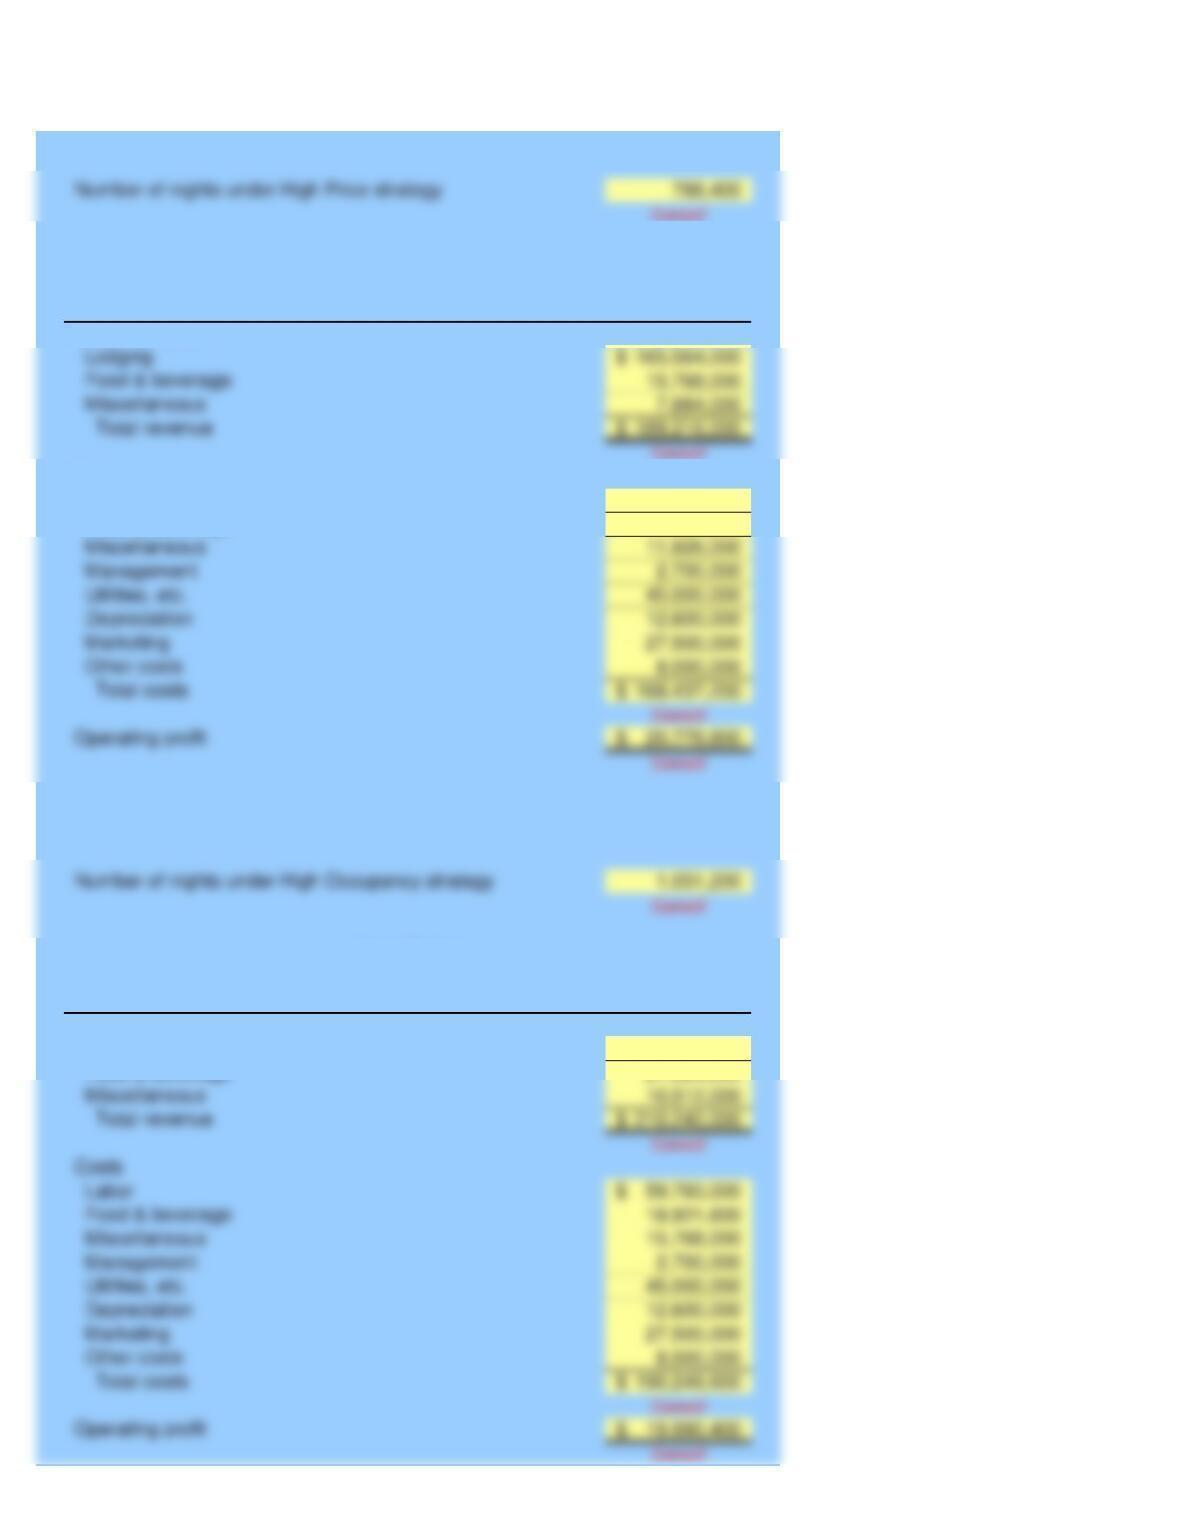
Total revenue
Student Name:
Class:
766,500 «- Correct!
173,842,200$
Food & beverage
Miscellaneous
Operating profit
Total costs
Utilities, etc.
Depreciation
Marketing
Other costs
Instructor
McGraw-Hill/Irwin
Problem 13-55
HOMESUITES
Number of nights (Year 1)
Calculations of Variable Costs per Night and Property:
Operating Income
HomeSuites
Year 2
Sales Revenue
Lodging
Costs
Average food and beverage revenue per night
Average miscellaneous revenue per night
Average food and beverage cost per night
Average miscellaneous cost per night
Average variable labor cost per night
Estimated number of nights (Year 2)
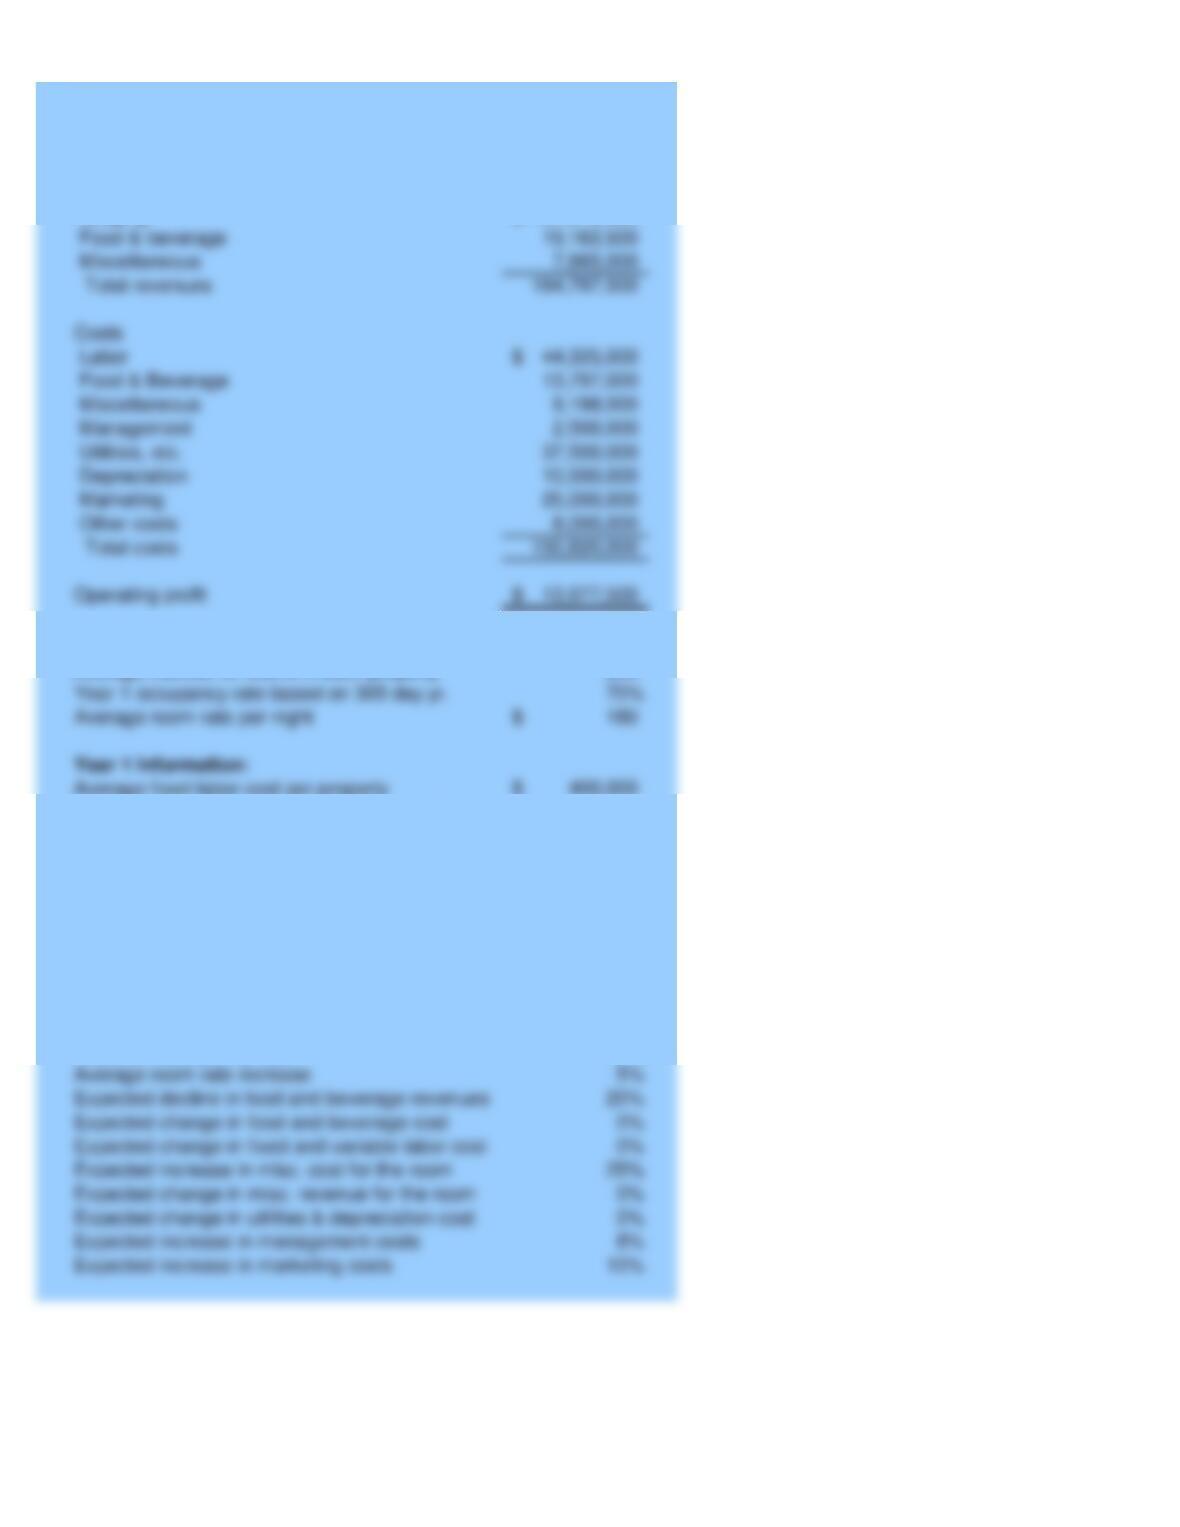
137,970,000$
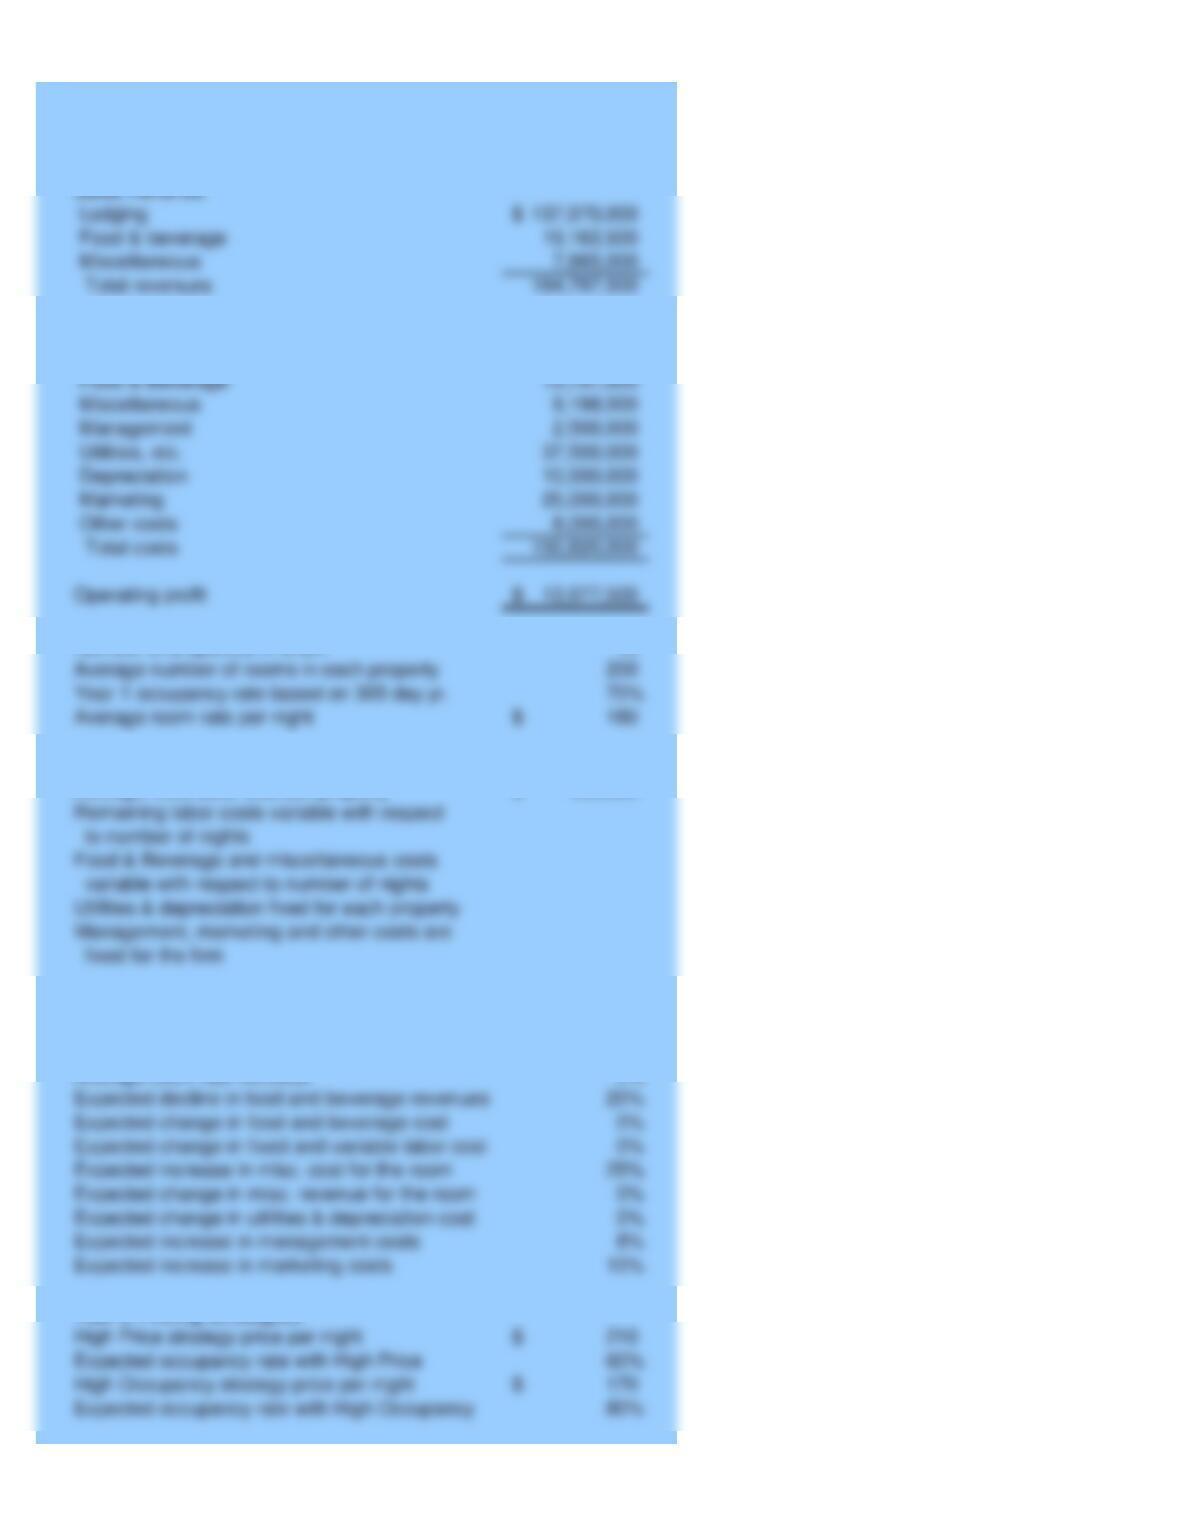
Average room rate per night
Year 1 occupancy rate based on 365 day yr.
Year 1 Information:
15
200
400,000$
3
Average room rate increase
Expected decline in food and beverage revenues
Expected change in fixed and variable labor cost
Expected increase in misc. cost for the room
Expected change in misc. revenue for the room
Expected change in utilities & depreciation cost
Expected increase in management costs
Expected increase in marketing costs
70%
Given Data P13-55:
HOMESUITES
Sales Revenue
Lodging
Number of properties in chain
Average number of rooms in each property
Operating Income
Year 1
to number of nights
Food & Beverage and miscellaneous costs
variable with respect to number of nights
Utilities & depreciation fixed for each property
Management, marketing and other costs are
fixed for the firm
Year 2 Expectations and Assumptions:
Number of new properties to be opened
Expected occupancy rate
Average fixed labor cost per property
Remaining labor costs variable with respect
Food & beverage
Miscellaneous
Total revenues
Marketing
Other costs
Total costs
Labor
Food & Beverage
Miscellaneous
Management
Utilities, etc.
Student Name:
Class:
Lodging
Food & beverage
Miscellaneous
Total revenue
Miscellaneous
Management
Utilities, etc.
Depreciation
Marketing
Other costs
Total costs
Operating profit
46,620,000$
14,191,200
Number of nights under High Occupancy strategy
Miscellaneous
Operating profit
Marketing
Other costs
Total costs
Management
Utilities, etc.
Depreciation
Labor
Food & beverage
Miscellaneous
178,704,000$
21,024,000
Instructor
McGraw-Hill/Irwin
Problem 13-56
Food & beverage
Lodging
HomeSuites
Operating Income
Year 2
Costs
Labor
a. High Price Strategy
b. High Occupancy Strategy
HomeSuites
Operating Income
Year 2
Sales Revenue
Sales Revenue
Food & beverage
Number of nights under High Price strategy
Food & Beverage
Miscellaneous
Management
Utilities, etc.
Marketing
Other costs
Total costs
44,325,000$
Average number of rooms in each property
Year 1 occupancy rate based on 365 day yr.
Average room rate per night
15
400,000$
3
Expected change in utilities & depreciation cost
Average room rate increase
Expected decline in food and beverage revenues
Expected change in fixed and variable labor cost
Expected increase in misc. cost for the room
Expected change in misc. revenue for the room
Expected increase in management costs
Expected increase in marketing costs
70%
High Occupancy strategy price per night
Expected occupancy rate with High Occupancy
High Price strategy price per night
Expected occupancy rate with High Price
Labor
Given Data P13-56:
HOMESUITES
Operating Income
Year 1
Costs
Number of properties in chain
Management, marketing and other costs are
Remaining labor costs variable with respect
to number of nights
Food & Beverage and miscellaneous costs
variable with respect to number of nights
Utilities & depreciation fixed for each property
fixed for the firm
Year 1 Information:
Average fixed labor cost per property
Year 2 Expectations and Assumptions:
Number of new properties to be opened
Expected occupancy rate
Year 2 Pricing Strategies:
Sales Revenue
Lodging
Food & beverage
Miscellaneous
Total revenues
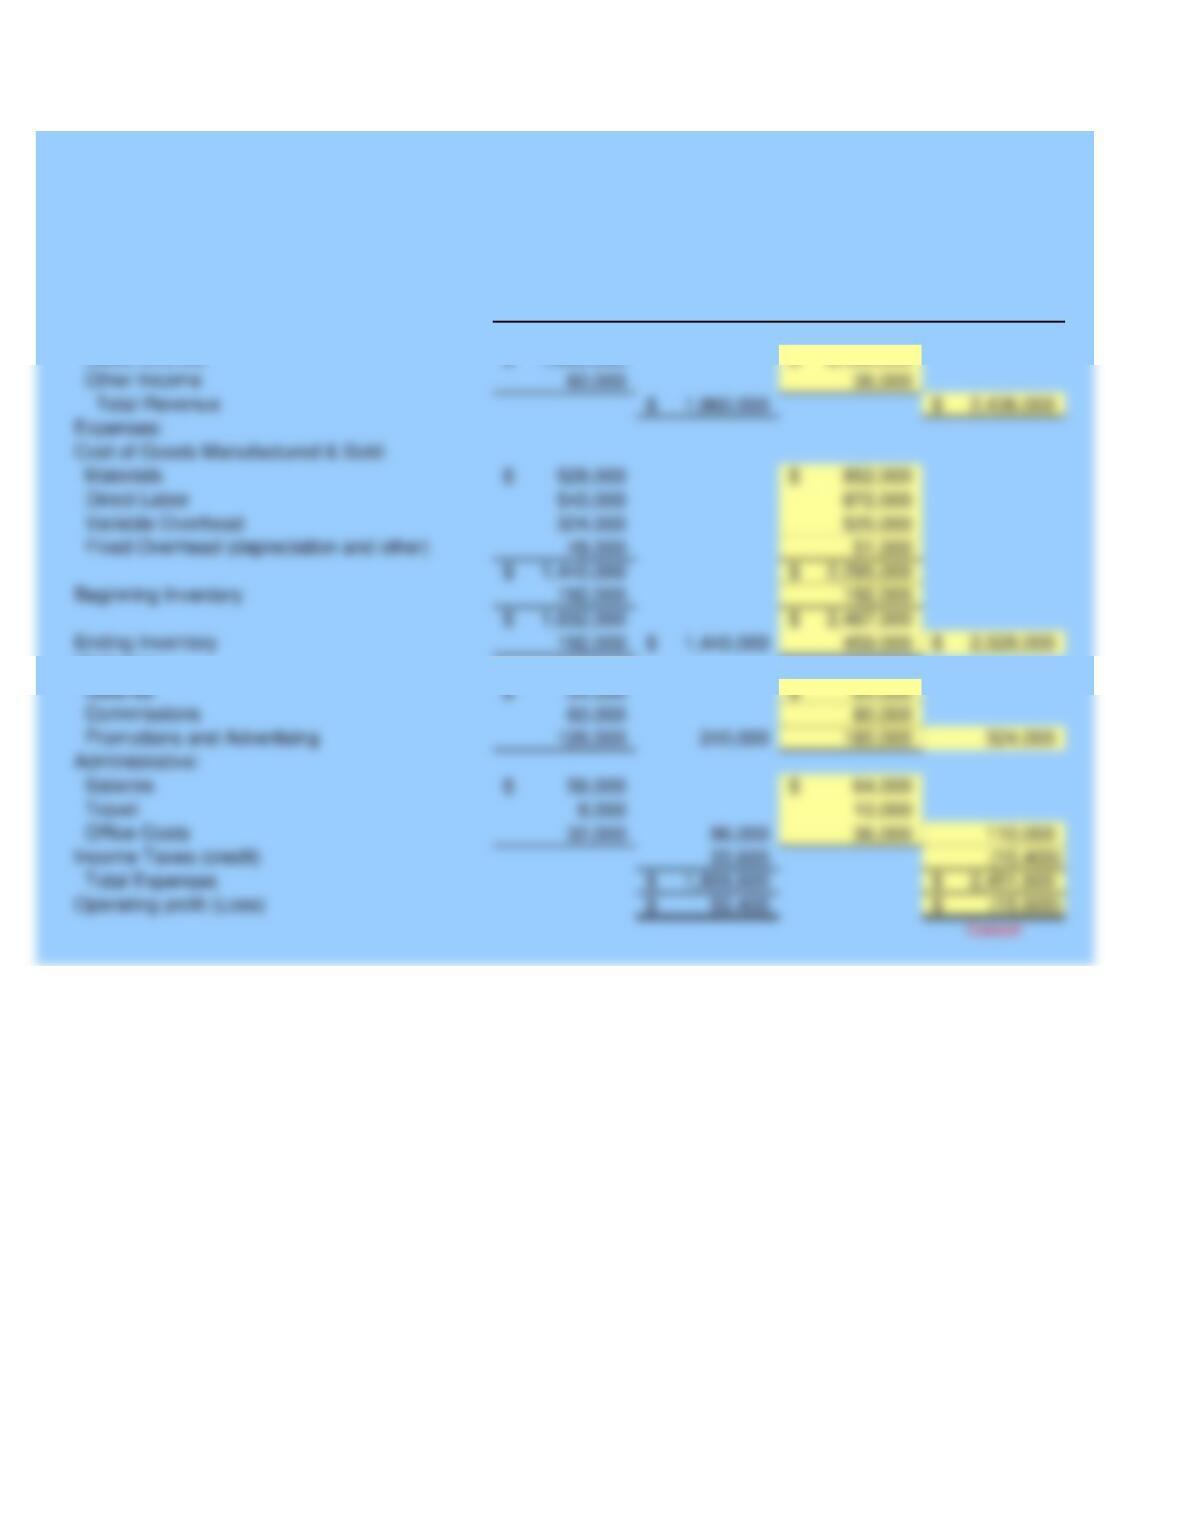
Fixed Overhead (depreciation and other)
Beginning Inventory
Ending Inventory
Other Income
Total Revenue
Expenses:
Cost of Goods Manufactured & Sold:
Direct Labor
Variable Overhead
Student Name:
Class:
1,800,000$ 2,400,000$
Marketing:
Revenue:
Sales revenue
Instructor
McGraw-Hill/Irwin
Problem 13-58
(Year 1)
December 31,
For the Year Ended
Actual
PANTHER CORPORATION
Budgeted Income Statement
Budgeted
For the Year Ended
December 31,
(in thousands)
(Year 2)
Salaries
Commissions
Promotions and Advertising
Administrative:
Salaries
Travel
Office Costs
Income Taxes (credit)
Total Expenses
Operating profit (Loss)
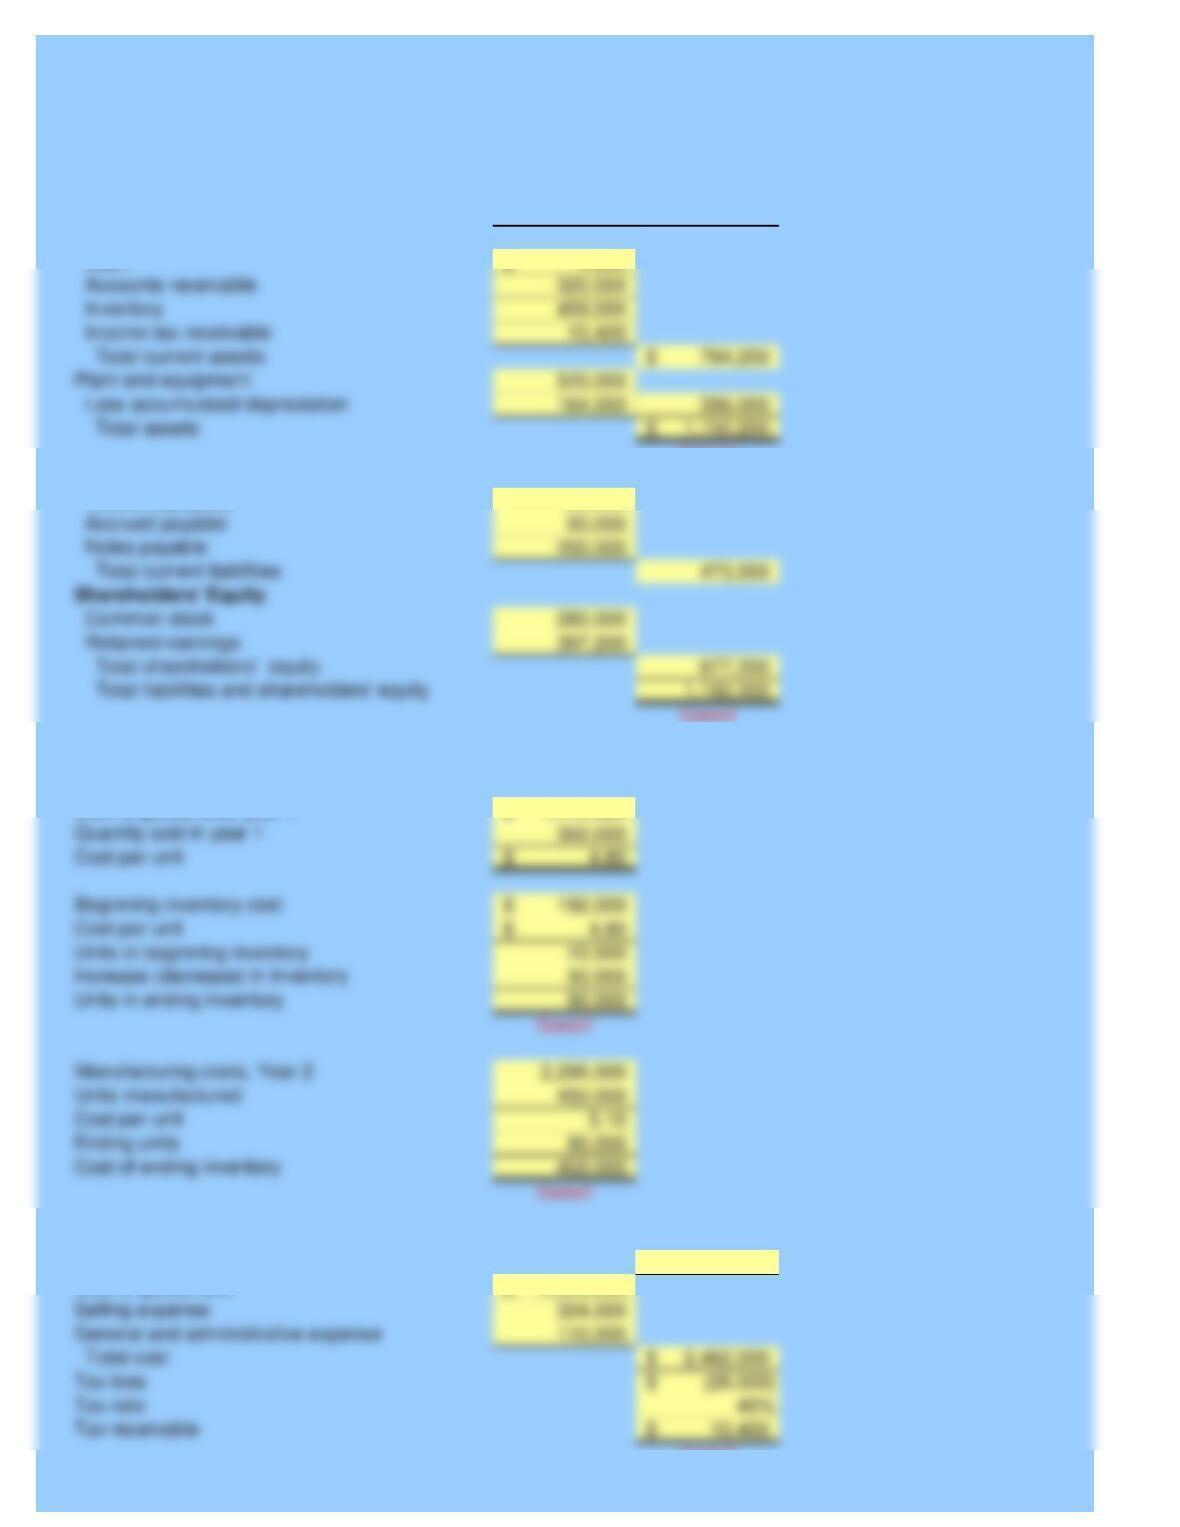
Shareholders’ Equity
Common stock
Total current liabilities
Accrued payable
Notes payable
Retained earnings
Total liabilities and shareholders’ equity
Total shareholders’ equity
Correct!
180,000
NOTES:
Quantity sold in year 1
Cost per unit
Beginning inventory cost
Cost per unit
Units in beginning inventory
Increase (decrease) in inventory
Units in ending inventory
Manufacturing costs, Year 2
Units manufactured
Ending units
Cost of ending inventory
1,440,000$
Tax receivable
Selling expense
General and administrative expense
Total cost
Tax loss
Tax rate
2,436,000$
2,028,000$
Correct!
Budgeted
December 31,
PANTHER CORPORATION
Budgeted Balance Sheet
(in thousands)
Current Liabilities
Accounts payable
Current Assets
Cash
Year 2
Computation of ending inventory:
Cost of goods sold, year 1
Computation of ending retained earnings:
Computation of income tax:
Sales and other income
Cost of goods sold
Accounts receivable
Inventory
Income tax receivable
Plant and equipment
Less accumulated depreciation
Total assets
Total current assets
432,800$
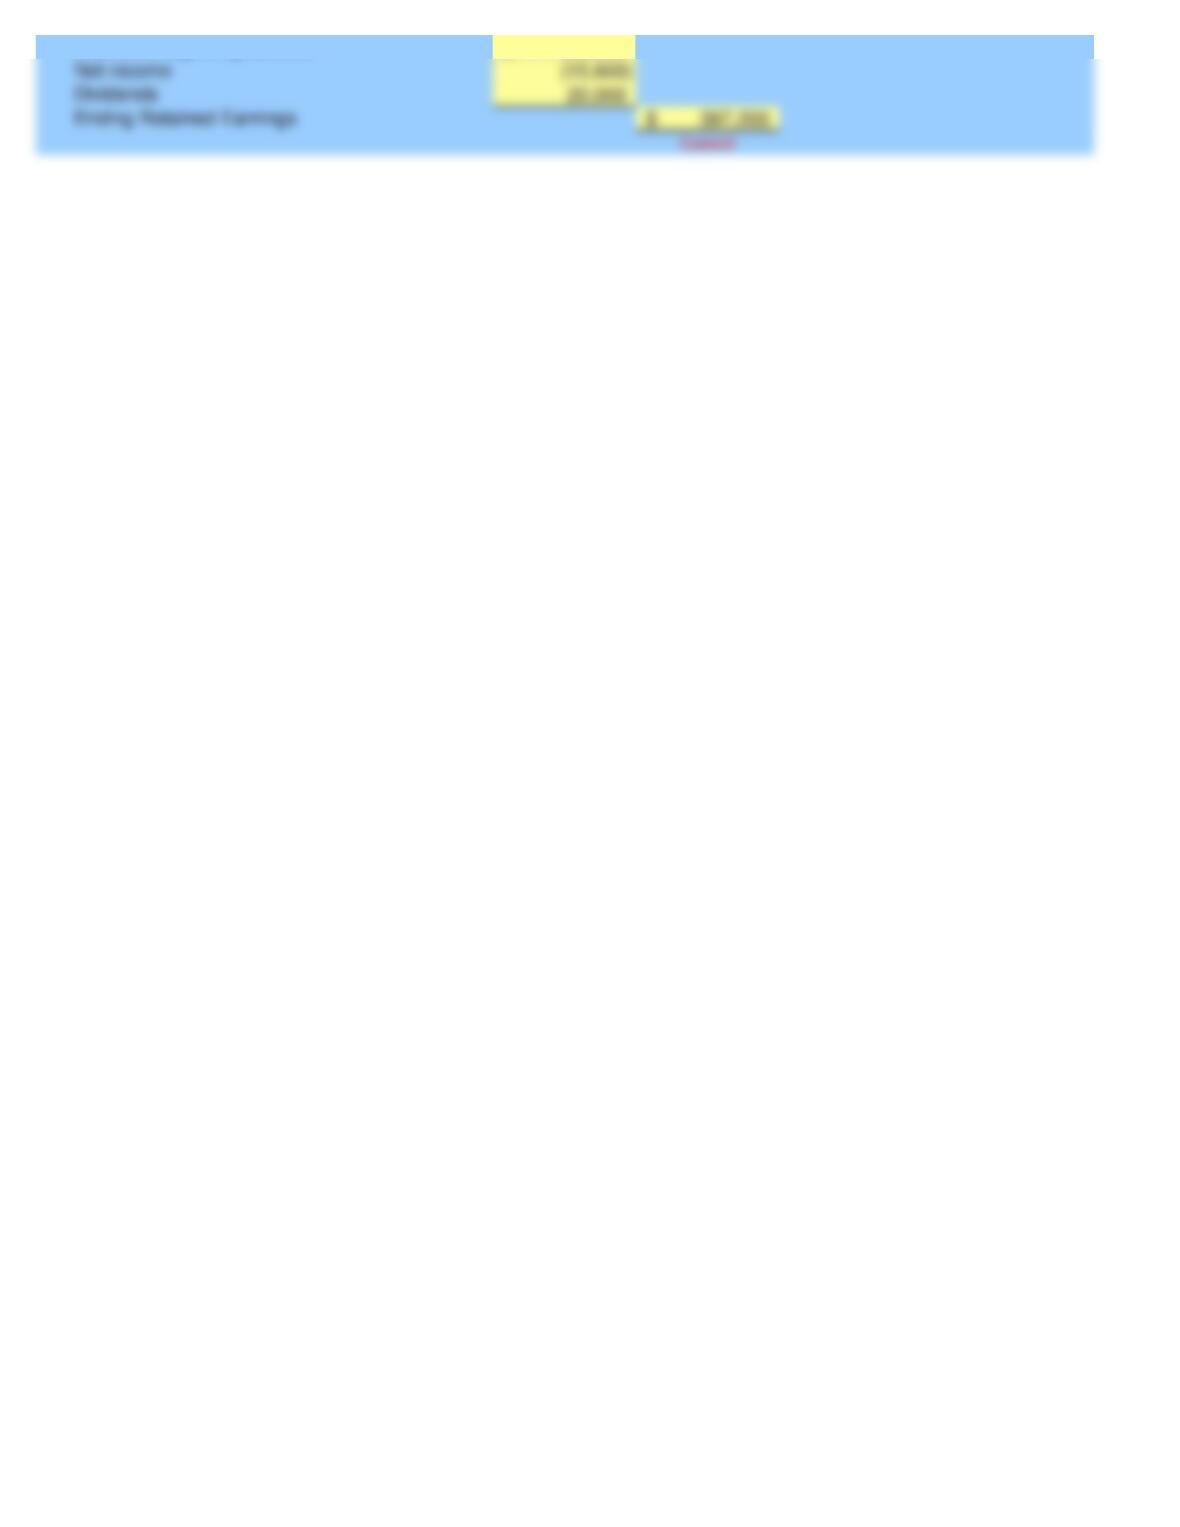
Expected beginning balance
Net income
Ending Retained Earnings
4,800$
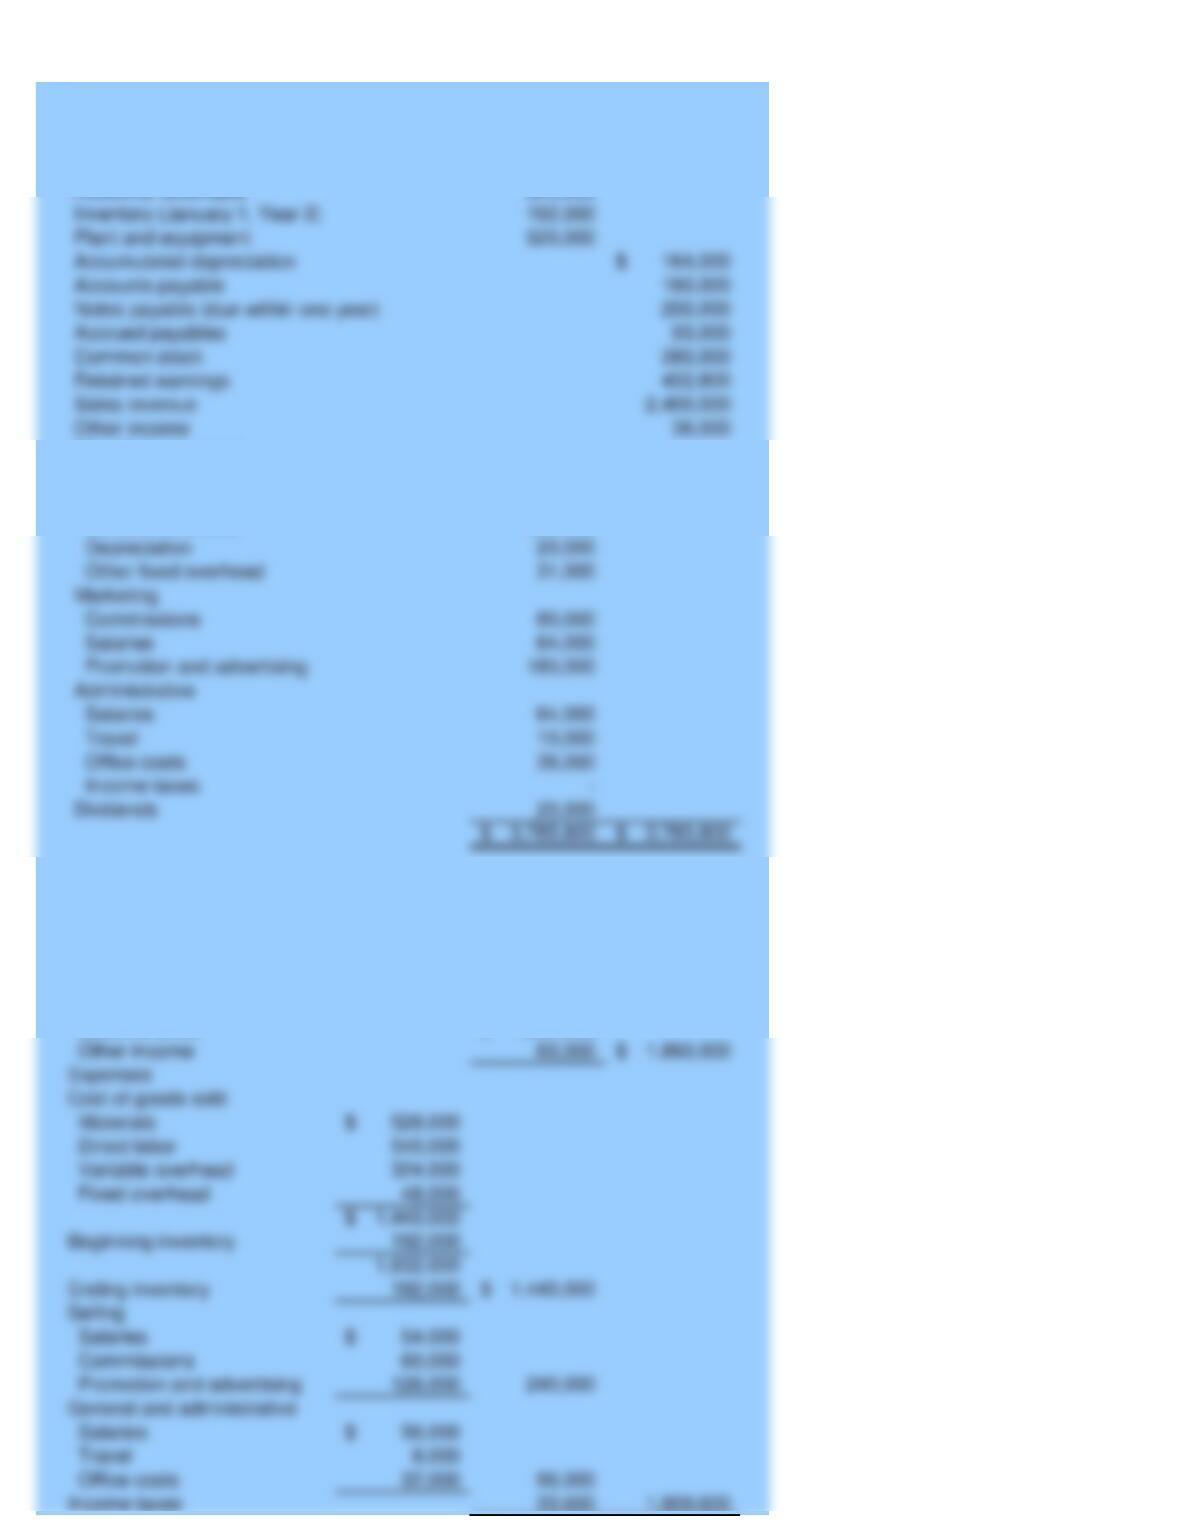
Depreciation
Other fixed overhead
Marketing
Commissions
Salaries
Promotion and advertising
Income taxes
Dividends
Administrative
Salaries
Travel
Office costs
852,000
872,000
520,000
Ending inventory
Selling
Other income
Expenses
Cost of goods sold
Direct labor
Variable overhead
Fixed overhead
Beginning inventory
Salaries
Commissions
Promotion and advertising
General and administrative
Salaries
Travel
Office costs
Income taxes
1,800,000$
For the Budget Year Ended December 31, Year 1
Statement of Income and Retained Earnings
PANTHER CORPORATION
Materials
Direct labor
Variable overhead
Manufacturing costs
Given Data P13-58:
Cash
PANTHER CORPORATION
Expected Account Balances for December 31, Year 2
Revenues
Sales revenue
Plant and equipment
Accounts receivable
Inventory (January 1, Year 2)
Accumulated depreciation
Accounts payable
Notes payable (due within one year)
Accrued payables
Common stock
Retained earnings
Sales revenue
Other income
50,400
402,400
Beginning retained earnings
Operating profit
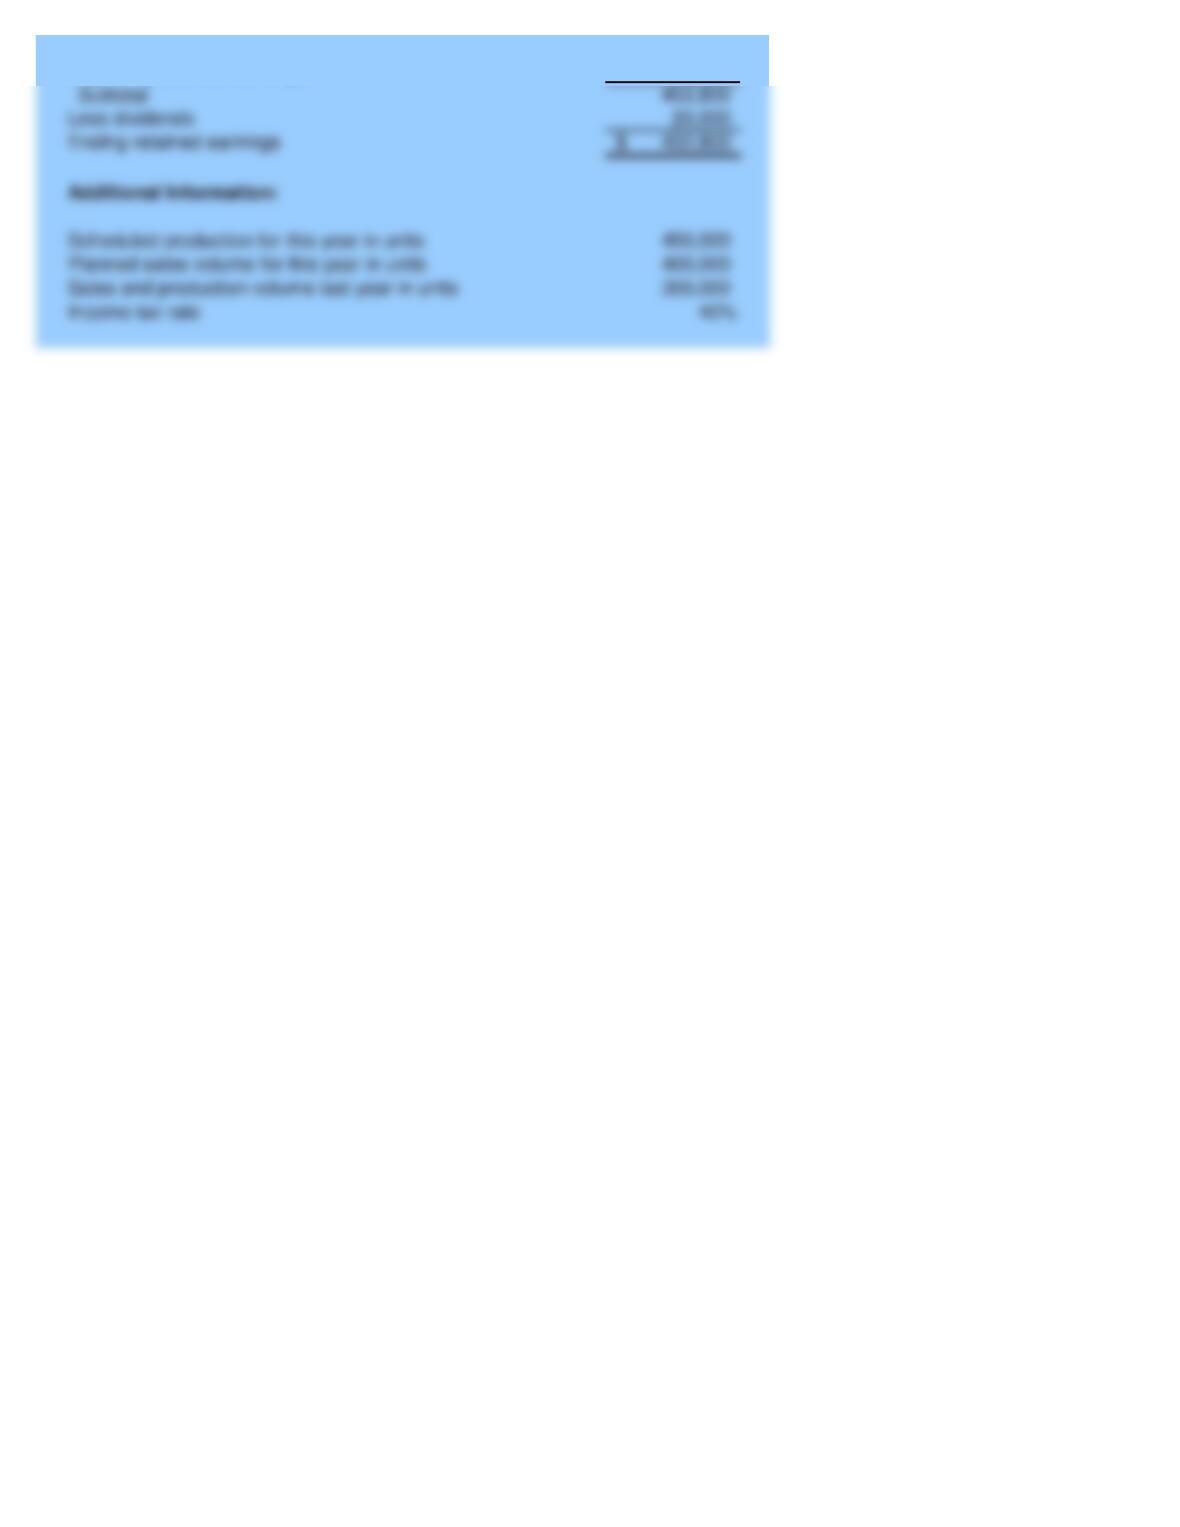
Subtotal
Less dividends
Income tax rate
Scheduled production for this year in units
Planned sales volume for this year in units
Sales and production volume last year in units