
EMERGING TOPICS IN
MANAGERIAL ACCOUNTING
DISCUSSION QUESTIONS
1. The most important reason for an organization to use enterprise risk management is to help the organization
achieve its chosen strategy more effectively and/or more quickly than if the company were managed on an ad
hoc basis without consideration for how various strategic and operational decisions affected one another and
the organization overall.
2. Inherent risk is the risk that exists before any action has been taken to manage the risk. Residual risk is the
risk that remains after any risk management action has been taken.
4. Environmental sustainability is much narrower than business sustainability. Environmental sustainability refers
solely to the various environmentally oriented risks and opportunities facing a given organization, such as the
amount of electricity consumed in a service facility or the size of an organization’s carbon emissions footprint.
While these issues are important to many organizations, most organizations also must identify, measure, and
manage a much larger number of risks and opportunities in order to thrive, or even survive, over the long
term. Such additional risks and opportunities might involve financial, economic, social, employee, or
regulatory issues.
5. Performance measurement is an important aspect of successful business sustainability efforts because
quantifying an organization’s key stakeholder issues, which can be considered to be the same as the
organization’s top risks and opportunities, improves management’s ability to manage this most important
issue and report to stakeholders on their successes and challenges with such issues. Some risks and
opportunities are difficult to measure and perhaps should be measured qualitatively at first and then
quantitatively later on once the managerial accounting team better understands how to do so accurately. Also,
quantitative sustainability measurement often is led by nonfinancial (or leading) measures, followed by
financial measures, again after the managerial accounting team determines how to most accurately link key
stakeholder issues (risks/opportunities) to the financial measures that shareholders and other key
stakeholders most care about.
13

CHAPTER 13 Emerging Topics in Managerial Accounting
© 2018 Cengage Learning. All rights reserved. May not be scanned, copied or duplicated, or posted to a publicly accessible website, in whole or in part.
7. A quality cost report shows the amount of cost for each category as well as the relative cost of each category.
This report requires managers to identify the costs that should appear in the report, to identify the current
quality performance level, and to begin thinking about the level of quality performance that should be
achieved.
10. If the products in the value stream are quite similar, then the average cost will approximate the actual unit
product cost. If the product mix is relatively stable over time, then the average unit cost can be a good signal
of overall changes in efficiency within the value stream.
11. Differences among countries in terms of the political, legal, and cultural environment can all affect the firm.
The management accountant may find that practices that work well in the home country do not work as well
(or at all) in other countries. It is necessary for the management accountant to be aware of all facets of
business and to be knowledgeable and creative in applying accounting concepts in various business
environments.
12. A foreign trade zone is an area that is physically on U.S. soil but is considered to be outside U.S. commerce.
As a result, goods imported into a foreign trade zone are free of tariff or duty until they leave the zone.
Therefore, companies located in a foreign trade zone can postpone payment of tariff and the associated loss
of working capital. Additionally, the company does not pay duty on defective materials or inventory that has
not been included in the finished product.
13. Outsourcing is the payment by a company for a business function that was formerly done in house. In an
international context, outsourcing refers to the location of business functions in another country. Frequently,
the work outsourced is to a lower-wage country. The company receives a comparable quality of work but at a
lower cost.

CHAPTER 13 Emerging Topics in Managerial Accounting
MULTIPLE-CHOICE QUESTIONS
13-1. b
13-5. e
13-6. e
13-7. c
13-8. d
13-9. c
13-12. d
13-13. b
13-14. c (60 minutes per hour/12 minutes for drilling)
13-15. c
13-16. a

CHAPTER 13 Emerging Topics in Managerial Accounting
BRIEF EXERCISES: SET A
BE 13-20
1. The inherent risk formula takes the following form:
Inherent risk = (Likelihood) × (Impact)
2. The residual risk formula takes the following form:
Note: For Residual risk, the likelihood and impact are assessed AFTER considering
the effects of a particular response alternative.
Residual risk for A = $16,000,000 ($80,000,000 × 0.20)
Residual risk for B = $7,500,000 ($50,000,000 × 0.15)
Residual risk for C = $24,000,000 ($80,000,000 × 0.30)
3. The benefit formula takes the following form:
Benefit = Inherent risk – Residual risk
4. The net benefit formula takes the following form:
Net benefit = Response benefit – Response cost
Benefit for A = $5,000,000 ($8,000,000 – $3,000,000)
Benefit for B = $3,500,000 ($16,500,000 – $13,000,000)
Benefit for C = $0 ($0 – $0)
5. The risk response alternative with the greatest net benefit is alternative A. It is worth
noting that while alternative B had the larger response benefit (than A), B’s cost was
CHAPTER 13 Emerging Topics in Managerial Accounting
BE 13-21
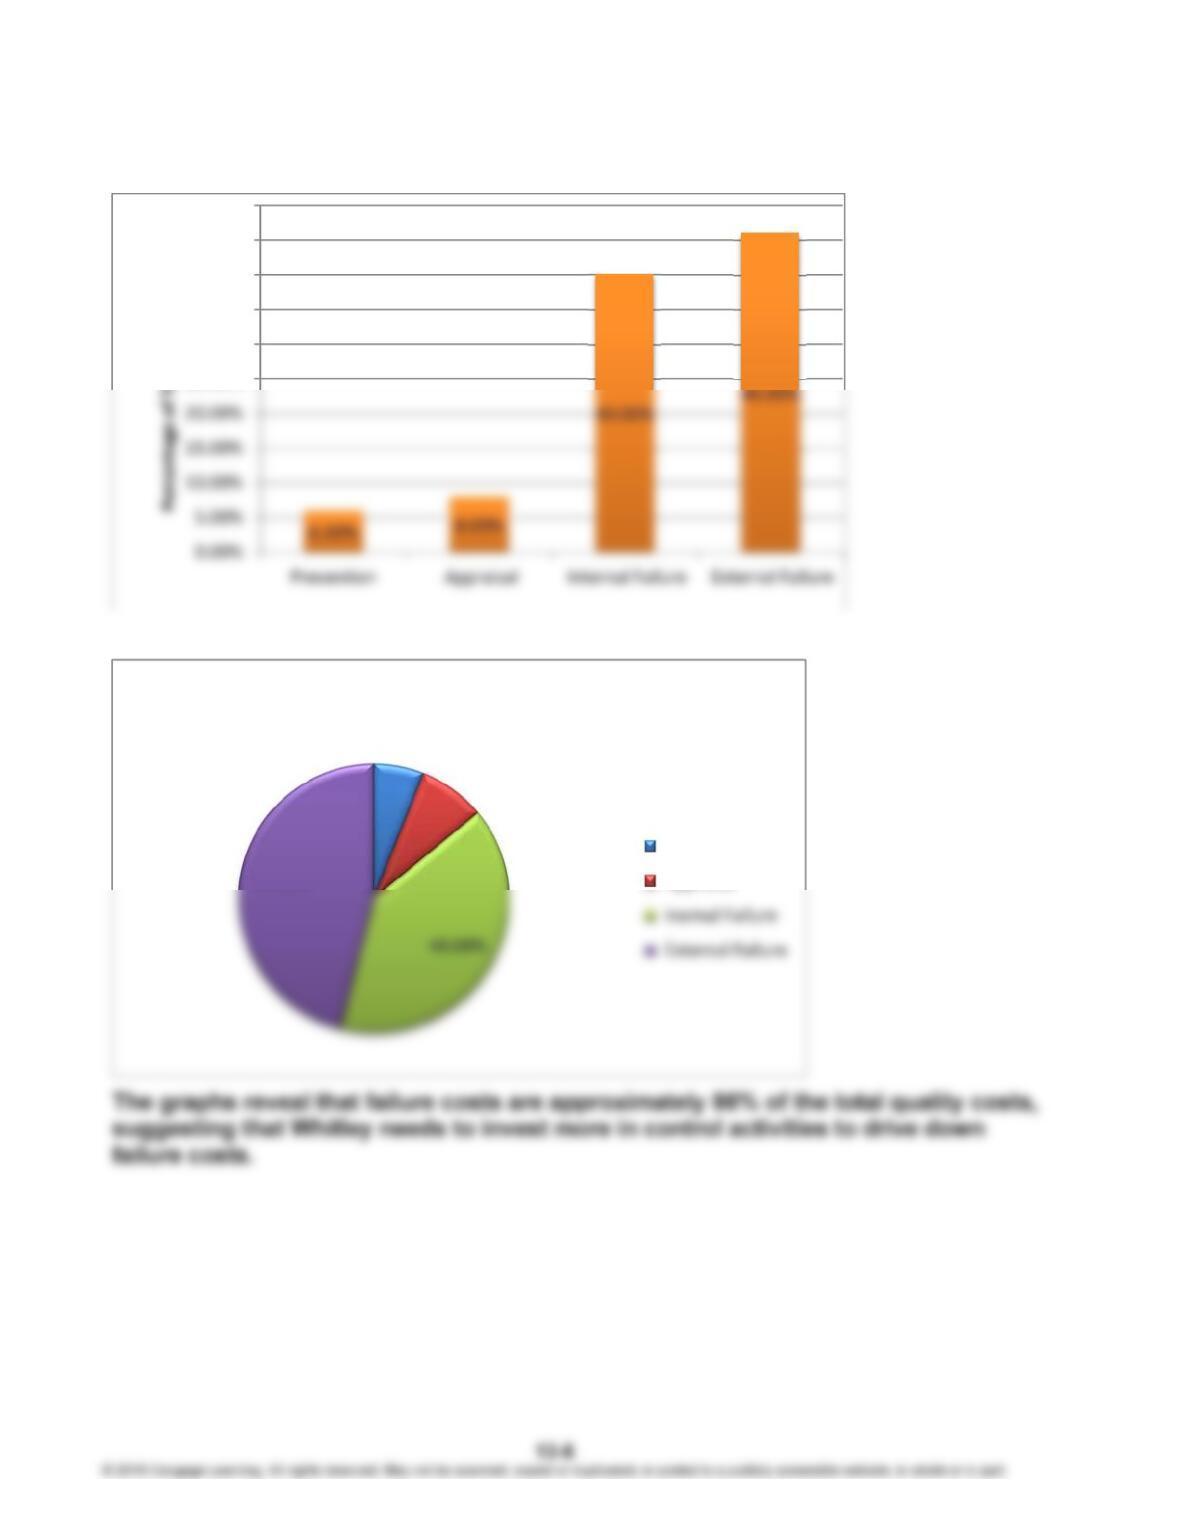
1. Whitley Company
Quality Cost Report
For the Year Ended 20X1
Percentage
Quality Costs of Salesa
Prevention costs:
Quality circles …………………. $ 2,000
Prototype inspection……….. 13,000 $ 15,000 1.50%
Appraisal costs:
Field testing ……………………. $ 6,000
Packaging inspection ……… 14,000 20,000 2.00
Internal failure costs:
Design changes ………………. $ 60,000
Downtime ……………………….. 40,000 100,000 10.00
CHAPTER 13 Emerging Topics in Managerial Accounting
BE 13-21 (Concluded)
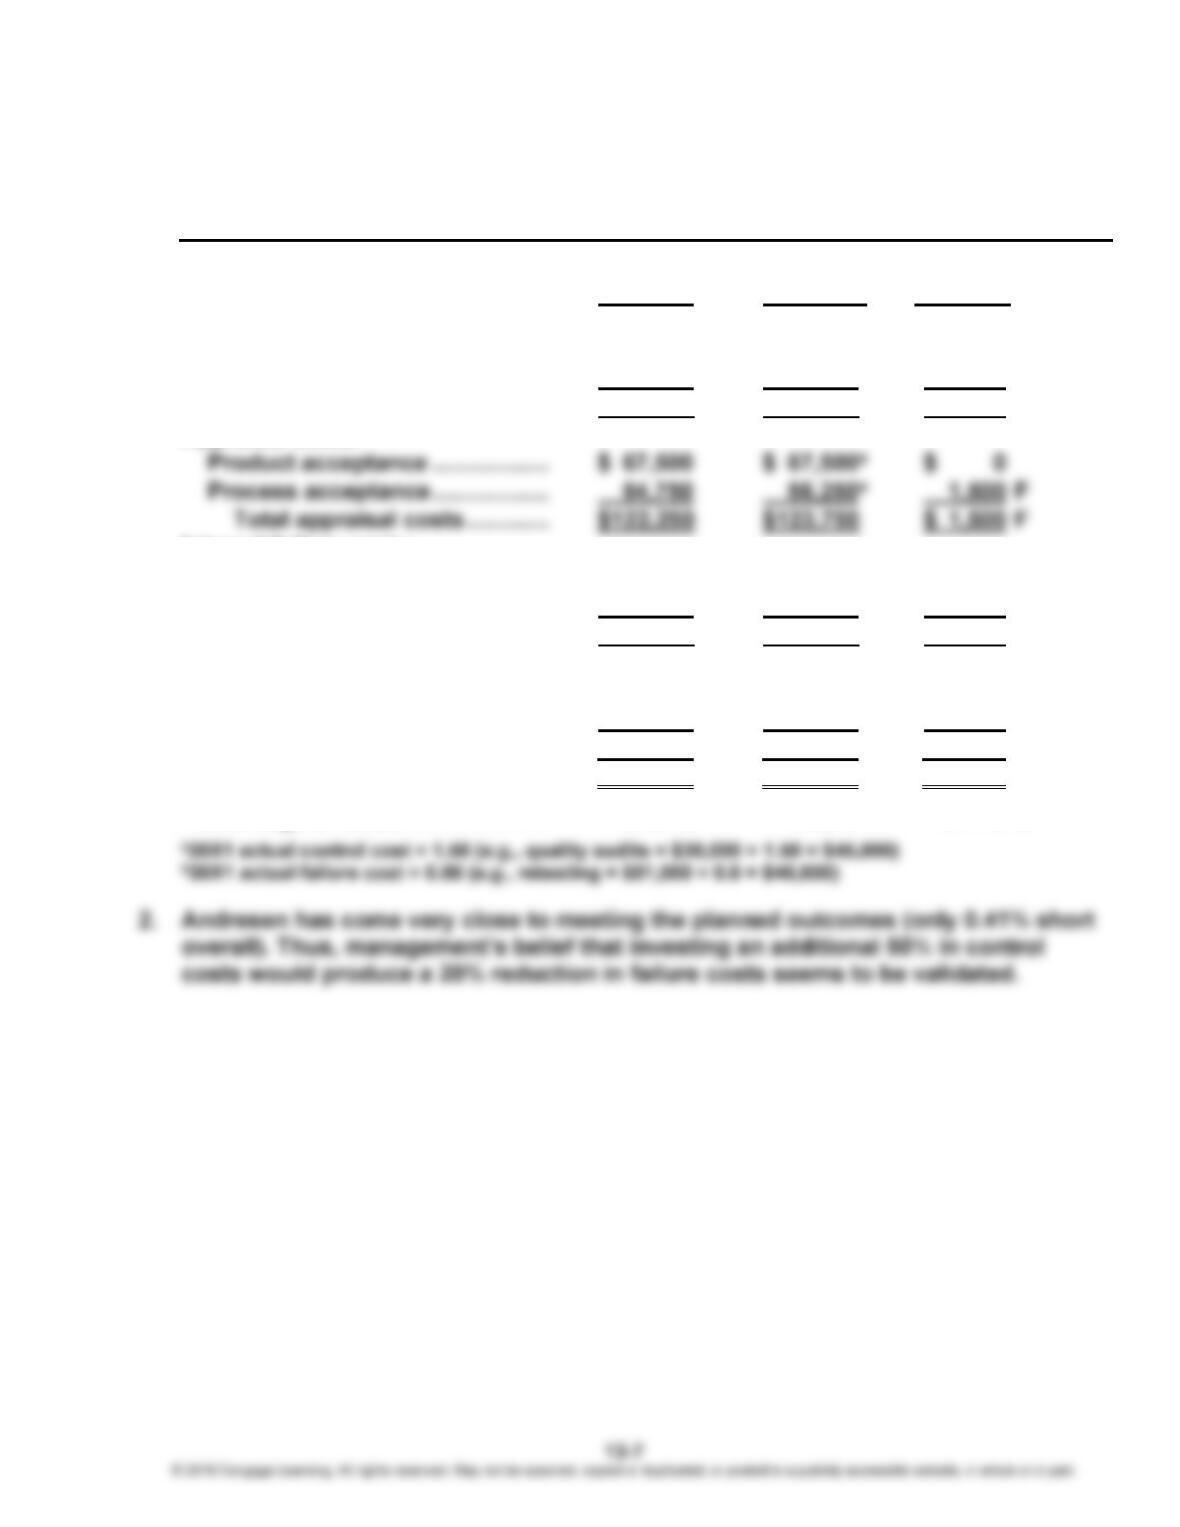
2. Quality Cost Categories: Relative Contribution Graphs
25.00%
30.00%
35.00%
40.00%
45.00%
50.00%
6.00%
8.00%
PercentageofTotalQualityCosts
Prevention
CHAPTER 13 Emerging Topics in Managerial Accounting
BE 13-22
1. Andresen Company
Interim Standard Performance Report: Quality Costs
For the Year Ended June 30, 20X2
Actual Budgeted
Costs Costs Variance
Prevention costs:
Quality audits ……………………….. $ 45,000 $ 45,000a $ 0
Vendor certification ………………. 90,000 90,000a 0
Total prevention costs ………. $135,000 $135,000 $ 0
Appraisal costs:
Internal failure costs:
Retesting ……………………………… $ 45,000 $ 40,800b $ 4,200 U
Rework ………………………………… 90,000 86,400b 3,600 U
Total internal failure costs …. $135,000 $127,200 $ 7,800 U
External failure costs:
Recalls …………………………………. $ 60,000 $ 60,000b $ 0
Warranty ………………………………. 150,000 132,000b 18,000 U
Total external failure costs … $210,000 $192,000 $18,000 U
Total quality costs ……………………. $602,250 $577,950 $24,300 U
Percentage of sales ………………….. 10.04% 9.63% 0.41% U
CHAPTER 13 Emerging Topics in Managerial Accounting
BE 13-23
1.
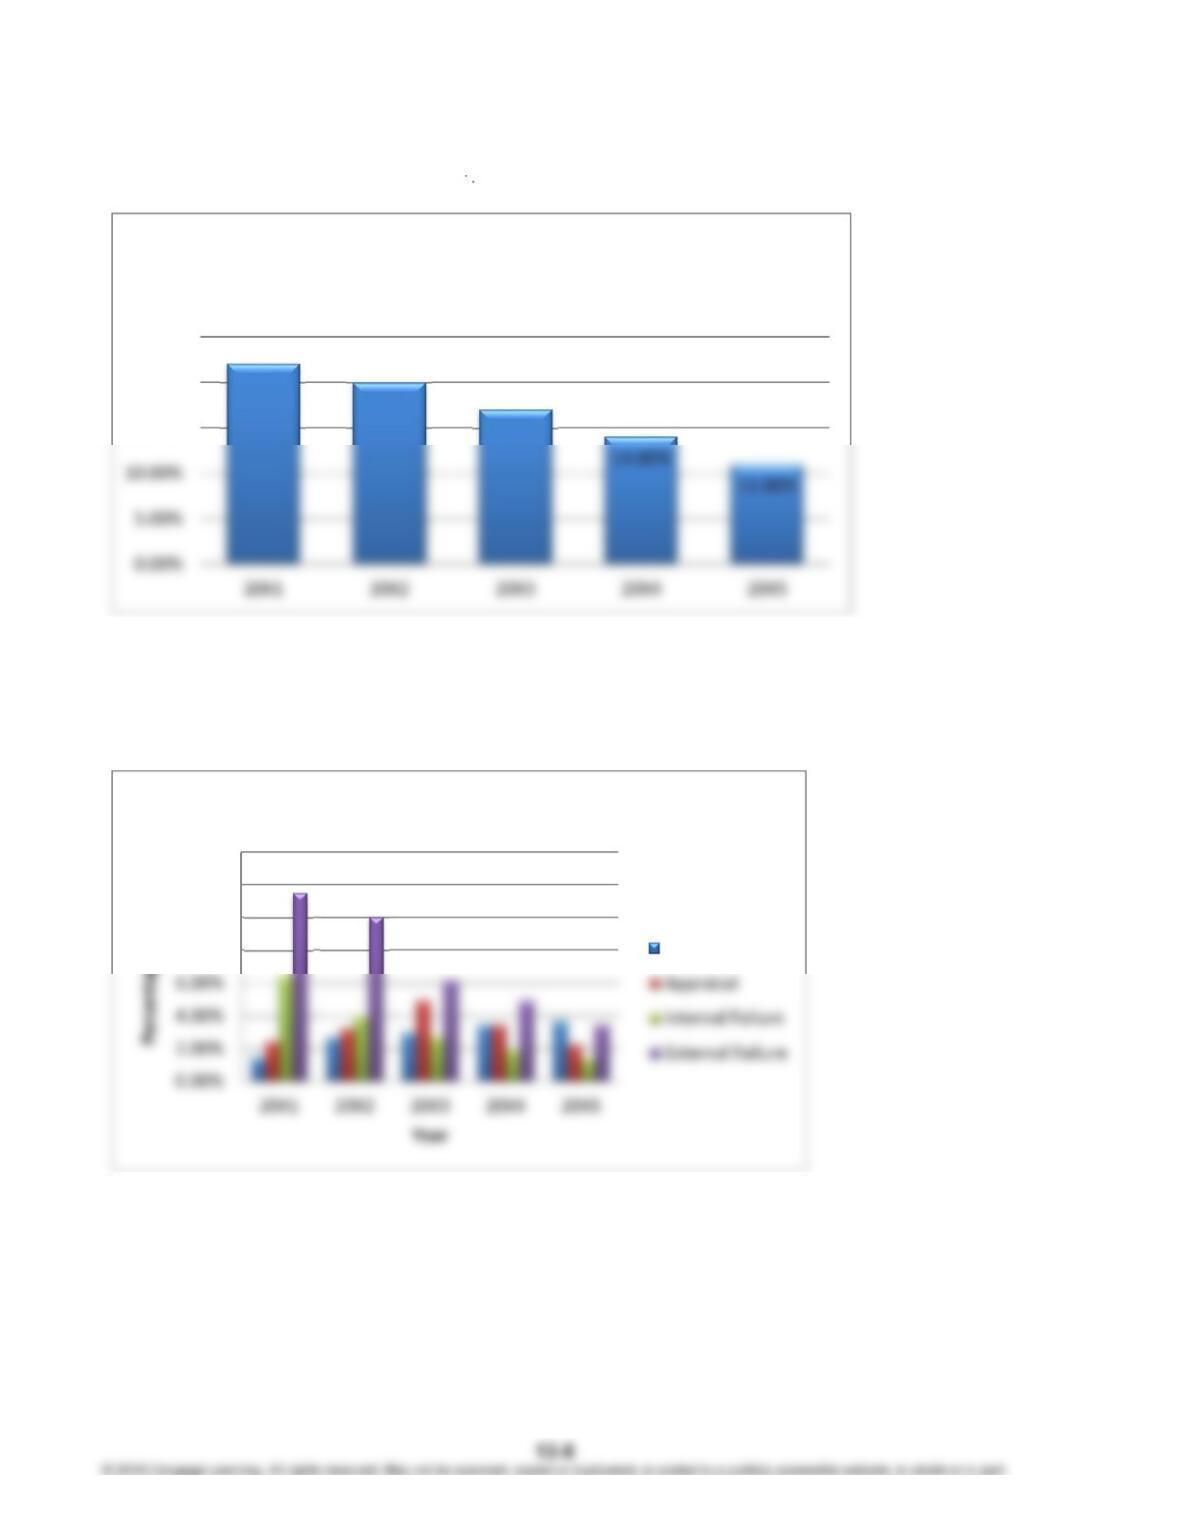
The trend graph reveals that quality costs have been cut in half as a percentage of
sales; however, at 11.00%, there is still substantial improvement opportunity left.
2.
This graph reveals much more detail. For example, external failure costs are only
about 30% of the original amount, and internal failure costs are only 20 to 25% of
their beginning levels. Clearly, the additional investment in control costs has paid
off.
22.00%
20.00%
17.00%
15.00%
20.00%
25.00%
Multiple‐PeriodTrendGraph:Total
QualityCosts
8.00%
10.00%
12.00%
14.00%
TrendGraphbyCategories
Prevention
CHAPTER 13 Emerging Topics in Managerial Accounting
BE 13-24
1. Total lead time for a batch of 10 units:
Processing time:
Cutting ………………………………. 50 minutes
Welding ……………………………… 100 minutes
Polishing ……………………………. 80 minutes
2. Processing time (10 units): Elapsed time
First unit ……………………………. 30 minutes
Second unit ……………………….. 40 minutes (processing begins
5 minutes after the first)
Tenth unit ………………………….. 120 minutes (total processing time)
3. Eight minutes (for polishing) is now the longest per-unit processing time and so the
production rate is 60/8 = 7.5 units per hour. Producing 10 units will take 75 minutes
[(10/8) × 60].
BE 13-25
1. Unit cost = $900,000/16,000 = $56.25 per unit. The cost is very accurate as the value
stream is dedicated to one product and its costs all belong to that product.
2. First, the unit materials cost is calculated separately:
Model A: $176,800*/4,000 = $44.20
CHAPTER 13 Emerging Topics in Managerial Accounting
© 2018 Cengage Learning. All rights reserved. May not be scanned, copied or duplicated, or posted to a publicly accessible website, in whole or in part.
BE 13-25 (Concluded)
Finally, the unit cost is computed (sum of materials and average conversion cost):
Model A: $44.20 + $28.63 = $72.83
Model B: $22.10 + $28.63 = $50.73
Using units shipped for the unit calculation motivates managers to reduce
inventories.
3. DBC assigns the conversion cost to each product using the conversion cost rate
and each product’s cycle time:
Conversion Cost Rate = Conversion Cost/Total Hours
= $458,000/10,000
= $45.80 per hour
Conversion Cost per Unit (Model B) = Rate × Cycle Time
= $45.80 × 0.47
= $21.53
Cost per unit (Model B) = $22.10 + $21.53 = $43.63
DBC approximates ABC cost assignments and so better reflects the consumption of
resources by the two products.
BE 13-26
1. 70,100 pesos/10.9 = $6,431
CHAPTER 13 Emerging Topics in Managerial Accounting
BRIEF EXERCISES: SET B
BE 13-27
1. The inherent risk formula takes the following form:
Inherent risk = (Likelihood) × (Impact)
2. The residual risk formula takes the following form:
Note: For Residual risk, the likelihood and impact are assessed AFTER considering
the effects of a particular response alternative.
Residual risk for A = $48,750 ($325,000 × 0.15)
Residual risk for B = $105,000 ($300,000 × 0.35)
Residual risk for C = $400,000 ($1,000,000 × 0.40)
3. The benefit formula takes the following form:
Benefit = Inherent risk – Residual risk
4. The net benefit formula takes the following form:
Net benefit = Response benefit – Response cost
Net benefit for A = $150,000 ($351,250 – $201,250)
Net benefit for B = $100,000 ($295,000 – $195,000)
Net benefit for C = $0 ($0 – $0)
5. The risk response alternative with the greatest net benefit, $150,000, is alternative A.
Therefore, Palakiko should select and implement risk response alternative A (i.e.,
new and larger refrigeration units). Further, while not provided as an option in this
CHAPTER 13 Emerging Topics in Managerial Accounting
BE 13-28
1. Loring Company
Quality Cost Report
For the Year Ended 20X1
Percentage
Quality Costs of Salesa
Prevention costs:
Marketing research …………. $ 6,000
Vendor certification ………… 14,000 $ 20,000 0.83%
Internal failure costs:
Rework …………………………… $120,000
Retesting ……………………….. 30,000 150,000 6.25
External failure costs:
Discounts due to defects … $100,000
Product liability ……………… . 200,000 300,000 12.50
Total quality costs ……………….. $500,000 20.83%b
CHAPTER 13 Emerging Topics in Managerial Accounting
BE 13-28 (Concluded)
2. Quality Cost Categories: Relative Contribution Graphs
The graphs reveal that failure costs are approximately 90% of the total quality costs,
suggesting that Loring needs to invest more in control activities to drive down
failure costs.
40.00%
50.00%
60.00%
70.00%
4.00% 6.00%
PercentageofTotalQualityCosts
Prevention
Appraisal
CHAPTER 13 Emerging Topics in Managerial Accounting
BE 13-29
1. Cassara, Inc.
Interim Standard Performance Report: Quality Costs
For the Year Ended December 31, 20X2
Actual Budgeted
Costs Costs Variance
Prevention costs:
Design reviews ……………………… $ 83,000 $ 84,000a $ 1,000 F
Prototype inspection ……………… 168,000 168,000a 0
Total prevention costs ……….. $ 251,000 $ 252,000 $ 1,000 F
Internal failure costs:
Scrap ……………………………………. $ 76,200 $ 75,000b $ 1,200 U
Repairs …………………………………. 166,800 165,000b 1,800 U
Total internal failure costs ….. $ 243,000 $ 240,000 $ 3,000 U
External failure costs:
Lost sales ……………………………… $ 122,000 $ 120,000b $ 2,000 U
Product liability …………………….. 277,000 270,000b 7,000 U
2. Cassara has come very close to meeting the planned outcomes (only 0.10% short
overall). Thus, management’s belief that investing an additional 50% in control
costs would produce a 25% reduction in failure costs seems to be validated.
CHAPTER 13 Emerging Topics in Managerial Accounting
BE 13-30
1.
The trend graph reveals that quality costs have been cut by a little more than half as
a percentage of sales; however, at 12.00%, there is still substantial improvement
opportunity left.
2.
This graph reveals much more detail. For example, external failure costs are only
about 19% of the original amount and internal failure costs are about 26% of their
beginning levels. Clearly, the additional investment in control costs has paid off.
25.00% 23.00%
20.00%
15.00%
20.00%
25.00%
30.00%
TrendInTotalQualityCosts
8.00%
10.00%
12.00%
14.00%
TrendbyQualityCostCategory
Prevention

CHAPTER 13 Emerging Topics in Managerial Accounting
BE 13-31
1. Total lead time for a batch of 20 units:
Processing time:
Castng ……………………………….. 240 minutes
Grinding ……………………………… 120 minutes
2. Processing time (20 units): Elapsed time
First unit …………………………….. 30 minutes
Second unit ………………………… 42 minutes (processing begins
12 minutes after the first)
Twentieth unit …………………….. 258 minutes (total processing time)
Time saved over traditional manufacturing: 670 minutes – 258 minutes = 412
minutes
3. Ten minutes (for drilling) is now the longest per-unit processing time and so the
production rate is 60/10 = 6 units per hour. Producing 20 units will take 200 minutes
[(20/6) × 60].
BE 13-32
1. Unit cost = $225,000/4,000 = $56.25 per unit. The cost is very accurate as the value
stream is dedicated to one product and its costs all belong to that product.
2. First, the unit materials cost is calculated separately:
SK1: $66,300*/1,500 = $44.20
SK3: $44,200/2,500 = $17.68
*60% × $110,500
Next, the average unit conversion cost is calculated: $114,500*/4,000 = $28.63.
*($225,000 – $110,500)

CHAPTER 13 Emerging Topics in Managerial Accounting
BE 13-32 (Concluded)
3. DBC assigns the conversion cost to each product using the conversion cost rate
and each product’s cycle time:
Conversion Cost Rate = Conversion Cost/Total Hours
= $114,500/2,500
= $45.80 per hour
Conversion Cost per Unit (Tool SK3) = Rate × Cycle Time
= $45.80 × 0.56
= $25.65
has more consistent accuracy, it would be preferred.
BE 13-33
1. 75,000 pesos/10.9 = $6,881
3. Exchange Loss = $6,881 – $6,579 = $302

CHAPTER 13 Emerging Topics in Managerial Accounting
EXERCISES
E 13-34
= B [Residual risk 4 (RR4)]
= A [Inherent risk 3 (IR3)]
E 13-35
Inherent Risk 1 = Accept (offset by IR3)
Inherent Risk 2 = Avoid (therefore, there is no reference to IR2 or RR2 on the graph)
Inherent Risk 3 = Accept (offset by IR1)
Inherent Risk 4 = Reduce
Inherent Risk 5 = Reduce
E 13-36
1. The inherent risk formula takes the following form:
Inherent risk = (Likelihood) × (Impact)
Note: For Inherent risk, the likelihood and impact are assessed ABSENT of any
response alternative being implemented.
Inherent risk = $2,500,000 ($10,000,000 × 0.25)
The residual risk formula takes the following form:
The benefit formula takes the following form:
Benefit = Inherent risk – Residual risk
Therefore:
CHAPTER 13 Emerging Topics in Managerial Accounting
E 13-36 (Concluded)
2. The net benefit formula takes the following form:
Net benefit = Response benefit – Response cost
Therefore,
Net benefit for A = –$200,000 ($2,000,000 – $2,200,000)
Net benefit for B = $300,000 ($1,000,000 – $700,000)
Net benefit for C = $0 ($0 – $0)
E 13-37
Requirement 1:
Results of New Customer Financial Survey:
Increase in new customer market sales revenue $10,000,000
Results of Business Sustainability Analysis:
Decreased sales revenue from lost regular advertisers
(10% × $10,000,000) $ (1,000,000)
Additional fines from regulators from lost new customer data $ (1,500,000)
Increased sales from improved employee loyalty $ 2,000,000
Increased sales from regular customers who value
CHAPTER 13 Emerging Topics in Managerial Accounting
E 13-37 (Concluded)
Requirement 2:
Based on the combined results of the New Customer Financial Survey and the Business
Sustainability Analysis calculated in Requirement 1, Jack’s Apps Company should
pursue the new young adult market for its future apps. Doing so is expected to increase
Jack’s App’s total net income by $12,500,000. Interestingly, the Business Sustainability
Analysis reveals that this new app development target market strategy would actually
Requirement 3:
Additional considerations that Jack’s Apps Company management might be wise to
consider before making a final decision on whether or not to pursue the young adult
apps market might include any of the following items:
The reliability of the nonfinancial measures included in the Business
Sustainability Analysis (e.g., the degree of excitement for a more diverse
workforce and whether this excitement would drive additional sales as indicated)
The reliability of the New Customer Financial Survey regarding additional sales of
new apps in the target young adult market
E 13-38
1. Students’ responses will vary but likely will include five of the following stakeholder
groups: shareholders (investors), customers, suppliers, regulators, employees, local
communities, competitors, and nongovernmental organizations (NGOs, such as the
Sierra Club). Apple has many important stakeholders that either are affected by
Apple’s pursuit of its strategy and/or that can affect the success with which Apple
pursues its strategy. Many organizations have developed formal stakeholder