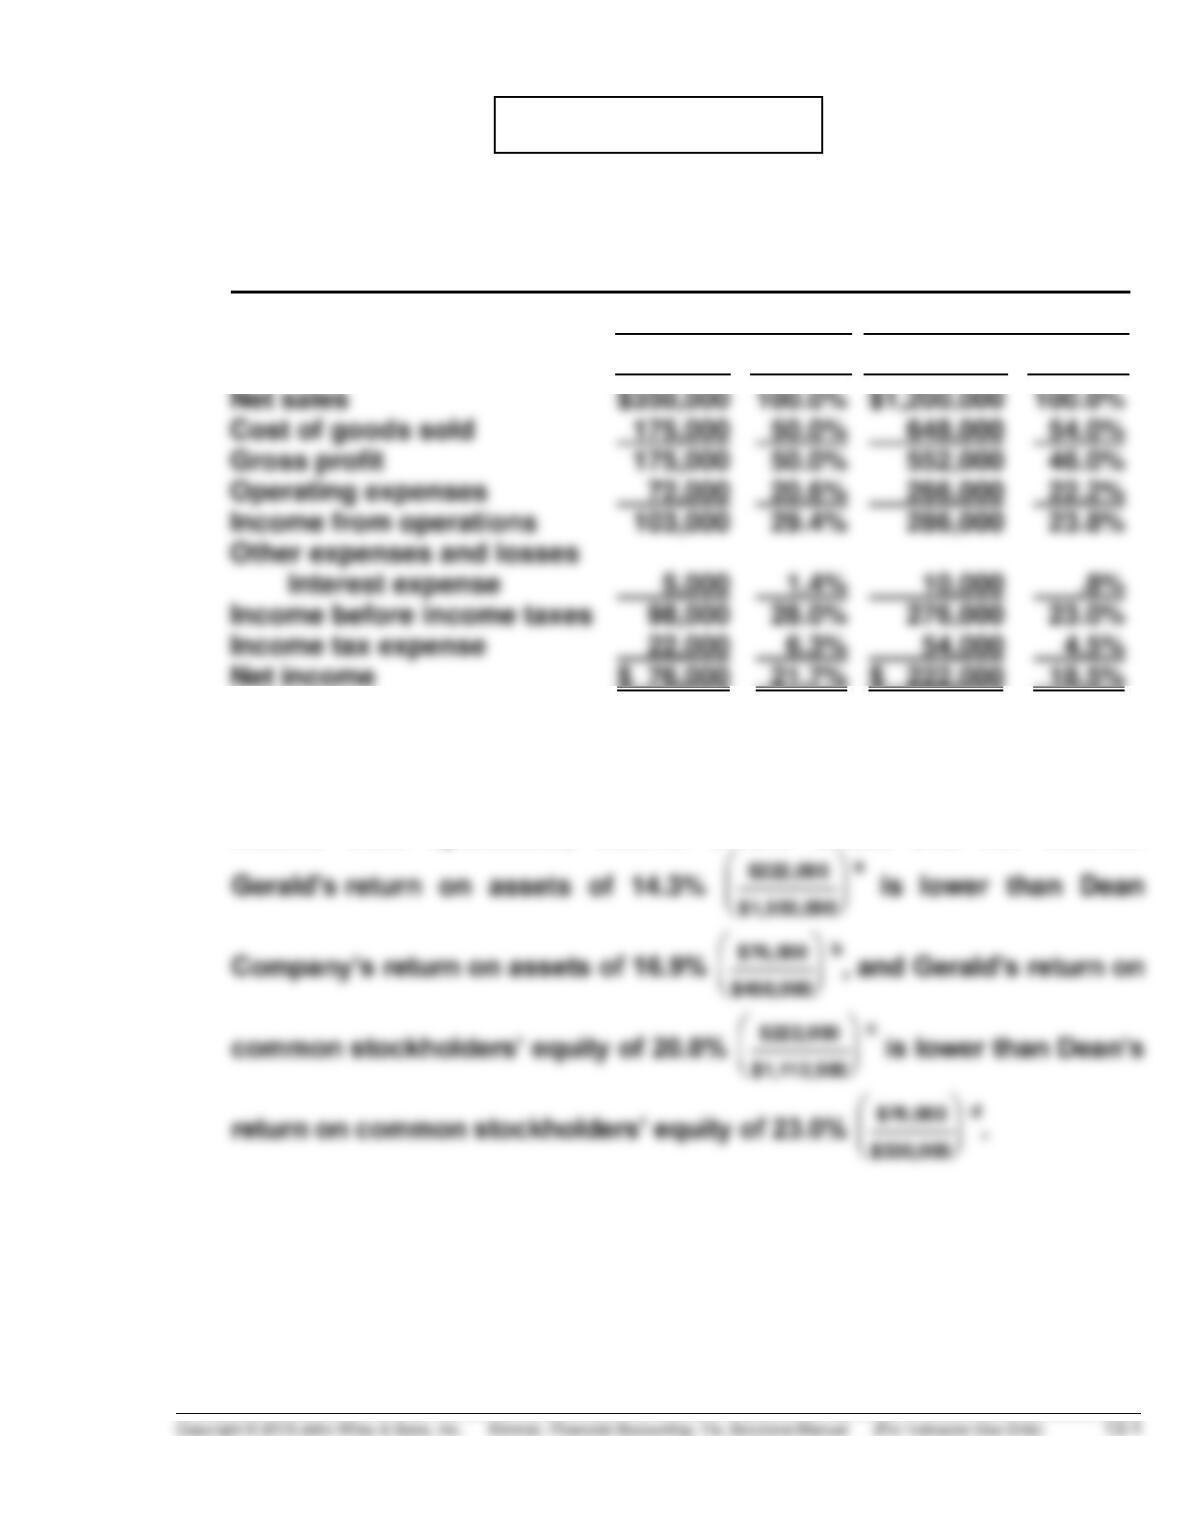
PROBLEM 13-1B
(a) Condensed Income Statement
For the Year Ended December 31, 2014
Dean Company
Gerald Company
Dollars
Percent
Dollars
Percent
Net income
$ 76,000
(b) Dean Company appears to be more profitable. It has higher relative
income from operations, income before taxes, and net income.
PROBLEM 13-1B (Continued)
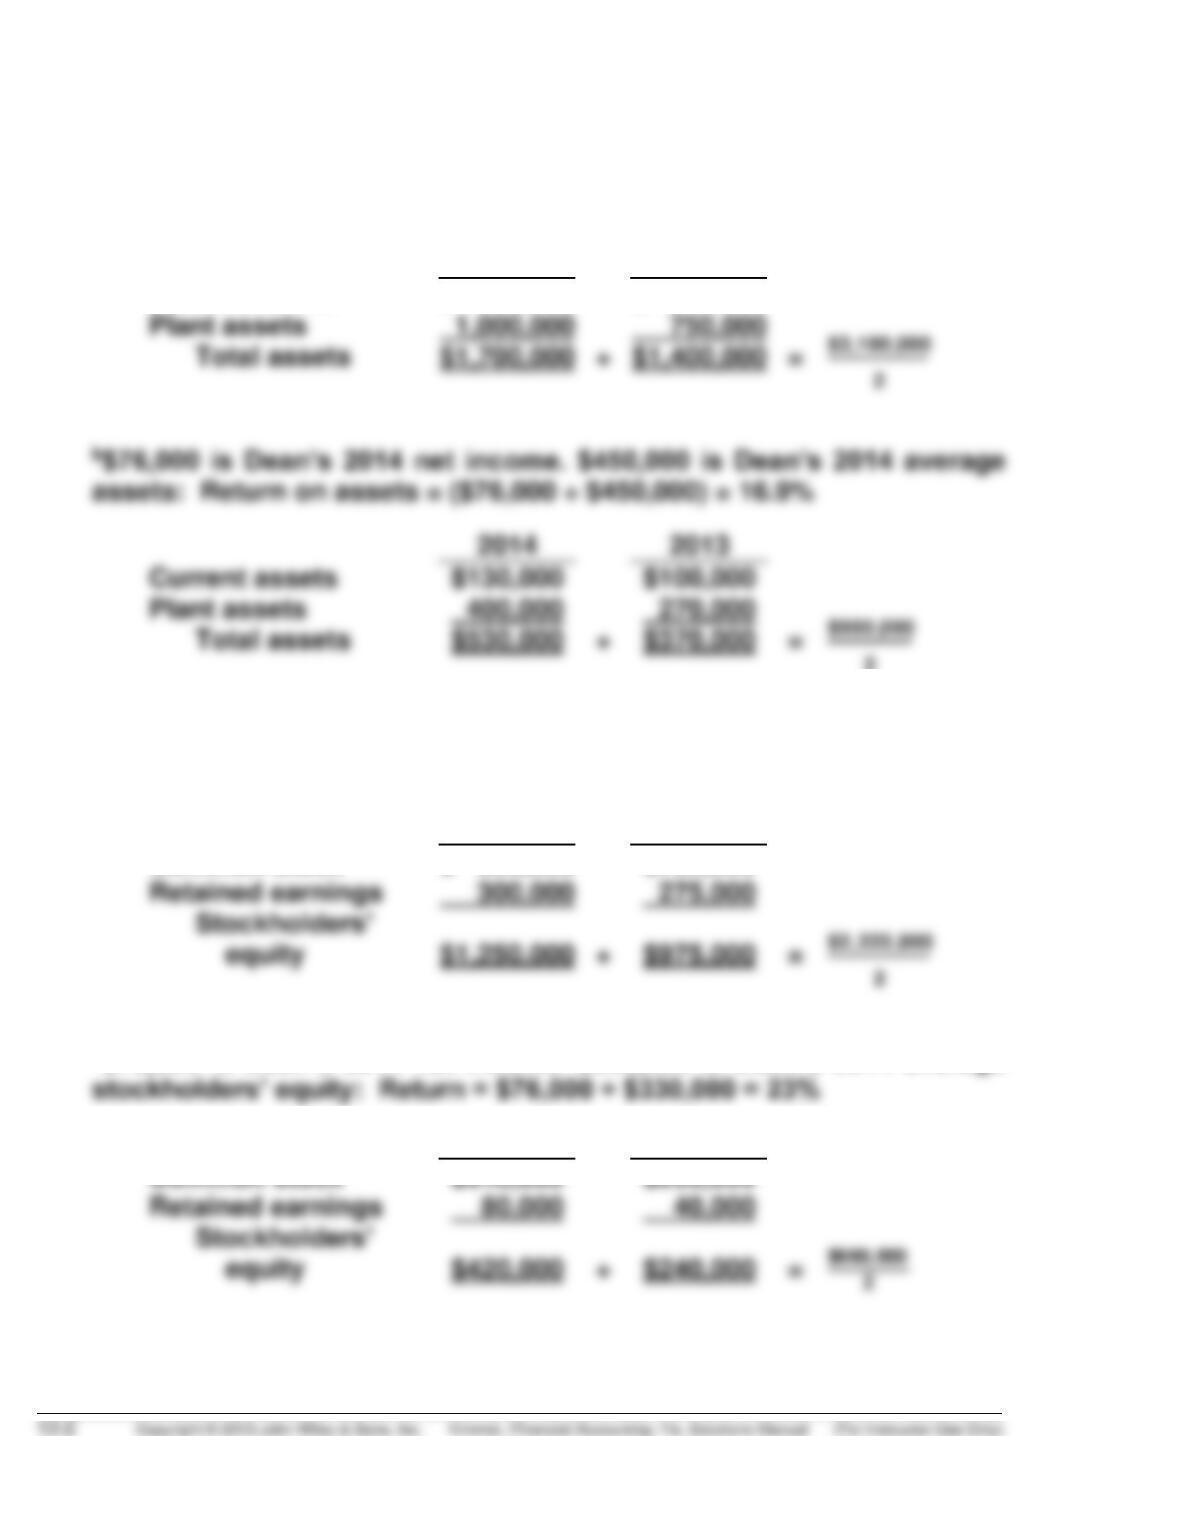
a$222,000 is Gerald’s 2014 net income. $1,550,000 is Dean’s 2014
average assets: Return on assets = ($222,000 ÷ $1,550,000) = 14.3%
2014
2013
2014
2013
Current assets
Current assets
$ 700,000
$ 650,000
2
c$222,000 is Gerald’s 2014 net income. $1,112,500 is Gerald’s 2014
average stockholders’ equity: Return = $222,000 ÷ $1,112,500 = 20.0%
2014
2013
Retained earnings
Common stock
$ 950,000
$700,000
d$76,000 is Dean’s 2014 net income. $330,000 is Dean’s 2014 average
2014
2013
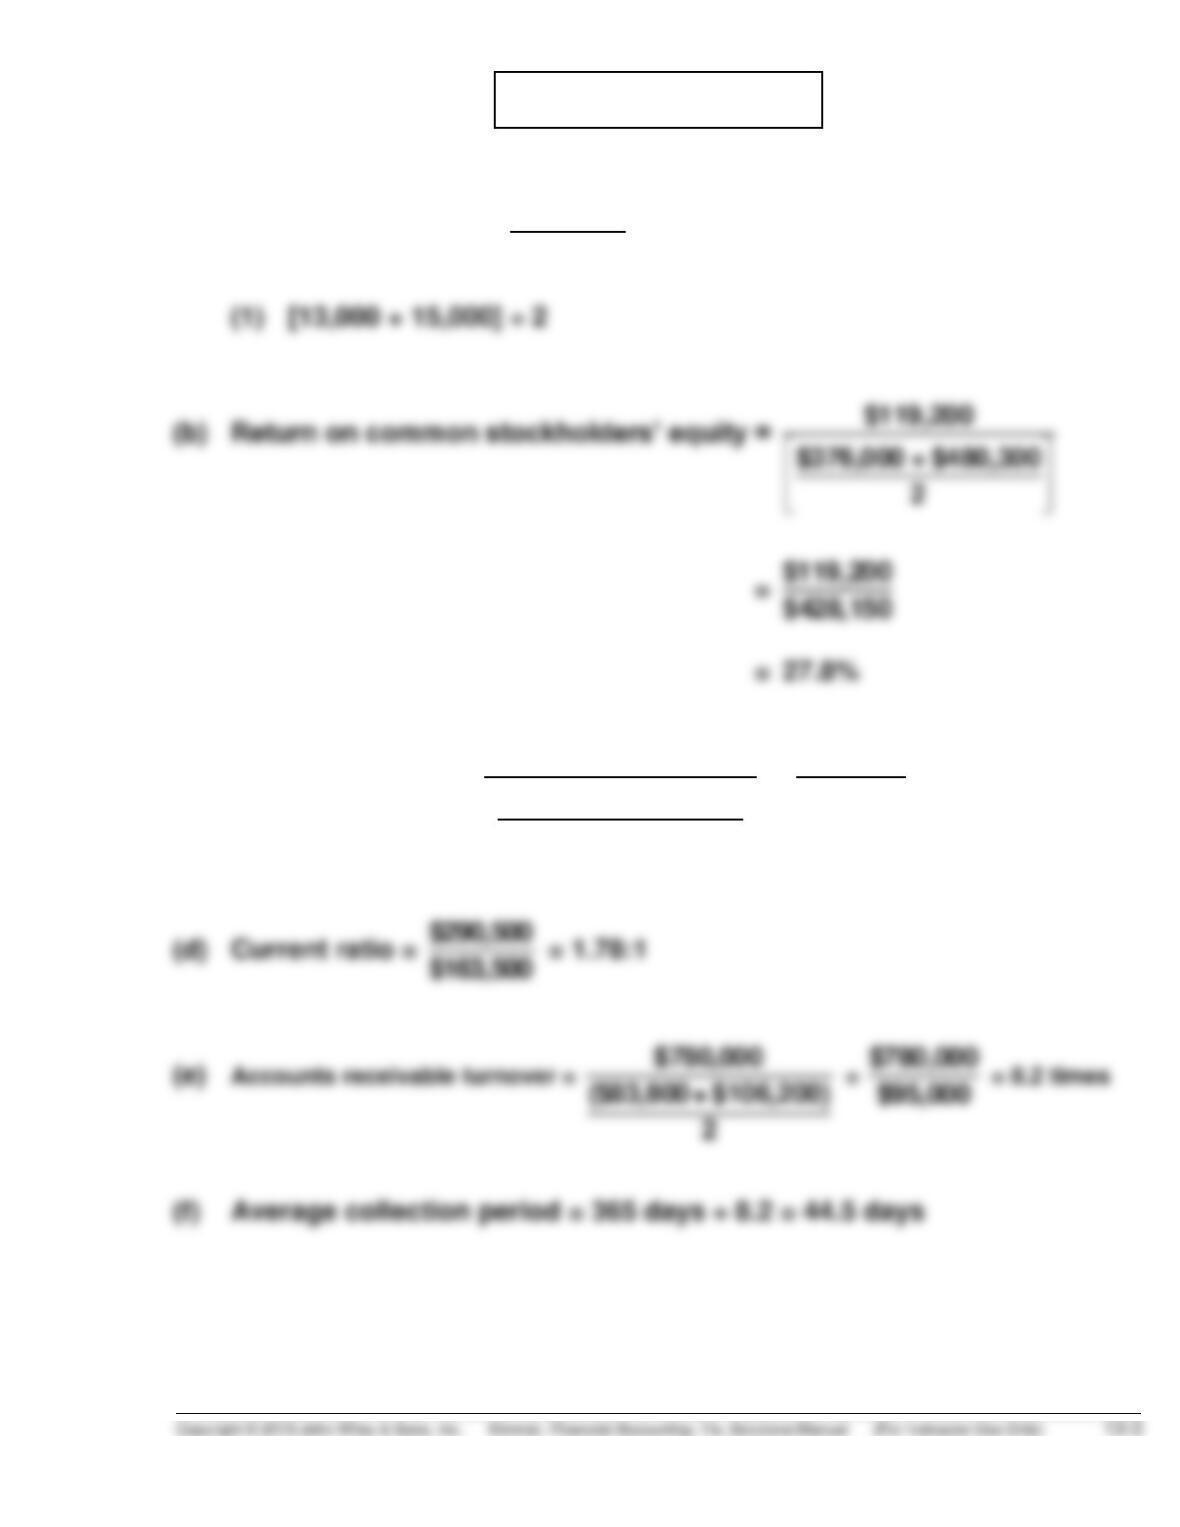
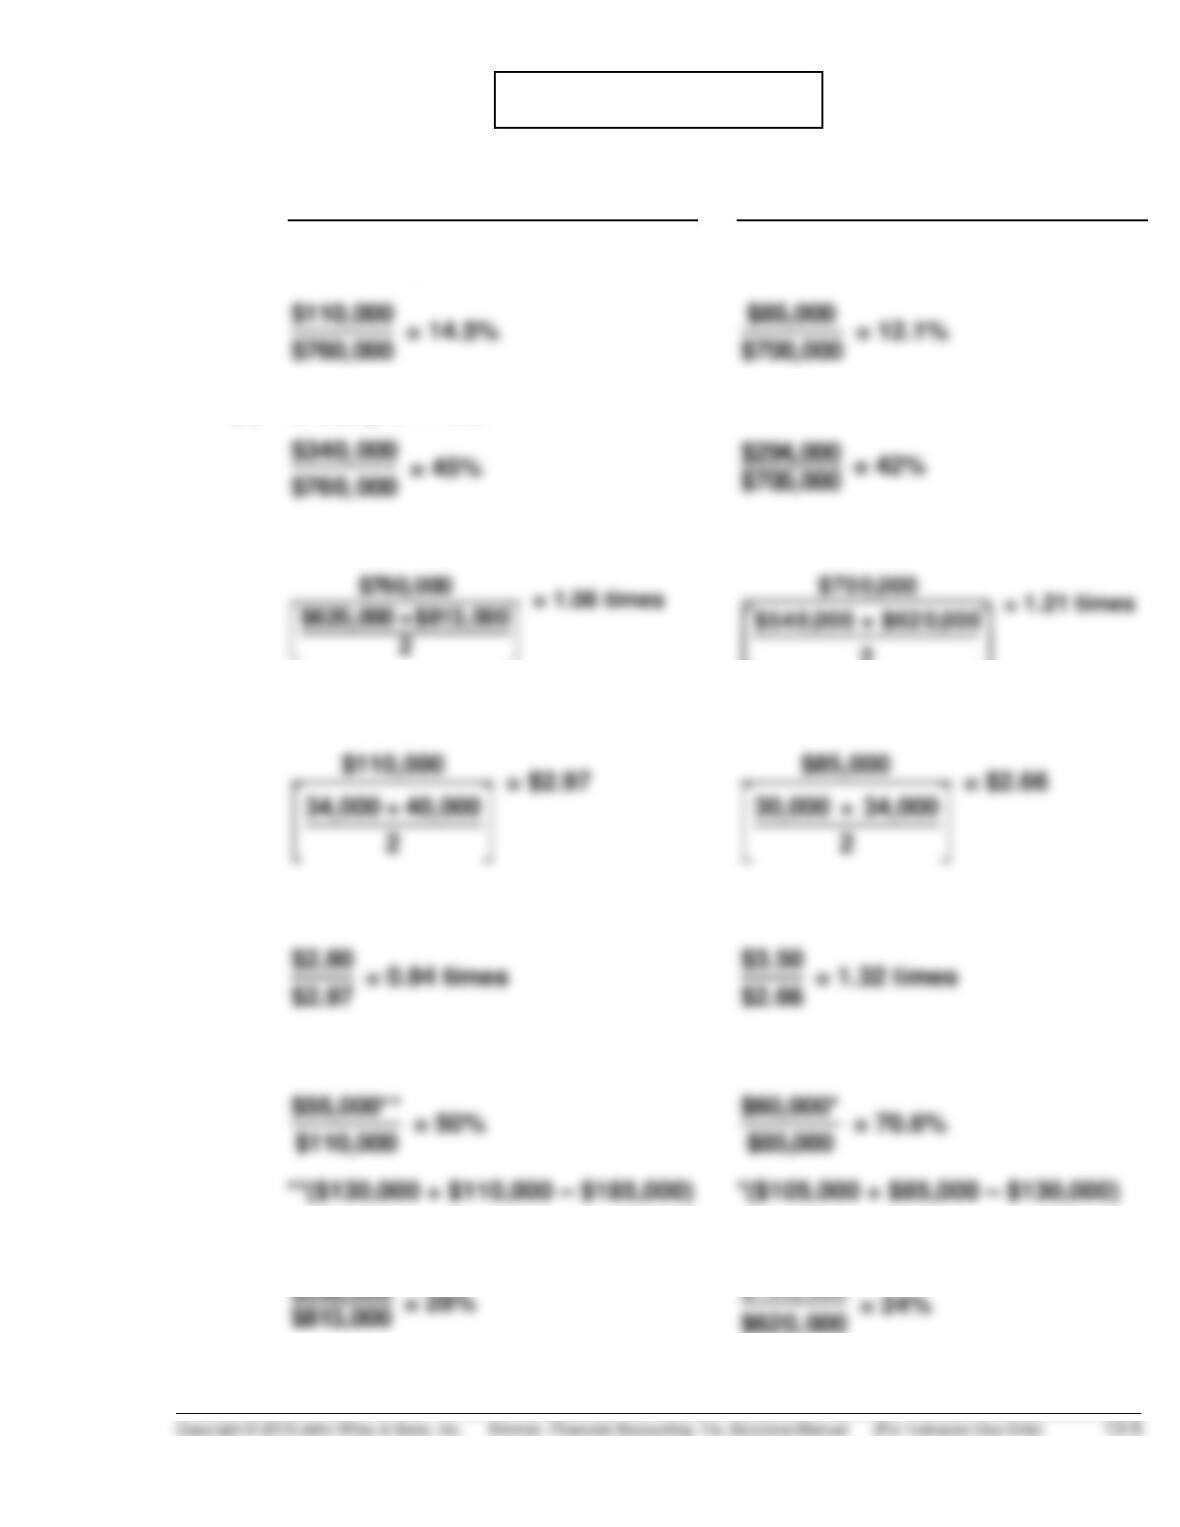
PROBLEM 13-2B
(a) Earnings per share =
$119,200
14,000 (1)
$119,200
$376,000 + $480,300
2
$119,200
$428,150
= $8.51
(c) Return on assets =
$119,200
$652,000 + $775,800
2
=
$119,200
$713,900
= 16.7%
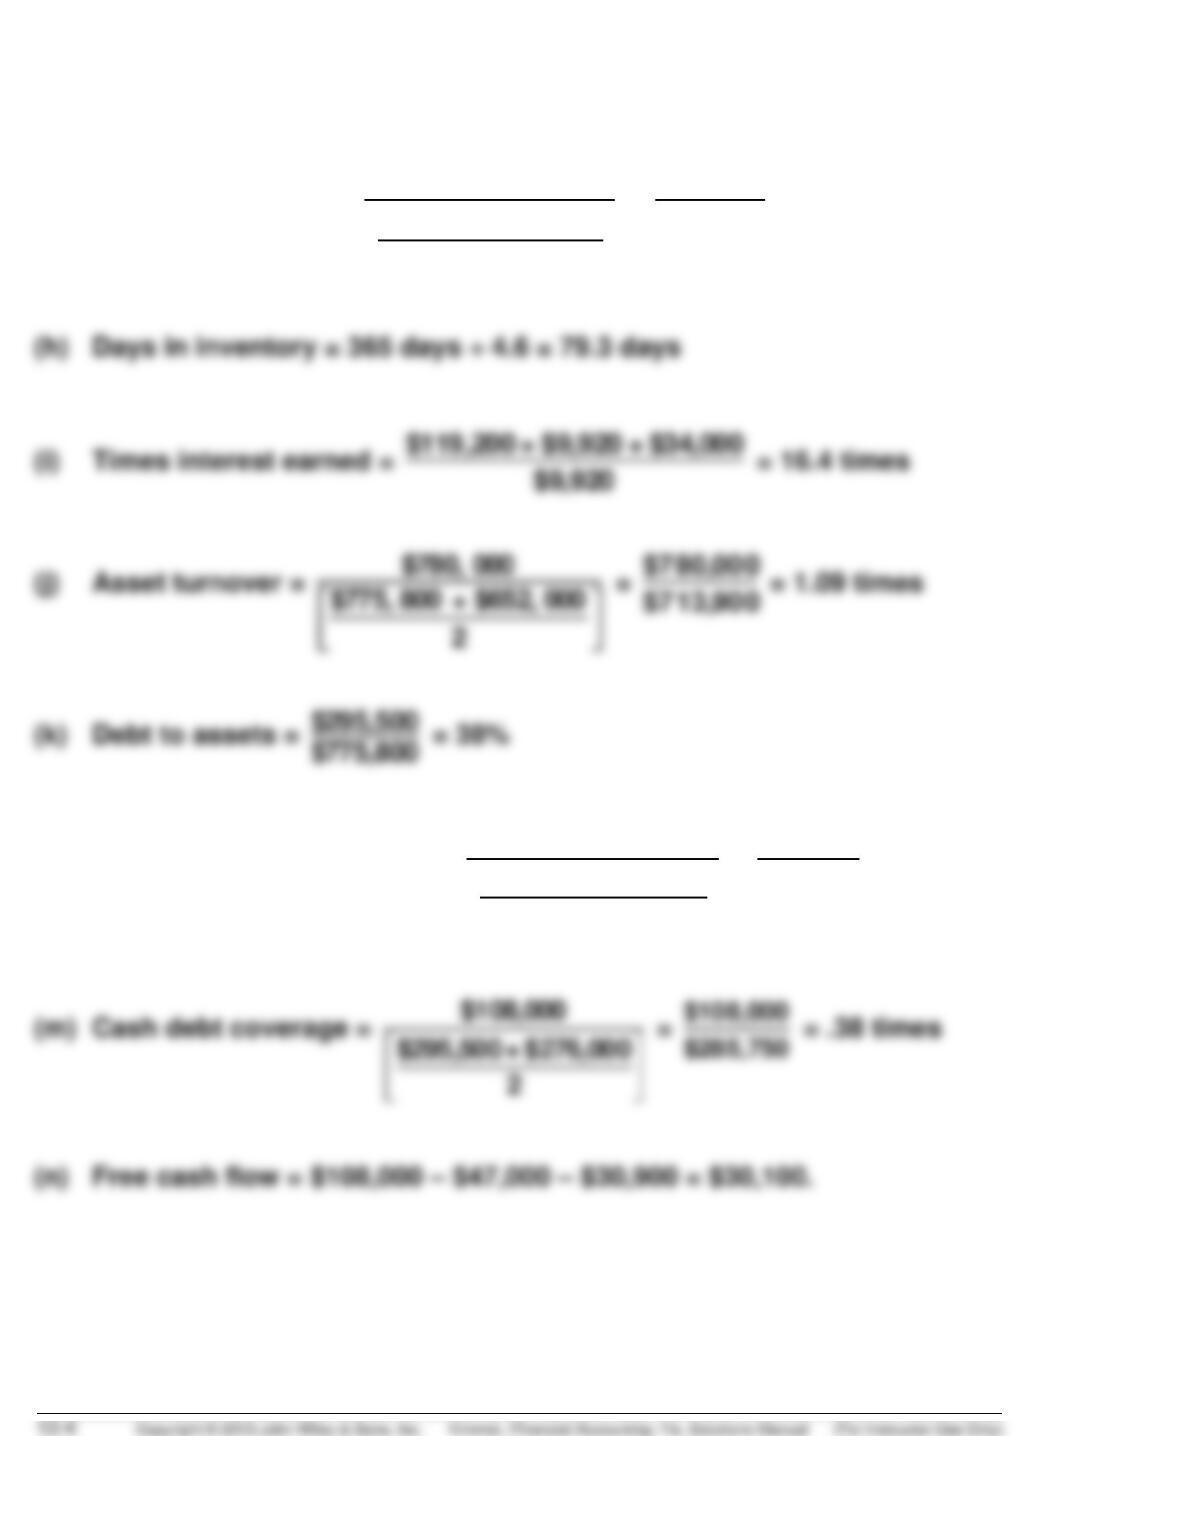
PROBLEM 13-2B (Continued)
(g) Inventory turnover =
$440,000
$74,000+$116,400
2
=
$440,000
$95,200
= 4.6 times
(l) Current cash debt coverage =
$108,000
$163,500 + $156,000
2
=
$108,000
$159,750
= .68 times
PROBLEM 13-3B
(a)
2014
2013
(1)
Profit margin.
(2)
Gross profit rate.
(3)
Asset turnover.
2
(4)
Earnings per share.
(5)
Price-earnings ratio.
(6)
Payout ratio.
**($130,000 + $110,000 – $185,000)
*($105,000 + $85,000 – $130,000)
(7)
Debt to assets ratio.
PROBLEM 13-3B (Continued)
(b) The underlying profitability of the corporation has improved. For example,
the profit margin and gross profit rate have both improved. In addition,
the corporation’s earnings per share has increased, which suggests that
investors will be looking more favorably at the corporation. Also, its
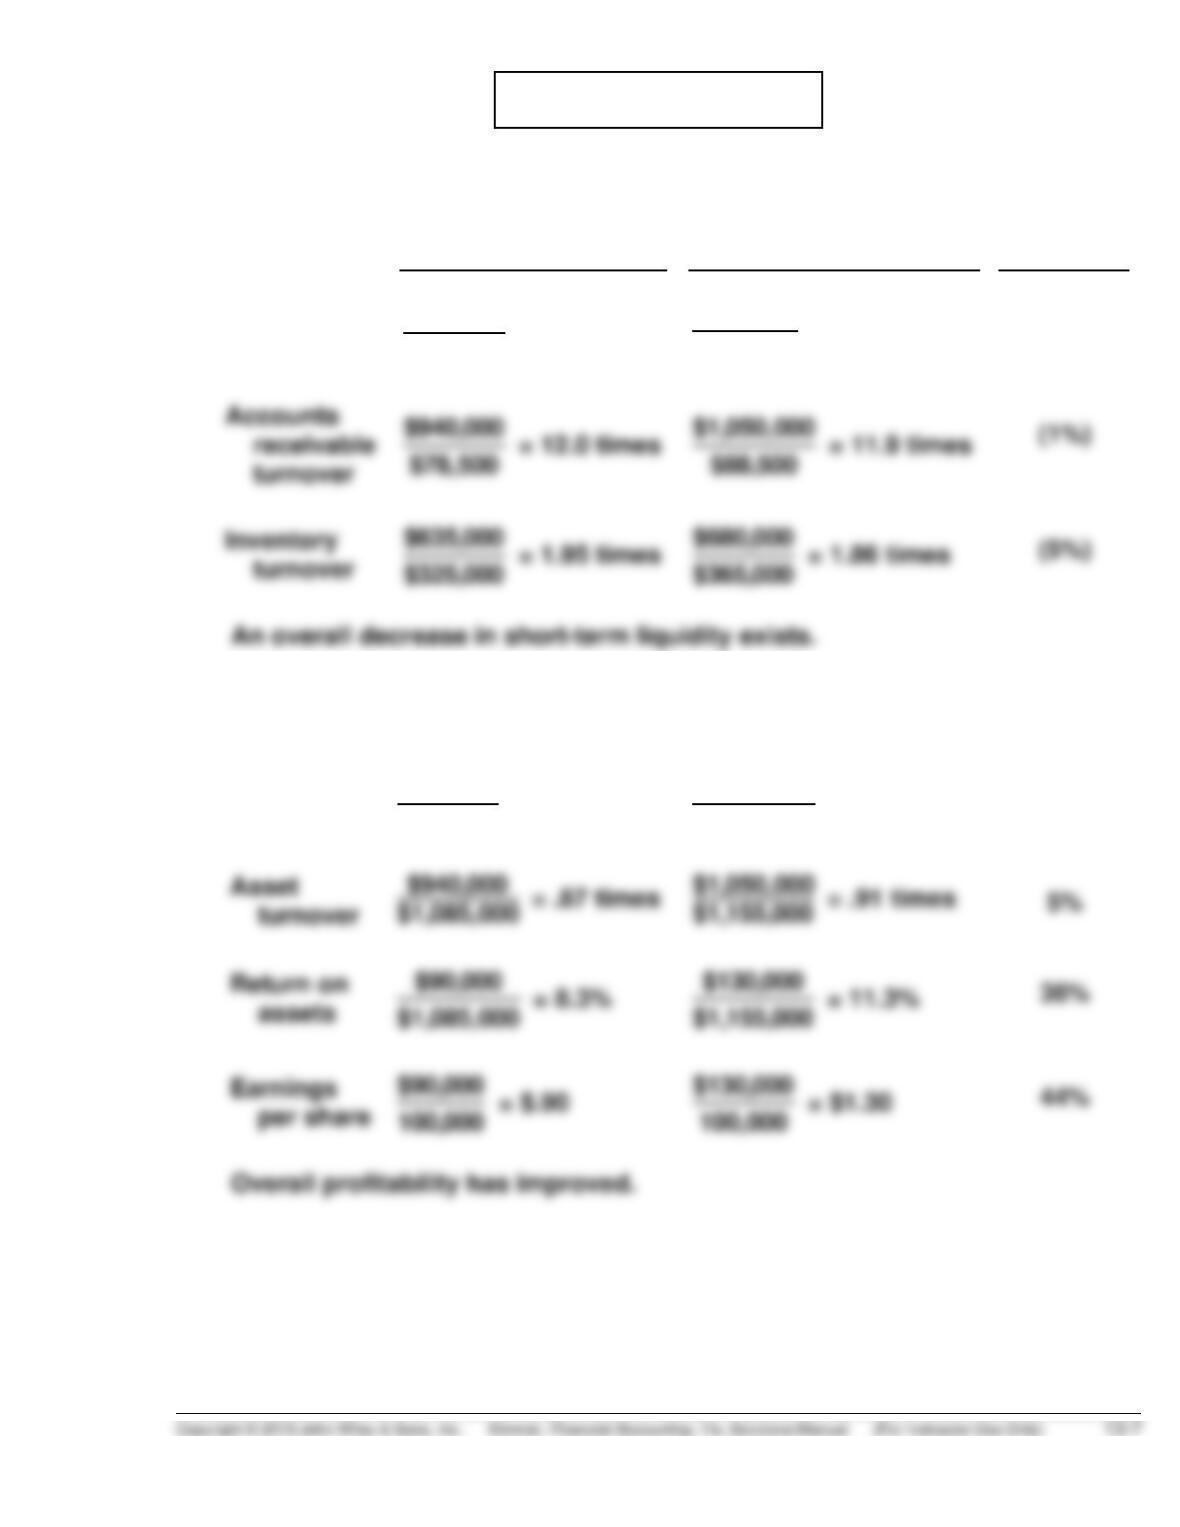
PROBLEM 13-4B
(a) LIQUIDITY
2013
2014
Change
Current
ratio
$520,000
$165,000
= 3.15:1
$670,000
$330,000
= 2.03:1
(36%)
turnover
turnover
= 1.95 times
= 1.86 times
PROFITABILITY
Profit
margin
$90,000
$940,000
= 9.6%
$130,000
$1,050,000
= 12.4%
29%
assets
$1,085,000
= 8.3%
36%
per share
= $1.30
44%
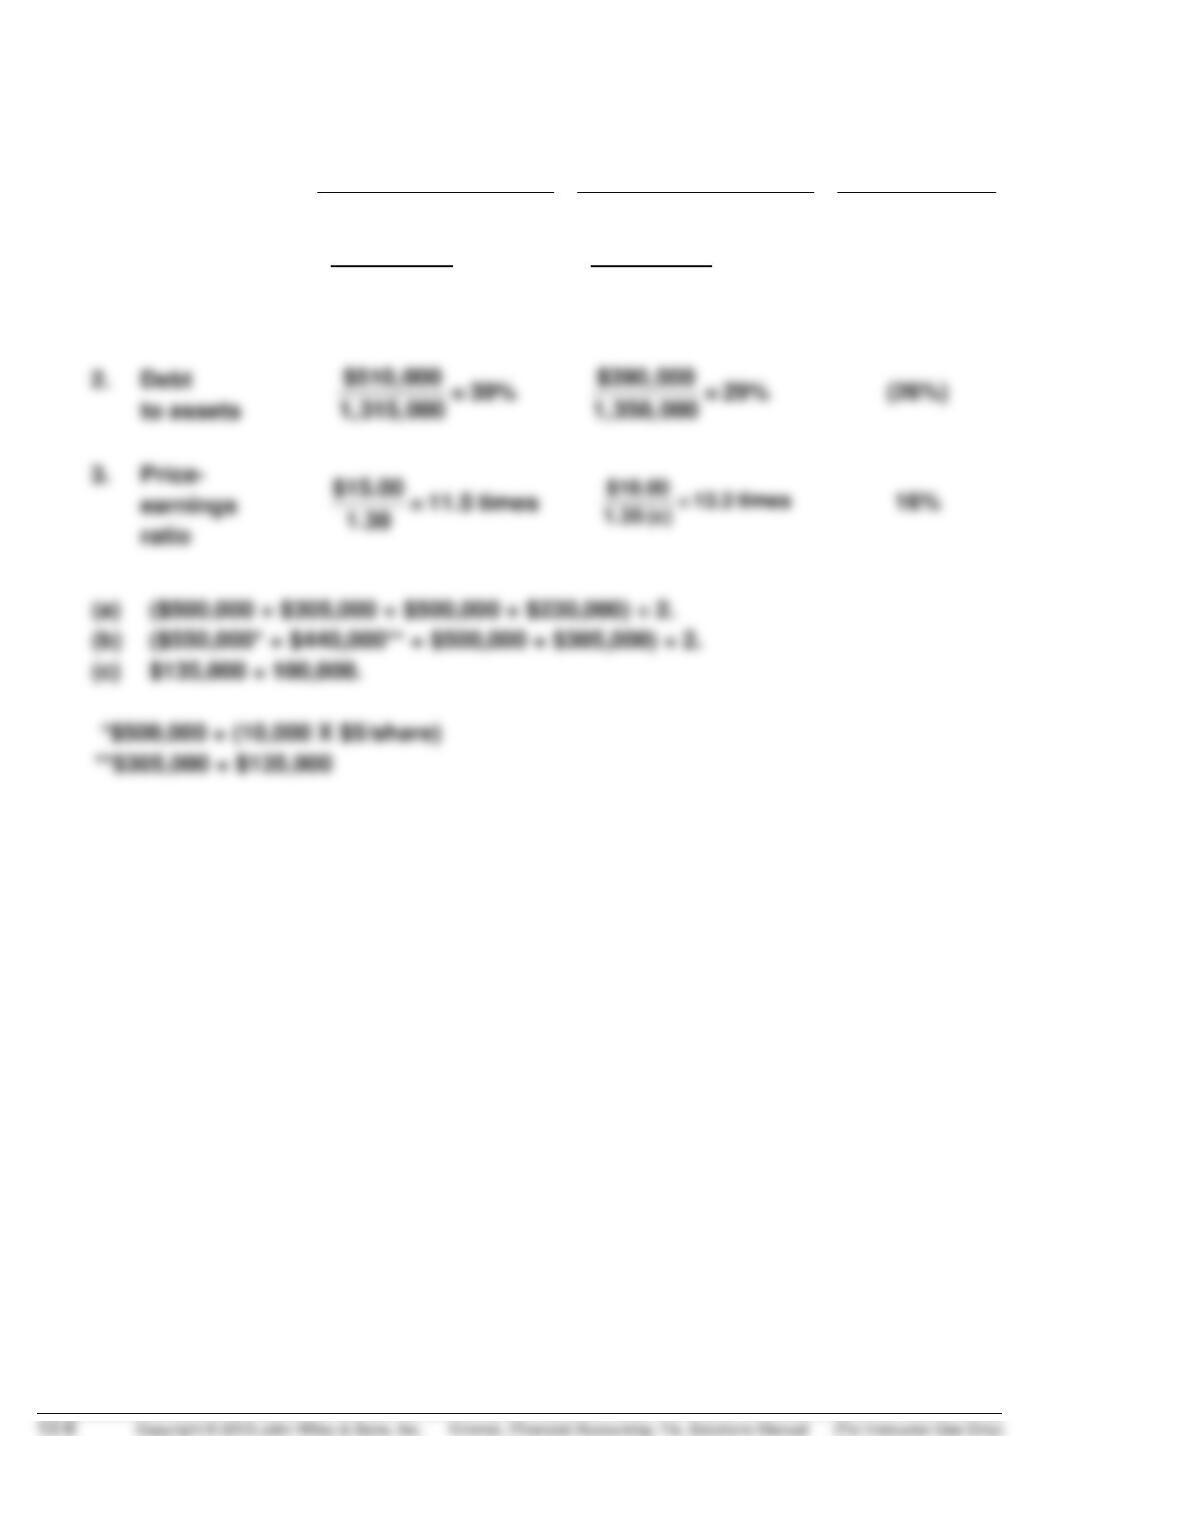
PROBLEM 13-4B (Continued)
(b)
2014
2015
% Change
1.
Return on
common
stockhold-
ers’ equity
$130,000 = 16.9%
767,500 (a)
$135,000 =15.0%
897,500 (b)
(11%)
ratio
PROBLEM 13-5B
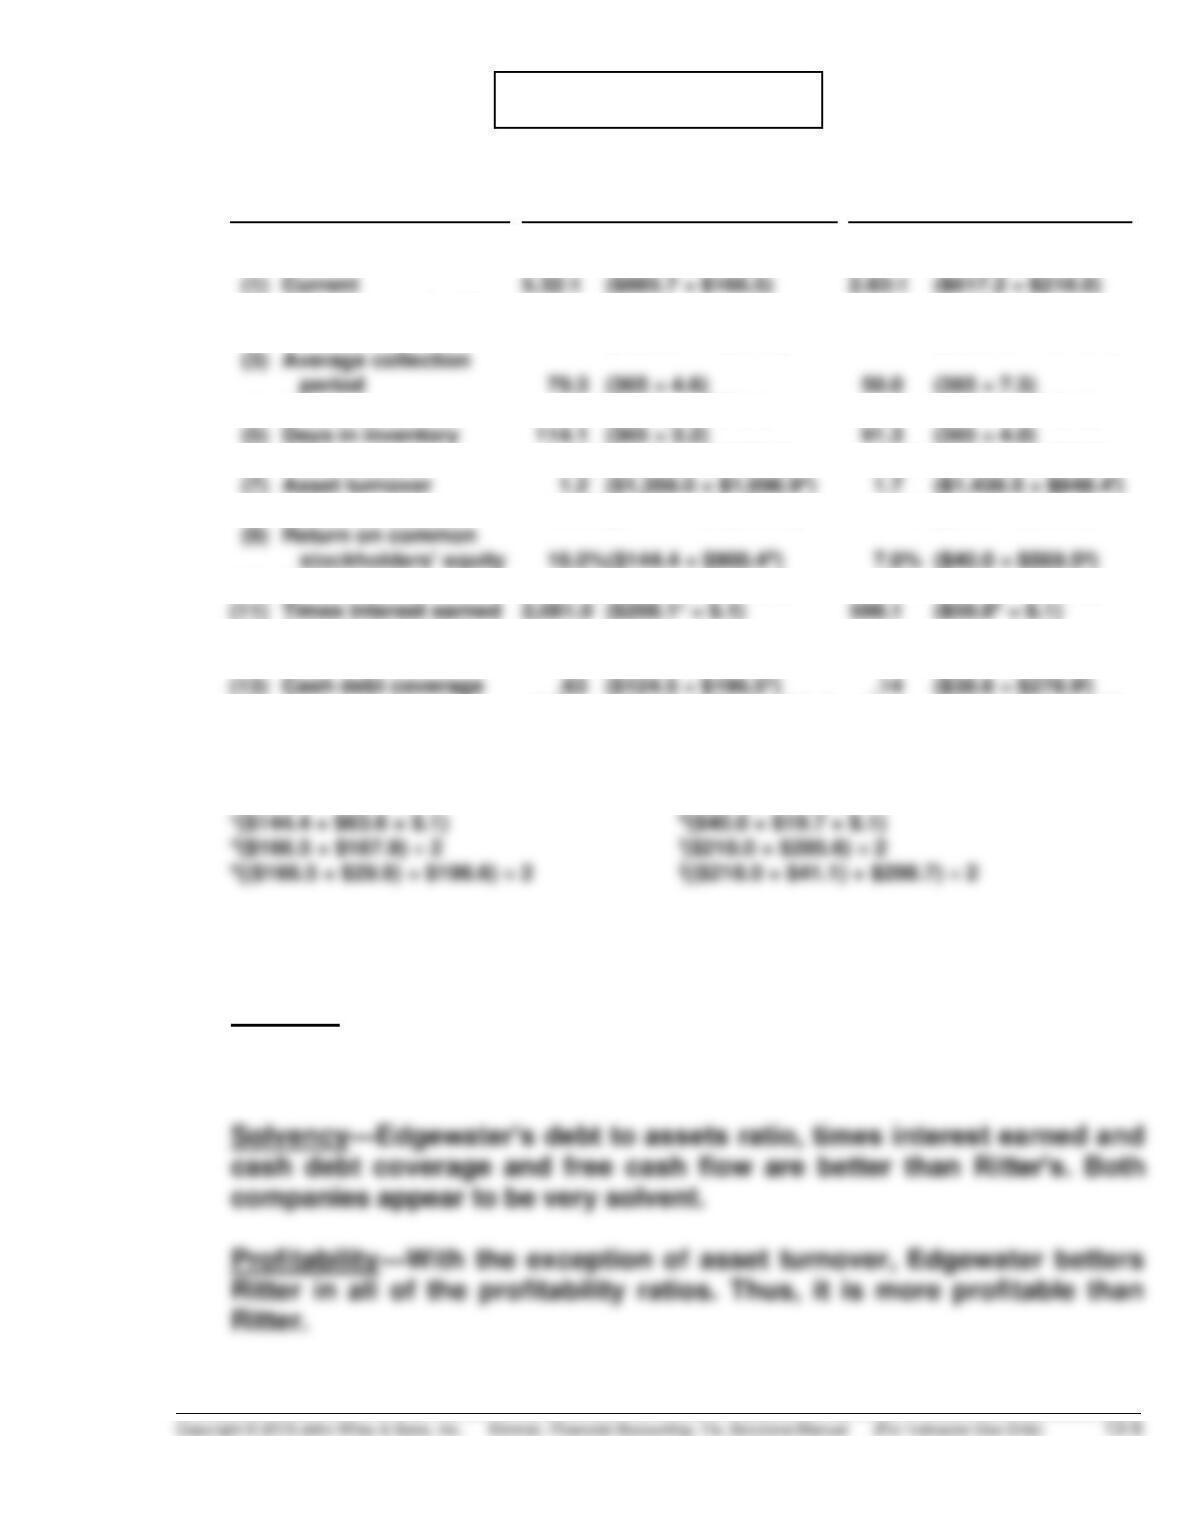
(a)
Ratio
Edgewater
Ritter
(All Dollars Are in Millions)
(2) Accounts receivable
turnover
(4) Inventory turnover
(6) Profit margin
(8) Return on assets
(10) Debt to assets
(12) Current cash debt
coverage
(14) Free cash flow
4.6 ($1,356.0 ÷ $293.2)
3.2 ($776.3 ÷ $239.1)
10.6% ($144.4 ÷ $1,356.0)
13.2% ($144.4 ÷ $1,096.9a)
16.8% ($196.4 ÷ $1,166.5)
.70 ($124.5 ÷ $177.2d)
$69.3 ($124.5 – $34.3 – $20.9)
7.3 ($1,436.5 ÷ $196.1)
4.0 ($771.7 ÷ $194.3)
2.8 % ($40.0 ÷ $1,436.5)
4.7 % ($40.0 ÷ $848.4f)
31 % ($259.1 ÷ $836.3)
.15 ($38.6 ÷ $251.8i)
$8.1 ($38.6 – $30.5 – $0)
a($1,166.5 + $1,027.3) ÷ 2 f($836.3 + $860.4) ÷ 2
b($970.1 + $830.7) ÷ 2 g($577.2 + $561.7) ÷ 2
(b) The comparison of the two companies shows the following:
Liquidity—Edgewater’s current ratio and current cash debt coverage are
much better than Ritter’s. However, Ritter has better accounts
receivable and inventory turnovers.