CHAPTER 13 Emerging Topics in Managerial Accounting
E 13-38 (Continued)
2. Stakeholder—Engagement Approach and Performance Measures to Communicate:
*Shareholders (investors):
Engagement Approach—Apple should interact frequently with its shareholders,
through its customer trade shows (for product unveilings), earnings calls with
analysts, board of director meetings that large institutional shareholders and activist
shareholders are likely to attend, and other various investor relations activities. It is
important for Apple’s executives and other decision makers to be sure that the
company’s various investor groups have an expectation of the risks Apple should
Performance Measures—Apple likely should share information with its investors
about its measured risk appetite (either qualitatively as low, medium, or high; or
more quantitatively if possible); its history of past shareholder returns and its
projection of future shareholder returns; and any other measures of anticipated
financial performance that will attract and retain investor capital.
*Customers:
Engagement Approach—Apple product engineers or sales representatives might
interact with customers via online surveys or small in-person focus groups to learn
of features they enjoy and features they do not use. Such stakeholder engagement
activities also could help Apple learn about additional product features or services
that it does not currently offer but that customers would value (i.e., pay more money
*Suppliers:
Engagement Approach—Apple most likely should formally engage with its core
suppliers on a frequent basis. For example, Apple must be sure that its supply chain
partners understand and adhere to Apple’s Code of Conduct regarding issues such
as sourcing of raw materials, employee working conditions, and resulting product
quality and safety. In addition, at least some of these stakeholder engagements
between Apple and its suppliers will involve information technology functions within
each organization.
Performance Measures—An IT-directed exchange of performance measures might
involve inventory levels for restocking, reliable and secure exchange of sensitive data

CHAPTER 13 Emerging Topics in Managerial Accounting
E 13-38 (Continued)
*Regulators:
Engagement Approach—Apple should engage with regulators to both foresee
upcoming regulations on the horizon and to help shape such future rules and
regulations by informing regulators of resulting changes in projected financial and
other performance data that likely would result from any proposed new regulation.
Performance Measures—Apple might report to regulators and the general public the
costs it incurs to comply with regulations and that it is not “cutting corners” in so
doing. Apple might also quantify and share with regulators the degree to which it
goes “beyond compliance” (i.e., more than it is required to do to comply with the
*Employees:
Engagement Approach—One could logically argue that Apple’s most critical
stakeholder is its team of employees. For example, the R&D team of product
designers is the lifeblood of ensuring that Apple remains innovative with its current
and future products and services. In addition, the environment in each Apple Store
clearly demonstrates the expertise that Apple’s sales force employees possess both
in terms of understanding IT and Apple’s numerous products and also in working
effectively with customers of all ages, backgrounds, and levels of IT sophistication.
Performance Measures—Performance measures around employee retention,
employee satisfaction, and percentage of Apple job promotions that are filled by
existing employees (rather than by outside new hires) would serve as helpful metrics
of Apple’s employee engagement activities.
*Local communities:
Engagement Approach—Apple intentionally exchanges certain types of information

CHAPTER 13 Emerging Topics in Managerial Accounting
E 13-38 (Concluded)
Performance Measures—A relevant performance measure to communicate to
members of a local community might be the percentage of Apple’s work along its
value chain that is performed inside a given local community rather than elsewhere
*Competitors:
Engagement Approach—Apple monitors closely the actions of its competitors. Also,
Apple designers and executives keep very close tabs on prototype products
currently under development. For example, similar to some of its most critical
communications with customers, Apple uses trade shows to communicate the
*Nongovernmental organizations:
Engagement Approach—A nongovernmental organization (NGO) is any voluntary,
nonprofit group that is formed to raise awareness or resources for a particular
cause. An NGO could focus on numerous causes, such as humanitarian issues (e.g.,
Red Cross, Save the Children) or environmental issues (e.g., Greenpeace, the Sierra
Club). Oftentimes, NGOs simply crave the attention and/or financial support of
corporate leadership. Therefore, Apple might agree to meet with an NGO if Apple
Performance Measures—Apple might share with NGO leaders (and maybe other
interested stakeholders) the amount of time executives have spent meeting with
NGO members, as well as the amount of money Apple has donated to the NGO’s
cause. Furthermore, Apple would be wise to share with the NGO leadership any
changes Apple makes to its value chain as a result of its engagement with the NGO.
For example, if Apple changes suppliers to one that provides better working
conditions to its employees, then Apple would be wise to share such performance
measures with any NGO concerned about social or employee safety, etc.

CHAPTER 13 Emerging Topics in Managerial Accounting
E 13-39
The given four key stakeholders for Princeville Paradise Ice Cream Shoppe are
customers, employees, local suppliers, and regulators. Suggested possible solutions to
requirements 1 through 3 are presented in the following table to help demonstrate their
relationship to one another.
Stakeholder:
Risk:
Nonfinancial Performance
Measure:
Financial Performance
Measure:
Customers Customers,
especially tourists
with their transient
nature, do not
perceive
Princeville
Paradise Ice Cream
“Percentage of tourists who
recognize Princeville Paradise
as a premiere ice cream
business”—Paradise’s
accountant also could determine
if this percentage increases for
tourists the longer they stay on
“Princeville Paradise sales per
tourist visiting the island”—If
Paradise’s brand or reputation
is growing, this financial metric
likely will increase to reflect
that tourists visiting the island
increasingly recognize Paradise
tourists to local residents.
Employees Paradise is unable
to find a sufficient
number of local
workers who are
motivated to
deliver the
“Average tenure of Paradise’s
employees relative to average
tenure of competitors’
employees”. This metric
measures how long the average
employee has worked for
“Sales per employee hour
worked”. This measure shows
how much sales revenue is
being generated for each hour
worked by a Paradise
employee. If its employees are
clean store environment), then
customers likely will spend
more per visit (and pay higher
prices) as compared to
customers at lower quality
competitors. As Paradise
employees become more
experienced with Paradise, the
sales per employee hour
worked should increase
(assuming an appropriate
compensation system).

CHAPTER 13 Emerging Topics in Managerial Accounting
E 13-39 (Concluded)
Local
Suppliers
Local farmers fail
to supply
ingredients either
of the high quality
“Percentage of ingredient
deliveries that meet Paradise’s
high quality standards and are
on time.” This measure
or quantity can lead to
significant problems, such as
ice cream stock outs, that
cannot be overcome as quickly
or easily as compared to
businesses on the mainland with
far greater access to alternate
suppliers.
“Production costs, including
raw materials costs, raw
materials waste, and product
spoilage”. If local supplier
managing its local supply chain
from a quality and timeliness of
delivery perspective.
Regulators Princeville
Paradise’s ice
cream
manufacturing
facility and/or its
customer ice cream
“Number of Princeville
Paradise health code violations
occurring each year.” This
measure assesses the level of
success for Paradise in
complying with all health-
impacts.
“Lost sales revenue resulting
from negative ‘word of mouth’
exposure and/or temporary ice
cream shop closures to address
health code violations.” This
measure assesses the decrease
E 13-40
1. Internal failure 12. Appraisal
2. Prevention 13. Prevention
5. External failure 16. Prevention
6. Appraisal 17. External failure
7. Prevention 18. External failure
8. Internal failure 19. Prevention
9. Appraisal 20. Appraisal
CHAPTER 13 Emerging Topics in Managerial Accounting
E 13-41
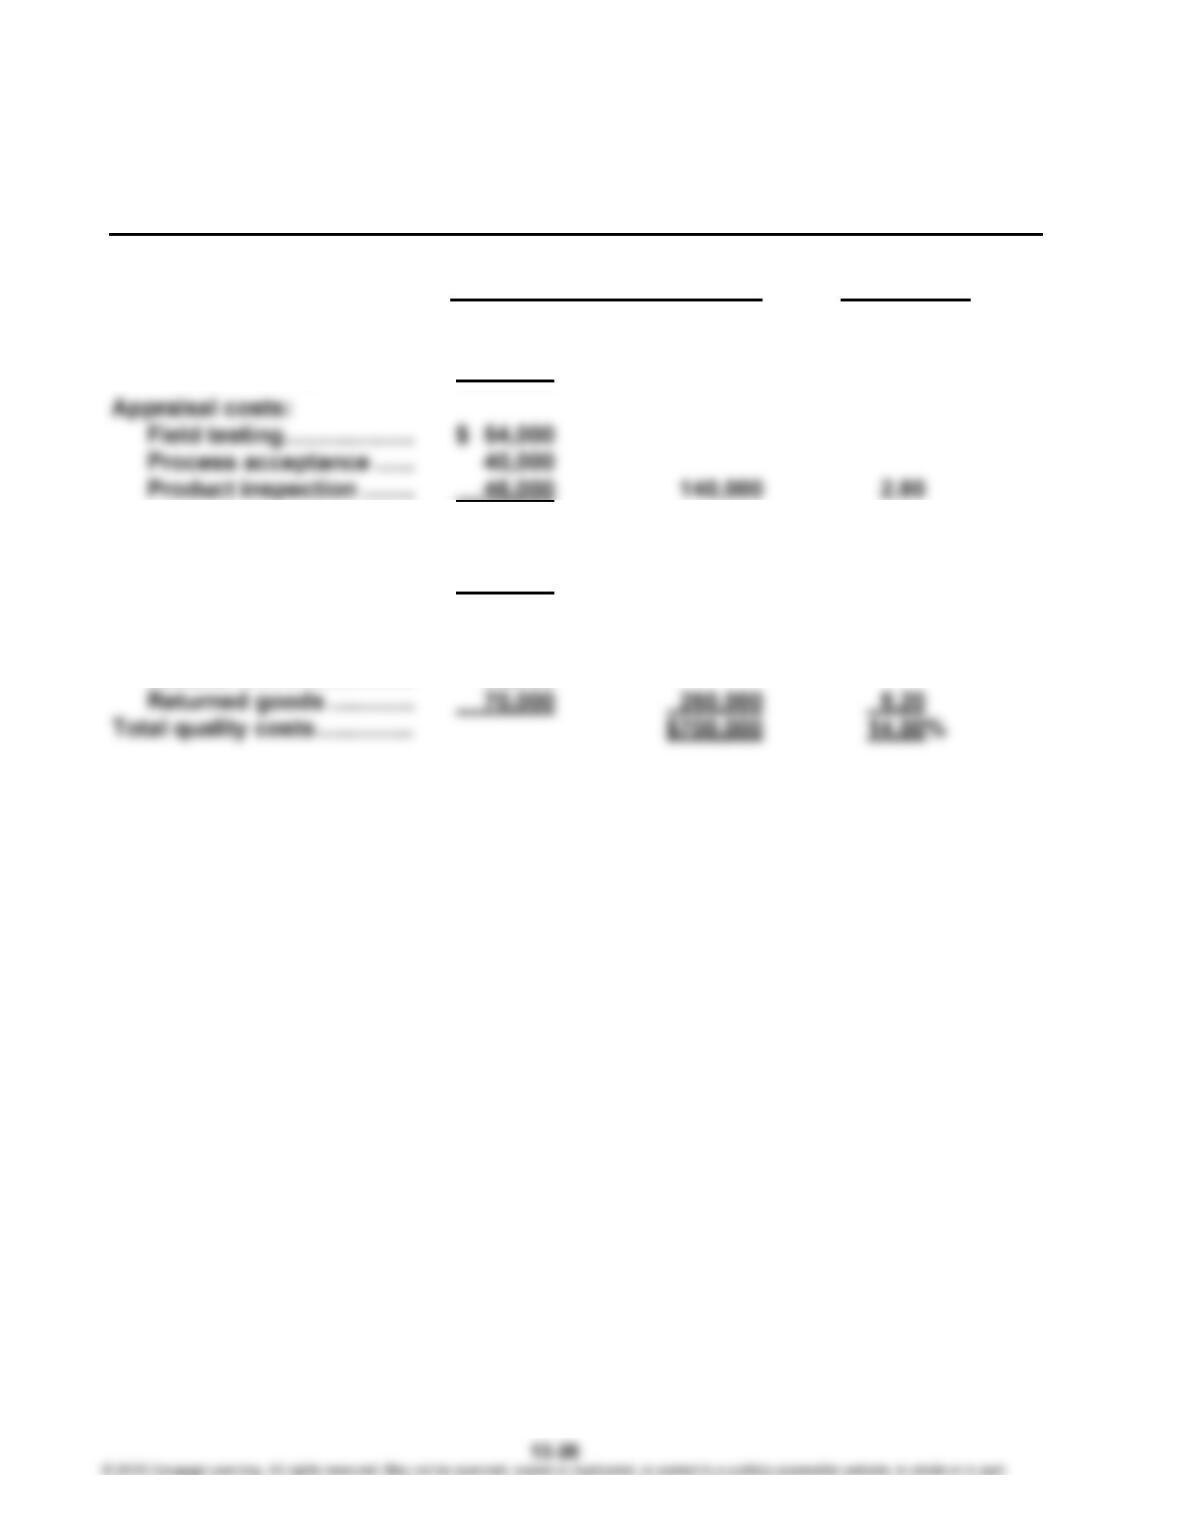
1. Bradshaw Company
Quality Cost Report
For the Year Ended June 30, 20X1
Percentage
Quality Costs of Sales
Prevention costs:
Vendor certification ……. $ 43,500
Quality training …………… 56,500 $100,000 2.00%
Internal failure costs:
Rework ………………………. $ 125,000
Scrap …………………………. 75,000 200,000 4.00
External failure costs:
Warranty ……………………. $ 100,000
Recalls ………………………. 90,000
CHAPTER 13 Emerging Topics in Managerial Accounting
E 13-41 (Concluded)
2.
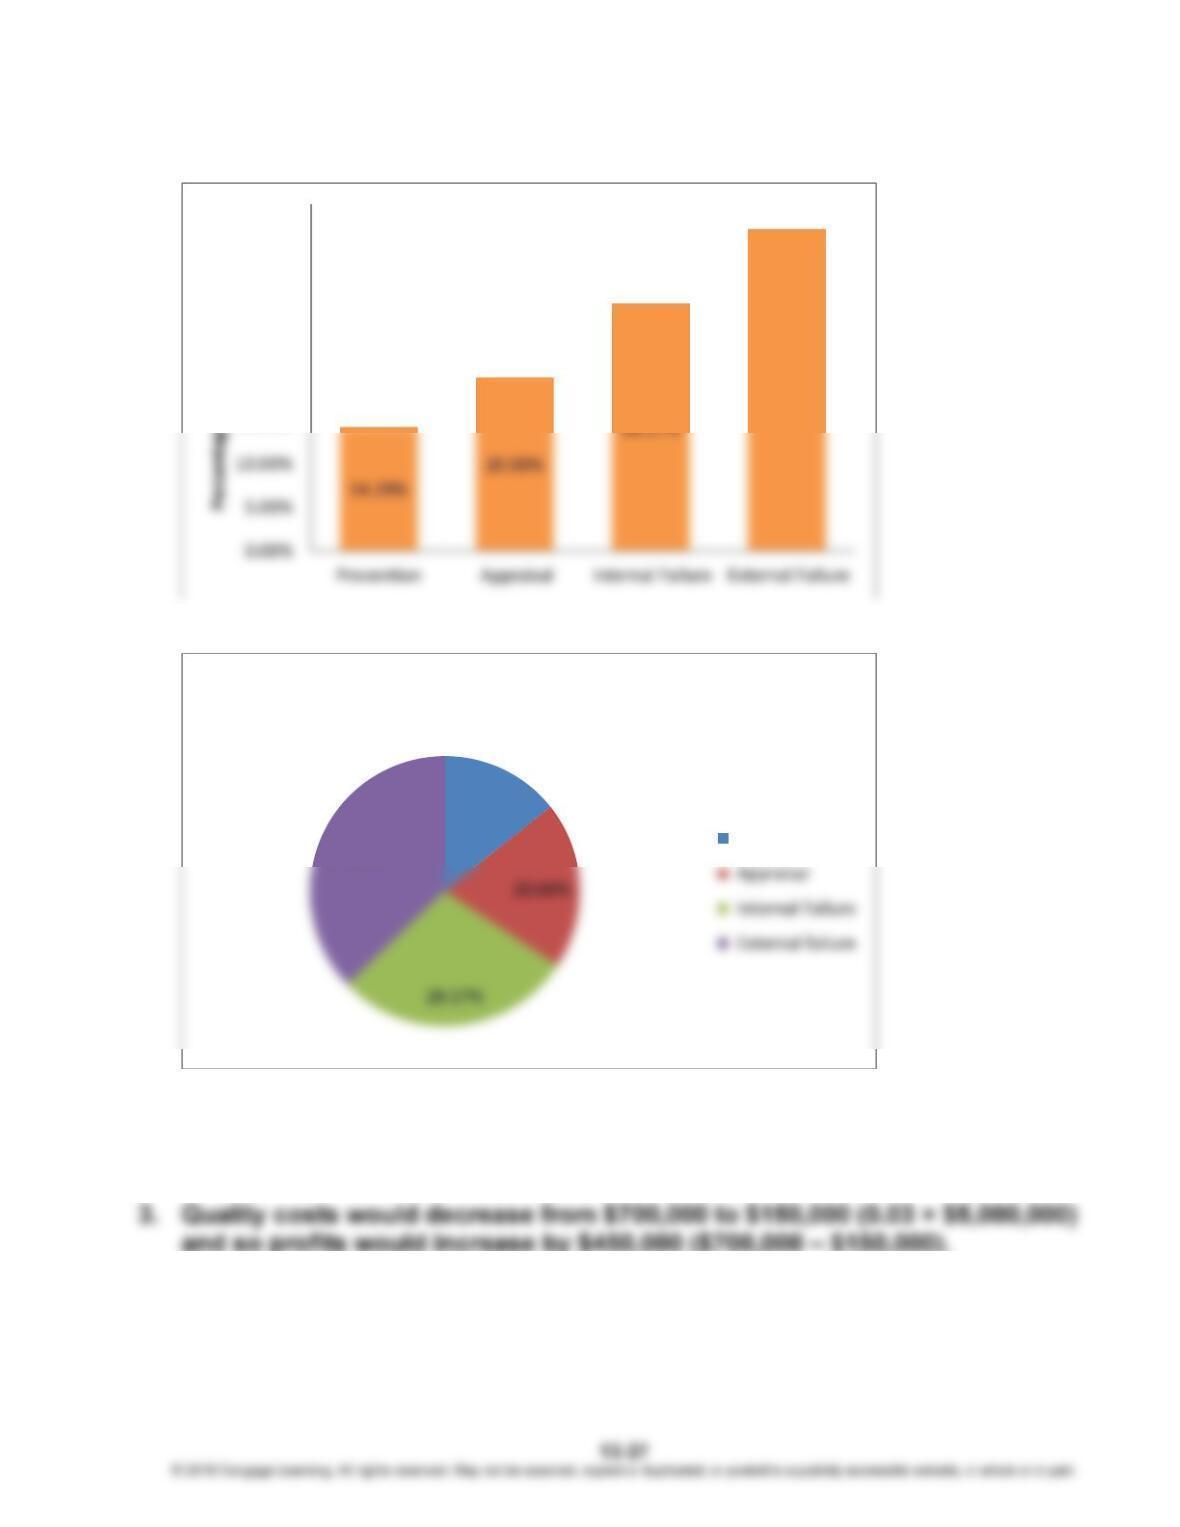
Failure costs are almost two-thirds of the total costs. This indicates that there is still
ample opportunity for improving quality by investing more in prevention and
appraisal activities.
37.14%
15.00%
20.00%
25.00%
30.00%
35.00%
40.00%
14.29%
37.14%
PercentageofTotalQualityCosts
Prevention
CHAPTER 13 Emerging Topics in Managerial Accounting
E 13-42
1.
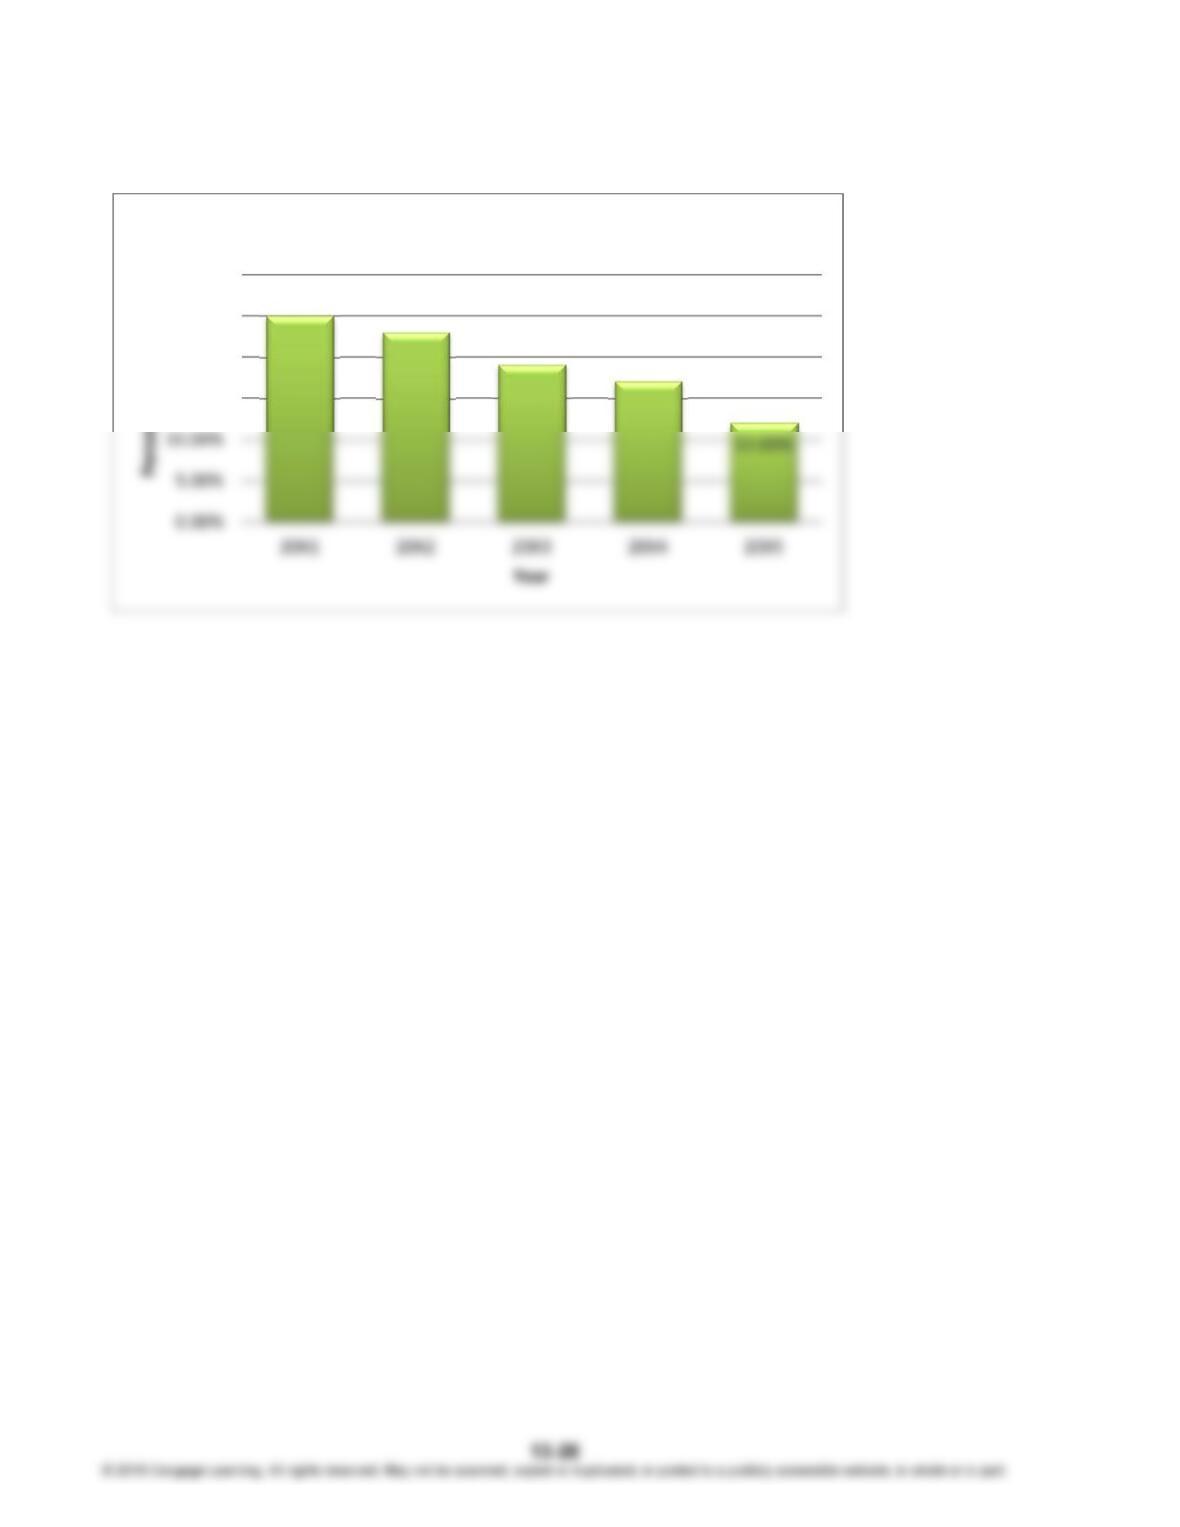
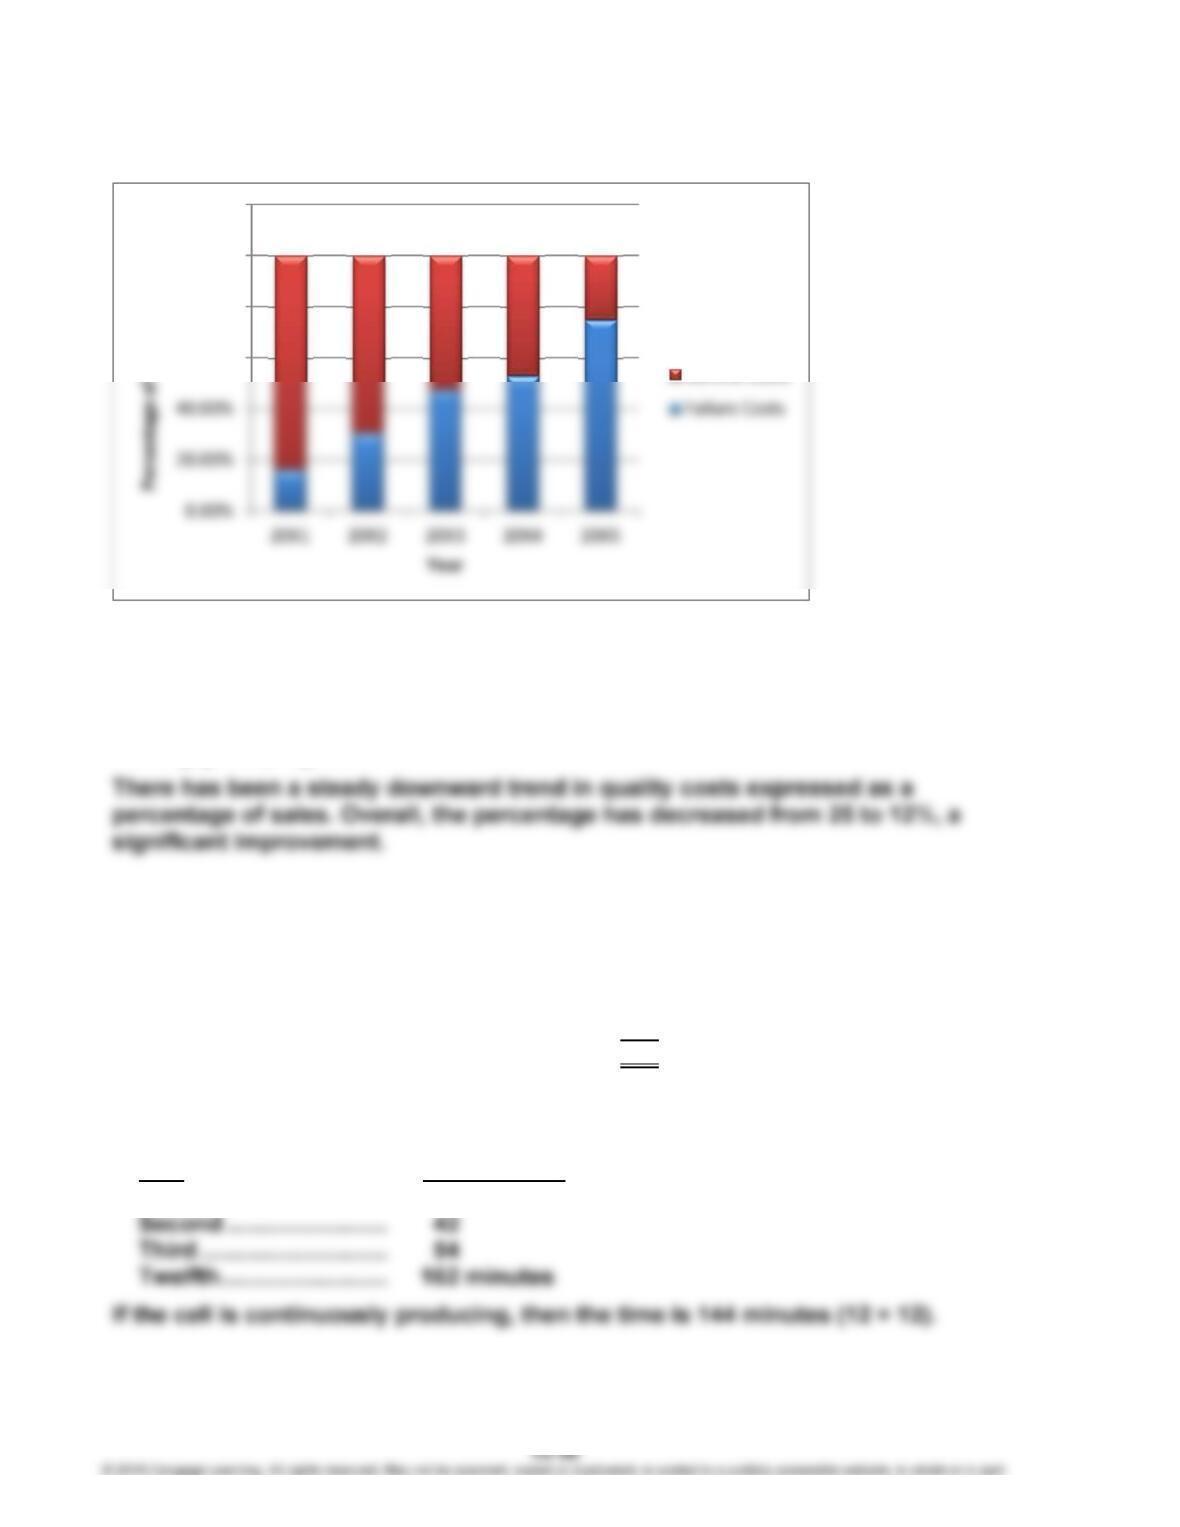
There has been a steady downward trend in quality costs expressed as a
percentage of sales. Overall, the percentage has decreased from 25 to 12%, a
significant improvement.
25.00% 23.00%
19.00% 17.00%
15.00%
20.00%
25.00%
30.00%
TrendinTotalQualityCosts
CHAPTER 13 Emerging Topics in Managerial Accounting
E 13-42 (Continued)
2.
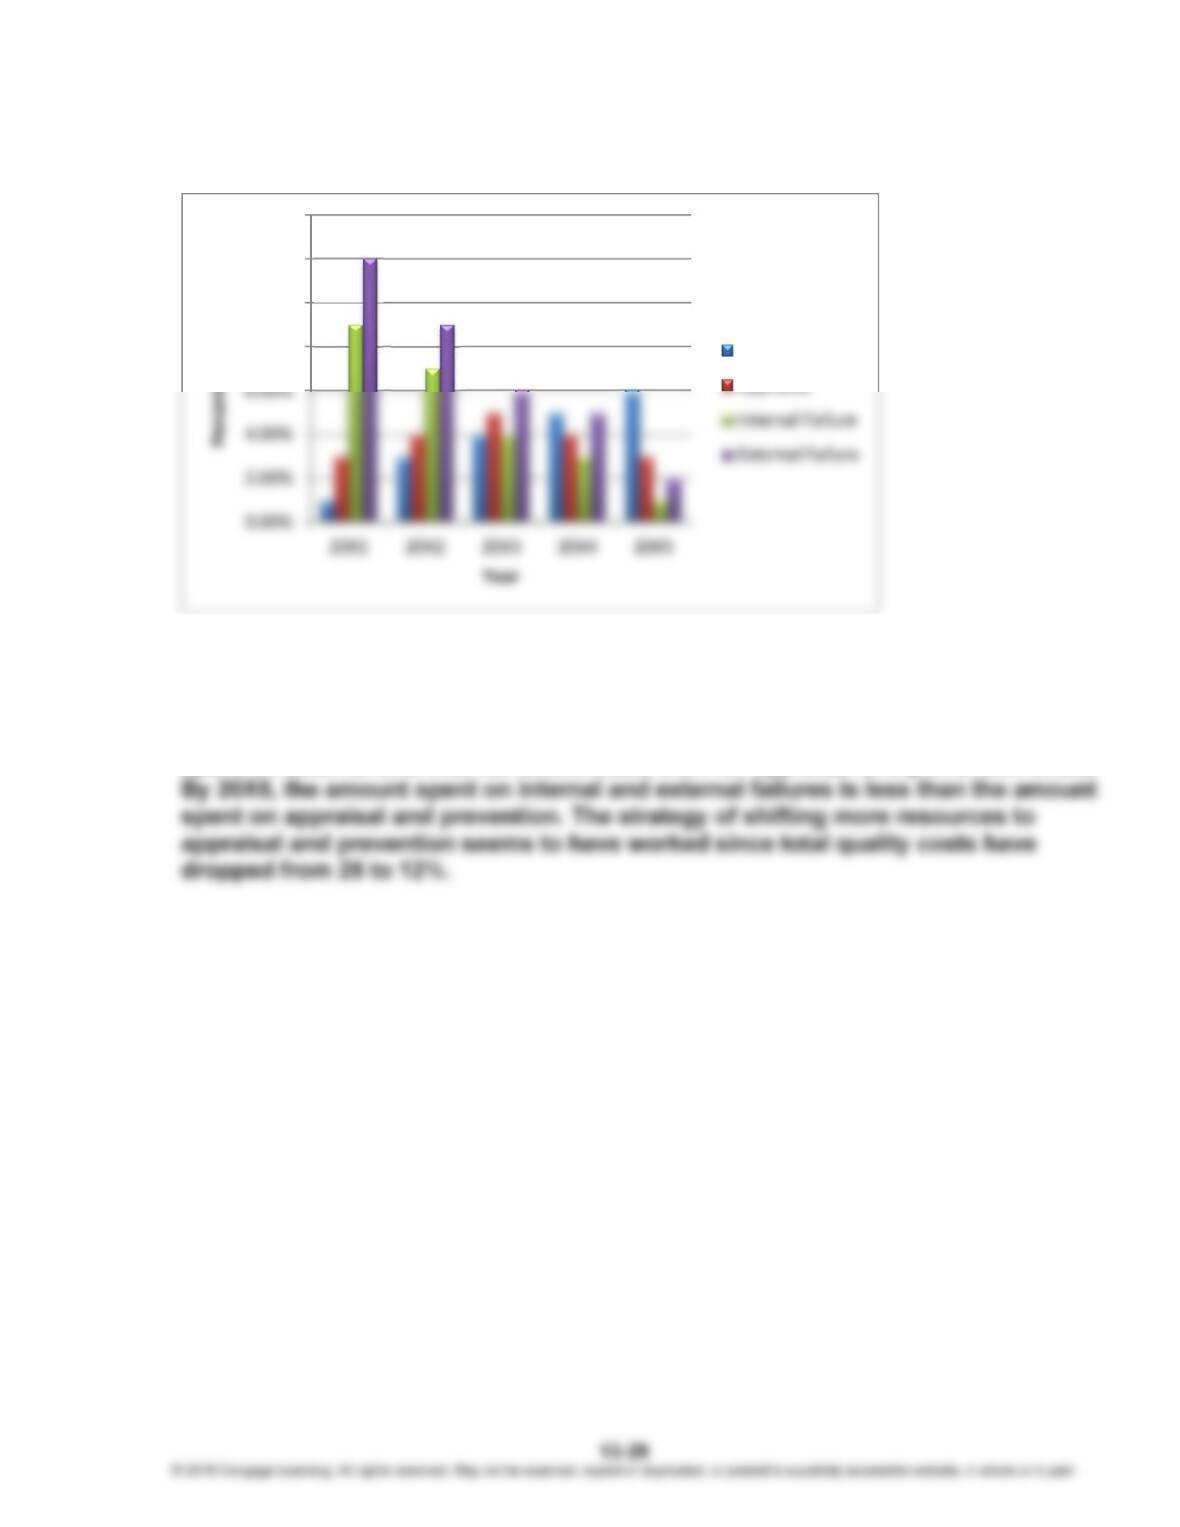
There have been significant reductions in internal and external failure costs.
Prevention costs increased; appraisal costs remained the same. The graph reveals
the trend for each category of costs and how management is changing the
expenditure pattern for each category. In 20X1, a greater percentage of sales was
spent on external and internal failure costs than for appraisal and prevention costs.
8.00%
10.00%
12.00%
14.00%
Prevention
CHAPTER 13 Emerging Topics in Managerial Accounting
E 13-42 (Concluded)
3.
The graph above reveals a favorable trend in the relative distribution of control and
failure. Control costs have gone from 16% of total quality costs to 75%. Thus, the
mix of failure and control costs has gone from an 84:16 mix to 25:75. Combined with
the favorable downward trend in total quality costs, it is clear that the company is
making good progress.
E 13-43
1. Departmental times:
Processing time (12 × 30*) ……………………. 360 minutes
Wait and move times ……………………………. 84 minutes
Total time ………………………………………… 444 minutes
*The sum of the unit production times for each department.
2. Cellular times:
Unit Elapsed time
First ………………………… 30 minutes
60.00%
80.00%
100.00%
120.00%
CHAPTER 13 Emerging Topics in Managerial Accounting
E 13-43 (Concluded)
3. Time saved = 444 – 162 = 282 minutes (300 minutes for the continuous case)
= 282/12 = 23.50 minutes per unit (25 for continuous)
4. 60 minutes/12 = 5 units per hour is the current production rate (12 minutes is the
bottleneck time).
E 13-44
1. First, calculate activity rates:
Cell manufacturing: Driver is conversion time (in minutes):
$19,200/(2,700 + 2,100) = $4 per minute
Next, calculate product costs:
Model K Model R
Cell manufacturing:
$4 × 2,700 ………………… $10,800.00
$4 × 2,100 ………………… $ 8,400.00
Engineering:
$42.50 × 65 ………………. 2,762.50
$42.50 × 15 ………………. 637.50
Testing:
$37.50 × 25 ………………. 937.50
$37.50 × 55 ………………. 2,062.50
2. Average cost = $25,600/200 = $128. The average cost is markedly different from the
ABC costs, which suggests significant heterogeneity. The products may be similar
in the sense that they use the same sequence of production operations but very
different in terms of the demands they place on value-stream resources.

CHAPTER 13 Emerging Topics in Managerial Accounting
E 13-44 (Concluded)
3. Total hours for Model K = (2,700/60) + 65 + 25 = 135; Total hours for Model R =
(2,100/60) + 15 + 55 = 105 hours.
Cycle Time (Model K) = 135/50 = 2.7 hours per unit
Cycle Time (Model R) = 105/150 = 0.70 hour per unit
Conversion Cost Rate = $25,600/(135 + 105) = $106.67 per hour
Cost of Model K = Conversion Cost Rate × Cycle Time
= $106.67 × 0.7
= $74.67
E 13-45
1. Seven nonfinancial measures are used (four operational and three capacity): Units
sold per person, on-time delivery, Dock-to-dock days, First-time through,
Productive, Nonproductive, and Available.
Nonfinancial measures are helpful in managing and bringing about operational
improvement.
2. Time-based: On-time delivery and dock-to-dock days; quality-based: first-time
through; efficiency-based: units sold per person and average product cost. Lean
firms compete on the basis of these three dimensions. They strive to supply the
3. The Planned Future State column sets targets for the various financial and
nonfinancial measures and thus encourages continuous and innovative
improvements.
4. The value stream (processes within the value stream) possesses a certain amount
of capacity based on resources employed. Value-added use of the
resources is productive use; using resources to produce waste is nonproductive

CHAPTER 13 Emerging Topics in Managerial Accounting
E 13-45 (Concluded)
5. As quality, time, and efficiency increase, we would eventually expect all of this to
convert into financial gains. Typically, what happens is that elimination of waste is
E 13-46
1. e
2. b
3. d
E 13-47
1. e
5. a
E 13-48
1. $14,200,000 × 0.30 = $4,260,000
E 13-49
1. $14,200,000 × 0.85 × 0.30 = $3,621,000
E 13-50
a. Yes, there is a potential problem. Susan has the opportunity to set up and pay
nonexistent companies and cash the checks herself.
b. No, in this case, Susan does not have the opportunity to commit fraud.
CHAPTER 13 Emerging Topics in Managerial Accounting
PROBLEMS
P 13-51
1. The inherent risk formula takes the following form:
Inherent risk = (Likelihood) × (Impact)
Note: For Inherent risk, the likelihood and impact are assessed ABSENT of any
response alternative being implemented.
Inherent risk = $30,000,000 ($60,000,000 × 0.50)
The benefit formula takes the following form:
Benefit = Inherent risk – Residual risk
Benefit for A = $17,500,000 ($30,000,000 – $12,500,000)
Benefit for B = $24,000,000 ($30,000,000 – $6,000,000)
Benefit for C = $0 ($0 – $0)
Thus:
Net benefit for A = –$1,000,000 ($17,500,000 – $18,500,000)
Net benefit for B = $4,000,000 ($24,000,000 – $20,000,000)
Net benefit for C = $0 ($0 – $0)
The risk response alternative with the greatest net benefit is alternative B and
should be the selected response. Interestingly, the net benefit for risk response
alternative A is negative (–$1,000,000). A negative net benefit provides ERM
managers with very useful insights. Specifically, a negative net benefit means that
the estimated incremental cost of implementing alternative A is LARGER than the
estimated benefit of implementing alternative A, thereby producing the NEGATIVE
net benefit.

CHAPTER 13 Emerging Topics in Managerial Accounting
P 13-52
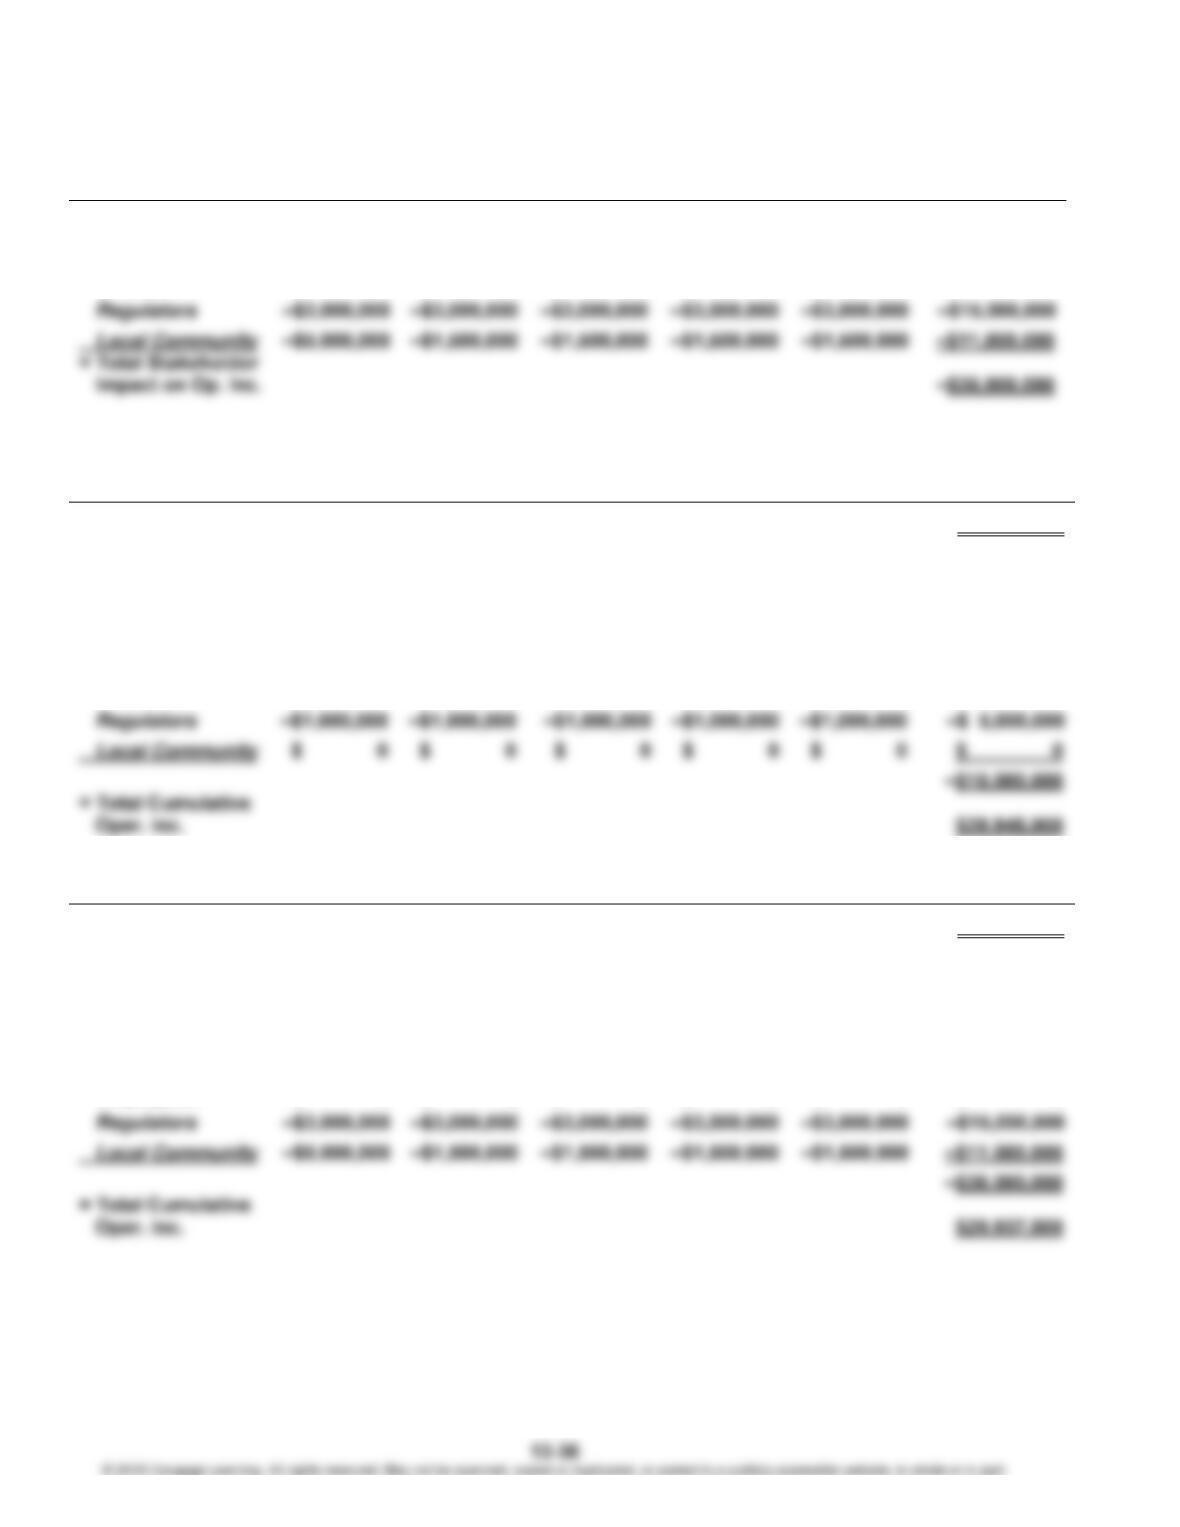
Requirement 1:
Tuscany Year 1 Year 2 Year 3 Year 4 Year 5 Total (Yrs 1-5)
Annual Op. Inc. $9,000,000 $9,900,000 $10,890,000 $11,979,000 $13,176,900 $54,945,900
Cumulative Op. Inc. $18,900,000 $29,790,000 $41,769,000 $54,945,900
Matarrana Year 1 Year 2 Year 3 Year 4 Year 5 Total (Yrs 1-5)
Annual Op. Inc. $5,000,000 $7,500,000 $11,250,000 $16,875,000 $25,312,500 $65,937,500
Based on the operating income calculations for the Five-Year Financial Plan, the
Tuscany sales region would generate cumulative operating income of $54,945,900
(note: the present value of Tuscany’s Five-Year Financial Plan operating income stream
equals $47,137,811 at 5%), which is less than the cumulative operating income from the
Matarrana region of $65,937,500 (note: the present value of Matarrana’s Five-Year
Financial Plan operating income stream equals $54,998,909 at 5%). Therefore, based
solely on this operating income over this Five-Year Financial Plan, Stylz should select
the Matarrana region because its cumulative operating income stream (as well as the PV
of this stream) is greater than for the Tuscany region. However, it should be noted that
the Tuscany region actually produces the greater cumulative operating income through
Requirement 2:
Tuscany Year 1 Year 2 Year 3 Year 4 Year 5 Total (Yrs 1-5)
Stakeholder Impact:
Suppliers $ 0 $ 0 $ 0 $ 0 $ 0 $ 0
Employees –$2,000,000
–
$2,000,000 –$2,000,000 –$2,000,000 –$2,000,000 –$10,000,000
Regulators –$1,000,000
–
$1,000,000 –$1,000,000 –$1,000,000 –$1,000,000 –$ 5,000,000
CHAPTER 13 Emerging Topics in Managerial Accounting
P 13-52 (Continued)
Matarrana Year 1 Year 2 Year 3 Year 4 Year 5
Total (Yrs 1-
5)
Stakeholder Impact:
Suppliers –$5,000,000 –$5,000,000 $ 0 $ 0 $ 0 –$10,000,000
Employees $ 0 $ 0 $ 0 $ 0 $ 0 $ 0
Requirement 3:
Tuscany Year 1 Year 2 Year 3 Year 4 Year 5 Total (Yrs 1-5)
Annual Op. Inc. $9,000,000 $9,900,000 $10,890,000 $11,979,000 $13,176,900 $54,945,900
Cumulative Op. Inc. $18,900,000 $29,790,000 $41,769,000 $54,945,900
Op. Inc. (Yrs 1-5)
PV =
$47,137,811
Stakeholder Impact:
Suppliers $ 0 $ 0 $ 0 $ 0 $ 0 $ 0
Employees –$2,000,000 –$2,000,000 –$2,000,000 –$2,000,000 –$2,000,000 –$10,000,000
Matarrana Year 1 Year 2 Year 3 Year 4 Year 5 Total (Yrs 1-5)
Annual Op. Inc. $5,000,000 $7,500,000 $11,250,000 $16,875,000 $25,312,500 $65,937,500
Cumulative Op. Inc. $12,500,000 $23,750,000 $40,625,000 $65,937,500
Op. Inc. (Yrs 1-5)
PV = $54,998,909
Stakeholder Impact:
Suppliers –$5,000,000 –$5,000,000 $ 0 $ 0 $ 0 –$10,000,000
Employees $ 0 $ 0 $ 0 $ 0 $ 0 $ 0

CHAPTER 13 Emerging Topics in Managerial Accounting
P 13-52 (Continued)
Based on the combined Five-Year Financial Plan AND the Business Sustainability
Analysis, Stylz would be better off selecting the Tuscany region as its total cumulative
operting income is significantly greater ($39,945,900) than that of Matarrana
($29,937,500). The combined negative operating impacts of the four key stakeholder
was $21,000,000 greater for Matarrana (–$36,000,000) than for Tuscany (–$15,000,000),
which turned Matarrana’s relative preference after the original five-year plan of
Requirement 4:
There are many qualitative factors that Stylz management might be wise to consider to
supplement its quantitative Five Year Financial Analysis and Business Sustainability
Analysis. For example, the accuracy of the data sources used for constructing both of
these quantitative analyses should be considered to be sure that each source is of a
sufficiently accurate nature. On a related note, management should investigate the
trustworthiness of each stakeholder group that influenced the quantitative Business
Sustainability Analysis. In addition, management should consider its own confidence in
its analyses. For example, if management is far less confident in estimates it provided
for years 3–5 than for years 1–2, it might want to place less weight or importance on the
projections that are further out into the future. Regardless of the particular element
under scrutiny, management would be wise to conduct a sensitivity analysis to see how
different the resulting operating income would be over five years when management
P 13-53
1. One likely reason why Les believes that Dorsey Scott would be wise to look into
sustainability is that he realizes that young people, such as college students, often
have strong expectations regarding the various issues that affect companies’ ability to
sustain over the long term. These issues of great interest to college students can
include environmental concerns (e.g., clean water, air, and soil; food miles traveled by

CHAPTER 13 Emerging Topics in Managerial Accounting
P 13-53 (Continued)
would generate profits in the near future as college students become future customers
with considerable purchasing power once they graduate from college. Yet a third
2. Three challenges:
a. Given that Dorsey Scott has never prepared or issued a corporate
sustainability report, the intern team likely will face many challenges in
creating the first one. For example, the team will need to engage stakeholders
b. Another challenge likely will be figuring out exactly how to measure stakeholder
expectations (i.e., risks and opportunities) about Dorsey Scott’s performance and
how such stakeholder expectations can hurt or help the company achieve its
strategy. This challenge also requires that Dorsey Scott clearly understand its
own strategy so that it can connect its strategy to key stakeholder expectations
or issues. Also, the team will need to figure out how to link various, and
sometimes competing, stakeholder issues to Dorsey Scott’s ultimate financial
performance, as measured by cash flows, earnings, stock price, etc.
c. A third challenge likely will involve access to trustworthy data to measure the
various stakeholder issues and associated firm performance discussed in the
previous challenge. For example, few companies have access to accurate data
regarding every environmental issue of interest (e.g., carbon footprint, food
3. Three benefits:
a. Dorsey Scott likely will grow its consumer base by issuing a meaningful CSR
that speaks to college students in a manner that they understand and
appreciate. It is possible that this sustainability focus for Dorsey will translate
its growing college student consumer base into a subset of more loyal
customers over a 50-plus year lifetime.
b. Dorsey Scott’s stakeholder engagement might improve management’s
understanding of exactly what current customers like and dislike about its
beverages. This improved understanding of customer preferences can help