
13-1
CHAPTER 13
Financial Analysis: The Big Picture
Learning Objectives
1. Understand the concept of sustainable income.
2. Indicate how irregular items are presented.
3. Explain the concept of comprehensive income.
4. Describe and apply horizontal analysis.
5. Describe and apply vertical analysis.
6. Identify and compute ratios used in analyzing a company’s liquidity, solvency, and
profitability.
7. Understand the concept of quality of earnings.
* 8. Evaluate a company comprehensively using ratio analysis.
13-2
Chapter Outline
Learning Objective 1 – Understand the Concept of Sustainable Income
Sustainable Income—is the most likely level of income to be obtained in the
future.
▪ Sustainable income is net income adjusted for irregular items.
▪ Sustainable income differs from actual net income by the amount of irregular
revenues, expenses, gains, and losses included in this year’s net income.
▪ Users are interested in sustainable income because it helps them derive an estimate
Learning Objective 2 – Understand How Irregular Items are Presented
▪ Irregular Items—are identified by type on the income statement. Two types of
irregular items are reported – discontinued operations and extraordinary items.
Irregular items are reported net of income taxes. Income tax expense is computed
for the income before irregular items. Then, income tax expense is computed for
each individual irregular item. Discontinued Operations—refers to the disposal of
a significant component of a business, such as the elimination of a major class of
customers or an entire activity. When the disposal of a significant component occurs,
the income statement should report the gain (or loss) from discontinued operations,
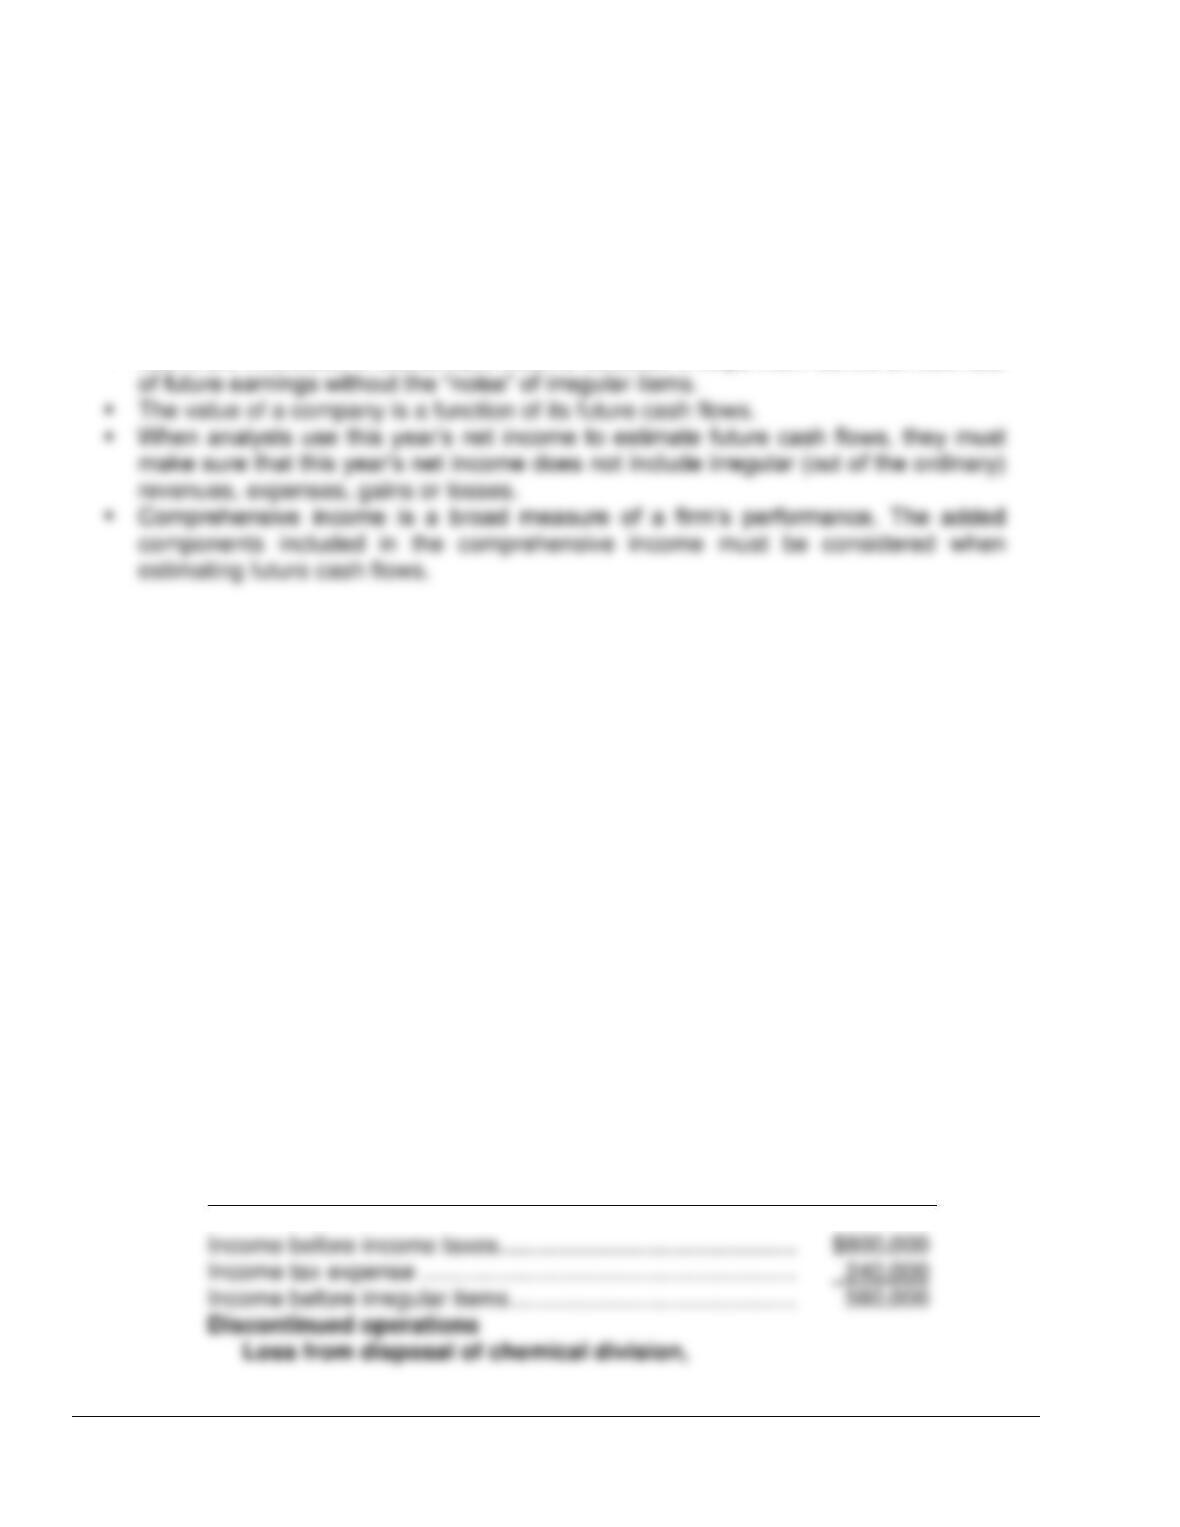
net of tax. To illustrate, assume that Rozek Inc. has revenues of $2.5 million and
expenses of $1.7 million from continuing operations in 2014. The company therefore
has income before income taxes of $800,000. During 2014, the company
discontinued and sold its unprofitable chemical division. The loss on disposal of the
chemical operations (net of $90,000 taxes) was $210,000. Assuming a 30% tax rate
on income before income taxes, the income statement presentation would be as
follows:
ROZEK INC.
Income Statement (partial)
For the Year Ended December 31, 2014
13-3
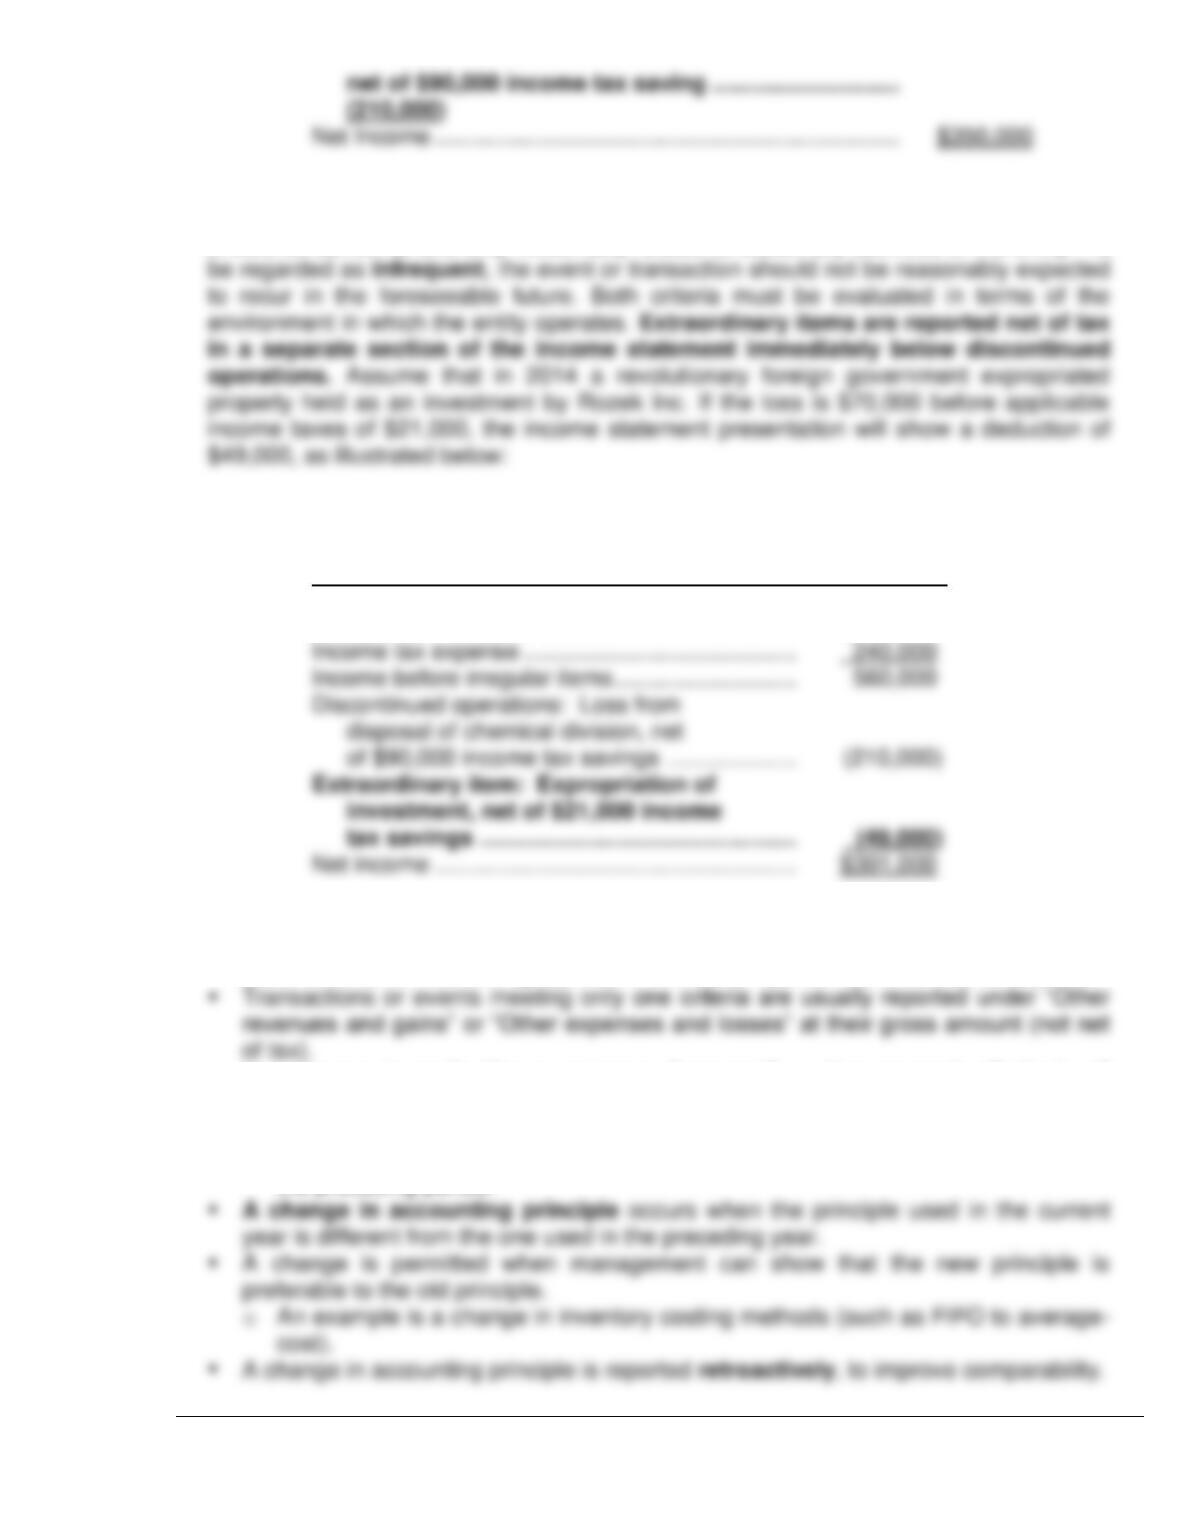
Extraordinary items are events and transactions that meet two conditions: They are
unusual in nature and infrequent in occurrence. To be considered unusual, the item
should be abnormal and only incidentally related to customary activities of the entity. To
ROZEK INC.
Partial Income Statement
For the Year Ended December 31, 2014
Income before income taxes ……………………….. $800,000
▪ If a transaction or event meets one but not both of the criteria for an extraordinary
item, it should be reported in a separate line item in the upper portion of the income
statement, rather than being reported in the bottom portion as an extraordinary item.
▪ In summary, in evaluating a company, it generally makes sense to eliminate all
irregular items in estimating future sustainable income.
o Changes in accounting principle—For ease of comparison, financial
statements are expected to be prepared on a basis consistent with that used for
the preceding period.
13-4
Learning Objective 3 – Explain the Concept of Comprehensive Income
Comprehensive Income – Most revenues, expenses, gains, and losses are
included in net income. However, certain gains and losses now bypass net income.
Instead these items are recorded as direct adjustments to stockholders’ equity.
▪ Many analysts have expressed concern about this practice because they
o Illustration of comprehensive income:
• Accounting standards require that most investments in stocks and
bonds be adjusted up or down to their market value at the end of
each accounting period.
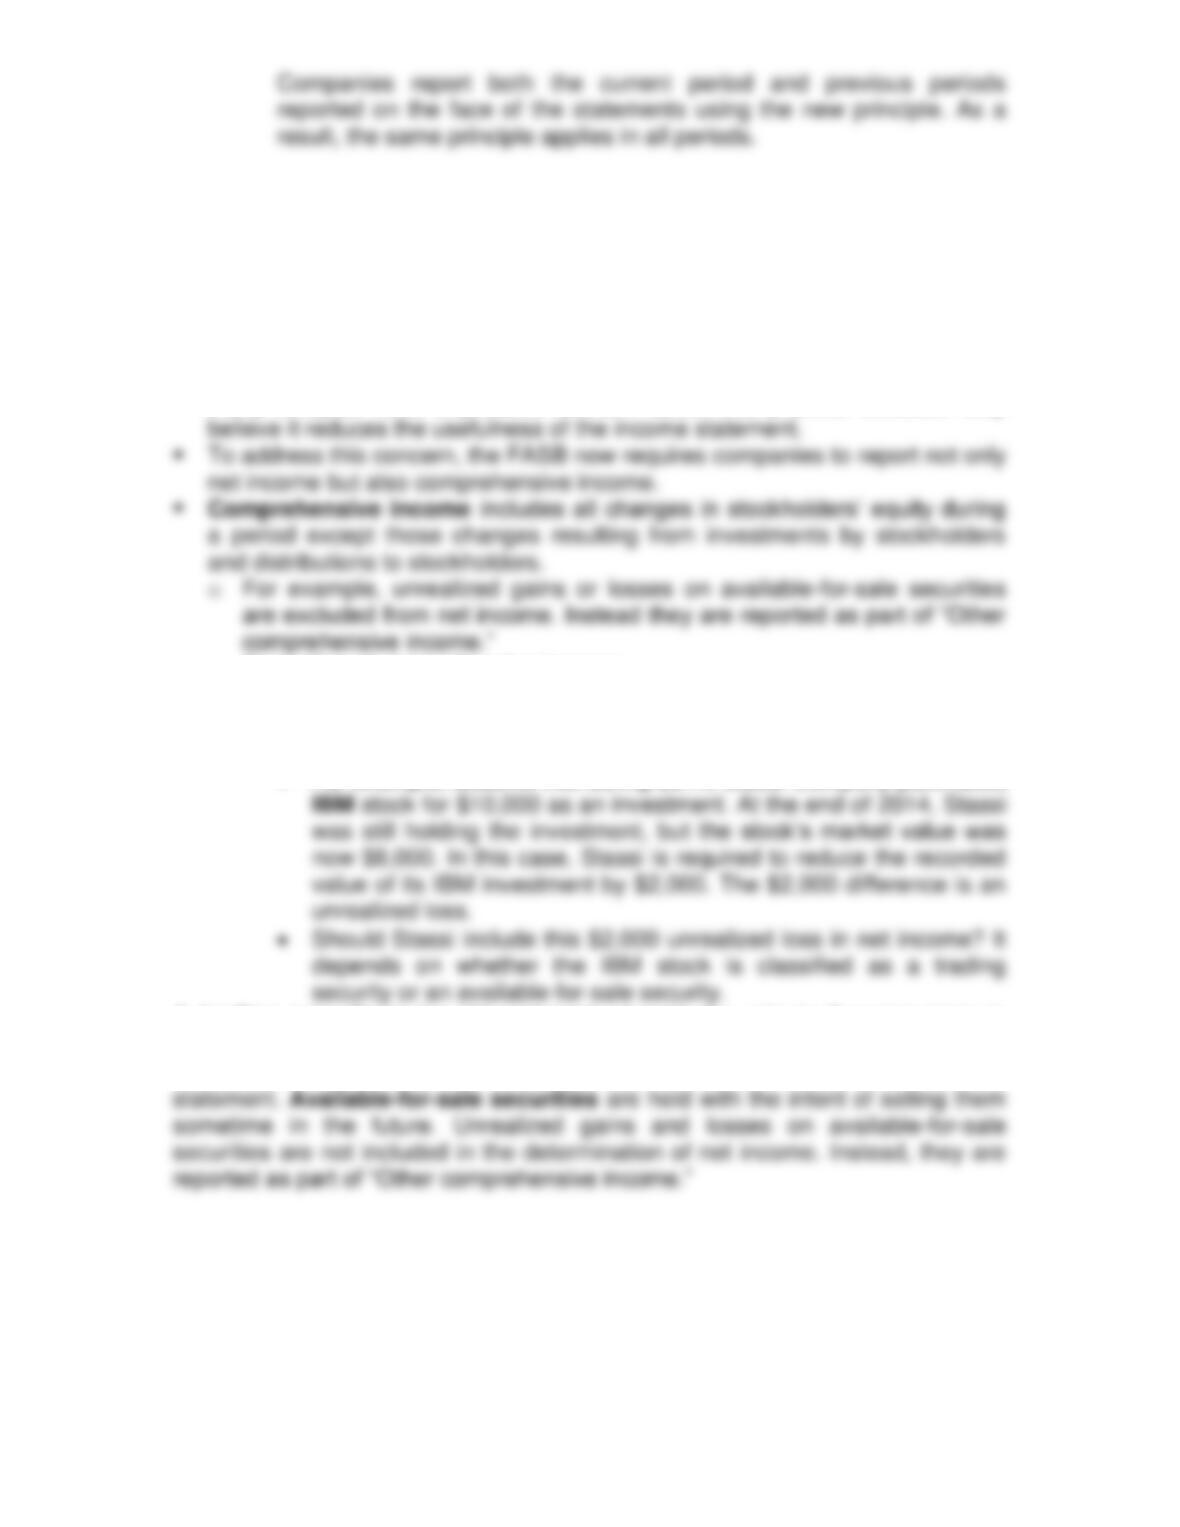
• For example, assume that during 2014, Stassi Company purchased
A trading security is bought and held primarily for sale in the near term to
generate income on short-term price differences. Unrealized losses on trading
securities are reported in the “Other expenses and losses” section of the income
13-5
Format—for reporting comprehensive income is to report a combined statement of
income and comprehensive income.
STASSI CORPORATION
Combined Statement of Income and
Comprehensive Income (partial)
Net Income ………………………………………………………… $300,000
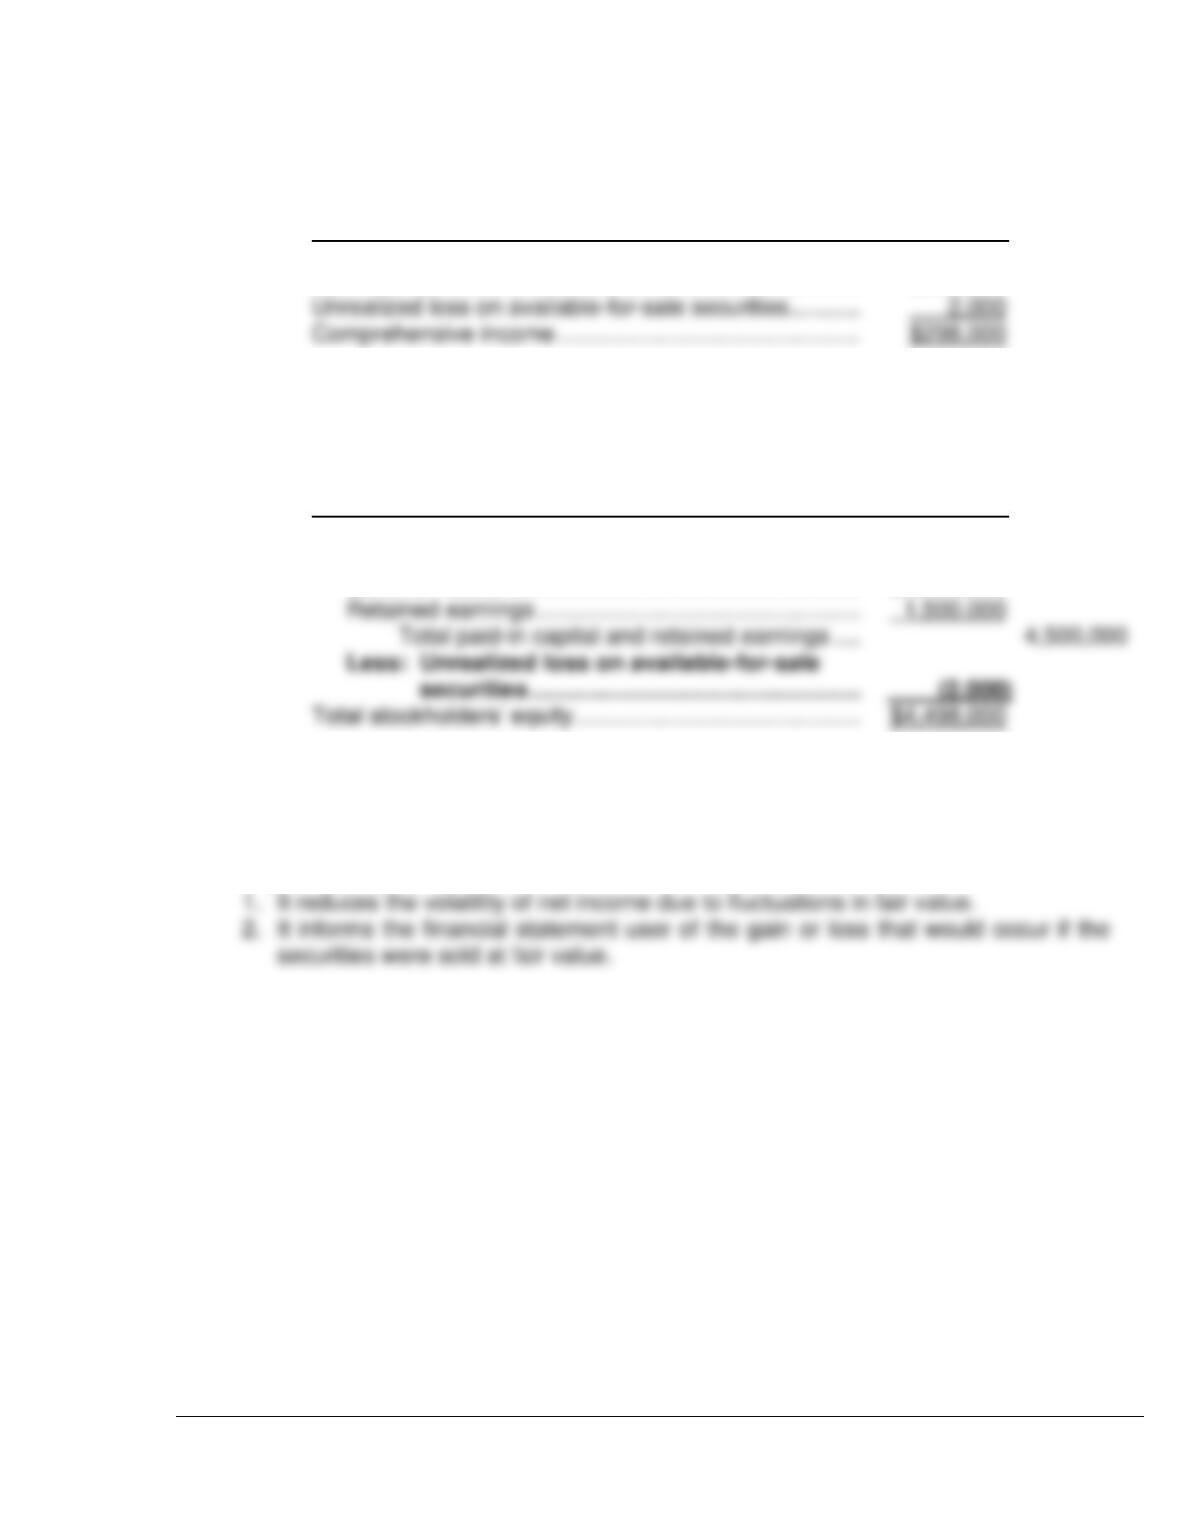
▪ The unrealized loss on available-for-sale securities is also reported as a separate
component of stockholders’ equity.
STASSI CORPORATION
Balance Sheet (partial)
Stockholders’ equity
Common stock ………………………………………………. $3,000,000
▪ Note that the presentation of the loss is similar to the presentation of the cost of
treasury stock in the stockholders’ equity section.
▪ An unrealized gain is added to this section of the balance sheet.
▪ Reporting the unrealized gain or loss in the stockholders’ equity section serves two
important purposes:
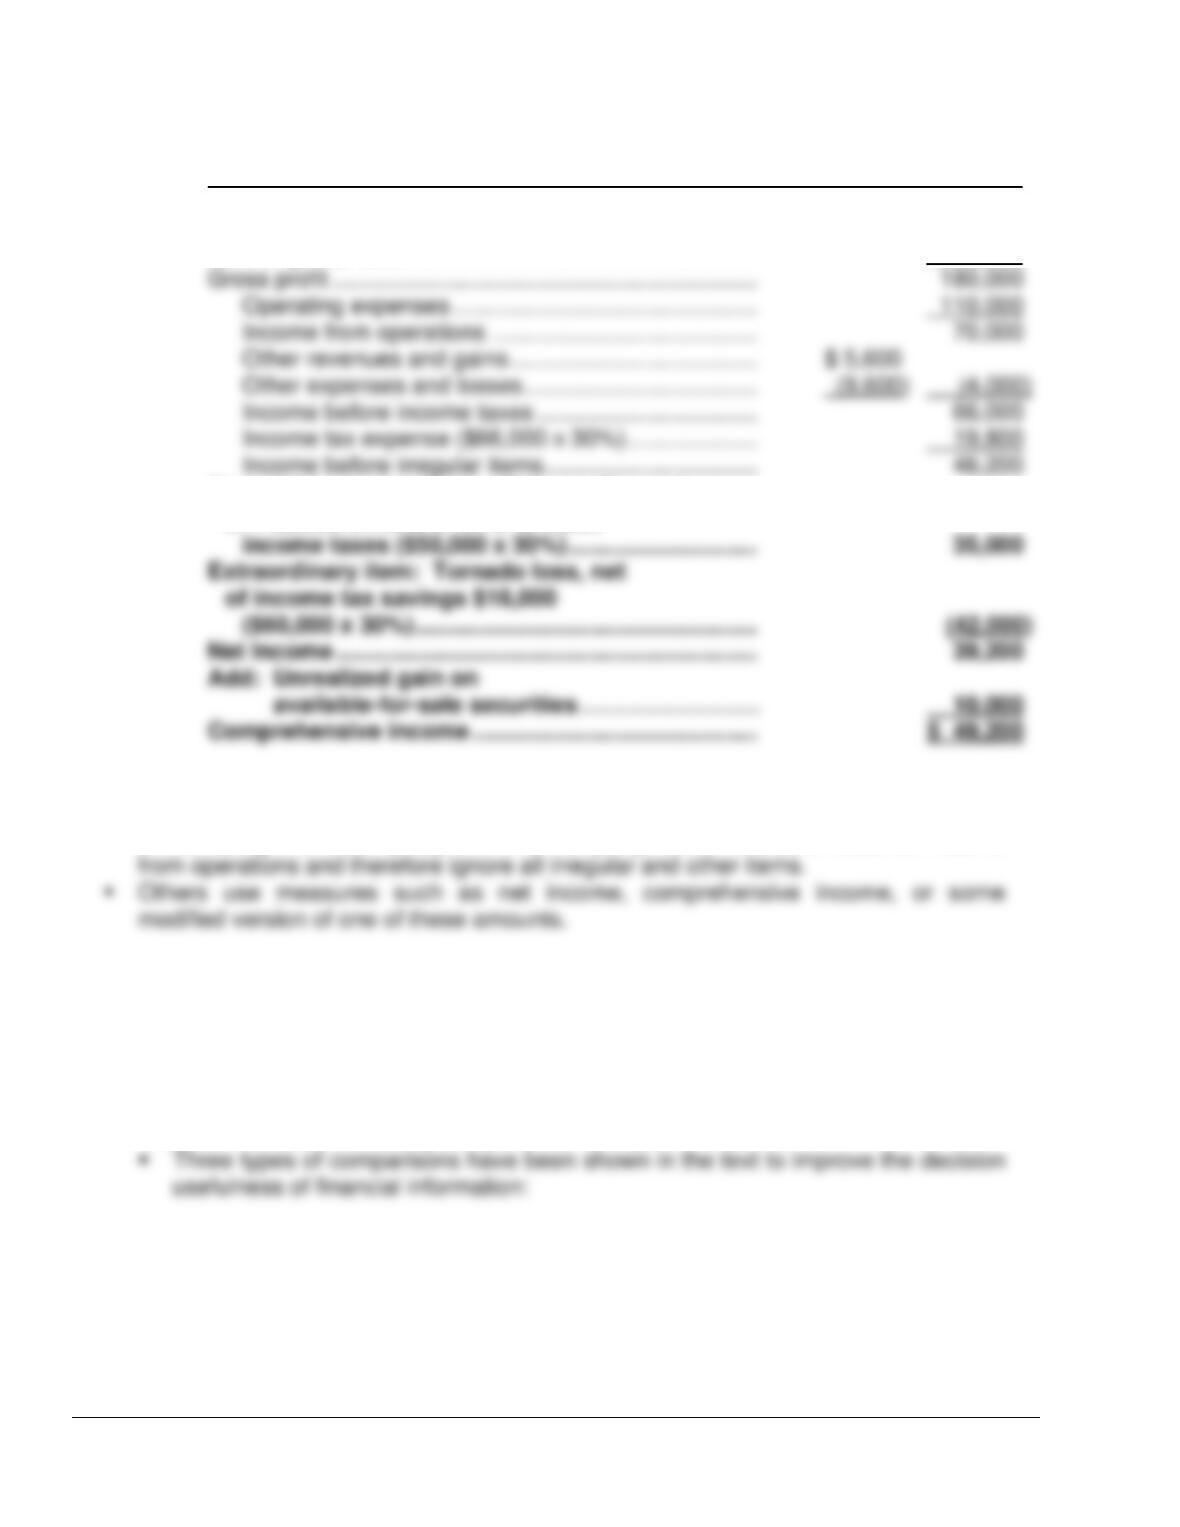
Complete Income Statement – The following income statement for Pace Corporation
presents the types of items found on this statement and shows how the irregular items
are reported.
13-6
PACE CORPORATION
Income Statement and
Statement of Comprehensive Income
For the Year Ended December 31, 2014
Net sales …………………………………………………………… $440,000
Cost of goods sold ………………………………………………. 260,000
Discontinued operations: Gain on disposal
of Plastics Division, net of $15,000
Concluding remarks – The computation of the correct net income number can be
elusive.
▪ In assessing the future prospects of a company, some investors focus on income
Learning Objective 4 – Describe and Apply Horizontal Analysis
Comparative Analysis—In assessing the financial performance of a company,
investors are interested in the core or sustainable earnings of a company. Investors
are also interested in making comparisons from period to period.
13-7
1. Intracompany basis. Comparisons within a company are often useful to detect
changes in financial relationships and significant trends. A comparison of Kellogg’s
2. Intercompany basis. Comparisons with other companies provide insight into a
company’s competitive position. Kellogg’s total sales for the year can be compared
with the total sales of its competitors in the breakfast cereal area, such as General
Mills.
3. Industry averages. Comparisons with industry averages provide information about
a company’s relative position within the industry. Kellogg’s financial data can be
compared with the averages for its industry compiled by financial ratings
Horizontal analysis—is known as trend analysis, is a technique for evaluating a series
of financial statement data over a period of time.
TEACHING TIP
Horizontal analysis is just that—horizontal. One looks across the page.
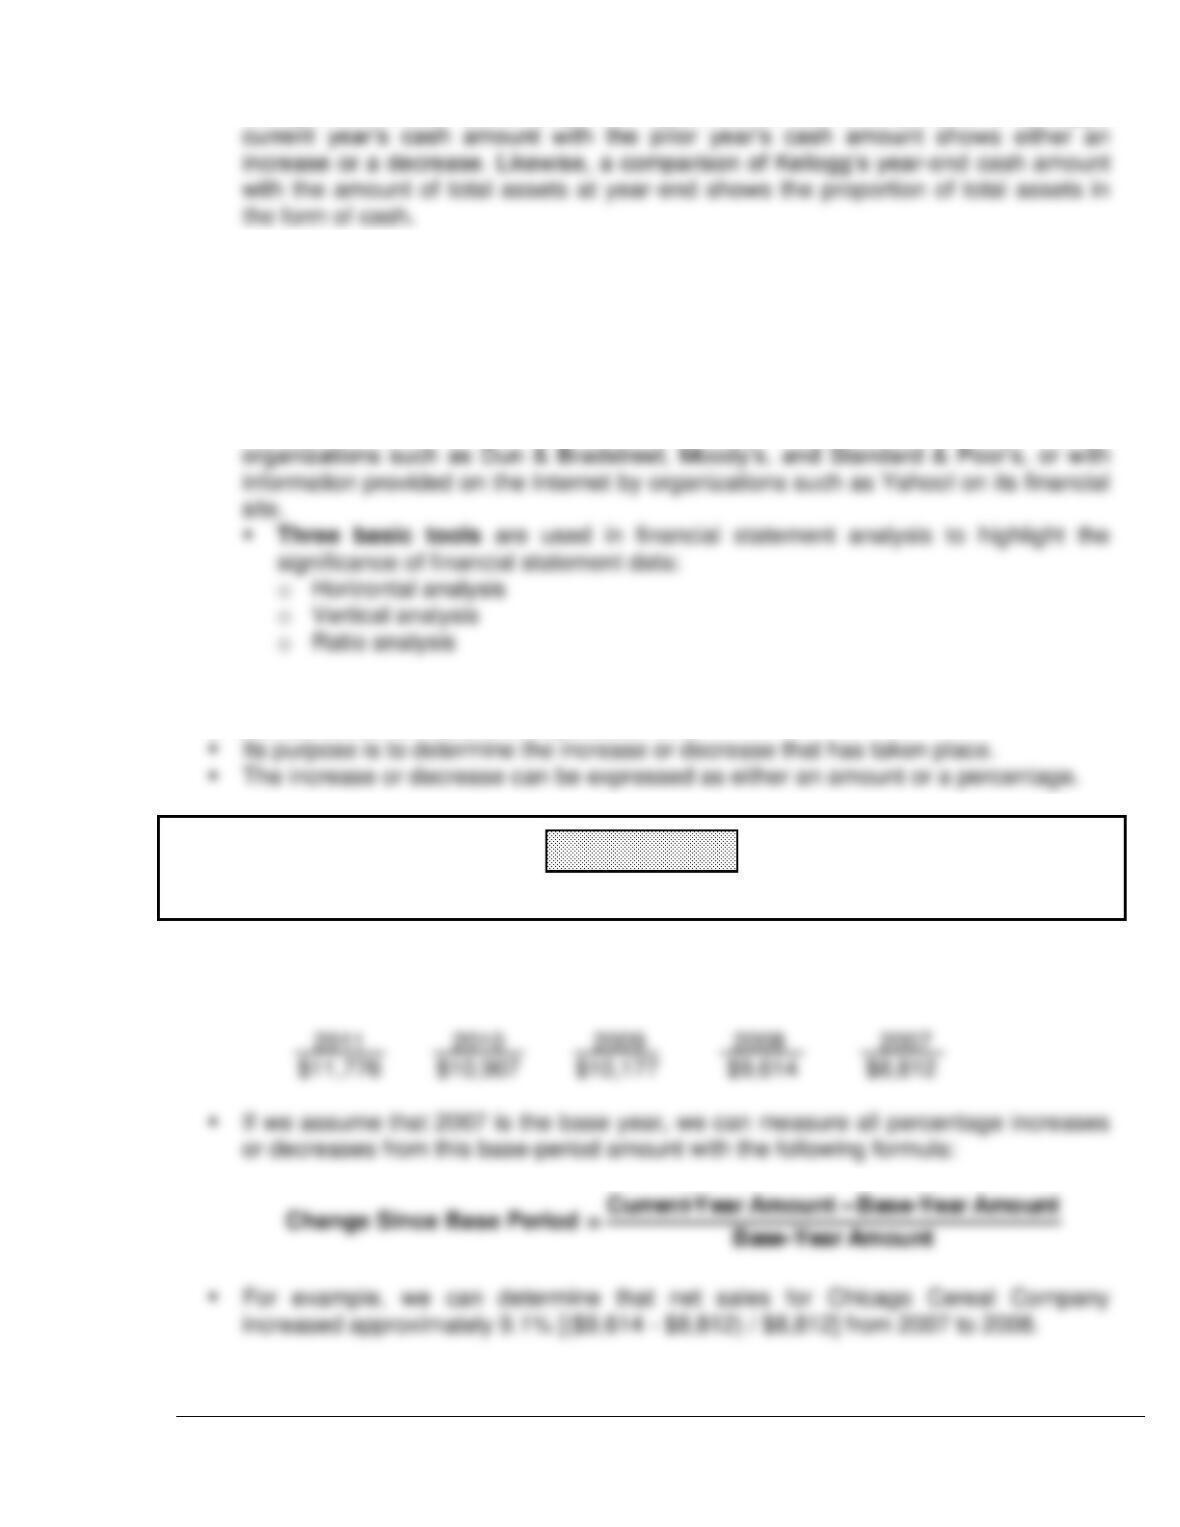
▪ To illustrate horizontal analysis, the most recent net sales figures (in thousands) of
Chicago Cereal Company are given:
13-8
▪ Alternatively, we can express current-year sales as a percentage of the base period
by dividing the current-year amount by the base-year amount:
▪ Current-period sales expressed as a percentage of the base-period for each of the
five years, assuming 2005 as the base period is:
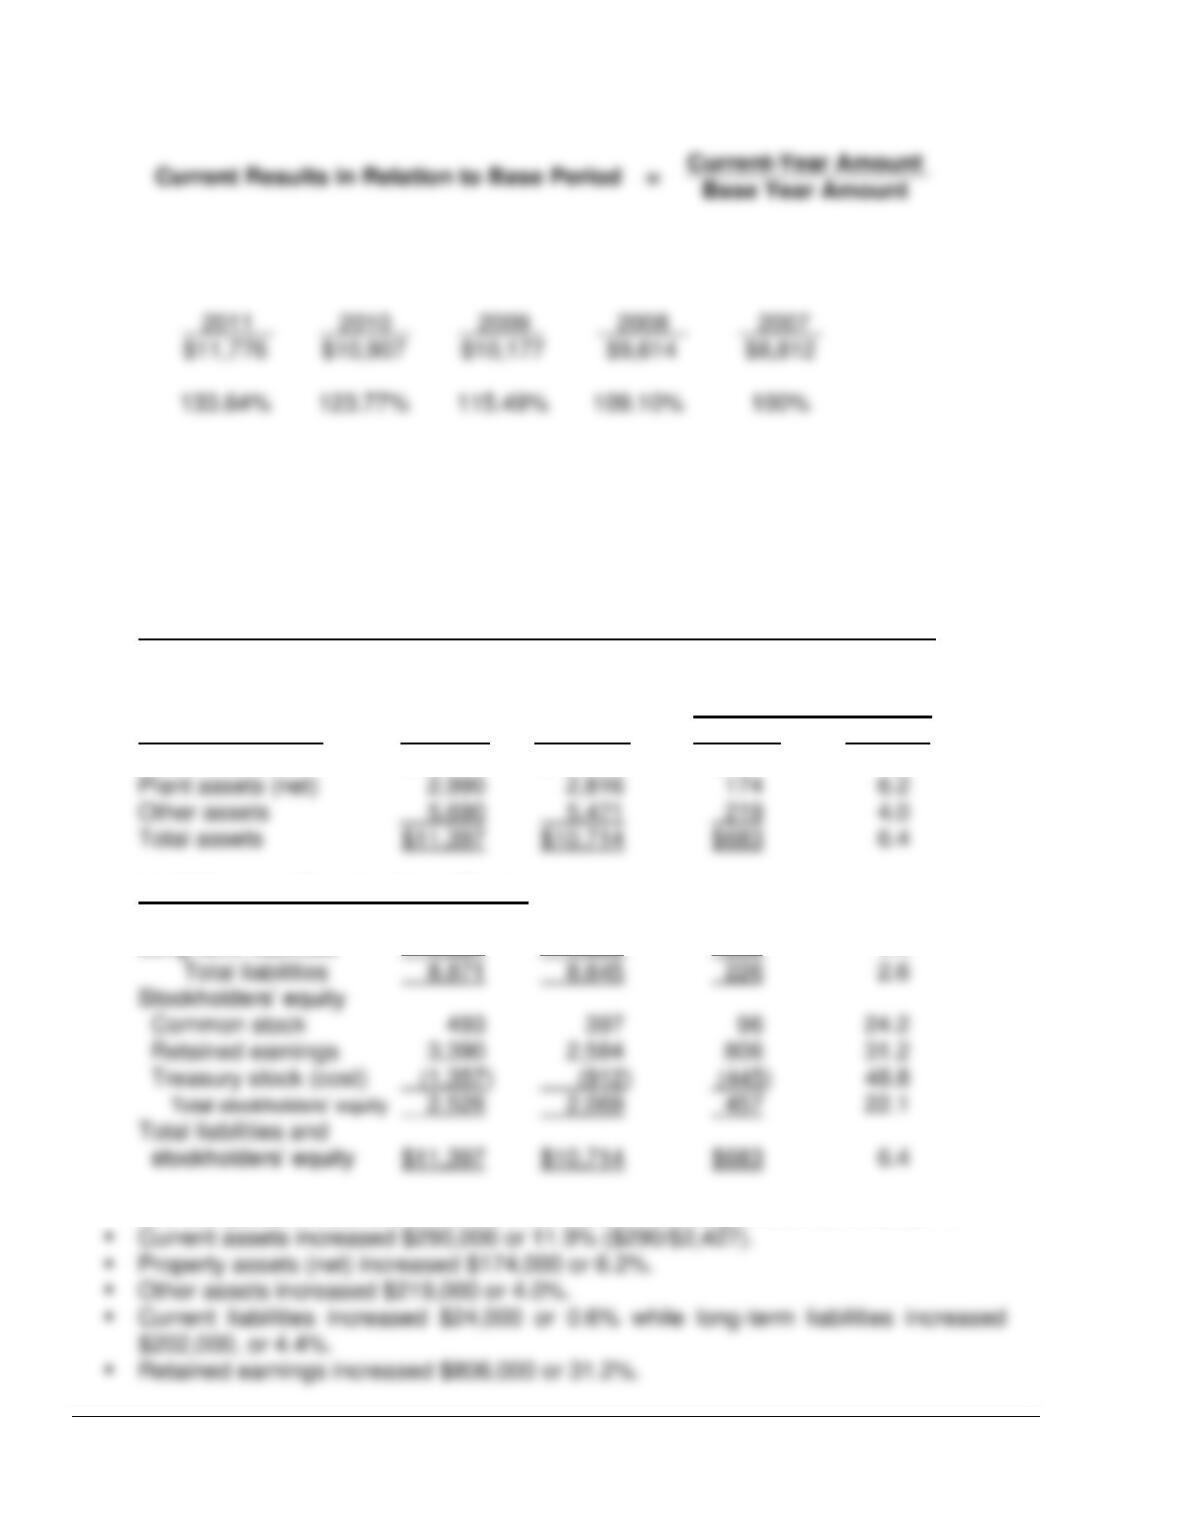
The financial statements of Chicago Cereal Company are used to further illustrate
horizontal analysis:
CHICAGO CEREAL COMPANY, INC.
Condensed Balance Sheets
December 31
(In thousands)
Increase (Decrease)
during 2011
Assets 2011 2010 Amount Percent
Current assets $ 2,717 $ 2,427 $290 11.9
Liabilities and Stockholders’ Equity
Current liabilities $ 4,044 $ 4,020 $ 24 0.6
Long-term liabilities 4,827 4,625 202 4.4
▪ The comparative balance sheet shows a number of changes from 2010 to 2011.
13-9
TEACHING TIP
Impress upon students the importance of the percentage figures. The percentages allow us
to see the relevance of the increase or decrease.
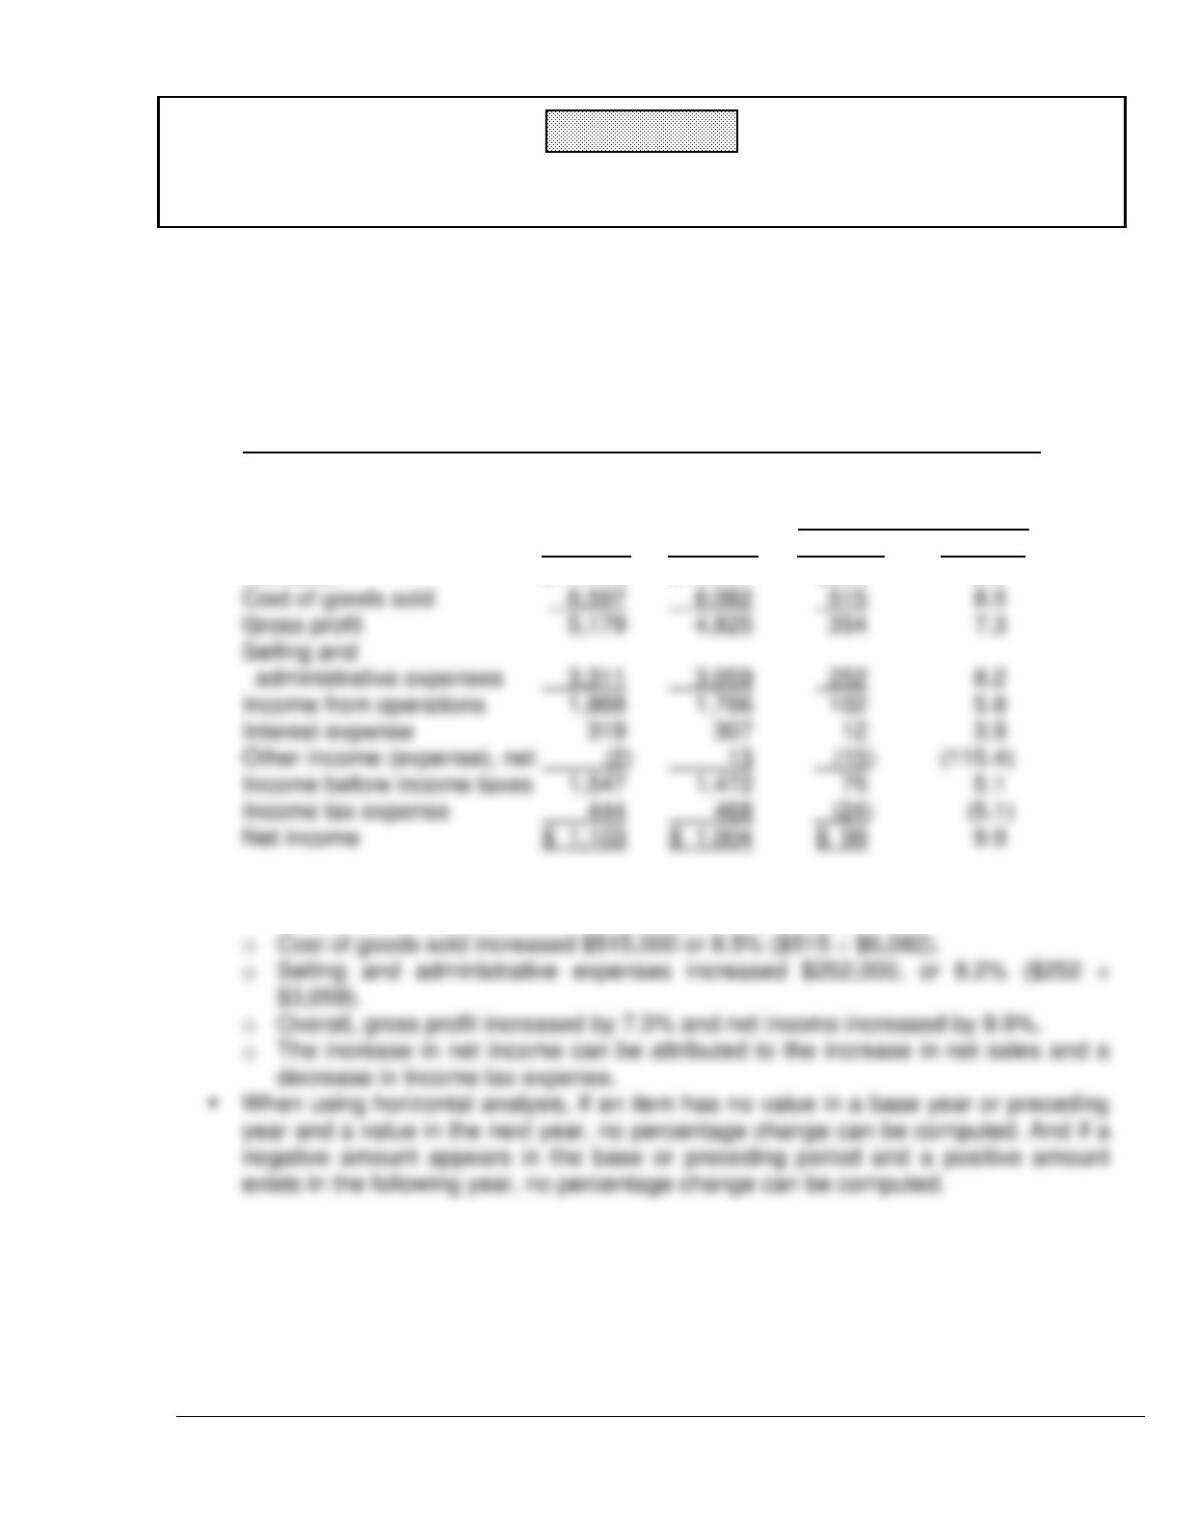
▪ A 2-year comparative income statement of Chicago Cereal Company for 2009 and
2008 is given in condensed format:
CHICAGO CEREAL COMPANY, INC.
Condensed Income Statement
For the Years Ended December 31
(In thousands)
Increase (Decrease)
during 2010
2011 2010 Amount Percent
Net sales $11,776 $10,907 $869 8.0
▪ Horizontal analysis of the income statements shows these changes:
o Net sales increased $869,000 or 8.0% ($869 ÷ $10,907).
13–10
Learning Objective 5 – Describe and Apply Vertical Analysis
Vertical analysis—the common-size analysis, is a technique for evaluating financial
statement data that expresses each item in a financial statement as a percentage of a
base amount.
▪ On a balance sheet one might say that current assets are 22% of total assets (total
assets being the base amount.)
▪ On an income statement one might say that selling expenses are 16% of net sales
(net sales being the base amount.)
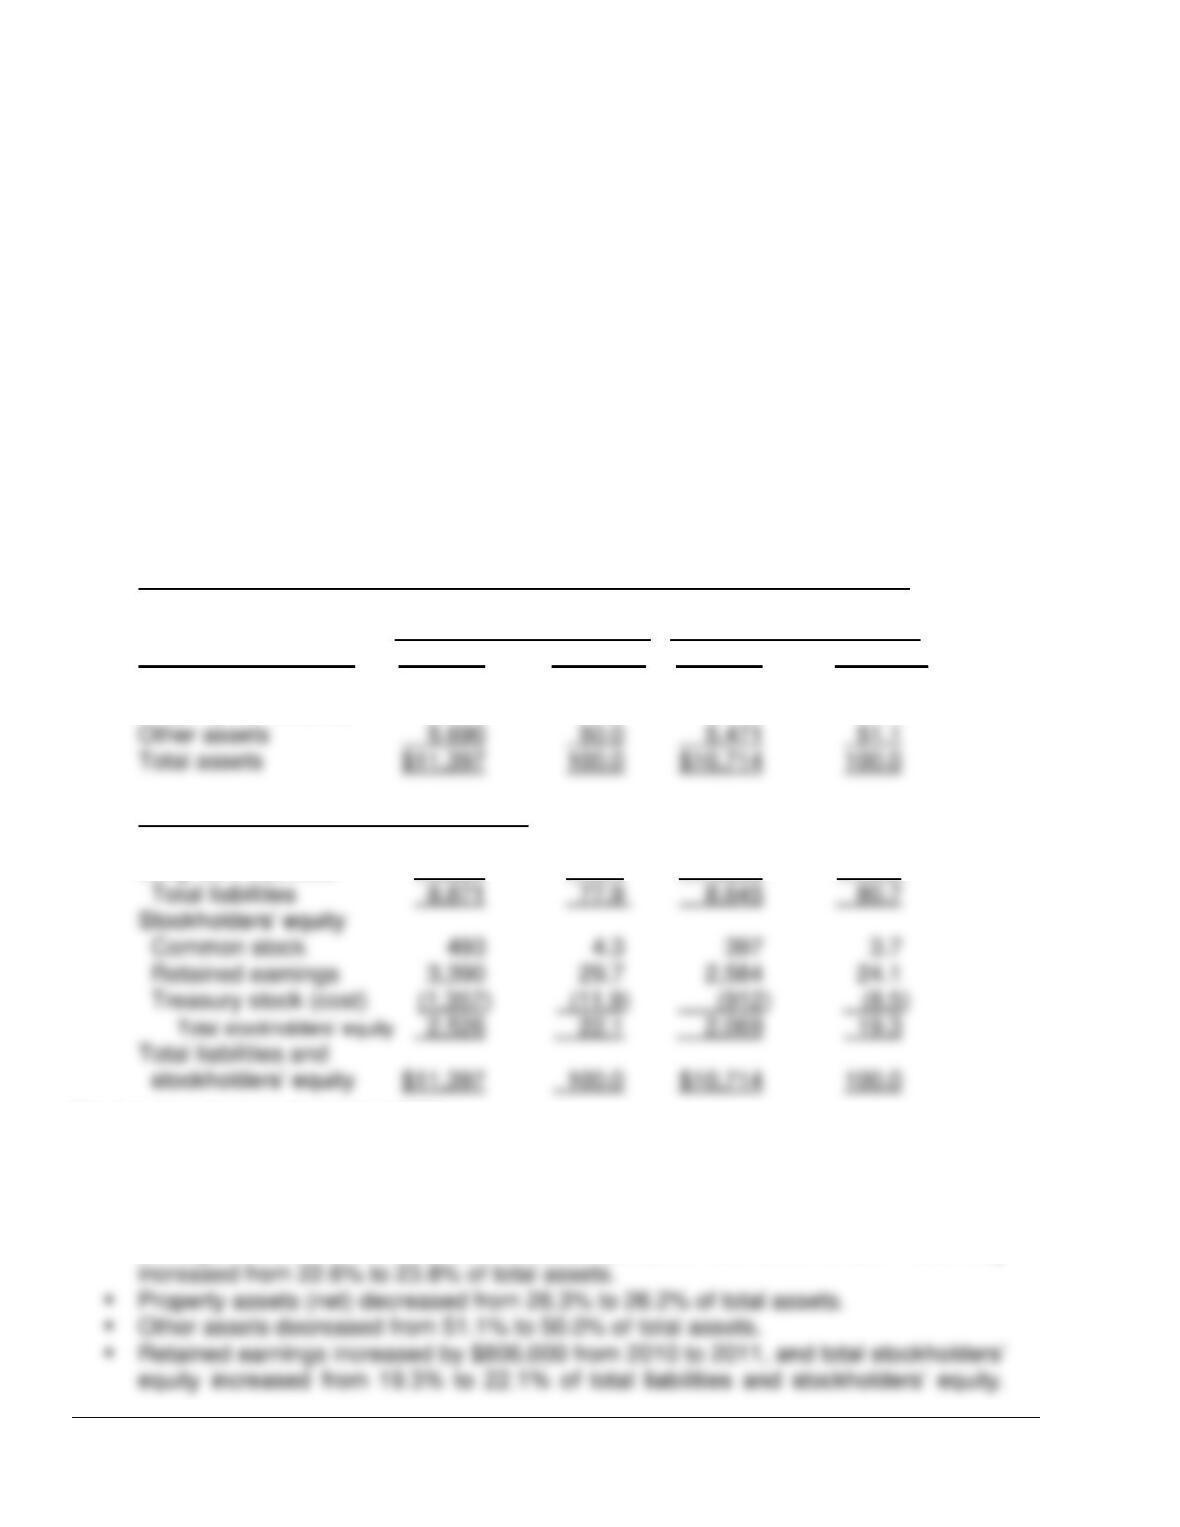
Presented below is the comparative balance sheet of Chicago Cereal for 2011 and
2010, analyzed vertically.
CHICAGO CEREAL COMPANY, INC.
Condensed Balance Sheets
December 31
(In thousands)
2011 2010
Assets Amount Percent* Amount Percent*
Current assets $ 2,717 23.8 $ 2,427 22.6
Property assets (net) 2,990 26.2 2,816 26.3
Liabilities and Stockholders’ Equity
Current liabilities $4,044 35.5 $ 4,020 37.5
Long-term liabilities 4,827 42.4 4,625 43.2
*Numbers have been rounded to total 100%.
o In addition to showing the relative size of each category on the balance sheet,
vertical analysis may show the percentage change in the individual asset, liability,
and stockholders’ equity items.
▪ Chicago Cereal’s current assets increased $290,000 from 2010 to 2011 and they
13–11
This switch to a higher percentage of equity financing has two causes: First, while
total liabilities increased by $226,000 the percentage of liabilities declined from
80.7% to 77.9% of total liabilities and stockholders’ equity. Second, retained
earnings increased by $806,000. Thus, the company shifted toward a heavier
reliance on equity financing both by using less debt and by increasing the amount of
retained earnings.
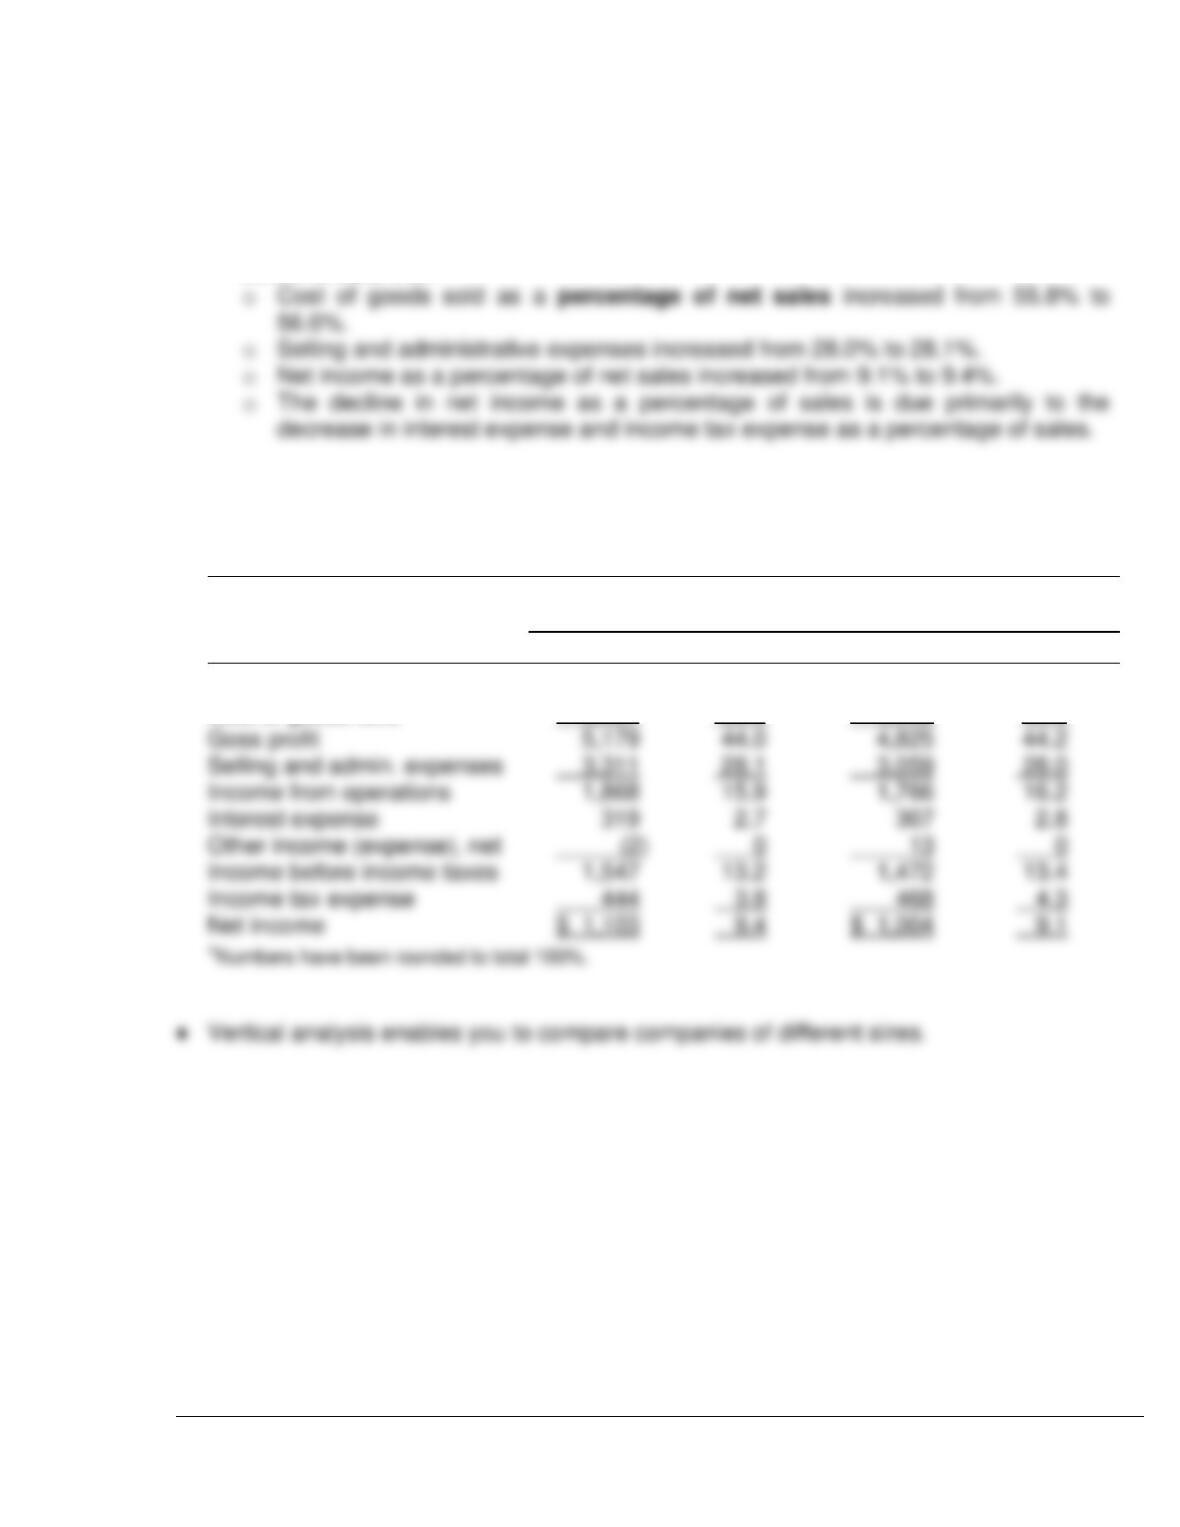
▪ Vertical analysis of the comparative income statements of Chicago Cereal, shown
below reveals that:
CHICAGO CEREAL COMPANY, INC.
Condensed Income Statement
For the Years Ended December 31
(In thousands)
2011
2010
Amount
Percent*
Amount
Percent*
Net sales
$11,776
100.0
$10,907
100.0
Cost of goods sold
6,597
56.0
6,082
55.8
Goss profit
44.2
Selling and admin. expenses
3,311
28.1
3,059
Income from operations
16.2
Interest expense
Other income (expense), net
Income before income taxes
13.4
Income tax expense
Net income
13–12
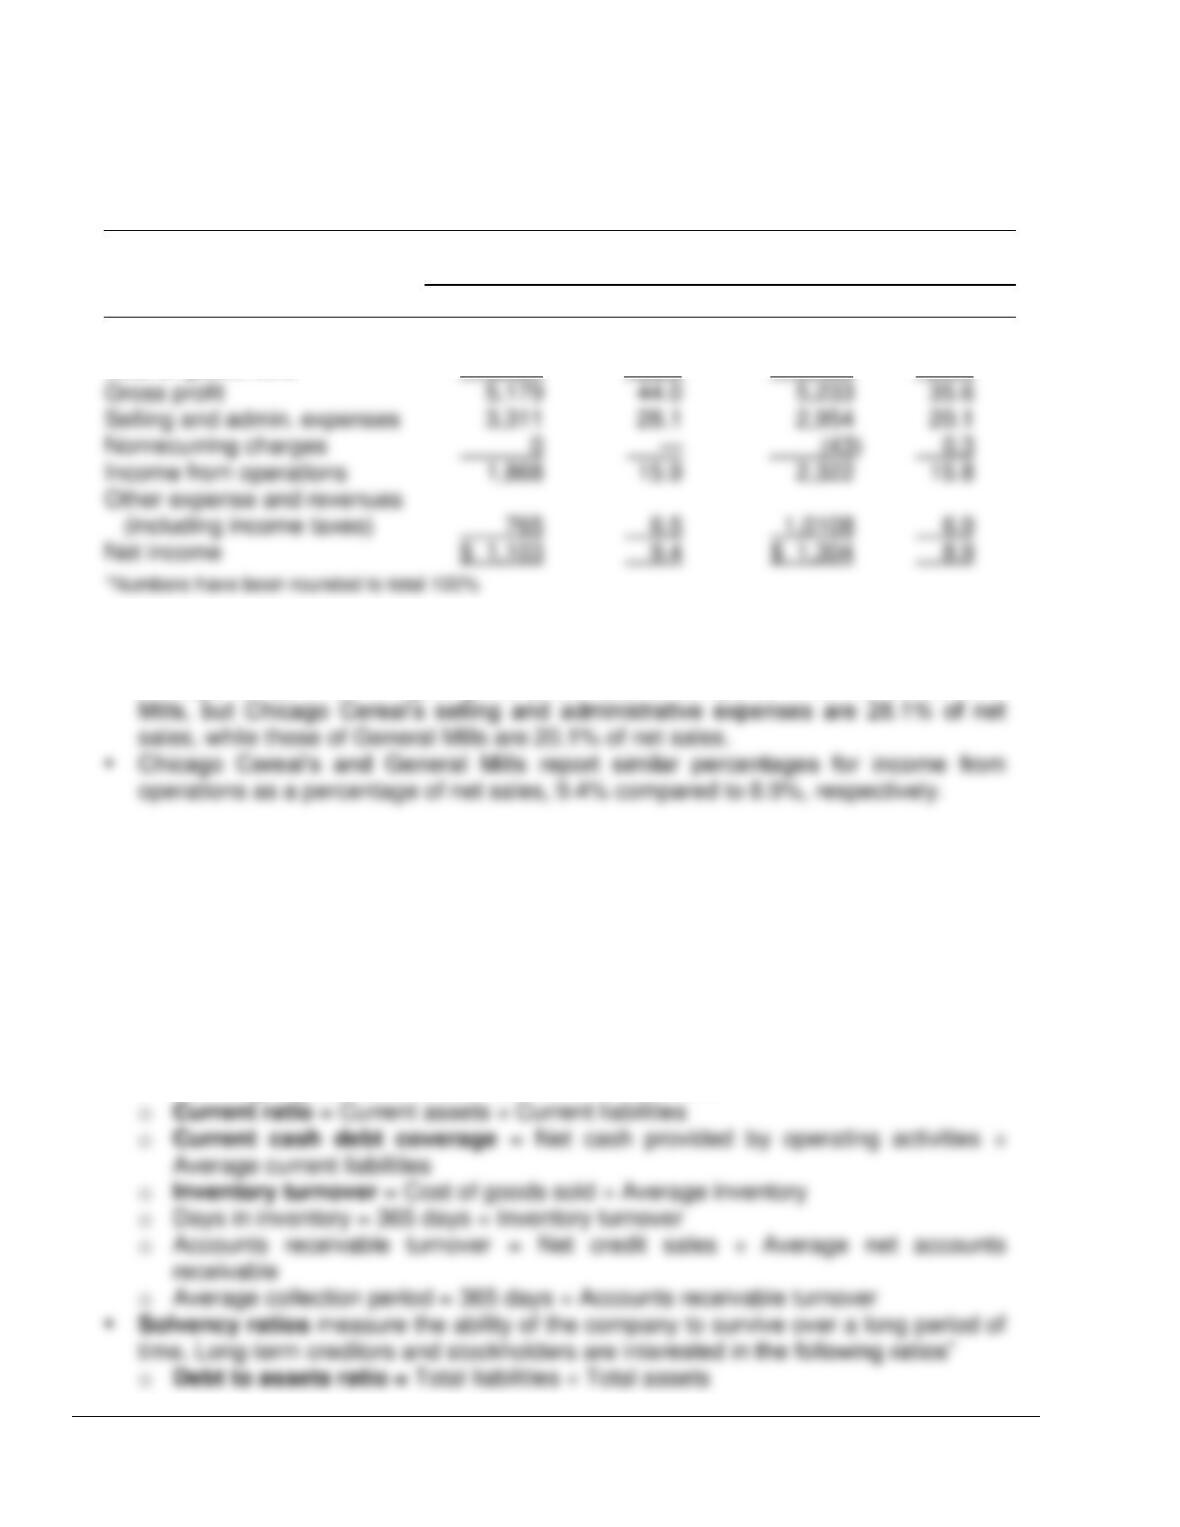
Shown below is a comparison of the income statements of Chicago Cereal and General
Mills:
CONDENSED INCOME STATEMENTS
For the Year Ended December 31, 2011
(In thousands)
Chicago Cereal.
General Mills, Inc.
Amount
Percent*
Amount
Percent*
Net sales
$11,776
100.0
$14,691
100.0
Cost of goods sold
6,597
56.0
9,458
64.4
Gross profit
35.6
Selling and admin. expenses
20.1
Nonrecurring charges
(43)
0.3
6.5
1,0108
6.9
Net income
9.4
$ 1,304
8.9
▪ Although Chicago Cereal’s net sales are less than the net sales of General Mills,
vertical analysis eliminates the impact of the size difference for the analysis.
▪ Chicago Cereal’s has a higher gross profit, 44.0%, compared to 35.6% for General
Learning Objective 6 – Identify and Compute Ratios Used in Analyzing a Company’s
Liquidity, Solvency, and Profitability
Ratio Analysis—For analysis of the primary financial statements, ratios can be classified
into three types:
▪ Liquidity ratios measure the short-term ability of the company to pay its maturing
obligations and to meet unexpected needs for cash. Short-term creditors such as
bankers and suppliers are interested in the following ratios:
o Working capital = Current assets – Current liabilities
13–13
o Cash debt coverage = Net cash provided by operating activities ÷ Average total
liabilities
▪ Profitability ratios measure the income or operating success of a company for a
given period of time. Creditors and investors are interested in the following ratios:
o Earnings per share = (Net income – Preferred dividends) ÷ Average common
shares outstanding
TEACHING TIP
Review the summary listing on pages 704-705 of ratios presented in previous chapters. A
comprehensive illustration of ratio analysis is presented in the Appendix at the end of the
chapter.
Learning Objective 7 – Understand the Concept of Quality of Earnings
Quality of Earnings—A company that has a high quality of earnings provides full
and transparent information that will not confuse or mislead users of financial
statements.
▪ The issue of quality of earnings has taken on increasing importance because recent
accounting scandals suggest that some companies are spending too much time
managing their income and not enough time managing their business.
▪ Alternative accounting methods – Variations among companies in the application
of generally accepted accounting principles may hamper comparability and reduce
quality of earnings.
13–14
▪ Pro forma income – Companies whose stock is publicly traded are required to
present their income statement following generally accepted accounting principles
(GAAP).
o In recent years, many companies have been also reporting a second measure of
income, called pro forma income.
o Pro forma income is a measure that usually excludes items that the company
thinks are unusual or non-recurring.
o There are no rules as to how to prepare pro forma earnings. Companies
generally can exclude any items they deem inappropriate for measuring their
▪ Improper recognition – Because some managers have felt pressure to continually
increase earnings, they have manipulated the earnings numbers to meet these
expectations.
o The most common abuse is the improper recognition of revenue.
o One practice that companies are using is called channel stuffing. Offering deep
discounts on their products to customers, companies encourage their customers
▪ Price-earnings ratio – In order to make a meaningful comparison of market values
and earnings across firms, investors calculate the price-earnings (P-E) ratio.
o The P-E ratio, divides the market price of a share of common stock by earnings
per share.
o The P-E ratio reflects investors’ assessment of a company’s future earnings.
13–15
Learning Objective – 8 – Evaluate a company comprehensively using ratio analysis
Comprehensive Illustration of Ratio Analysis—Many ratios used for evaluating
the financial health and performance of a company are presented in the text. This
appendix provides a comprehensive review of those ratios, discusses some
important relationships among them, and focuses on their interpretation.
▪ As indicated in the chapter, for analysis of the primary financial statements, ratios
can be classified into three types:
1. Liquidity ratios: Measures of the short-term ability of the company to pay its
maturing obligations and to meet unexpected needs for cash.
2. Solvency ratios: Measures of the ability of the company to survive over a long
period of time.
3. Profitability ratios: Measures of the income or operating success of a company for
a given period of time.
▪ Go over the information presented in Illustrations 13A-1 through 13A-4.
Ratios can provide clues to underlying conditions that may not be apparent from
an inspection of the individual components of a particular ratio.
A single ratio by itself is not very meaningful.
▪ The discussion on ratios uses the following comparisons:
▪ Liquidity ratios measure the short-term ability of the enterprise to pay its maturing
obligations and to meet unexpected needs for cash.
o Short-term creditors, such as bankers and suppliers, are particularly interested in
assessing liquidity.
2. Current cash debt coverage ratio is the ratio of cash provided by operating
activities to average current liabilities.
• A disadvantage of the current ratio is that it uses year-end balances of current
asset and current liability accounts.
13–16
3. Accounts receivable turnover measures liquidity by determining how quickly
certain assets can be converted to cash.
• The receivables turnover ratio measures the number of times, on average,
receivables are collected during the period.
4. Average collection period is a popular variant of the receivables turnover ratio.
• The average collection period converts the receivables turnover into an average
collection period expressed in days.
TEACHING TIP
Ask students to try not to memorize the information in this chapter. Ask them to think about
the information that is available and about what they are trying to compute. The receivables
turnover ratio tells us how many times receivables are turning over a year. Therefore, if we
divide the receivables turnover ratio into the number of days in a year, we will find the
number of days, on average, accounts receivable are outstanding.
5. Inventory turnover measures the number of times on average the inventory is sold
during the period.
• The purpose of this ratio is to measure the liquidity of the inventory.
6. Days in inventory is a variant of the inventory turnover ratio.
• The days in inventory measures the average number of days inventory is held.
▪ Solvency ratios – measure the ability of the enterprise to survive over a long period
of time.
o Long-term creditors and stockholders are interested in a company’s long-run
solvency, particularly its ability to pay interest as it comes due and to repay the
face value of debt at maturity.
13–17
7. Debt to total asset ratio measures the percentage of total assets provided by
creditors.
• It is computed by dividing total liabilities (both current and long-term) by total
assets.
• This ratio indicates the degree of financial leveraging and provides some
indication of the company’s ability to withstand losses without impairing the
interests of its creditors.
8. Times interest earned ratio, also called interest coverage, indicates the
company’s ability to meet interest payments as they come due.
• The ratio is computed by dividing income before interest expense and income
taxes by interest expense.
• Review the information in Illustration 13A-12.
TEACHING TIP
Emphasize that income before interest expense and income tax expense is the amount used
9. Cash debt coverage ratio is the ratio of cash provided by operating activities to
average total liabilities.
• This ratio is a cash-basis measure of solvency.
• The cash debt coverage ratio indicates a company’s ability to repay its liabilities
10. Free cash flow is an indication of a company’s solvency and its ability to pay
dividends or expand operations.
• Free cash flow is the amount of excess cash generated after investing in capital
▪ Profitability ratios – measure the income or operating success of an enterprise for
a given period of time.
o A company’s income or lack of it, affects its ability to obtain debt and equity