13–14
PROBLEMS
Problem 13.20
MEMO
TO: Carson Wellington
FROM: Emily Sorensen
RE: Comparison of Activity- and Strategic-Based Responsibility Accounting
DATE: July 14, 2014
As requested, I am providing, in advance, a list of some of the most important
similarities and differences between activity- and strategic-based responsibility
accounting. Once you have had a chance to review this list, we can meet and
discuss the steps that must be taken if we are to implement a strategic-based
approach.
SIMILARITIES:
• Both approaches emphasize the need to support and encourage continuous
improvement.
• Both emphasize the importance of process responsibility and financial
responsibility.
13–15
Problem 13.20 (Concluded)
DIFFERENCES:
• The strategic-based approach expands the responsibility dimensions from two
to four, adding a customer perspective and a learning and growth perspective.
• The performance measures selected are balanced between those that drive
performance and those that measure outcome, between financial and nonfi-
Problem 13.21
1. 2014 2016
a. 208,000/104,000 = 2/hr. 234,000/104,000 = 2.25/hr.
60/2 = 30 min. 60/2.25 = 26.67 min.
b. 5,200/208,000 = 0.025 26,000/234,000 = 0.111
13–16
Problem 13.21 (Concluded)
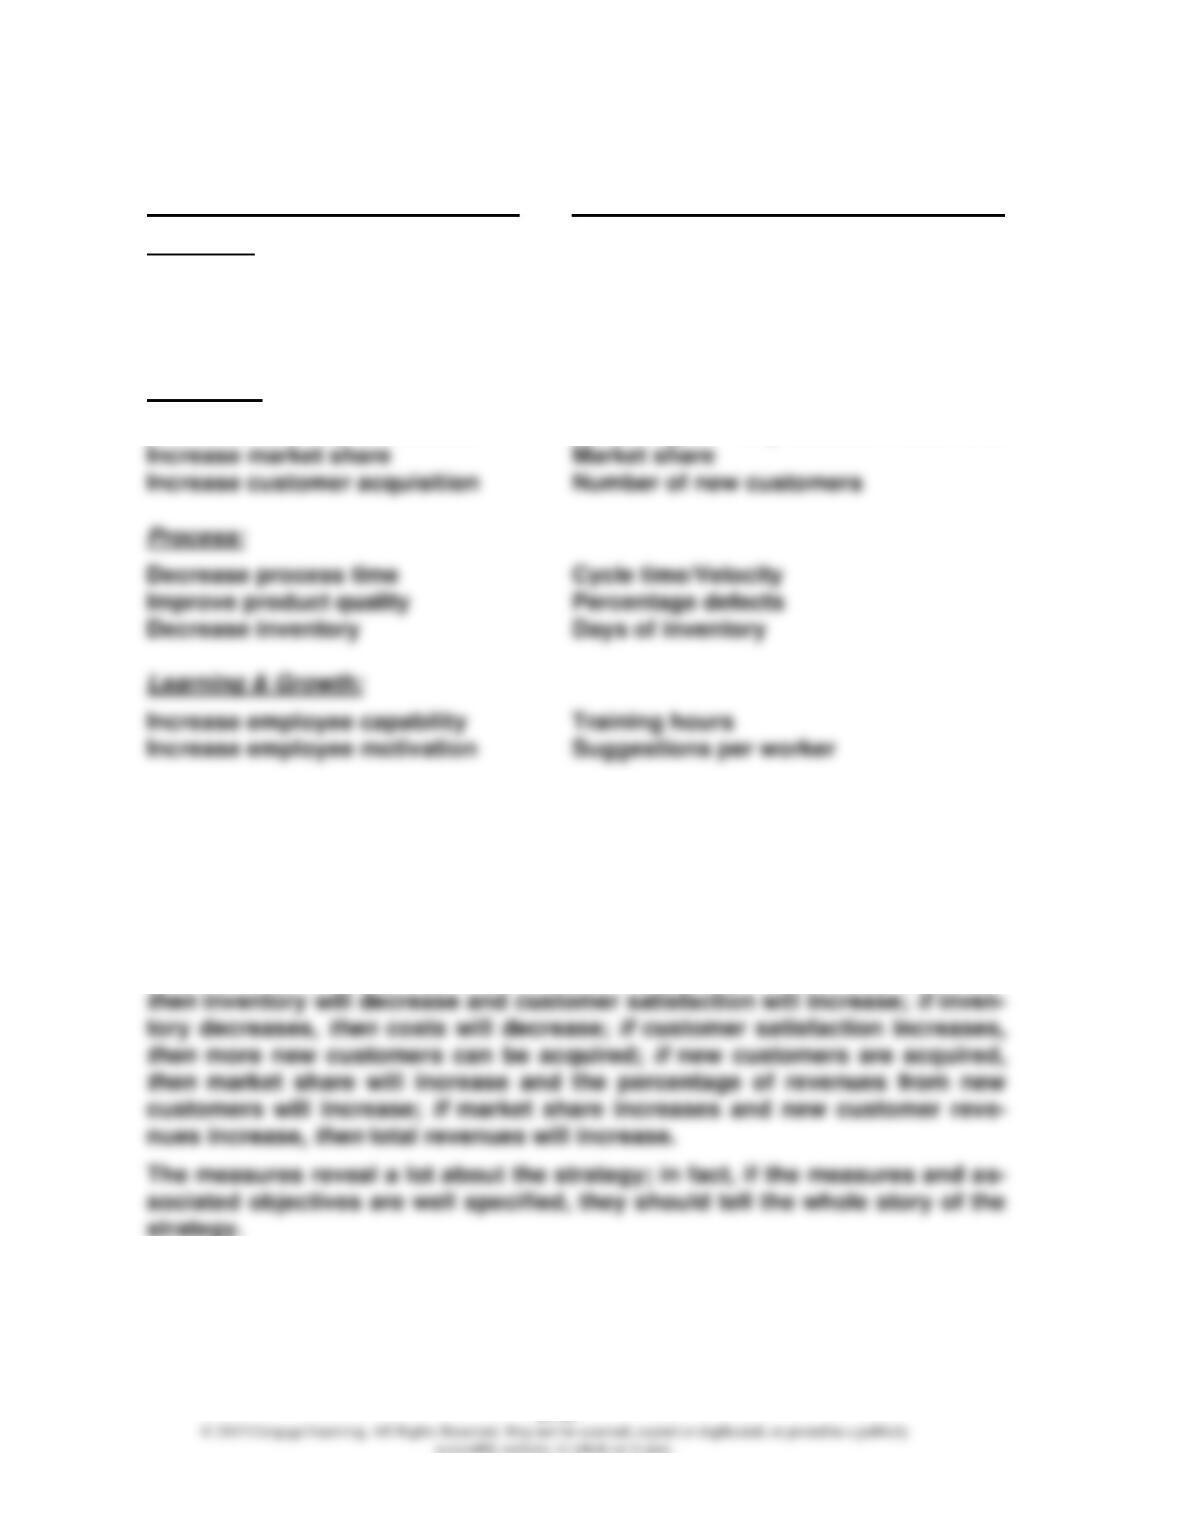
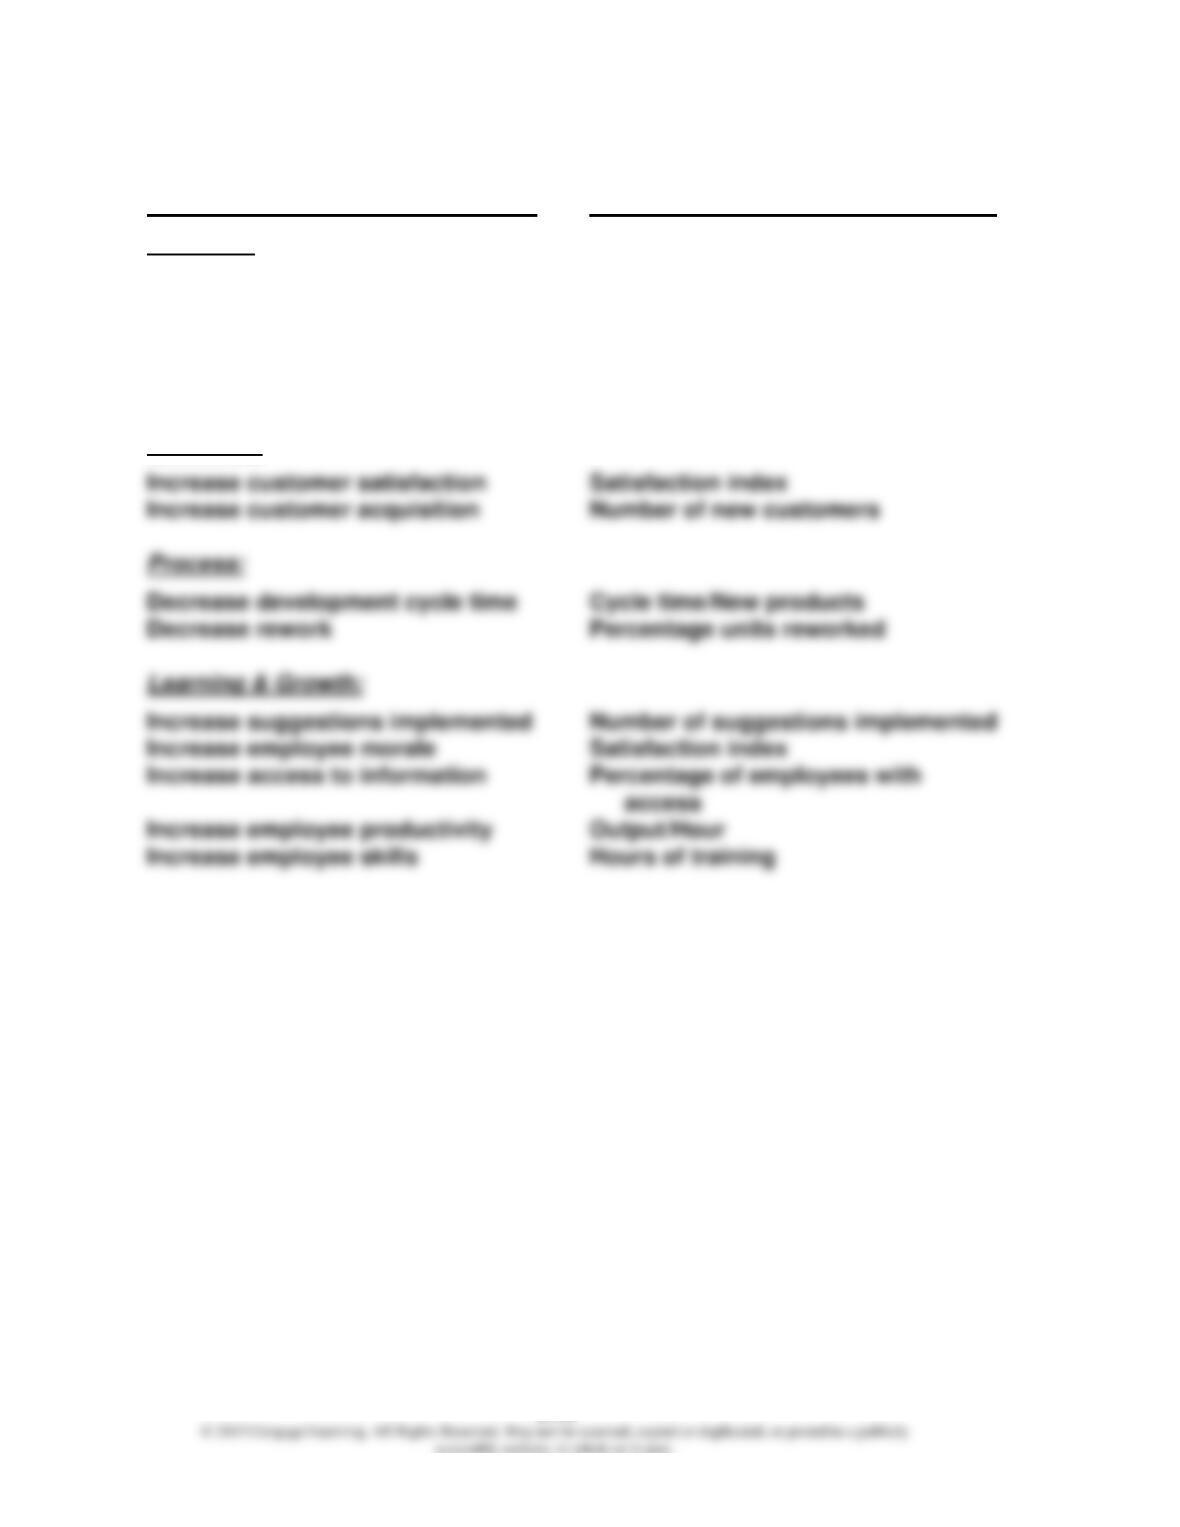
2. Strategic Objective Measure
Financial:
Reduce unit cost Unit cost reduction (%)
Develop new revenue Percentage of new revenues
Increase total revenues Revenue
Customer:
Increase customer satisfaction Percentage of very satisfied customers
Problem 13.22
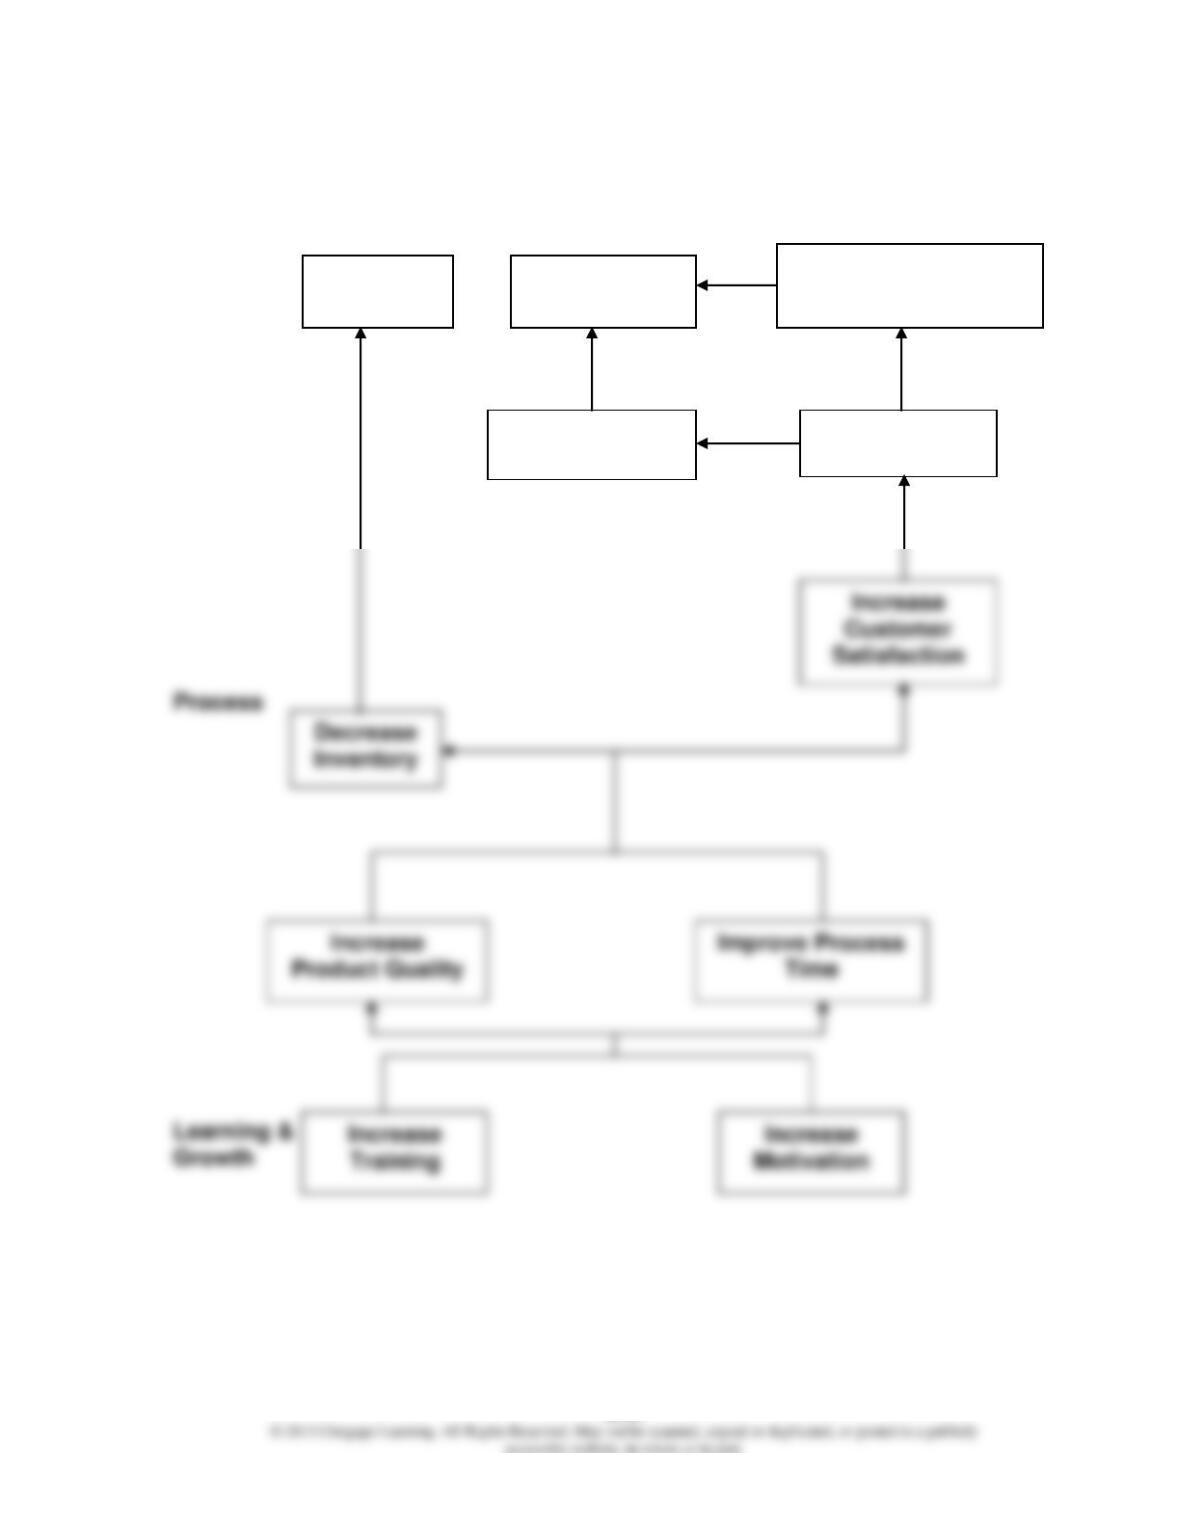
1. Based on the available information, we can express the strategy as follows
(other if-then possibilities may be reasonable):
If training and motivation are increased, then product quality and process
time will improve; if process time decreases and product quality improves,
13–17
Problem 13.22 (Concluded)
2. Strategy Map:
Financial
Customer
Decrease
Costs
Increase
Revenues
Increase Market
Share
Increase New
Customers
Increase New
Customer Revenues
13–18
Problem 13.23
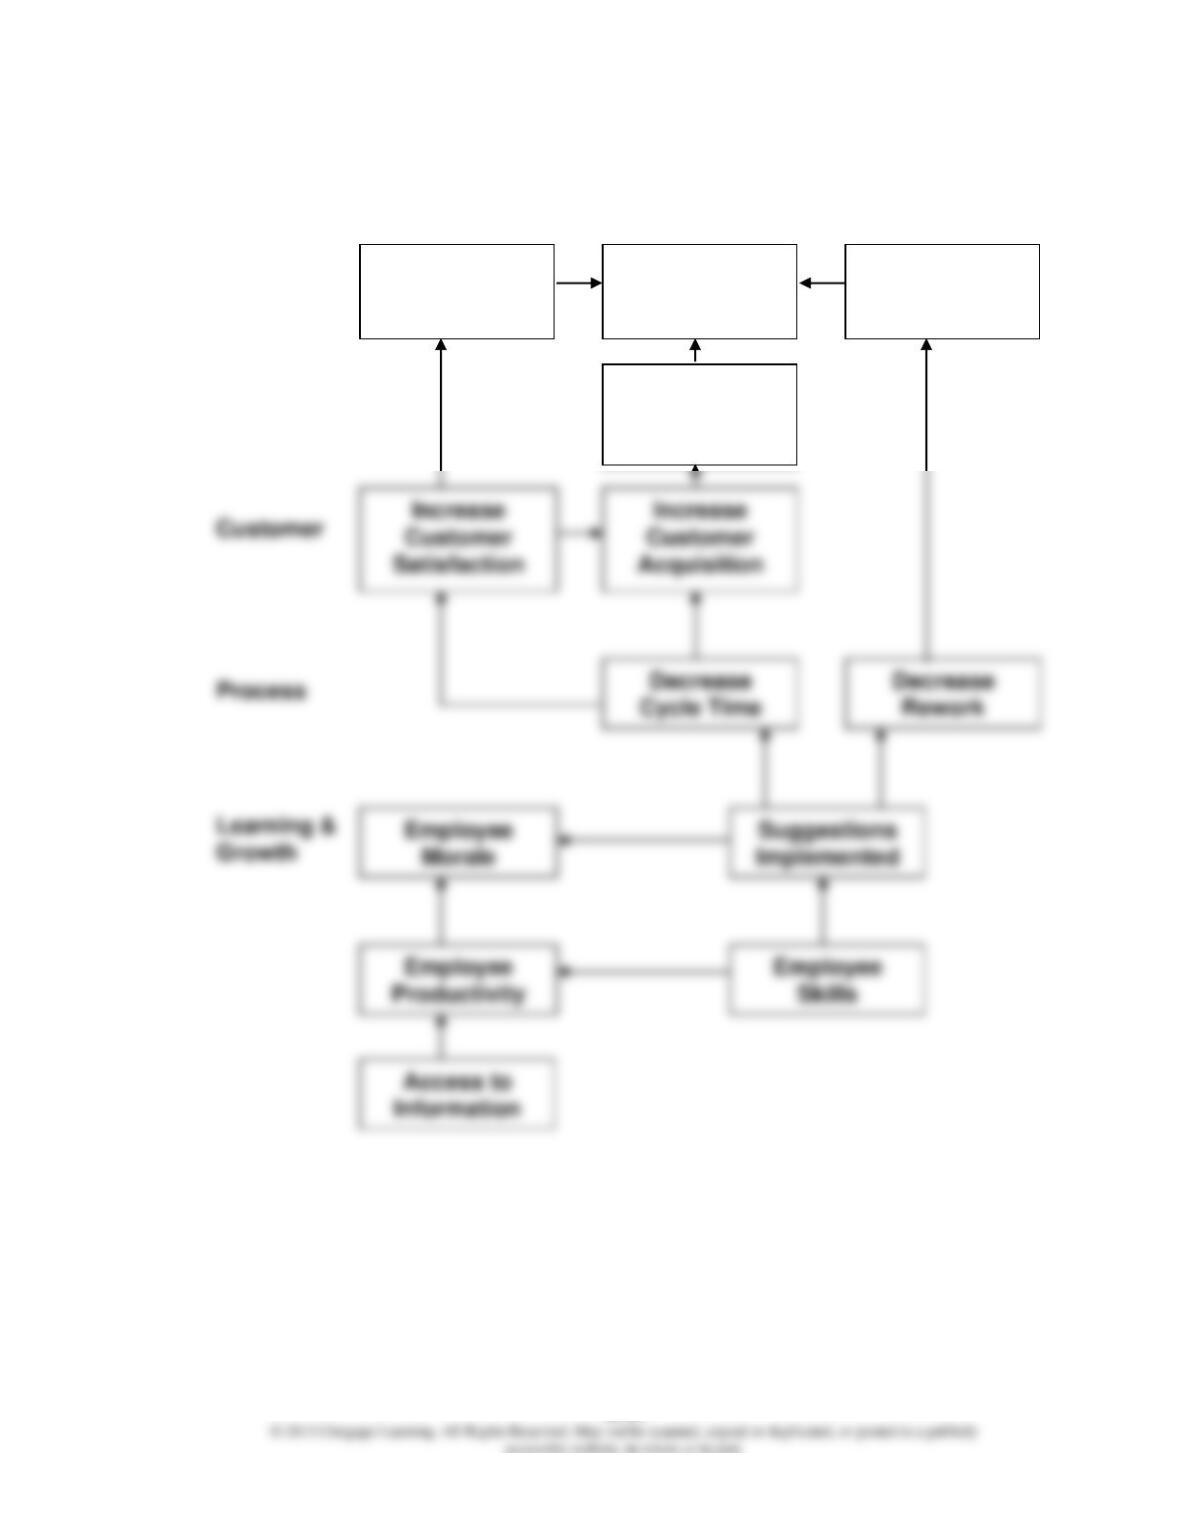
1. Strategic Objective Measure
Financial:
Increase revenue, new products Percentage of revenue from new
products
Decrease operating expenses Operating expenses
Increase ROI ROI
Decrease collection period, A/R Average collection period
Customer:
13–19
Problem 13.23 (Concluded)
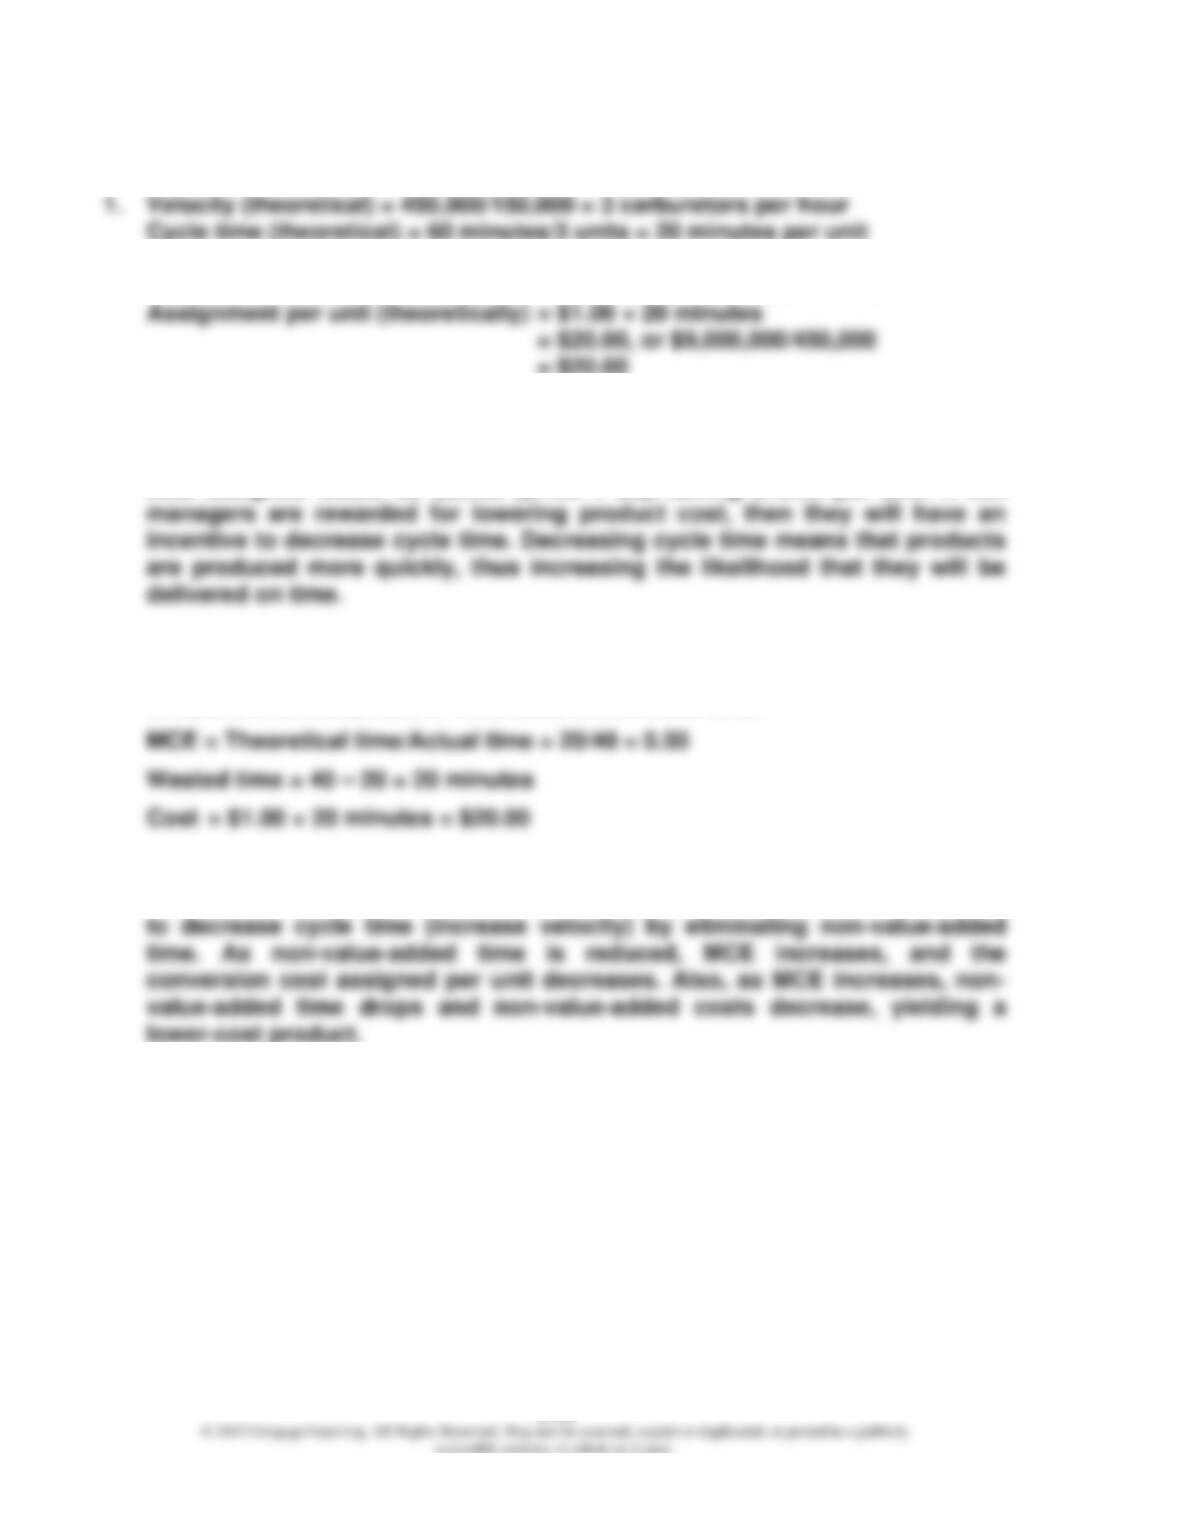
2. Strategy Map:
Financial
Decrease
Collection
Period
Increase
ROI
Decrease
Operating
Expenses
Increase
Revenue, New
Products
13–20
Problem 13.24
2. Conversion cost rate = $9,000,000/(150,000 × 60) = $1.00 per minute
3. Applied conversion cost = $1.00 × 40 minutes = $40.00
If the time is decreased from 40 minutes to 25 minutes, then the conversion
cost assigned would be $25.00 ($1.00 × 25), saving $15.00 per unit. If cell
4. MCE = Process time/(Process time + Move time + Inspection time + Waiting
time + Other time). In an ideal world, process time would equal theoretical
time, and therefore, MCE = Theoretical time/Actual time.
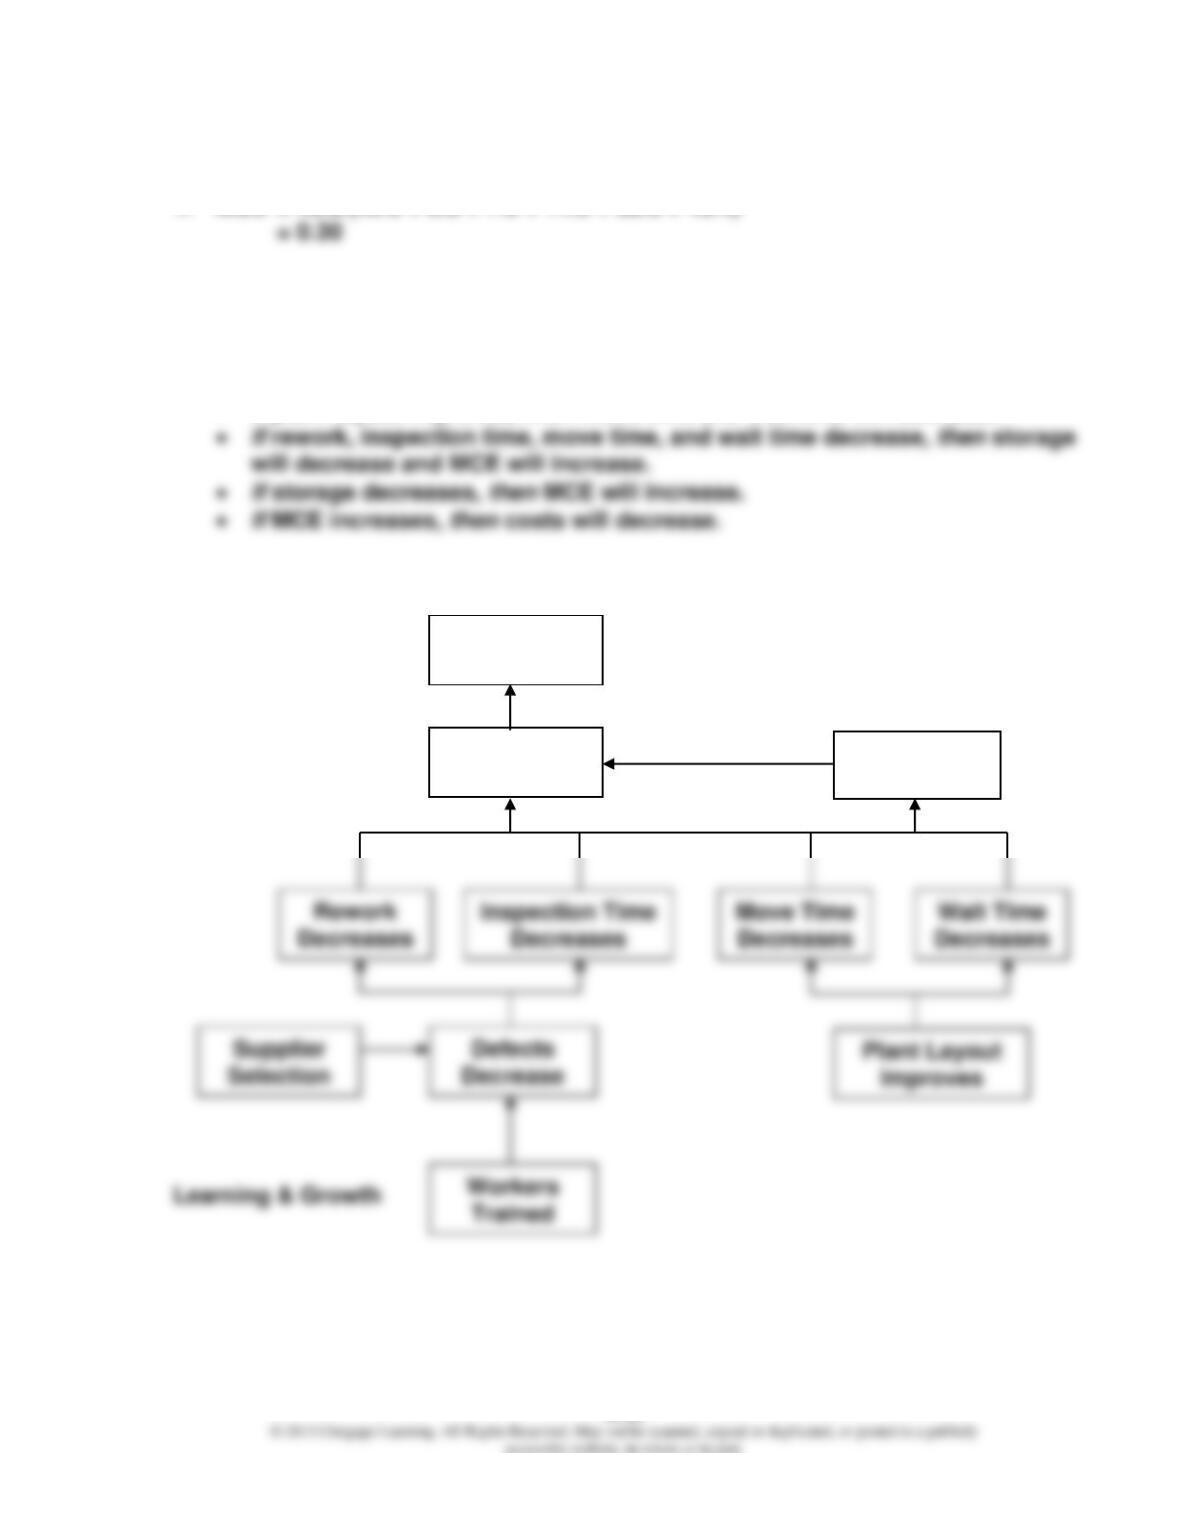
5. In the advanced manufacturing environment, firms need to compete on the
basis of time and cost. These measures support these objectives. The goal is
13–21
Problem 13.25
1. MCE = 42.0/(42.0 + 2.8 + 7.0 + 11.2 + 33.6 + 43.4)
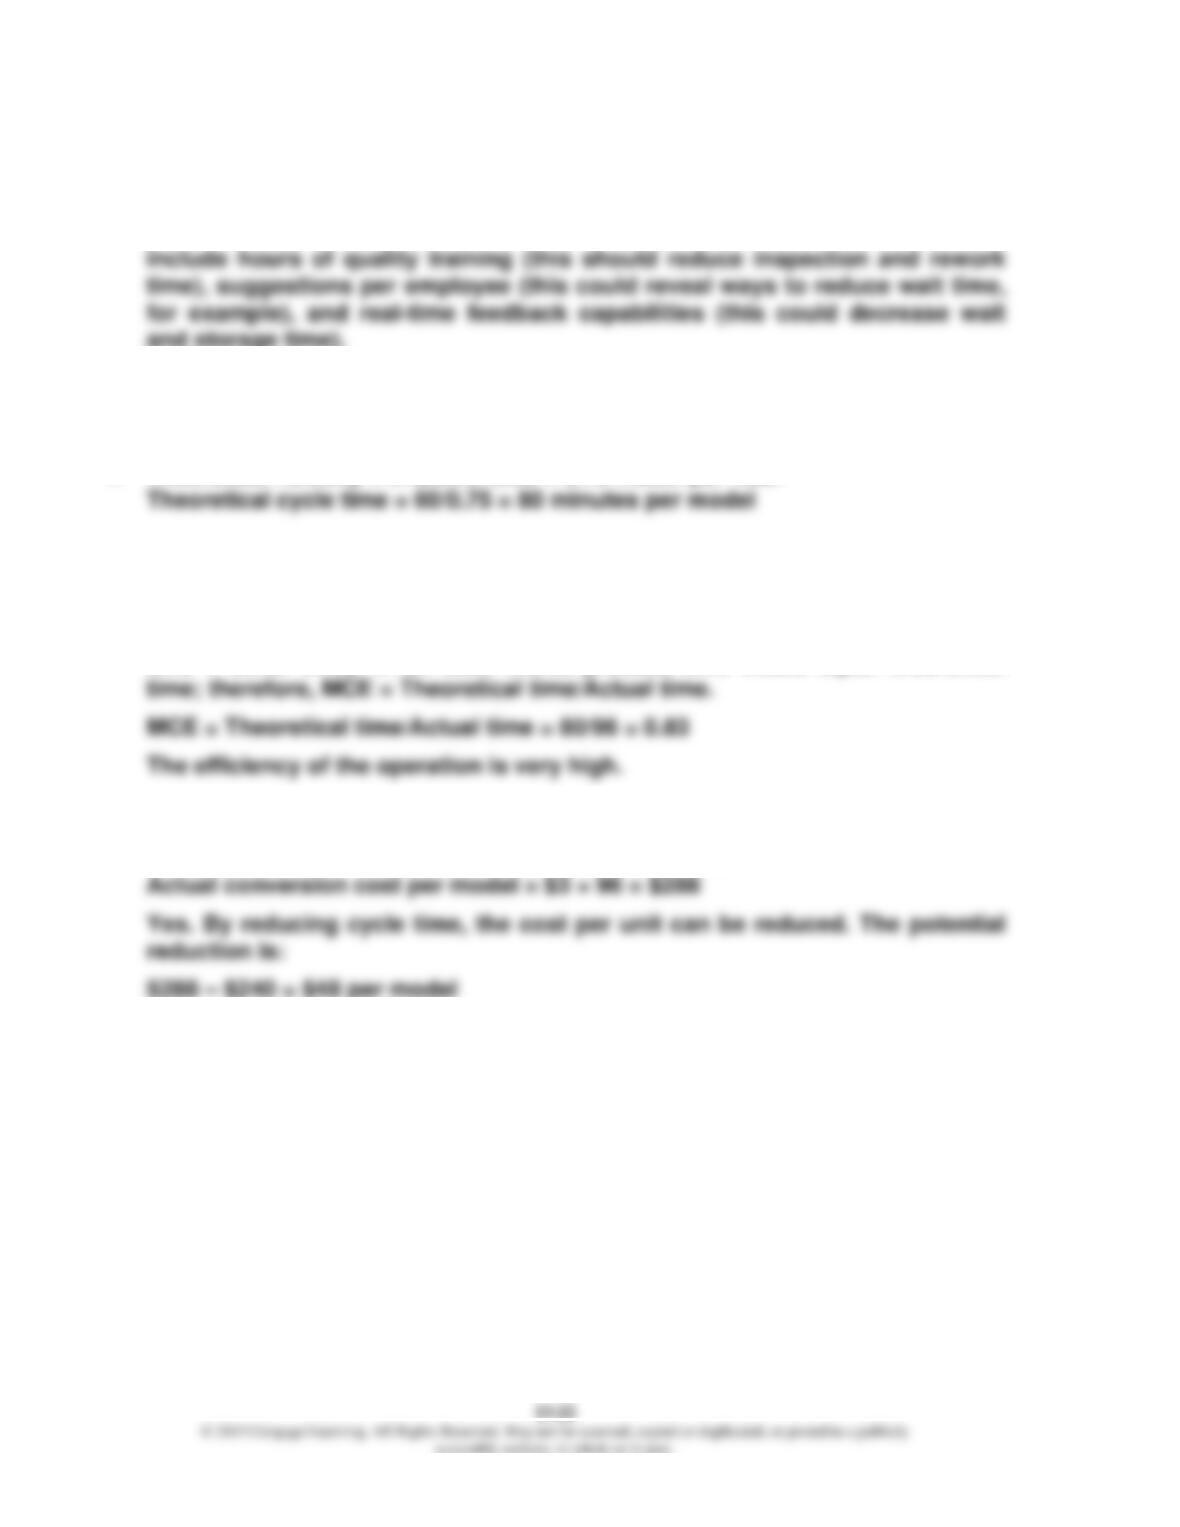
2. Strategy as a series of if-then statements:
• If workers are trained and better suppliers are selected, then defects will
decrease.
• If defects decrease, then rework and inspection time will decrease.
• If plant layout improves, then move time and wait time will decrease.
Strategy Map:
Financial
Process
Costs
Decrease
MCE
Increases
Storage
Decreases
Problem 13.25 (Concluded)
3. MCE is a lag measure. To reduce MCE, as indicated in Requirement 2, the
process must be improved. Performance drivers or lead measures would
Problem 13.26
1. Theoretical velocity = 27,900/37,200 = 0.75 model per hour
2. Actual velocity = 23,250/37,200 = 0.625 model per hour
Actual cycle time = 60/0.625 = 96 minutes per model
3. MCE = Process time/(Process time + Move time + Inspection time + Waiting
time + Other time). In an ideal world, process time would equal theoretical
4. Budgeted conversion cost = $6,696,000/(37,200 × 60) = $3 per minute
Theoretical conversion cost per model = $3 × 80 = $240
13–23
Problem 13.27
1. Strategic Objective Measure
Financial:
Increase profitability ROI
Increase new customers Percentage of revenue
and markets from new sources
Reduce unit cost Unit cost
Customer:
Increase customer acquisition New customers
Increase customer satisfaction Survey ratings
Increase market share Market share
13–24
Problem 13.27 (Continued)
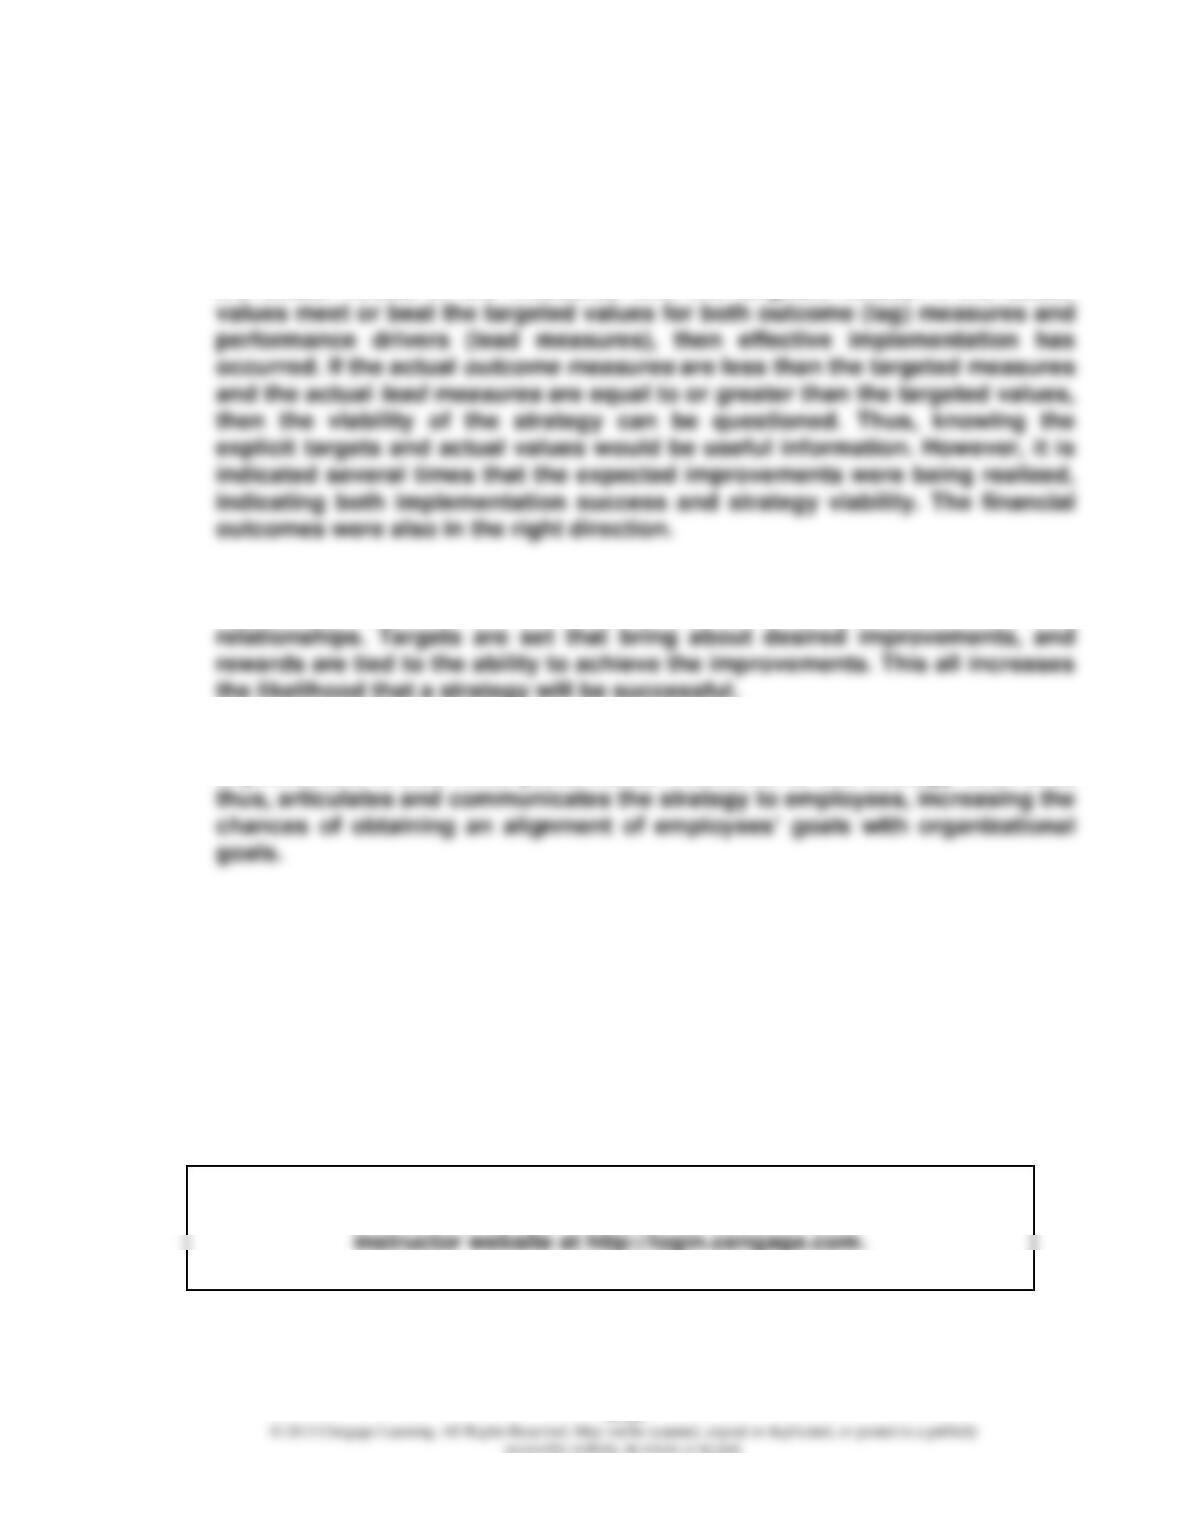
2. The if-then sequence strategy representation:
If employee capabilities are increased and if information systems capability is
improved, then employees will increase the number of suggested
improvements; if the number of improvements suggested increases, then the
number implemented will increase; if the number of suggestions implemented
increases and component quality improves, then process quality will
Strategy Map:
Financial
Process
Reduce
Costs
Profits
Increase
Revenues
Increase
Product
Quality
Increases
Product
Image
Improves
Process
Quality
Increases
Component
Quality
13–25
Problem 13.27 (Concluded)
3. Evaluation entails or should entail double-loop feedback. Double-loop
feedback requires information both on the implementation of the strategy and
the viability of the strategy. Implementation effectiveness involves comparing
the actual values of the measures with the targeted values. If the actual
4. The Balanced Scorecard converts the turnaround strategy into operational
objectives and measures. The objectives are linked by a series of causal
5. The Balanced Scorecard provides a means for directed continuous
improvement. It also links performance measures to the strategy itself and,
CYBER RESEARCH CASE
13.28
Answers will vary.
The Collaborative Learning Exercise Solutions can be found on the

13–26
The following problems can be assigned within CengageNOW and are auto-
graded. See the last page of each chapter for descriptions of these new assign-
ments.
• Integrative Exercise—Balanced Scorecard, Quality and Environment Costing,
Strategic Cost Management (Covers chapters 11, 13, and 14)