Wild and Shaw Financial and Managerial Accounting 9e Solutions Manual: Chapter 13
859
Problem 13-2A (60 minutes)
Part 1
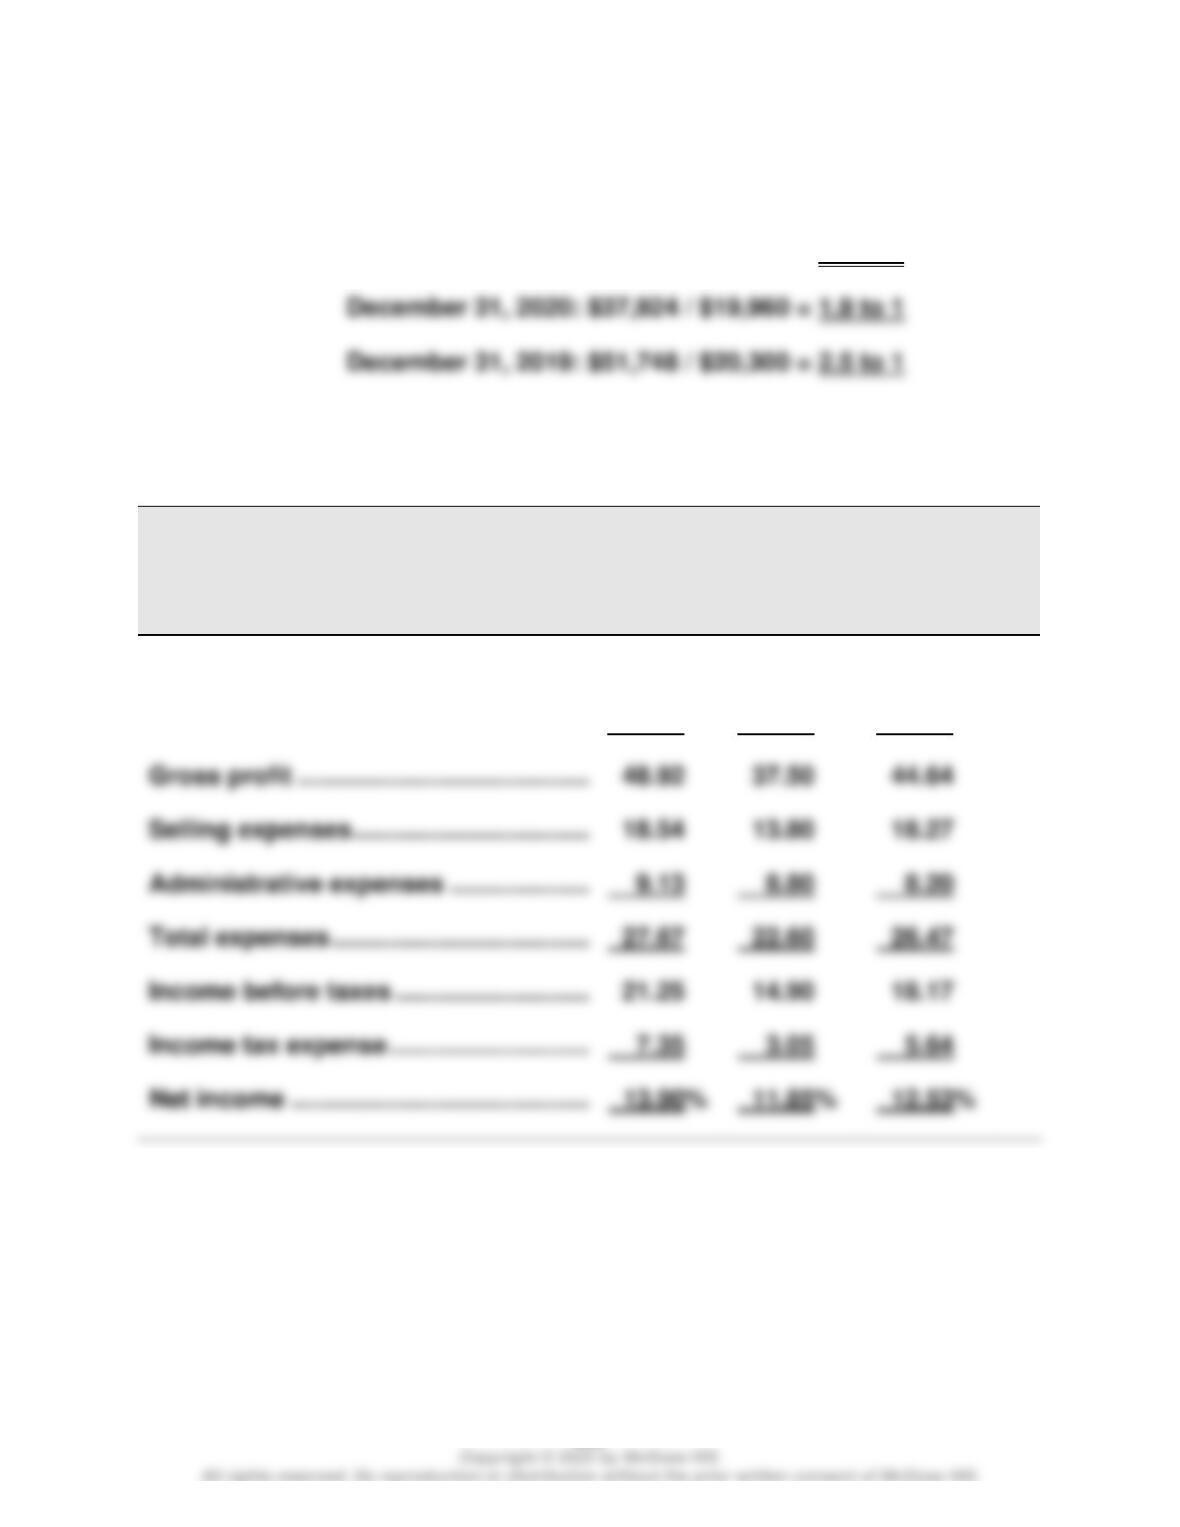
Current ratio: December 31, 2021: $52,390 / $22,800 = 2.3 to 1
Part 2
KORBIN COMPANY
Common-Size Comparative Income Statements
For Years Ended December 31
2021
2020
2019
Sales ……………………………………………………
100.00%
100.00%
100.00%
Cost of goods sold …………………………..
51.08
62.50
55.36
27.67
22.60
26.47
7.35
3.05
5.64
Wild and Shaw Financial and Managerial Accounting 9e Solutions Manual: Chapter 13
860
Problem 13-2A (Concluded)
Part 3
KORBIN COMPANY
Balance Sheet Data in Trend Percents
At December 31
2021
2020
2019
Assets
Current assets …………………………….
101.24%
73.29%
100.00%
Long-term investments ……………….
0.00
12.66
100.00
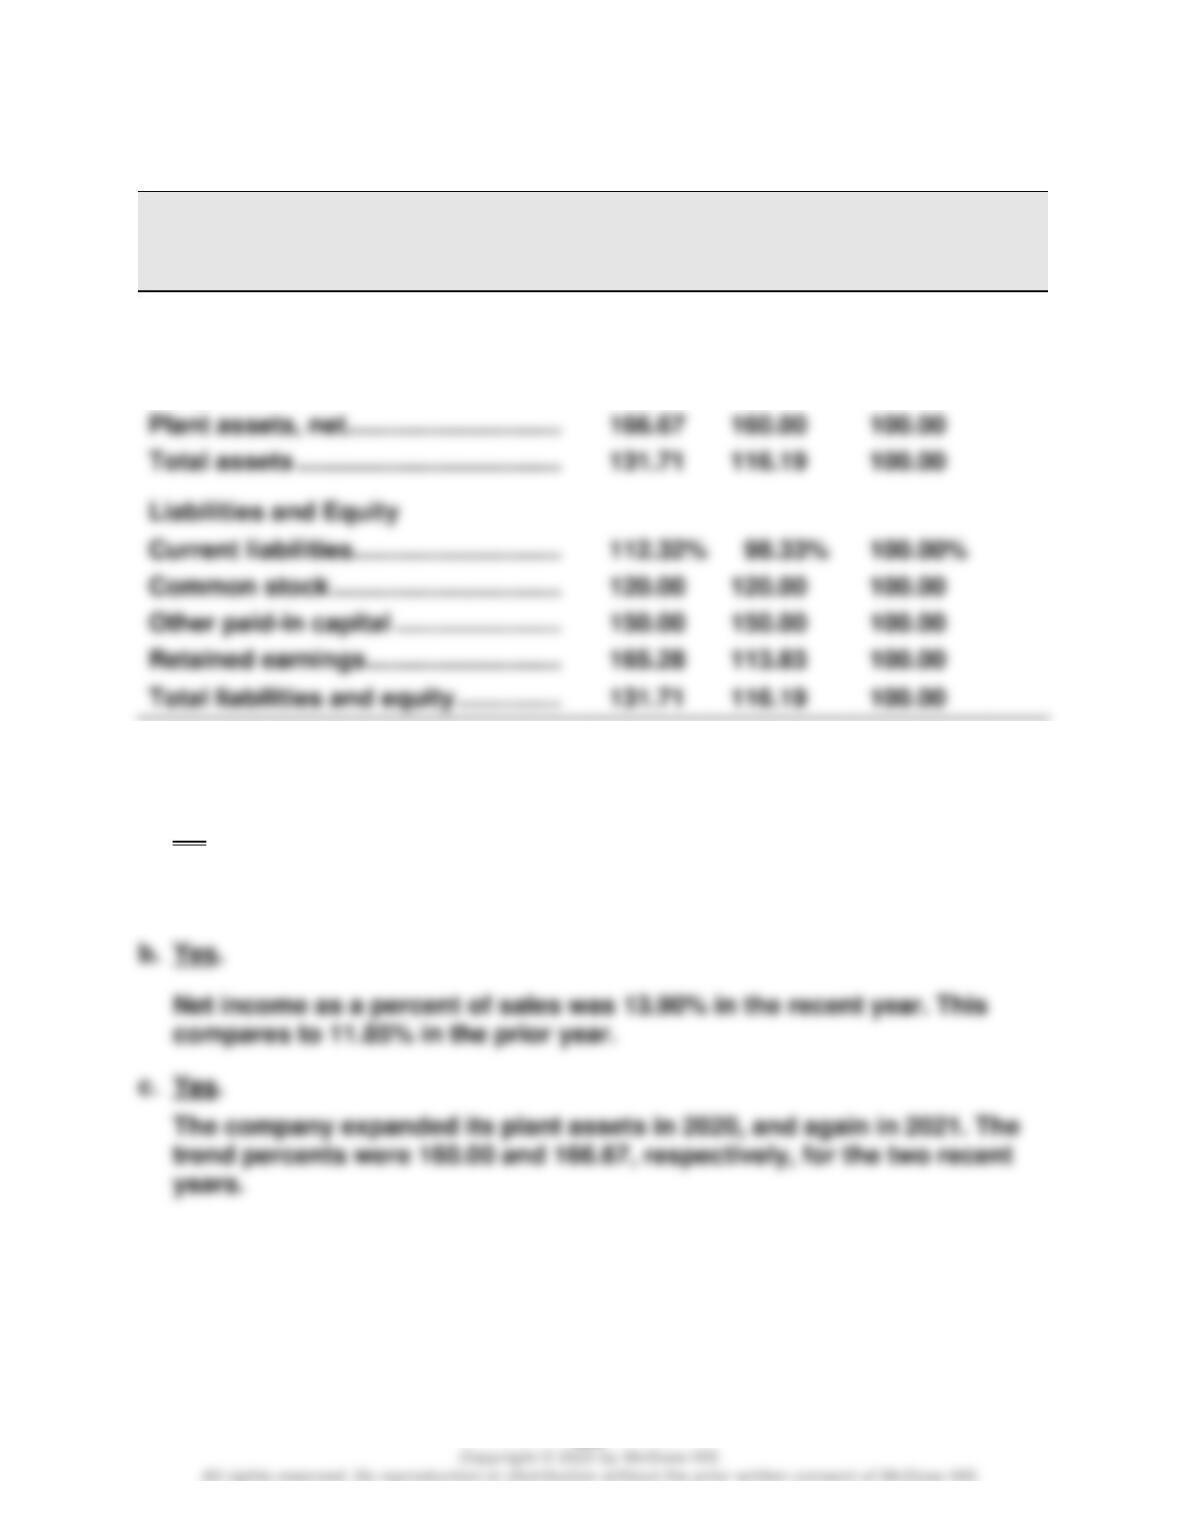
166.67
160.00
100.00
Current liabilities…………………………
112.32%
98.33%
100.00%
120.00
120.00
100.00
150.00
150.00
100.00
165.28
113.83
100.00
Part 4
a. No.
Cost of goods sold as a percent of sales was 51.08% in 2021. This
compares to 62.50% in the prior year.
Wild and Shaw Financial and Managerial Accounting 9e Solutions Manual: Chapter 13
Problem 13-3A (60 minutes)
Trans-
action
Current
Assets
Quick
Assets
Current
Liabilities
Current
Ratio
Acid-Test
Ratio
Working
Capital
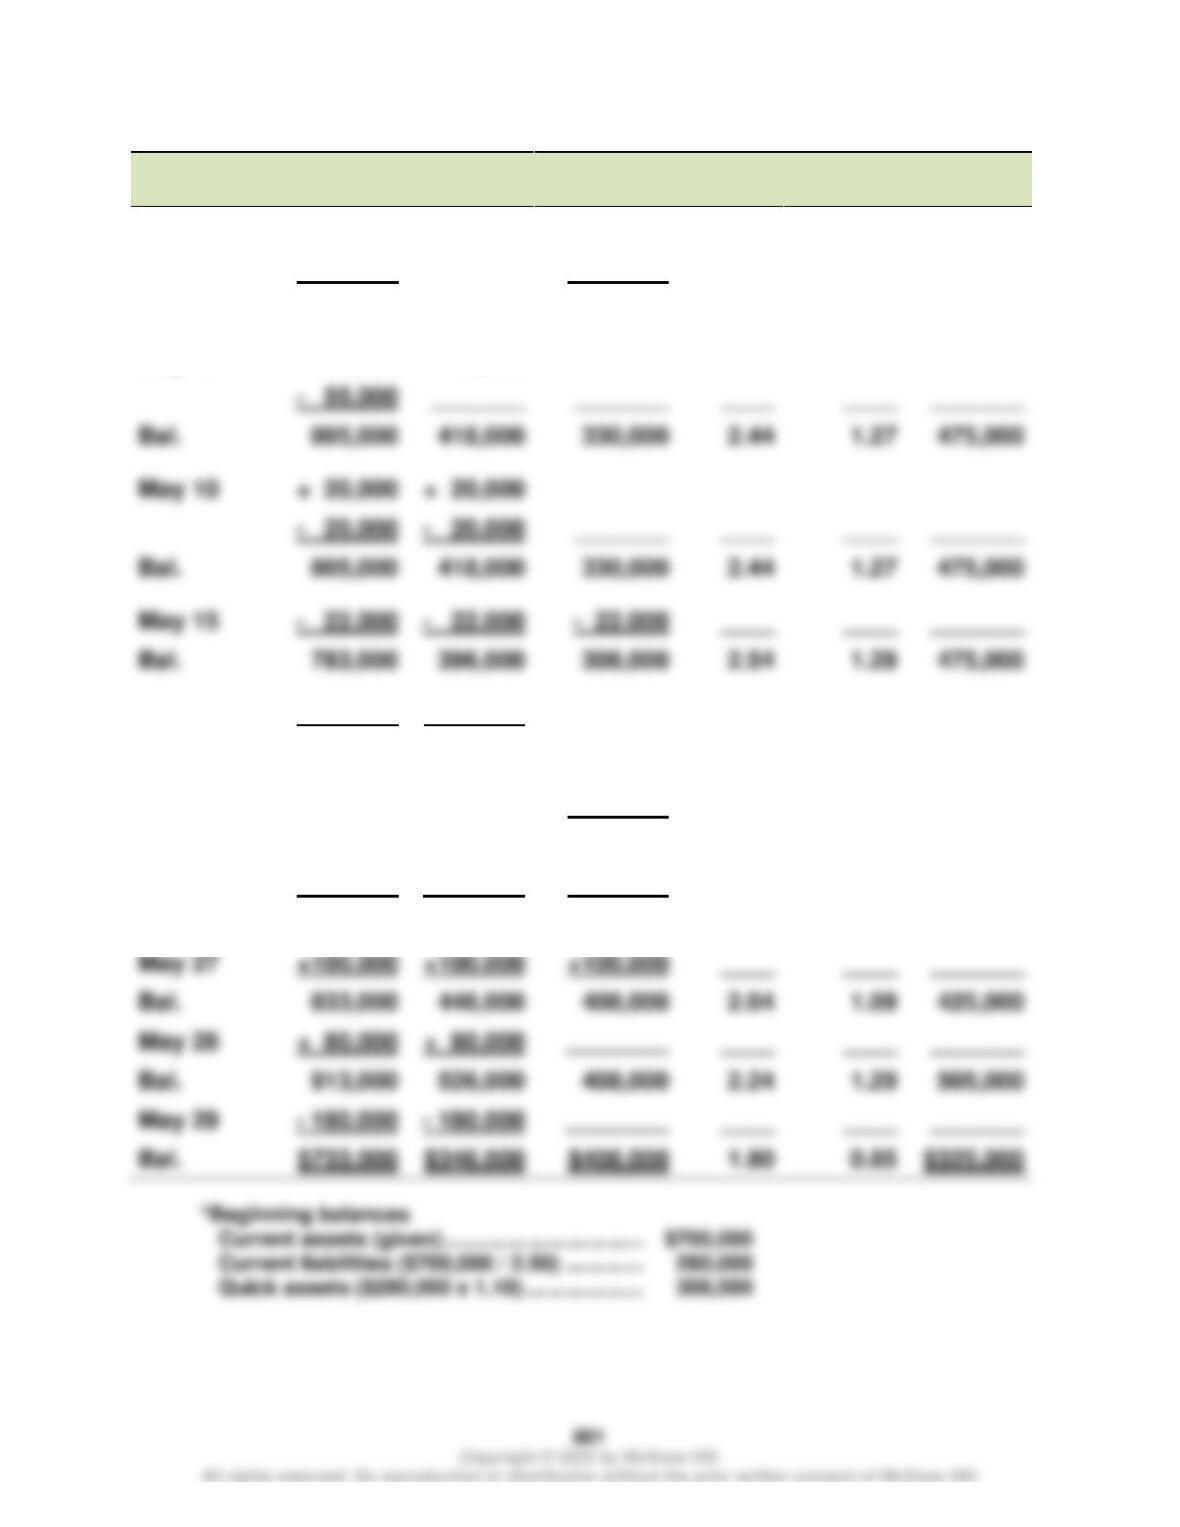
Beginning*
$700,000
$308,000
$280,000
2.50
1.10
$420,000
May 2
+ 50,000
_______
+ 50,000
____
____
_______
Bal.
750,000
308,000
330,000
2.27
0.93
420,000
May 8
+110,000
+110,000
– 55,000
_______
_______
____
____
_______
Bal.
805,000
418,000
330,000
2.44
1.27
475,000
May 10
+ 20,000
+ 20,000
– 20,000
– 20,000
_______
____
____
_______
Bal.
805,000
418,000
330,000
2.44
1.27
475,000
May 15
– 22,000
– 22,000
____
____
_______
May 17
+0
+0
_______
____
____
_______
Bal.
783,000
396,000
308,000
2.54
1.29
475,000
May 22
_______
_______
+ 50,000
____
____
_______
Bal.
783,000
396,000
358,000
2.19
1.11
425,000
May 26
– 50,000
– 50,000
– 50,000
____
____
_______
Bal.
733,000
346,000
308,000
2.38
1.12
425,000
May 27
+100,000
+100,000
____
____
_______
Bal.
833,000
446,000
408,000
2.04
1.09
425,000
May 28
+ 80,000
____
____
_______
Bal.
913,000
526,000
408,000
2.24
1.29
505,000
May 29
____
____
_______
Bal.
$733,000
$408,000
Wild and Shaw Financial and Managerial Accounting 9e Solutions Manual: Chapter 13
862
Problem 13-4A (50 minutes)
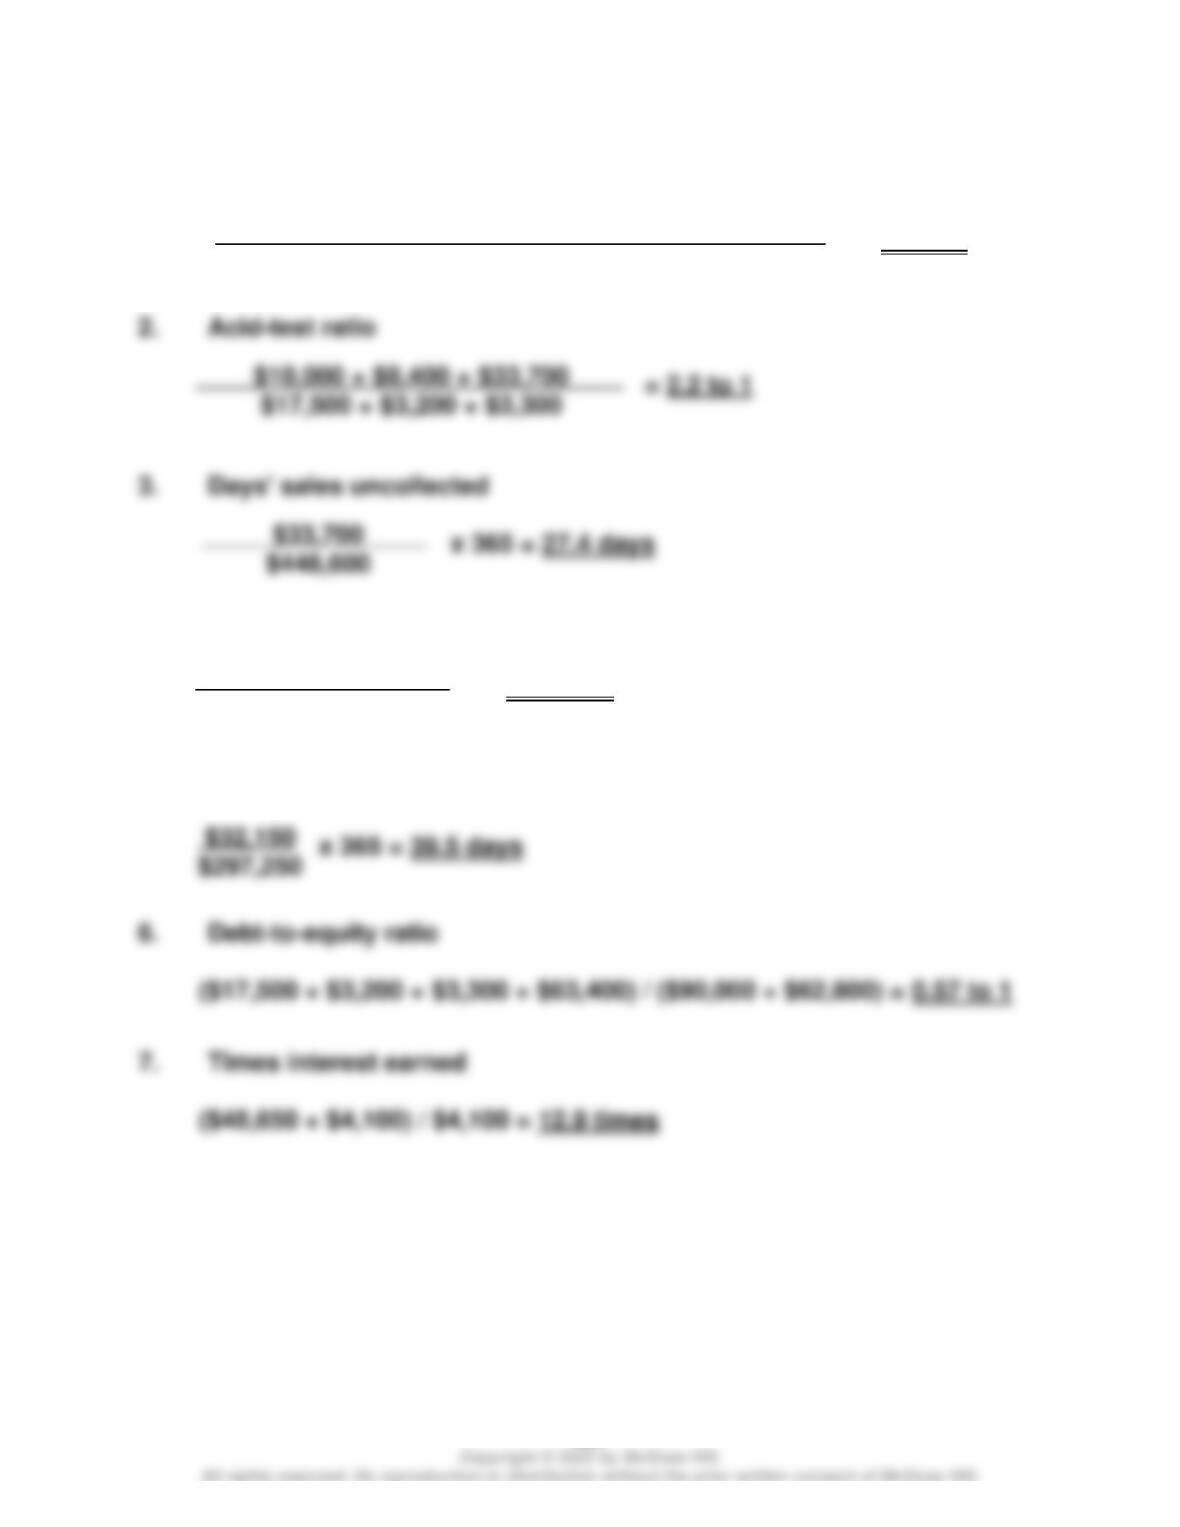
1. Current ratio
= 3.6 to 1
4. Inventory turnover
= 7.3 times
5. Days’ sales in inventory
$10,000 + 8,400 + $33,700 + $32,150 + $2,650
$17,500 + $3,200 + $3,300
$297,250
($48,900 + $32,150)/2
Wild and Shaw Financial and Managerial Accounting 9e Solutions Manual: Chapter 13
863
Problem 13-4A (Concluded)
8. Profit margin ratio
= 6.5%
10. Return on total assets
= 13.5%
$29,052
($240,200 + $189,400)/2
$29,052
$448,600
Wild and Shaw Financial and Managerial Accounting 9e Solutions Manual: Chapter 13
864
Problem 13-5A (60 minutes)
Part 1
Barco Company
Kyan Company
a. Current ratio
= 2.5 to 1
= 2.6 to 1
= 1.1 to 1
= 1.1 to 1
c. Accounts receivable turnover
= 20.2 times = 14.8 times
d. Inventory turnover
f. Days’ sales uncollected
x 365 = 22.0 days x 365 = 26.8 days
Short-term credit risk analysis: Barco and Kyan have essentially equal
$770,000
($46,500 + $29,800)/2
$46,500
$770,000
$880,200
($64,600 + $54,200)/2
$155,440*
$61,340
$64,600
$880,200
$238,050**
$93,300
865
Problem 13–5A (Concluded)
Part 2
Barco Company
Kyan Company
a. Profit margin ratio
= 21.1% = 23.9%
c. Return on total assets
= 38.5% = 45.5%
f. Dividend yield
= 5.1% = 5.2%
Investment analysis: Kyan‘s profit margin ratio, total asset turnover, return on
total assets, and return on equity are all higher than Barco’s. Although the
$162,200
$770,000
$162,200
($445,440 + $398,000)/2
$3.81
$75
$210,400
$880,200
$210,400
($542,450 + $382,500)/2
$3.93
$75
Wild and Shaw Financial and Managerial Accounting 9e Solutions Manual: Chapter 13
866
Problem 13–6AA (60 minutes)
Part 1
Effect of income taxes (debits or losses in parentheses)
Pretax
30% Tax
Effect
After–Tax
i. Loss from operating a discontinued segment …………..
(18,250)
(5,475)
(12,775)
(16,000)
(4,800)
Part 2 Income from continuing operations (and its components)
k.
Net sales …………………………..…………………………….
$ 998,000
a.
Interest revenue ………………………………………………
14,000
Depreciation expense—Equipment ………………….
e.
Other operating expenses ……………………………….
c.
Income tax expense (30%) …………………………..…..
g.
Gain from settling lawsuit ………………………………..
44,000
Wild and Shaw Financial and Managerial Accounting 9e Solutions Manual: Chapter 13
867
Problem 13–6AA (Concluded)
Part 3 Income from discontinued segment
i.
Loss from operating a discontinued
segment (after-tax) …………………………..…………………………..
$ (12,775)
assets (after-tax) ……………………………………………………….
Part 4 Net income
Income from continuing operations after taxes …………………………..
$246,400
Income from discontinued segment ………………………………………………….
Wild and Shaw Financial and Managerial Accounting 9e Solutions Manual: Chapter 13
PROBLEM SET B
Problem 13-1B (120 minutes)
Part 1
TRIPOLY COMPANY
Income Statement Trends
For Years Ended December 31
2021
2020
2019
2018
2017
2016
2015
Sales …………………………..…..
65.1%
70.9%
73.3%
79.1%
86.0%
89.5%
100.0%
Cost of goods sold …………..
72.6
76.3
77.4
82.6
89.5
92.1
100.0
Gross profit ……………………..
59.2
66.7
70.0
76.3
83.3
87.5
100.0
Operating expenses …………
56.0
69.3
74.7
84.0
93.3
96.0
100.0
TRIPOLY COMPANY
Balance Sheet Trends
At December 31
2021
2020
2019
2018
2017
2016
2015
Cash ………………………………
64.7%
67.6%
76.5%
79.4%
88.2%
91.2%
100.0%
Accounts recble., net ……….
81.3
85.0
87.5
90.0
93.8
96.3
100.0
Merchandise inventory ……..
79.8
82.7
85.6
86.5
89.4
91.3
100.0
Other current assets …………
85.0
85.0
90.0
95.0
95.0
100.0
32.7
27.3
23.6
100.0
Plant assets, net ………………
112.3
90.7
92.5
94.3
100.0
Total assets ……………………..
88.5
89.6
91.5
90.2
92.7
94.6
100.0
Current liabilities ……………..
52.9
55.7
66.4
67.9
75.0
92.9
100.0
Common stock …………………
100.0
100.0
Other paid-in capital …………
100.0
100.0
Retained earnings…………….
166.7
100.0
Wild and Shaw Financial and Managerial Accounting 9e Solutions Manual: Chapter 13
869
Problem 13-1B (Concluded)
Part 2
Analysis and Interpretation
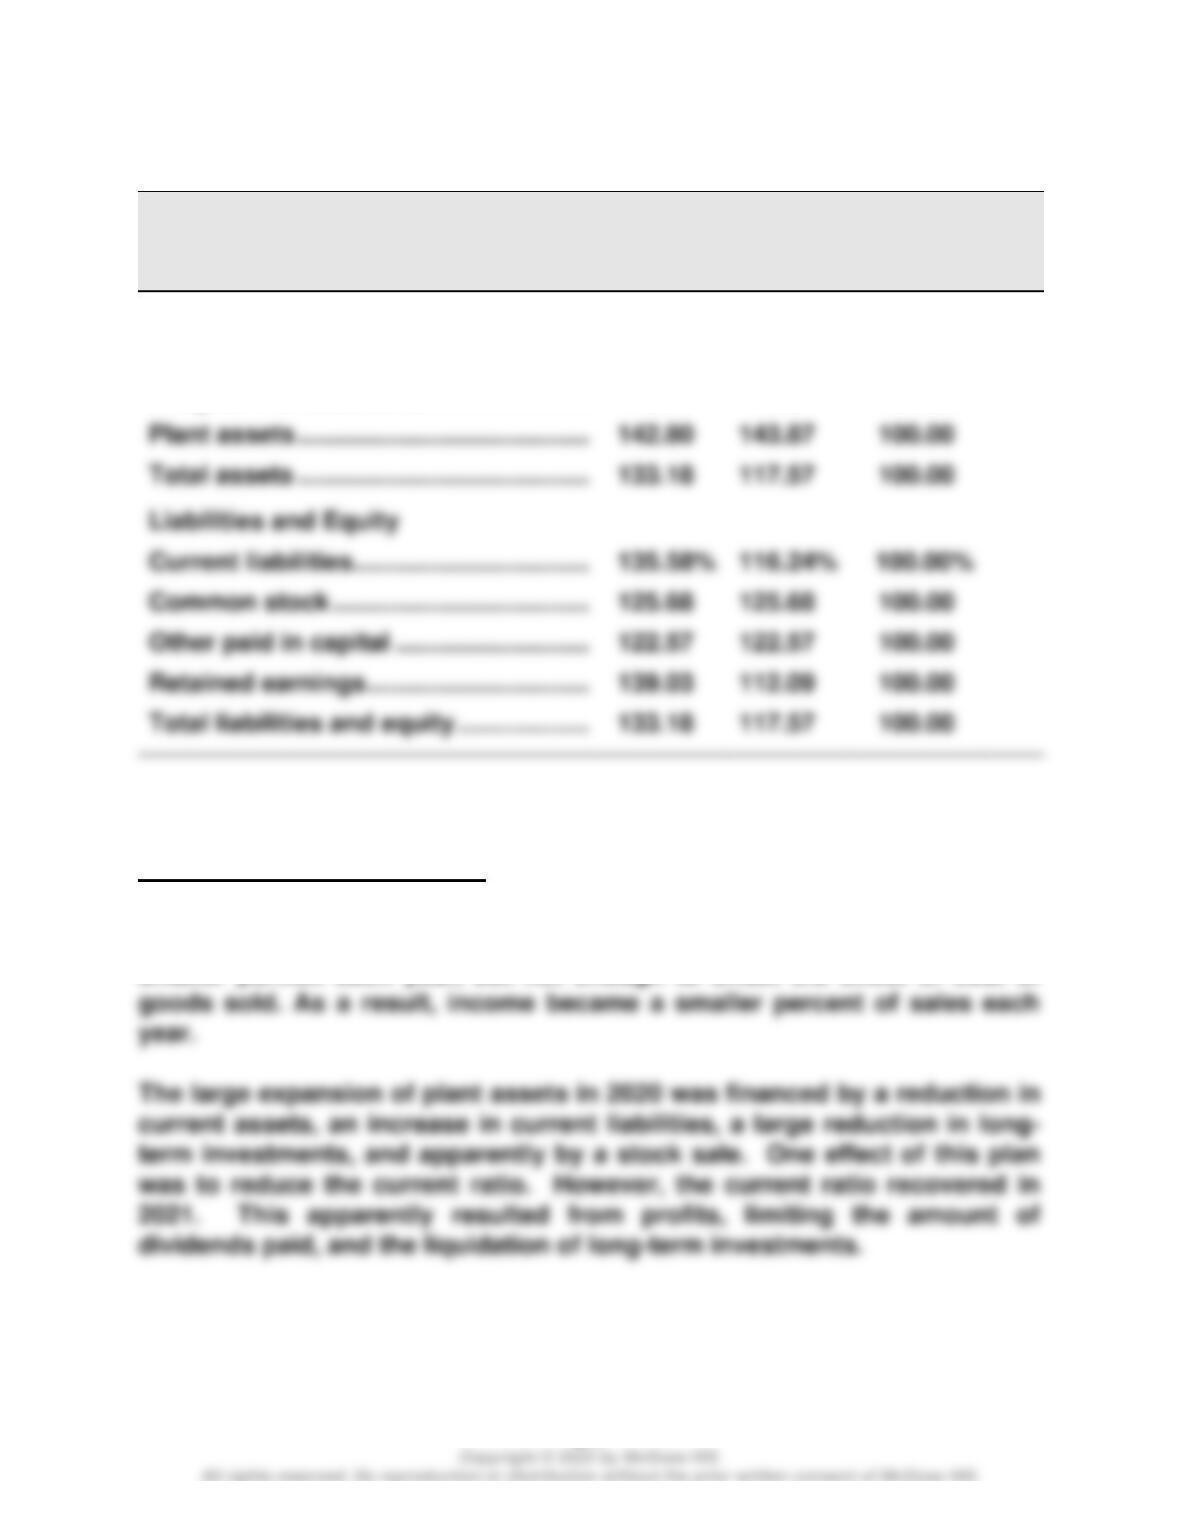
• The statements and the trend percent data show that sales declined
every year. However, cost of goods sold did not fall as rapidly as sales.
As a result, gross profit fell more rapidly than sales.
Wild and Shaw Financial and Managerial Accounting 9e Solutions Manual: Chapter 13
870
Problem 13-2B (60 minutes)
Part 1
Current ratio: December 31, 2021: $54,860 / $22,370 = 2.5 to 1
Part 2
BLUEGRASS CORPORATION
Common-Size Comparative Income Statements
For Years Ended December 31
2021
2020
2019
Sales ……………………………………………………
100.00%
100.00%
100.00%
Cost of goods sold …………………………..
54.77
51.91
46.04
19.84
20.72
23.44
3.04
3.56
3.69
Wild and Shaw Financial and Managerial Accounting 9e Solutions Manual: Chapter 13
871
Problem 13-2B (Concluded)
Part 3
BLUEGRASS CORPORATION
Balance Sheet Data in Trend Percents
At December 31
2021
2020
2019
Assets
Current assets ……………………………………..
151.13%
89.97%
100.00%
Long-term investments ………………………..
0.00
16.04
100.00
133.18
100.00
139.03
100.00
Part 4
Significant relations revealed
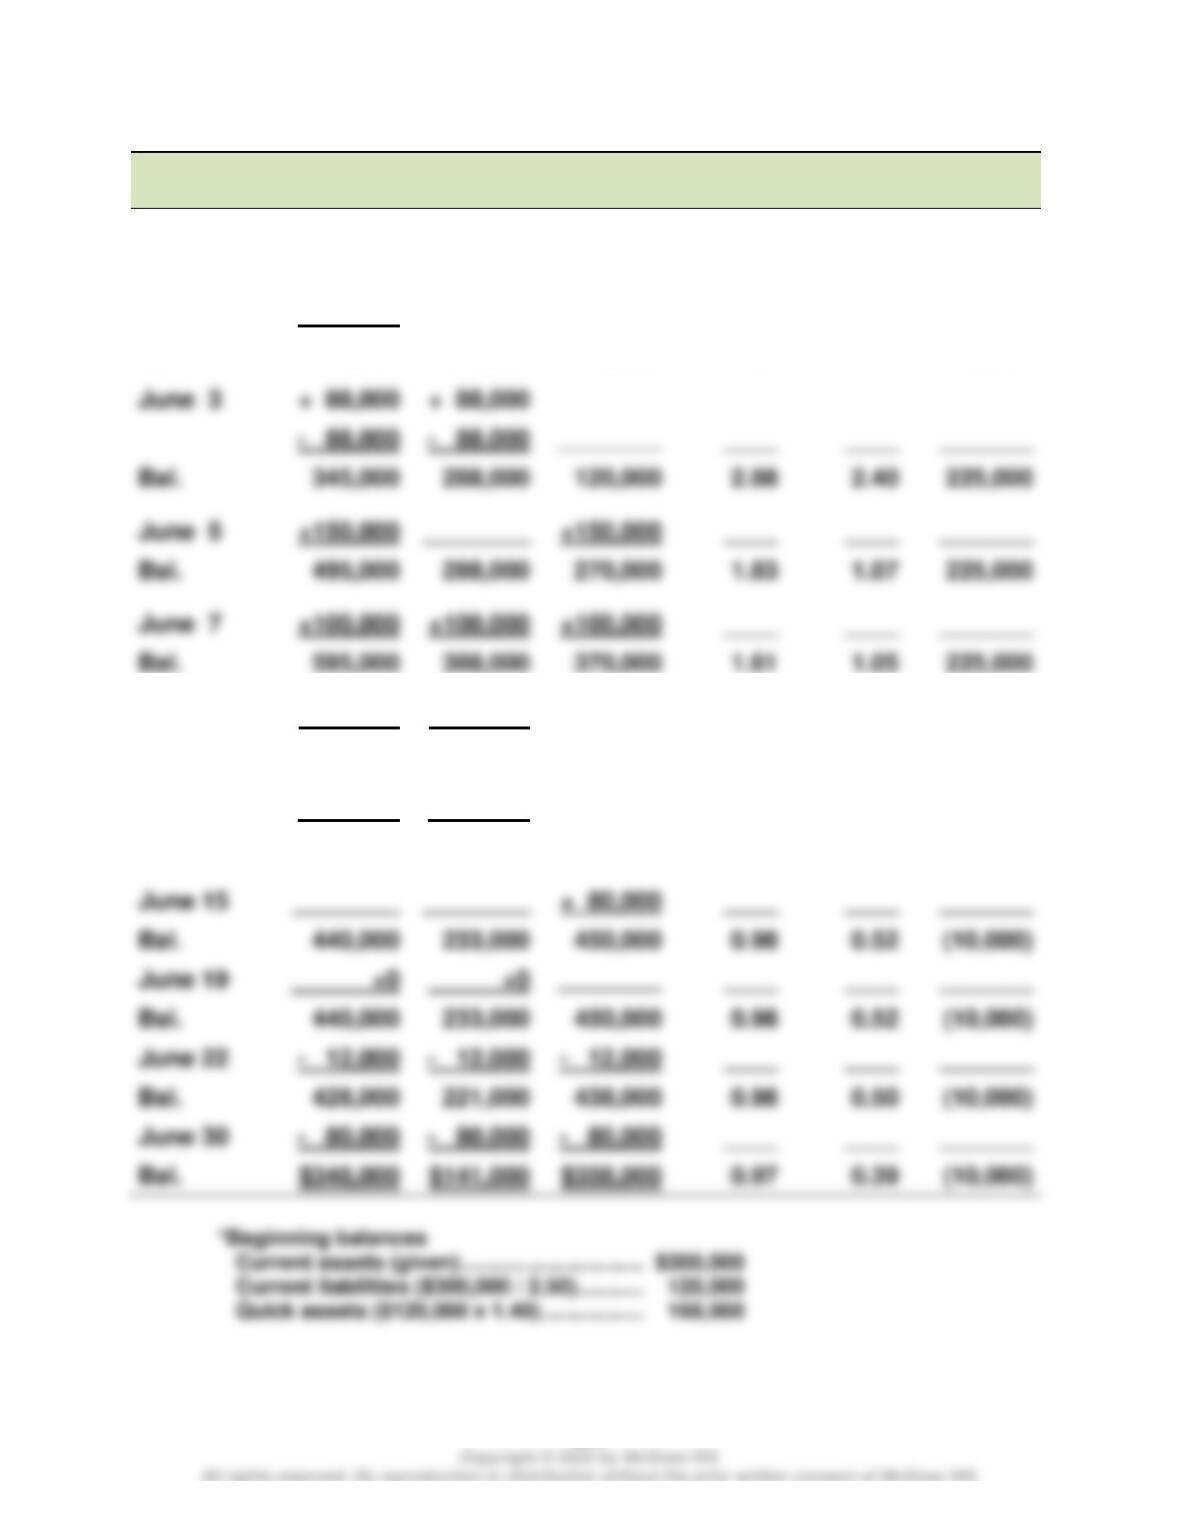
Bluegrass’s cost of goods sold took a larger percent of sales each year.
Selling and administrative expenses and income taxes took a somewhat
smaller portion each year, but not enough to offset the effect of cost of
Wild and Shaw Financial and Managerial Accounting 9e Solutions Manual: Chapter 13
872
Problem 13-3B (60 minutes)
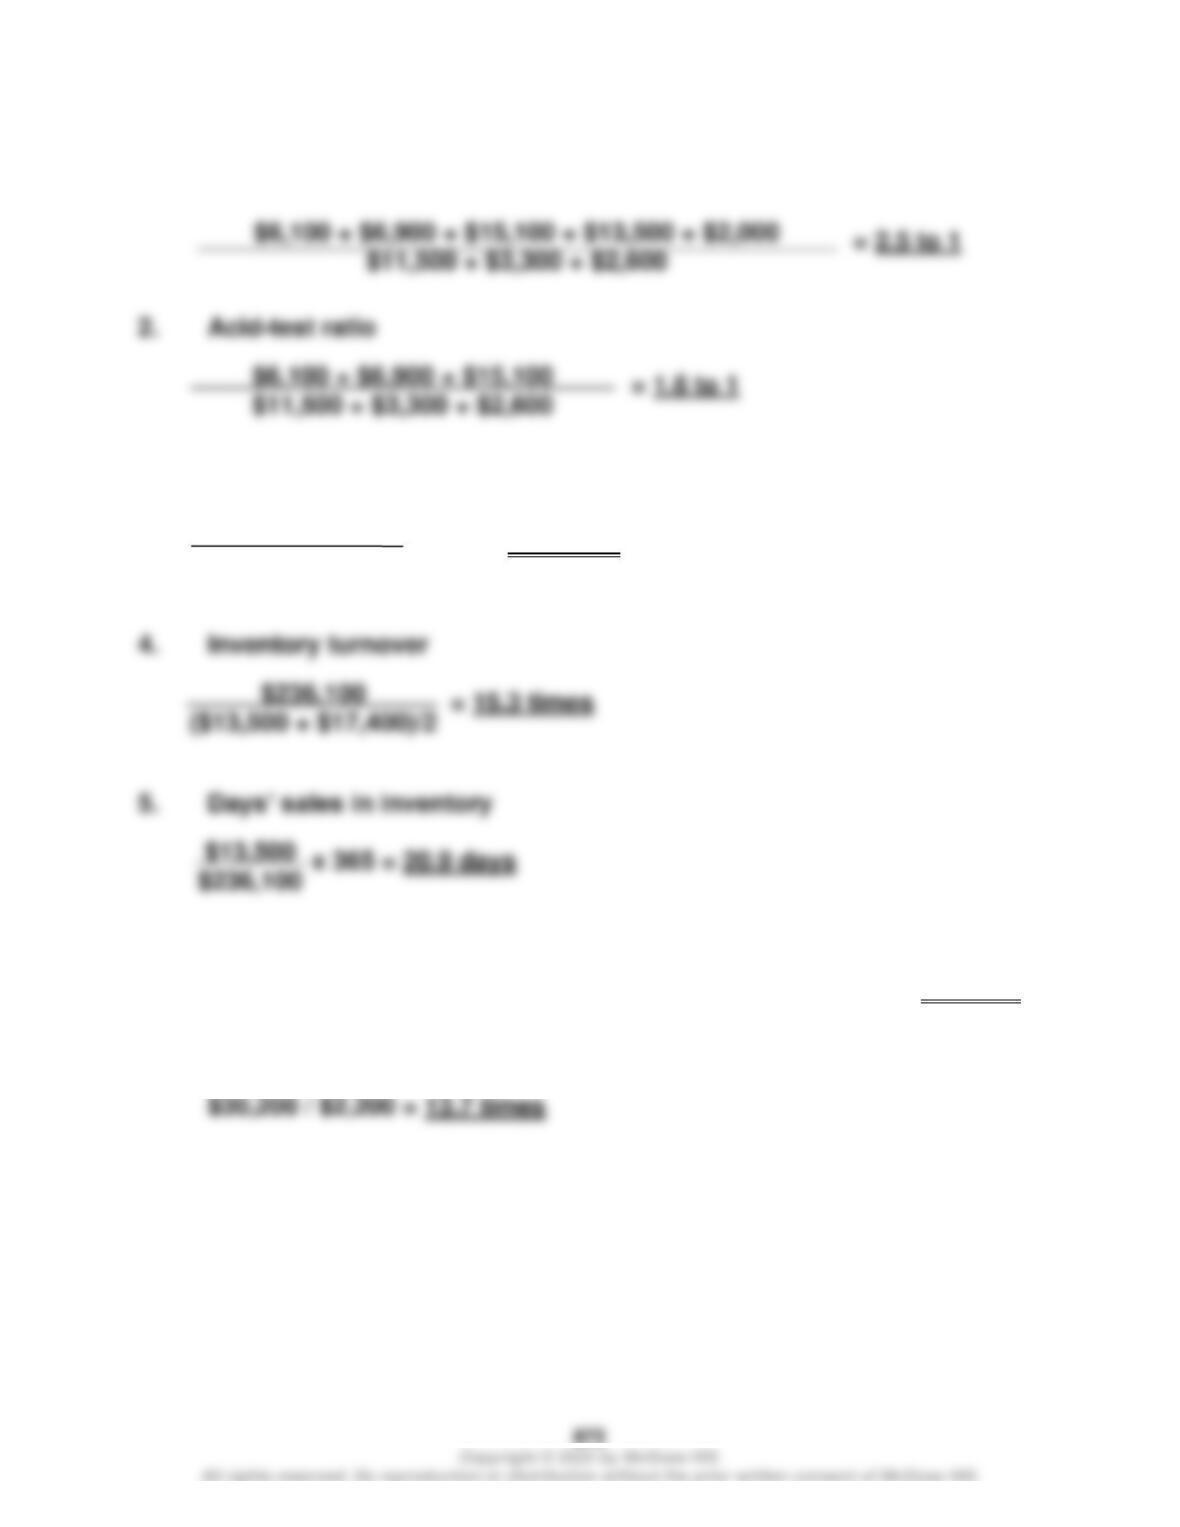
Trans-
action
Current
Assets
Quick
Assets
Current
Liabilities
Current
Ratio
Acid-Test
Ratio
Working
Capital
Beginning*
$300,000
$168,000
$120,000
2.50
1.40
$180,000
June 1
+120,000
+120,000
– 75,000
_______
________
____
____
_______
Bal.
345,000
288,000
120,000
2.88
2.40
225,000
June 3
– 88,000
– 88,000
________
____
____
_______
Bal.
345,000
288,000
120,000
2.88
2.40
June 5
+150,000
____
____
_______
Bal.
495,000
288,000
270,000
1.83
1.07
225,000
June 7
+100,000
+100,000
____
____
_______
Bal.
595,000
388,000
370,000
1.61
1.05
June 10
+120,000
+120,000
_______
____
____
_______
Bal.
715,000
508,000
370,000
1.93
1.37
345,000
June 12
– 275,000
– 275,000
________
____
____
_______
Bal.
440,000
233,000
370,000
1.19
0.63
70,000
June 15
____
____
_______
Bal.
0.98
0.52
June 19
________
____
____
_______
Bal.
June 22
– 12,000
– 12,000
____
____
_______
Bal.
0.98
0.50
June 30
– 80,000
– 80,000
____
____
_______
Bal.
$348,000
$141,000
$358,000
0.97
0.39
Wild and Shaw Financial and Managerial Accounting 9e Solutions Manual: Chapter 13
Problem 13-4B (50 minutes)
1. Current ratio
3. Days’ sales uncollected
x 365 = 17.5 days
6. Debt–to-equity ratio
($11,500 + $3,300 + $2,600 + $30,000) / ($35,000 + $35,100) = 0.68 to 1
7. Times interest earned
$15,100
$315,500