368 Chapter 12
Trendlines have been added to the graph to illustrate the steeper slope
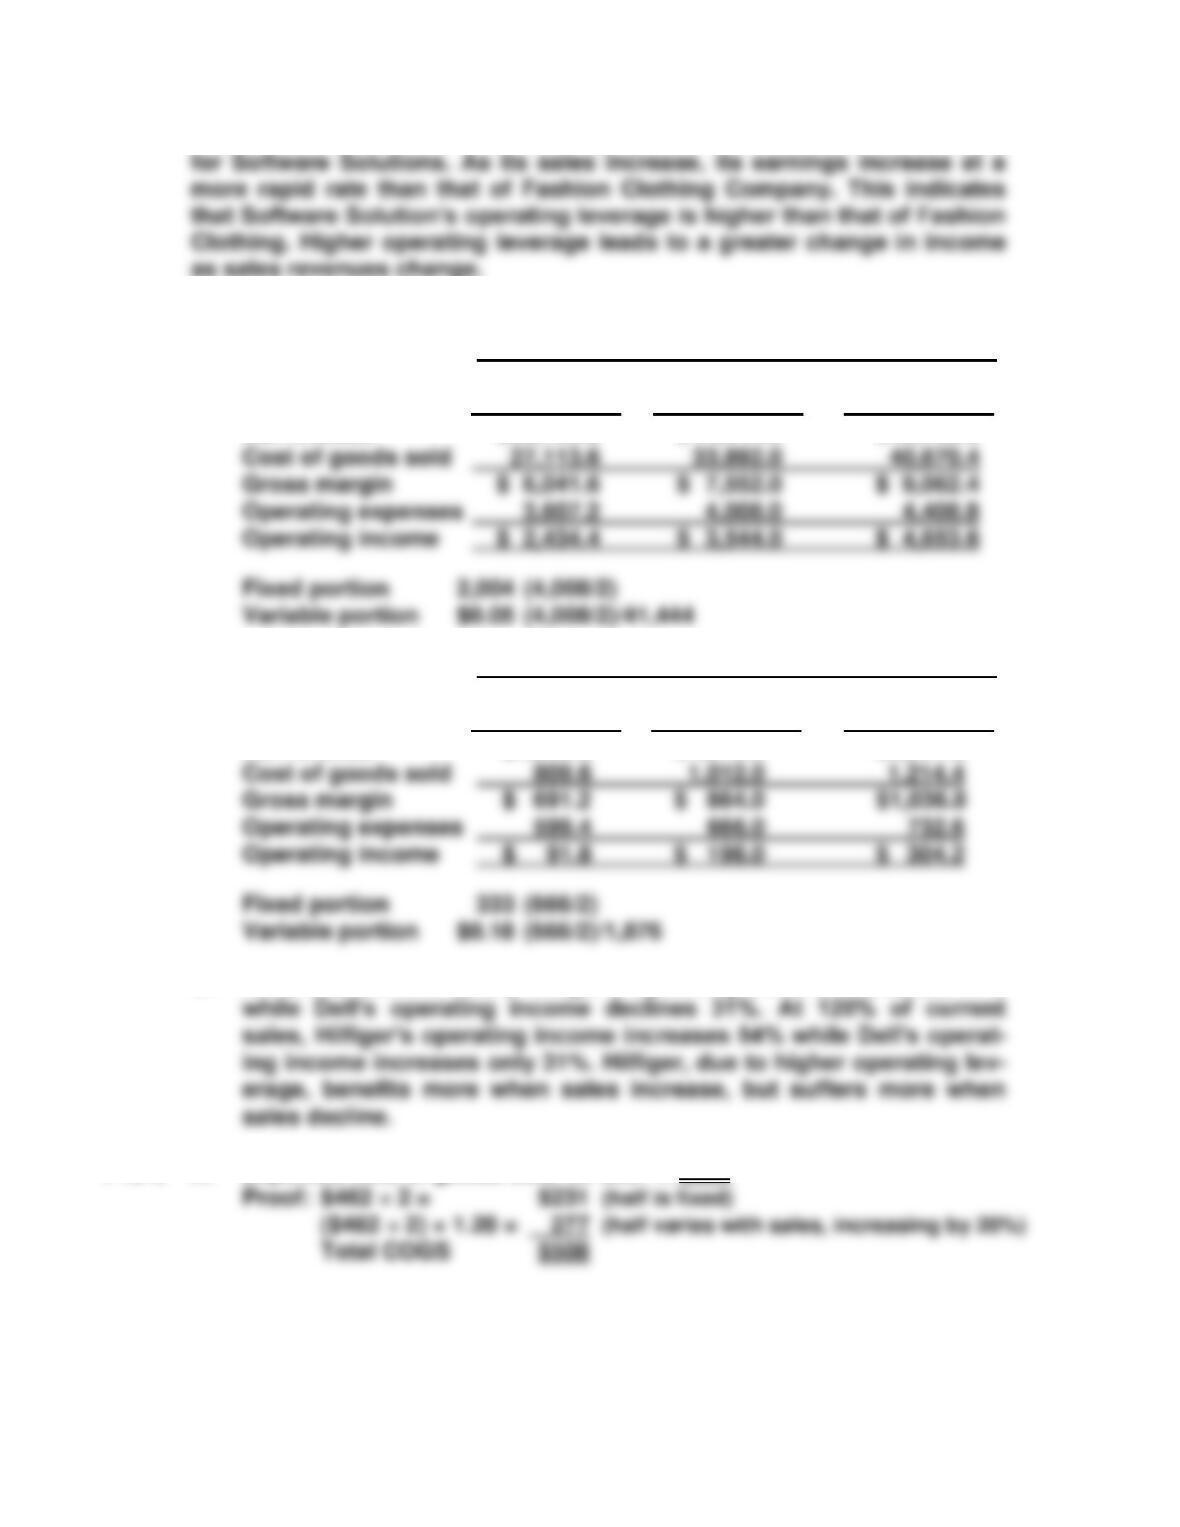
P12-5 A.
Dell (In millions)
80% of 120% of
Current Sales Current Sales Current Sales
Net revenue $ 33,155.2 $ 41,444.0 $ 49,732.8
B. Hilfiger (In millions)
80% of 120% of
Current Sales Current Sales Current Sales
Net revenue $1,500.8 $ 1,876.0 $2,251.2
C. At 80% of current sales, Hilfiger’s operating income decreases 54%
P12-6 A. Expected cost of goods sold for 2007 = $508
Analysis of Investing Activities 369
B. 2007
(In millions) Expected
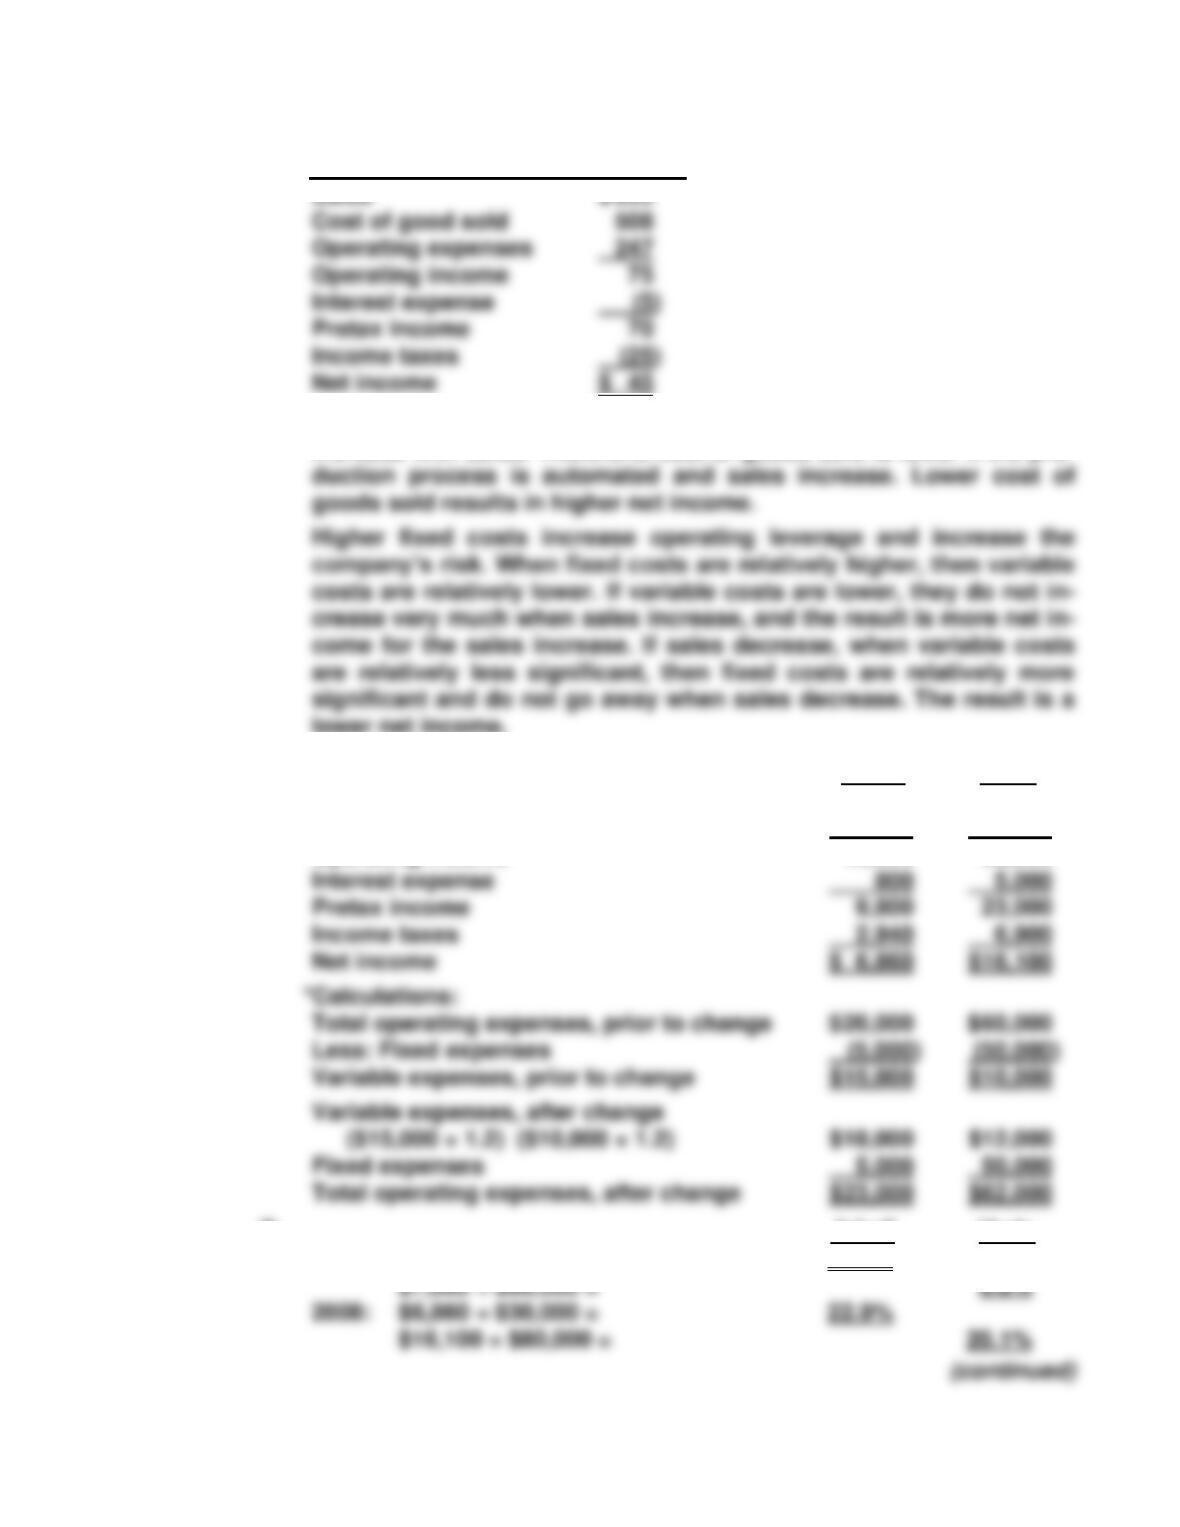
C. Because a portion of cost of goods sold is fixed, these costs do not
increase with sales. Therefore, cost of goods sold is lower if the pro-
lower net income.
P12-7 A. Jekyll Hyde
Sales $33,600 $90,000
Operating expenses* 23,000 62,000
Operating income 10,600 28,000
B. Jekyll Hyde
2007: $5,040 ÷ $30,000 = 16.8%
370 Chapter 12
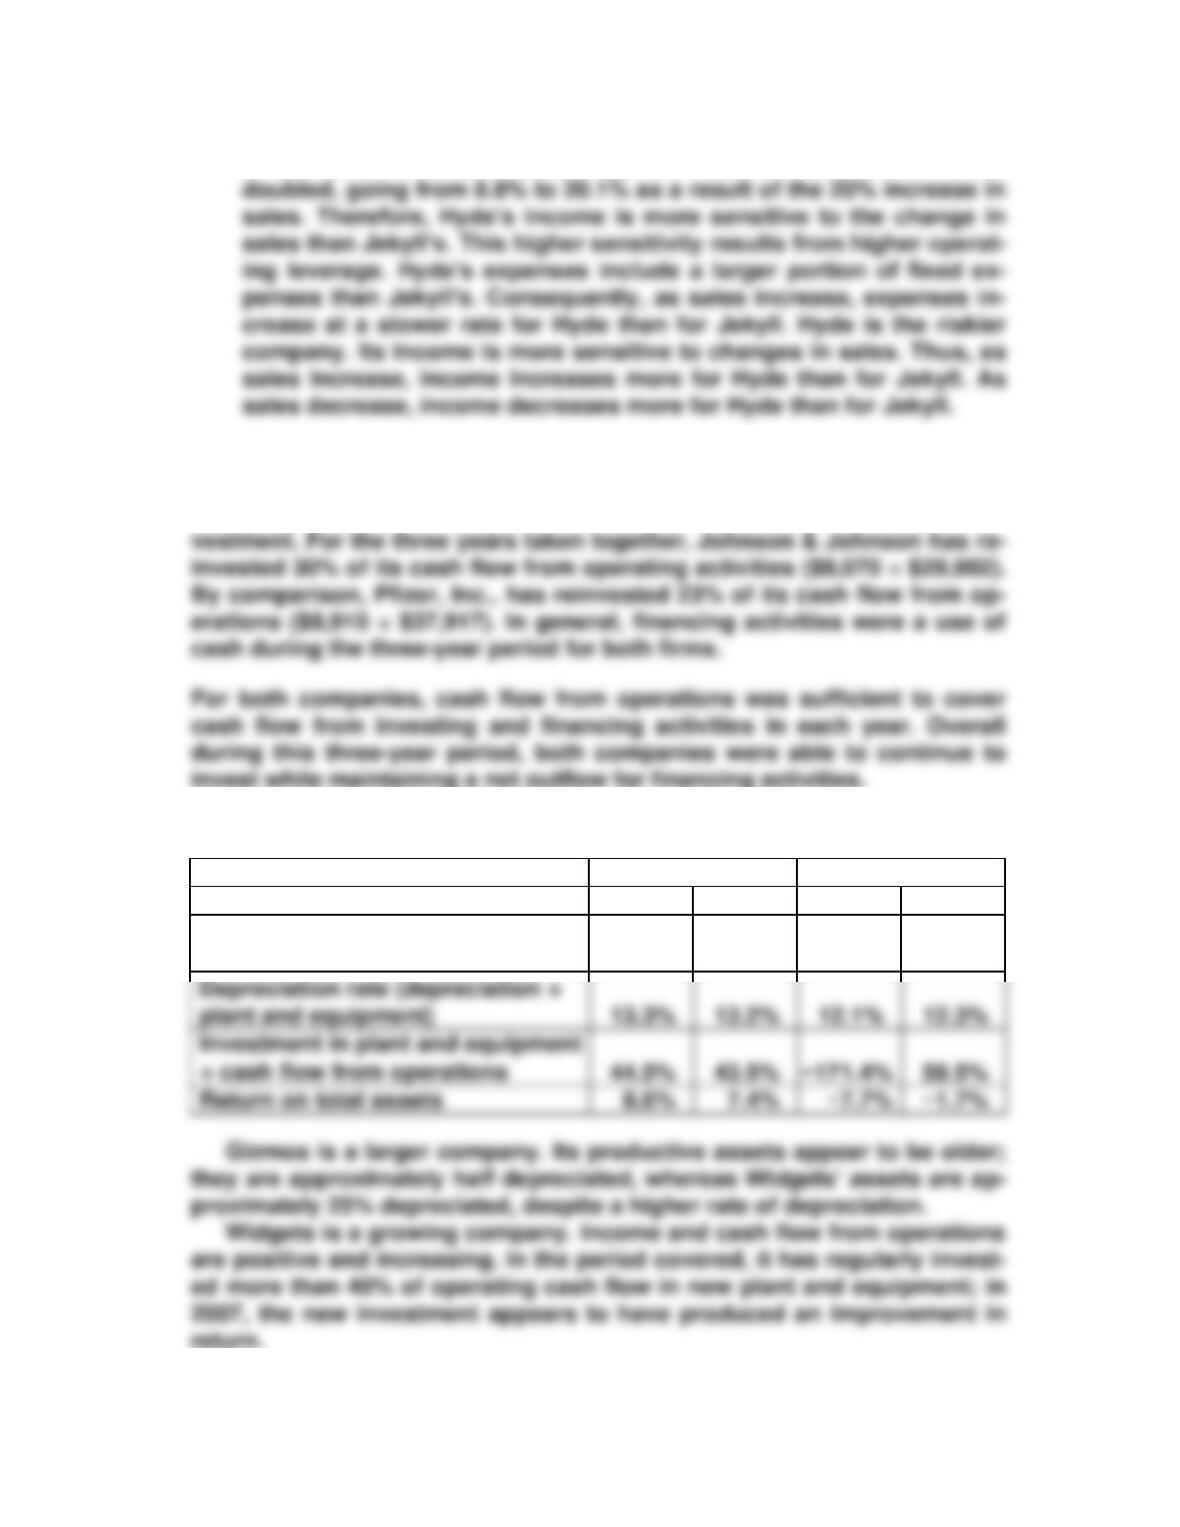
C. Jekyll’s return on assets increased from 16.8% to 22.9% as a result
of the 20% increase in sales. Hyde’s return on assets more than
P12-8 Both companies had positive, steadily increasing cash flows from operat-
ing activities during the three-year period. Both also continued to invest
during this period, although the two firms had different patterns of in-
P12-9 Ratios that could be calculated include the following:
Widgets Inc.
Gizmos Inc.
2007
2006
2007
2006
Accumulated depreciation ÷ plant
and equipment
25.0%
26.4%
51.2%
43.2%
Depreciation rate (depreciation ÷
plant and equipment)
13.3%
13.2%
12.1%
12.3%
44.5%
43.5%
58.5%
Analysis of Investing Activities 371
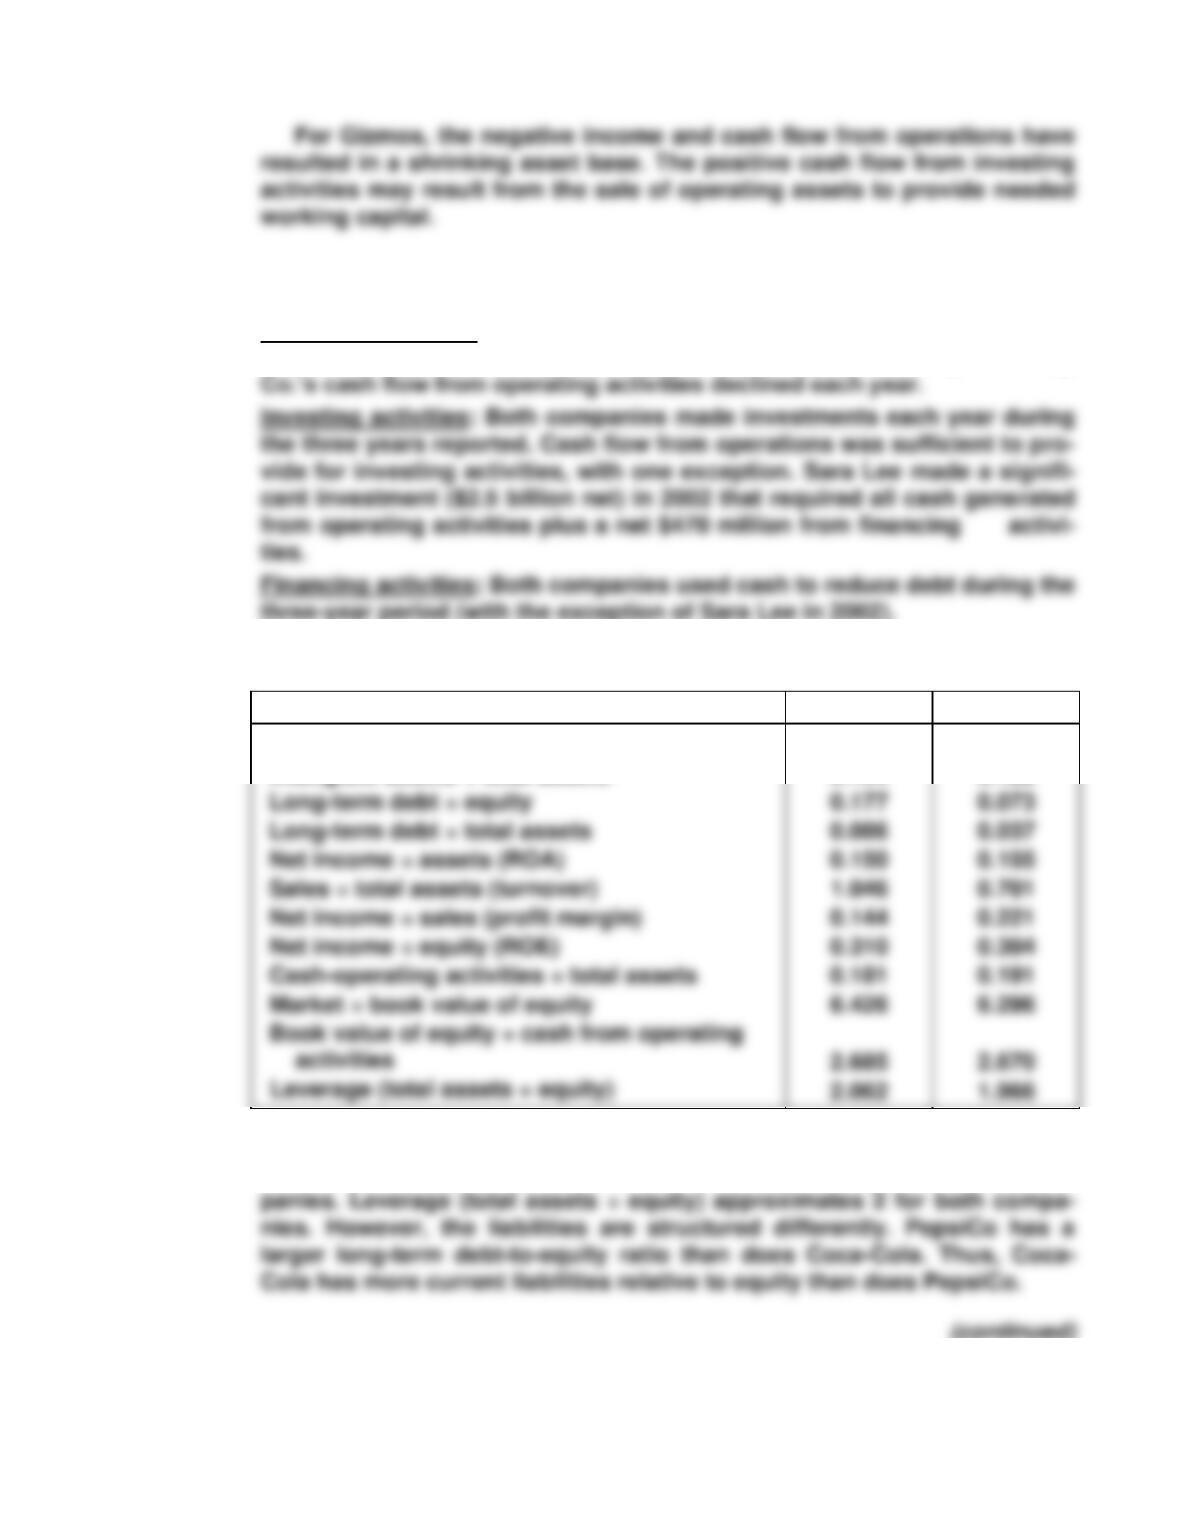
P12-10 The two companies have had different patterns of cash flows over the
three years presented.
Operating activities: Sara Lee increased its cash flow from operating ac-
tivities during each of the three years reported, while Campbell Soup
P12-11 Ratios that can be computed include the following:
PepsiCo
Coca-Cola
Plant assets ÷ total assets
Intangible assets ÷ total assets
0.291
0.194
0.194
0.122
The two company’s financial results are strikingly similar. For example,
ROA and ROE approximates 15% and 30%, respectively, for the two com-
372 Chapter 12
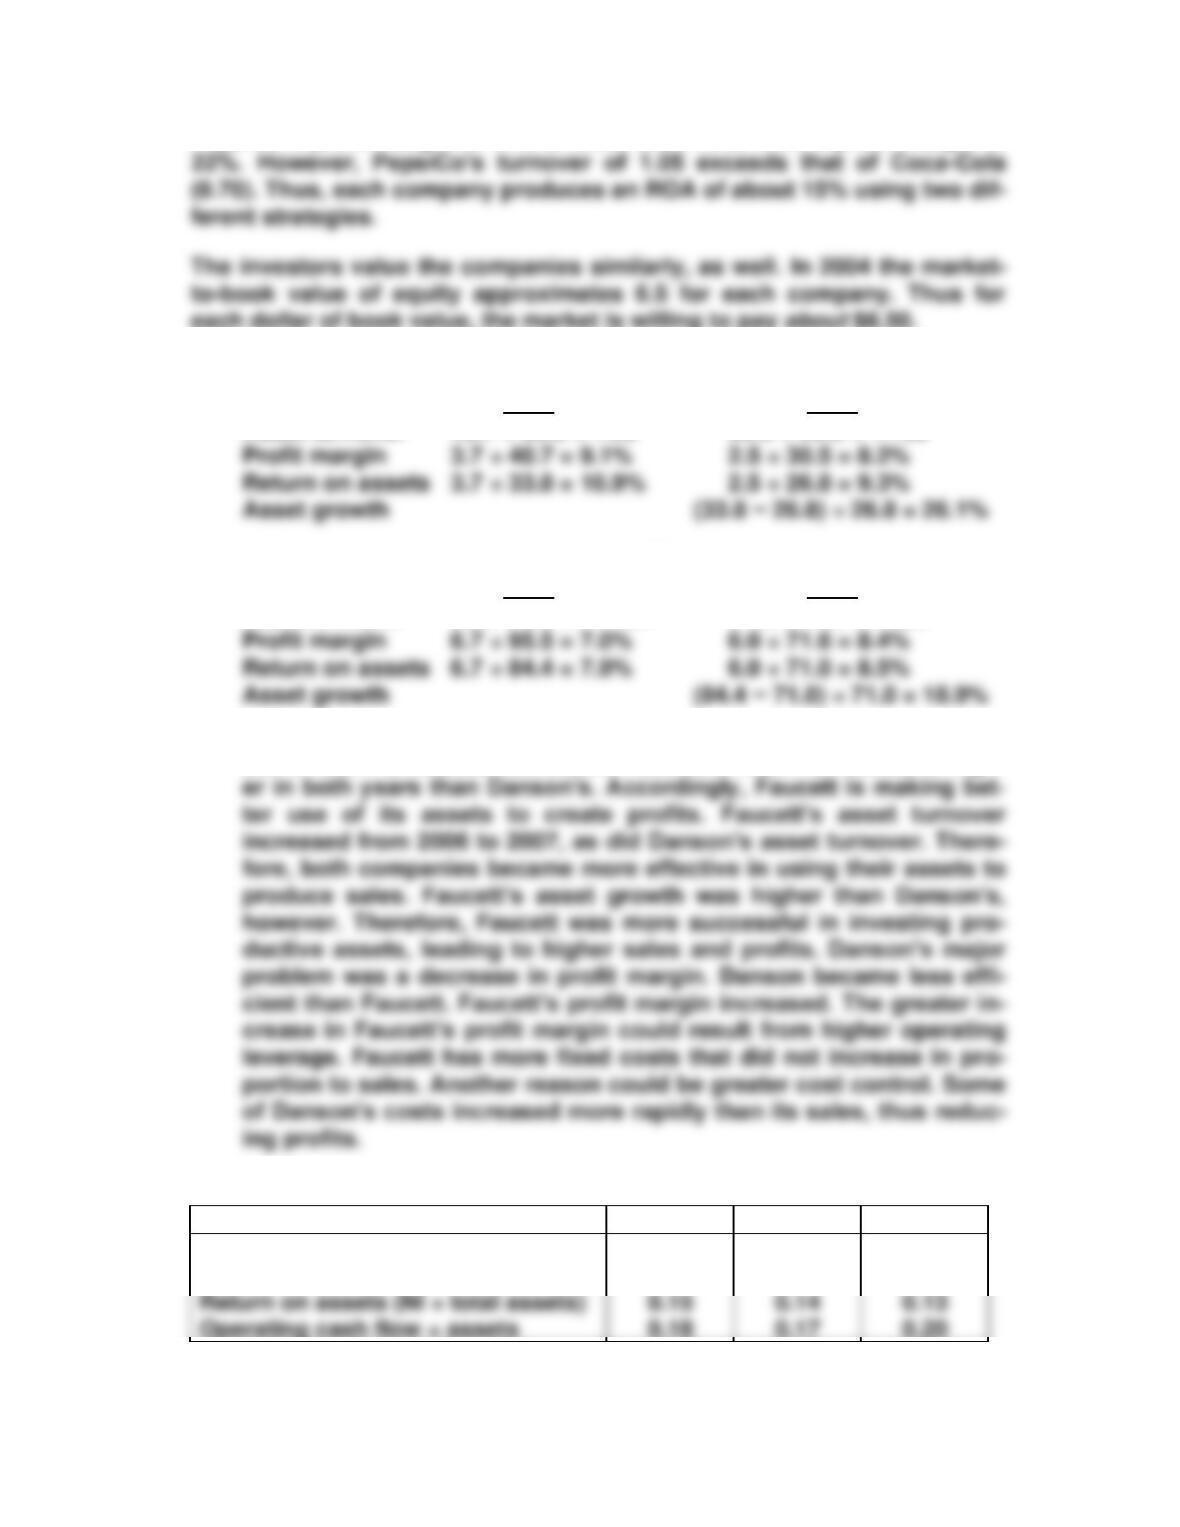
PepsiCo’s profit margin of 14% is lower than Coca-Cola’s profit margin of
each dollar of book value, the market is willing to pay about $6.50.
P12-12 A. Faucett
2007 2006
Asset turnover 40.7 ÷ 33.8 = 1.20 30.5 ÷ 26.8 = 1.138
Danson
2007 2006
Asset turnover 95.5 ÷ 84.4 = 1.132 71.6 ÷ 71.0 = 1.008
B. Faucett’s return on assets increased from 2006 to 2007, while Dan-
son’s return on assets decreased. Faucett’s return on assets is high-
P12-13
2004
2003
2002
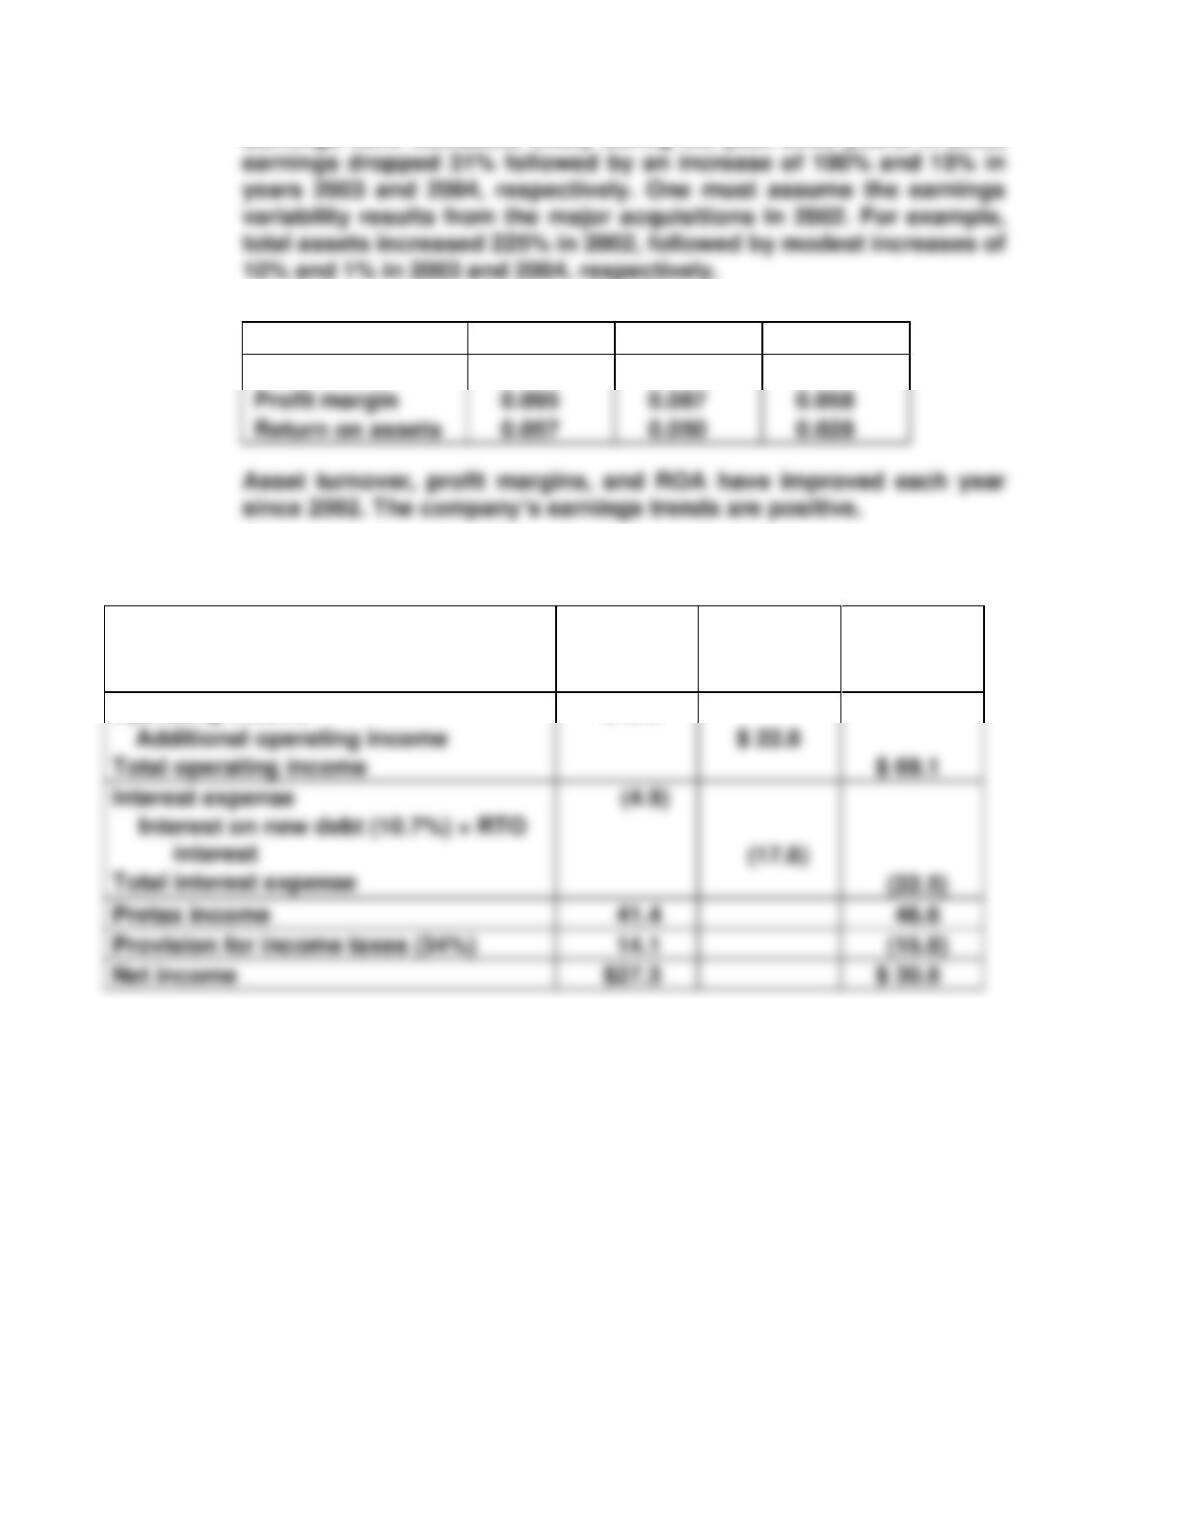
Profit margin (net income ÷ sales)
Asset turnover (sales ÷ total assets)
0.14
1.05
0.13
1.06
0.12
1.07
Analysis of Investing Activities 373
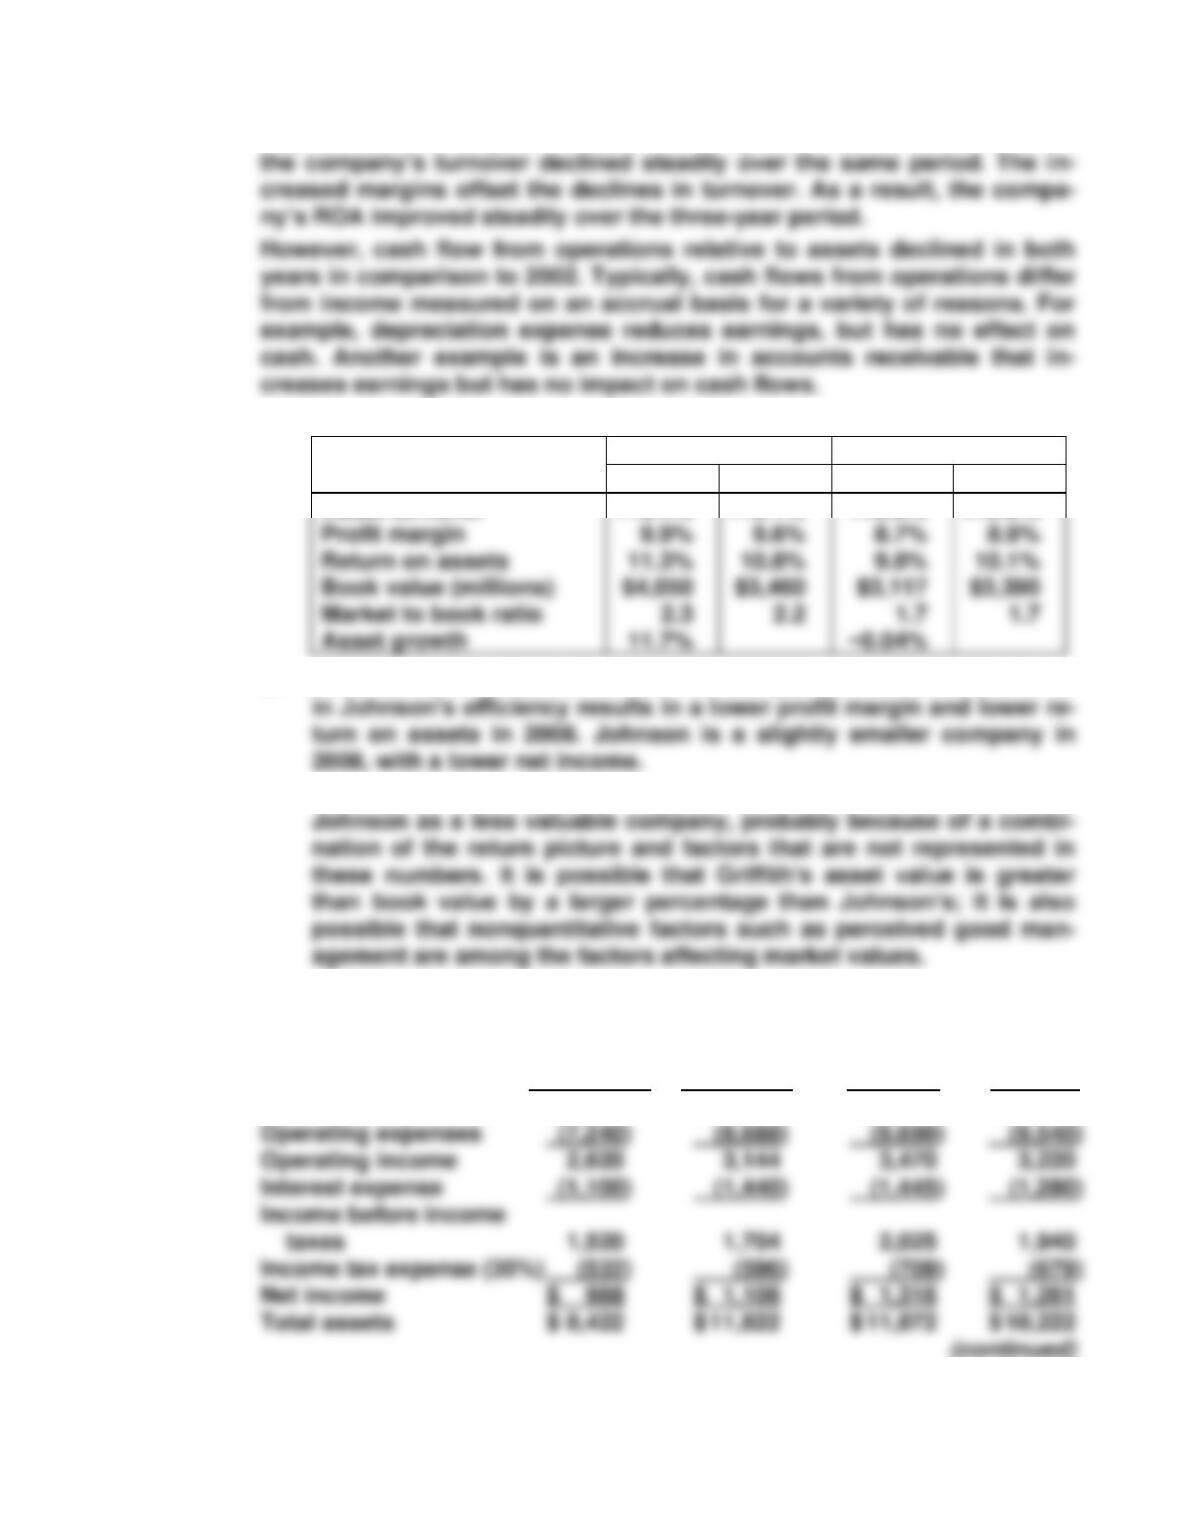
PepsiCo’s profit margins increased annually from 2002 to 2004; however,
P12-14 A.
Griffith Inc.
Johnson Inc.
2008
2007
2008
2007
Asset turnover
113.4%
113.1%
113.0%
112.6%
B. Asset turnover is similar for the two companies. However, a decline
C. The market to book figures suggest that the stock market perceives
P12-15 Pro forma income statements and calculations of return on total assets
follow:
A. Current Expansion Add Add
Operations of Current Dragons Games
Sales $ 9,860 $ 11,832 $ 13,160 $ 12,760
374 Chapter 12
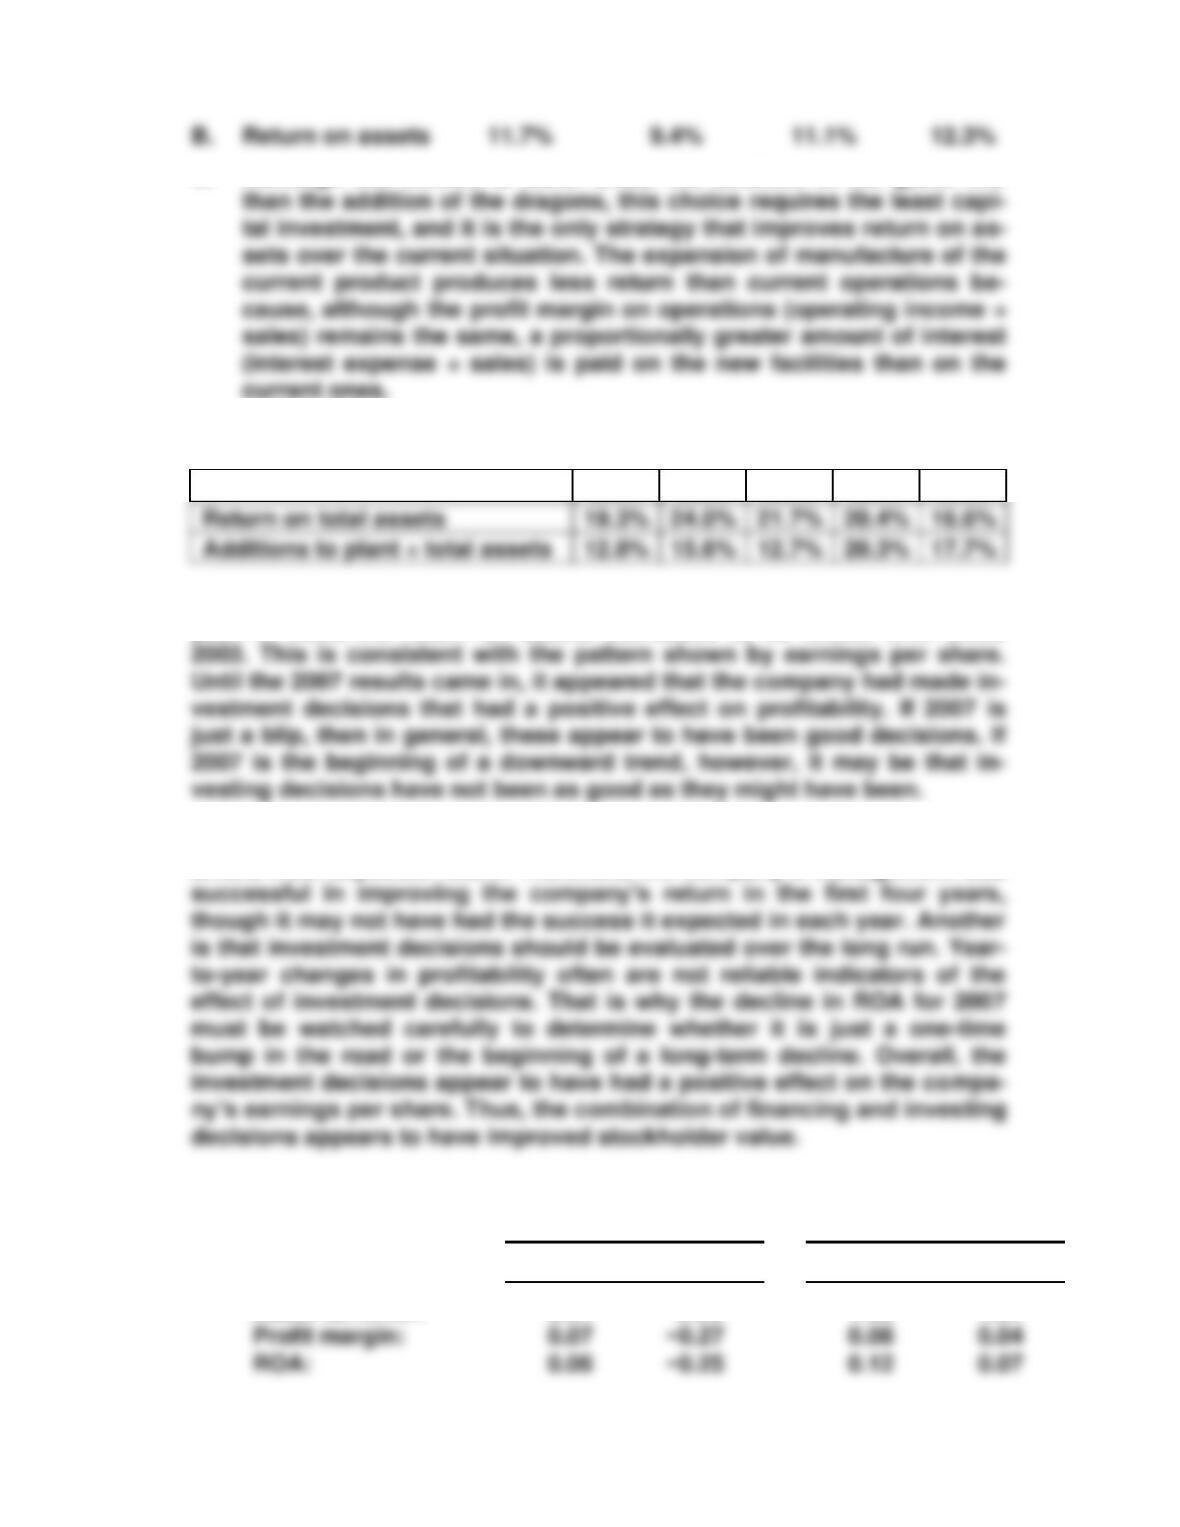
C. Although net income is lower under the addition of the game line
P12-16 Possible ratios to calculate include the following:
2007
2006
2005
2004
2003
Until 2006, the company’s return on assets consistently improved each
year. In 2006, the return on assets decreased to its lowest level since
Two points are important in this analysis. One is that actual return often
differs from expected return. Therefore, the company’s management was
P12-17 A.
Hilfiger
Nike
2004
2003
2004
2003
Asset turnover:
0.91
0.93
1.55
1.57
Analysis of Investing Activities 375
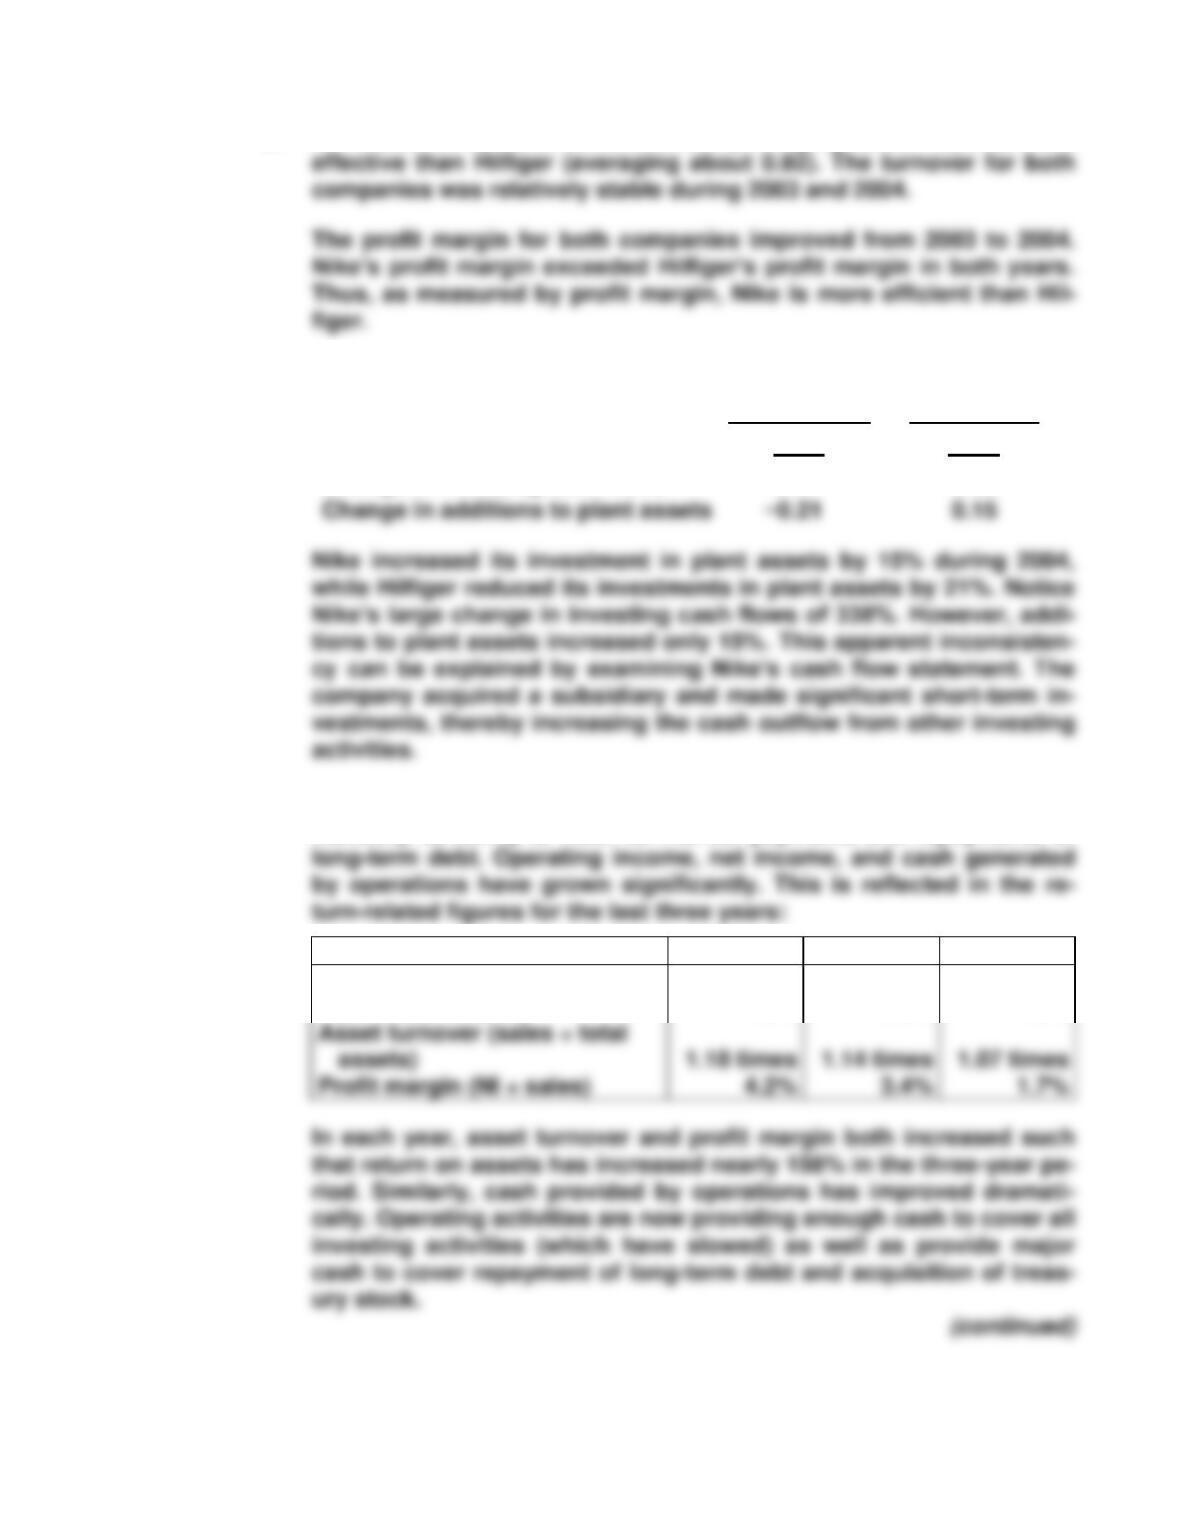
B. As measured by asset turnover, Nike (averaging about 1.6) was more
C.
Hilfiger
Nike
2004
2004
Change in investing cash flows
0.17
3.38
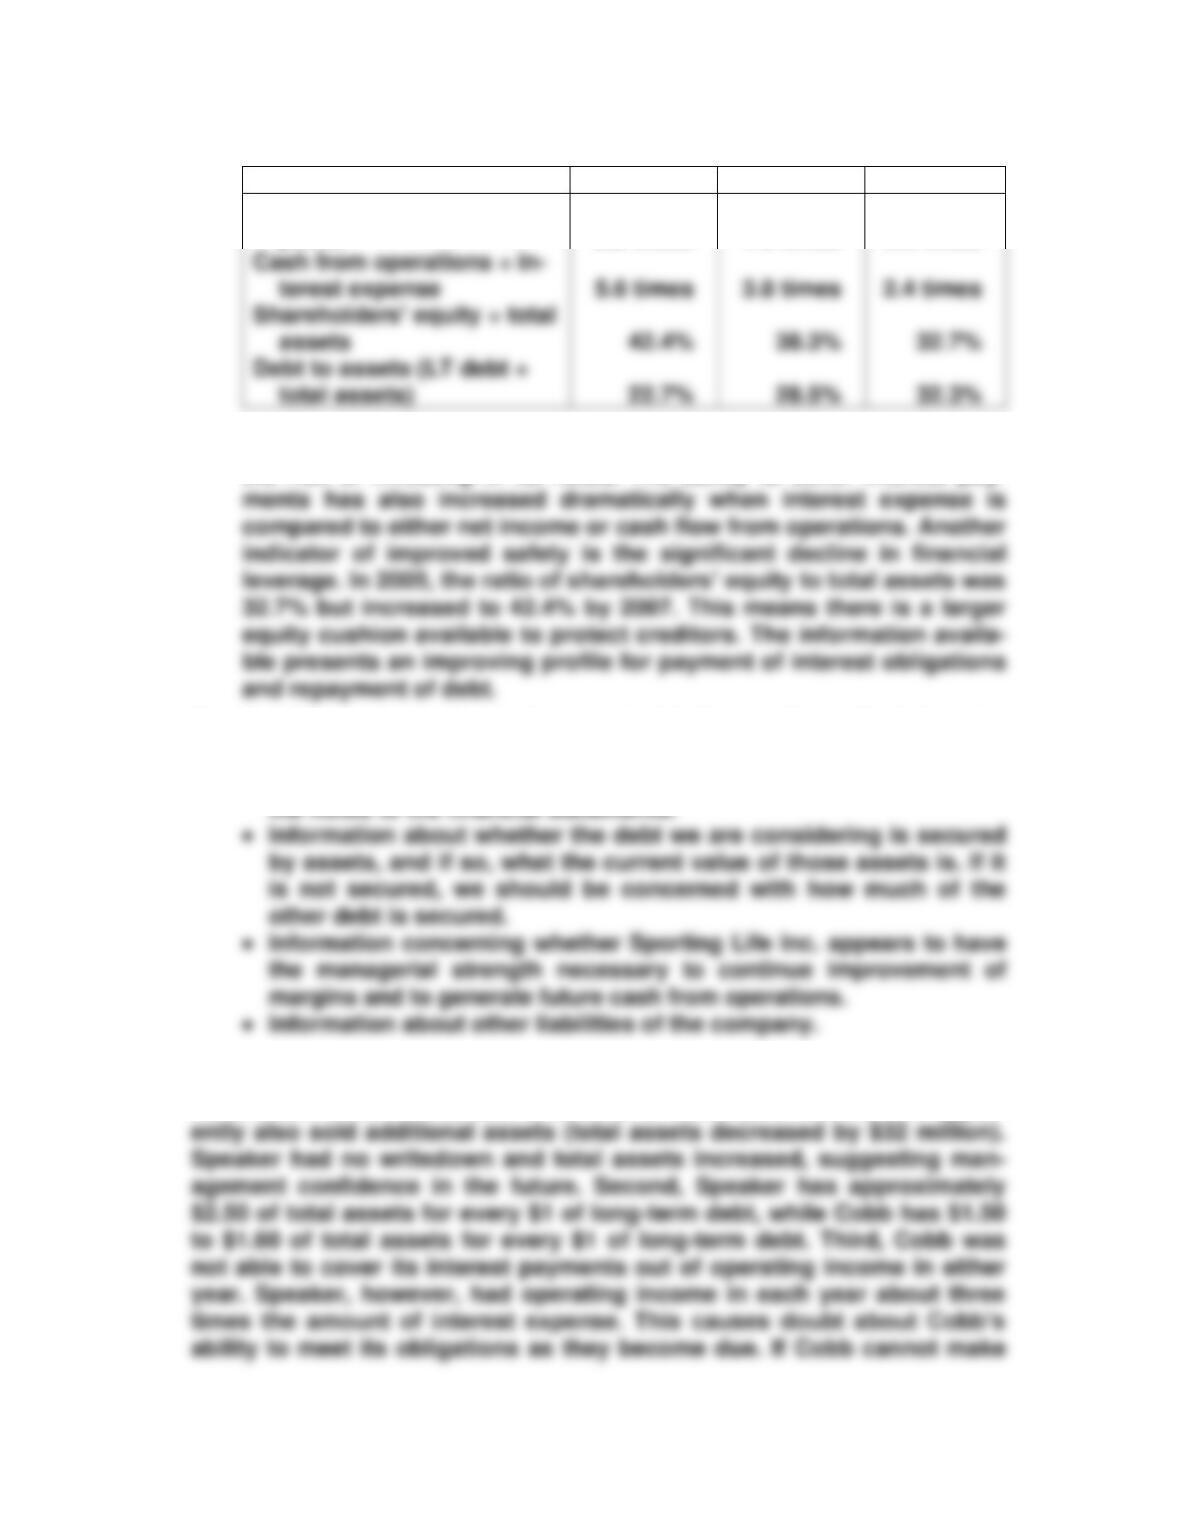
P12-18 A. From the information available, Sporting Life Inc. has improved dra-
matically its ability to meet its interest payments and repayments of
2007
2006
2005
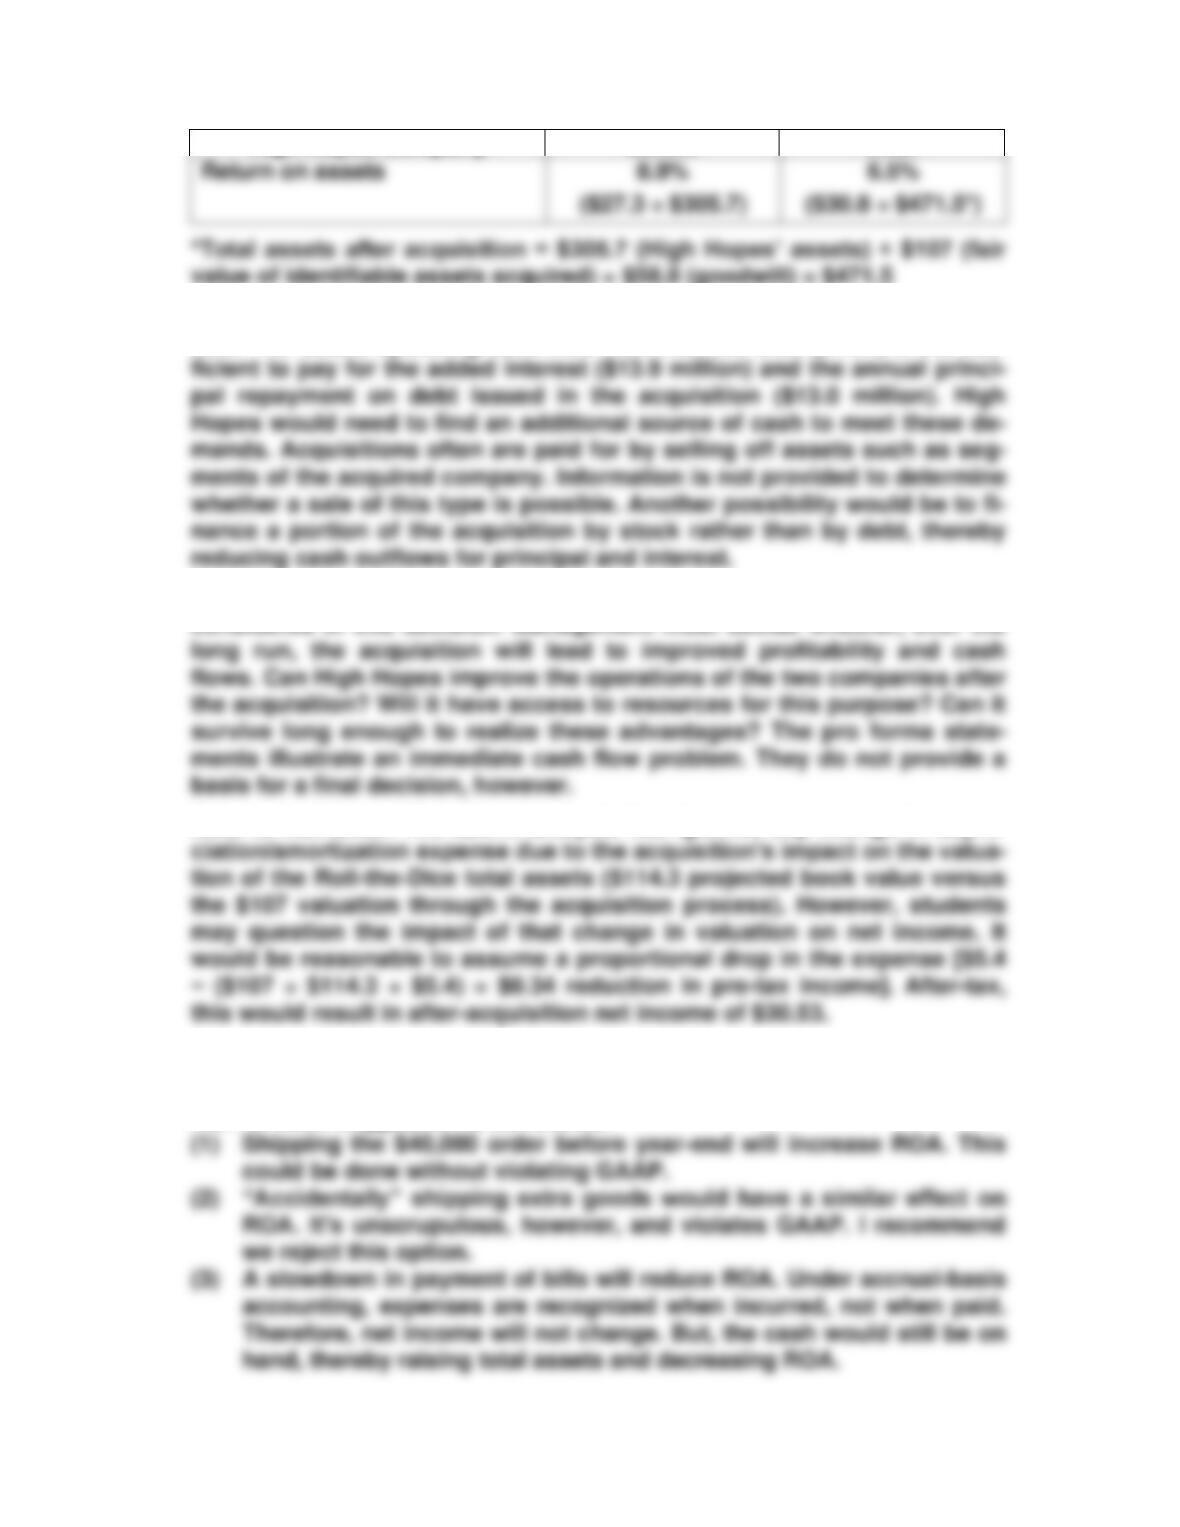
Return on total assets
(NI ÷ total assets)
4.9%
3.9%
1.9%
376 Chapter 12
Other measures that could be of interest are shown below.
2007
2006
2005
Net income ÷ interest ex-
pense
2.2 times
1.3 times
0.5 times
Debt as a percentage of assets has declined significantly, reducing
the risk of investing in its notes. The ability to cover interest pay-
B. Additional information to be examined before making a final decision
could include the following:
• Schedules of debt due in each of the next five years, available in
P12–19 Cobb seems to be more of a credit risk than Speaker. First, Cobb had to
write down some assets due to decline in value ($18 million) and appar-
Analysis of Investing Activities 377
does Speaker.
P12-20 The Book Wermz
Income Statement
For the Year Ended December 31, 2008
Current High Variable High Fixed
Sales $ 6,230,000 $ 7,000,000 $ 7,500,000
Cost of goods sold 3,426,500 4,200,000 3,750,000
P12-21
1
2
3
4
5
6
7
8
9
10
CASES
C12-1 A. Note #2 describes a significant investment in fiscal 2002 resulting
B. Growth rates:
2004
2003
2002
Total assets
0.012
0.102
2.249
378 Chapter 12
Earnings have fluctuated wildly during the past three years. In 2002,
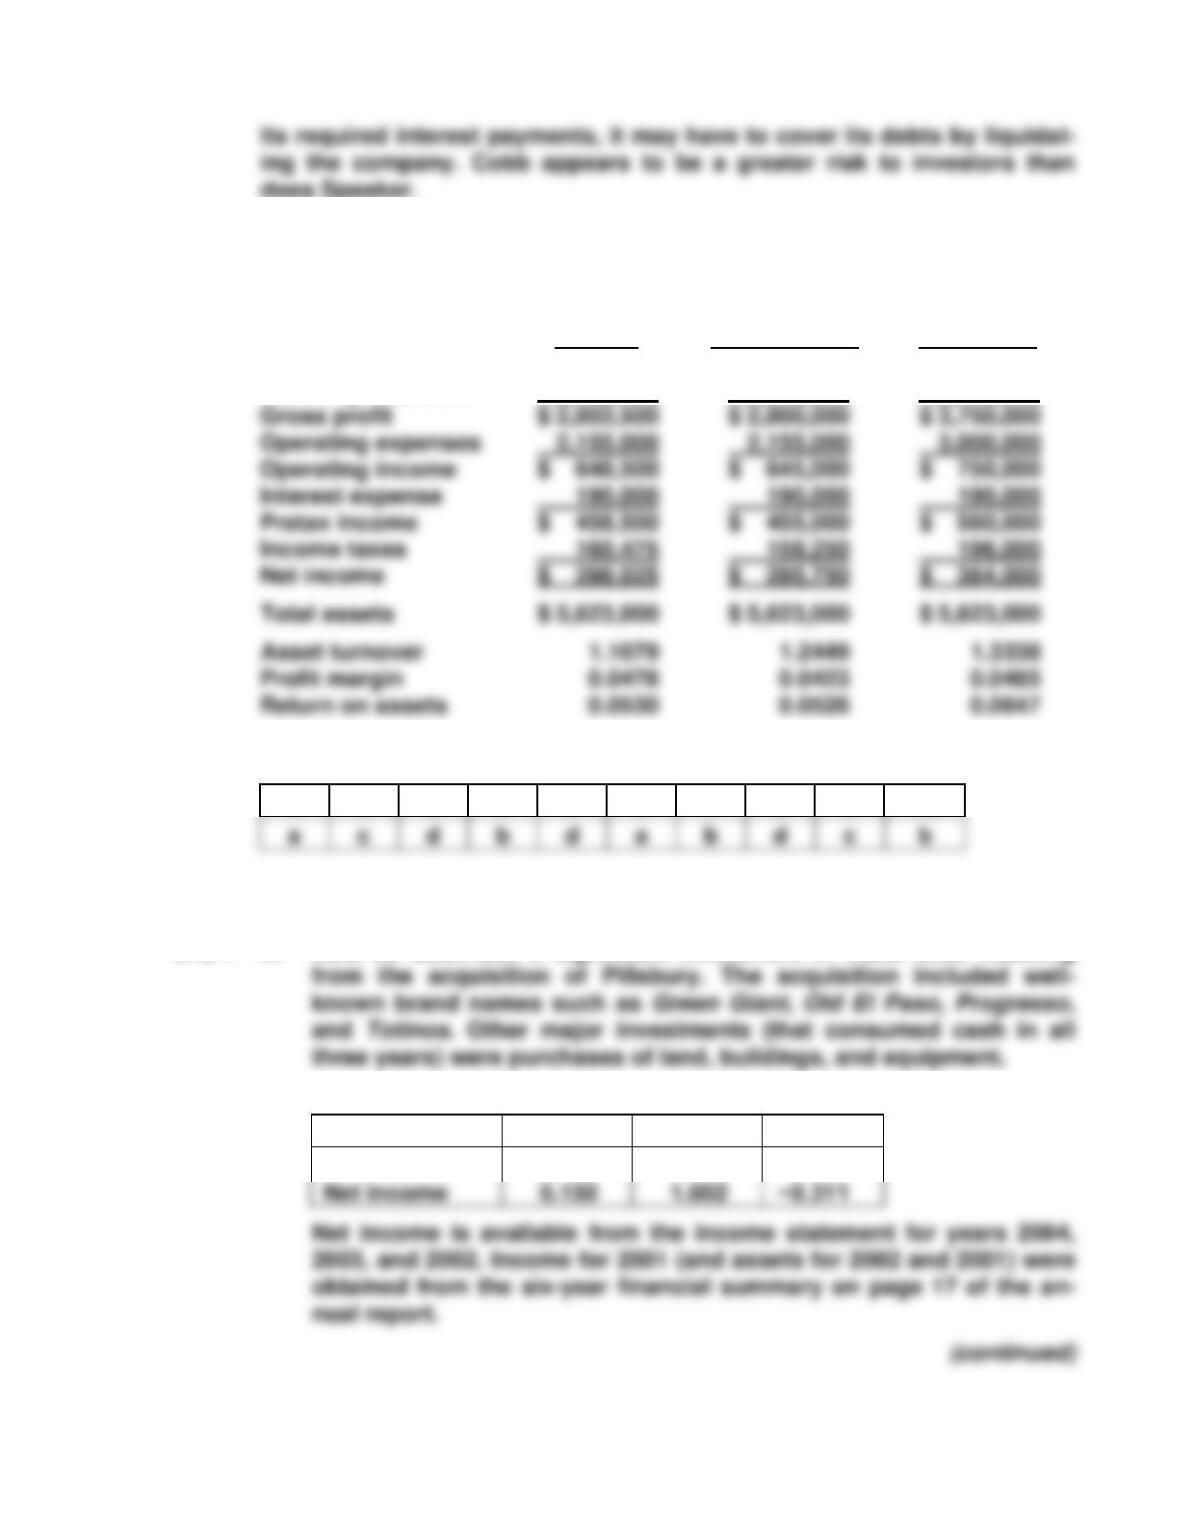
C.
2004
2003
2002
Turnover
0.600
0.576
0.481
C12-2 A pro forma analysis would indicate the following:
PRO FORMA INCOME STATEMENT
(In millions)
Before
Acquisi-
tion
Effect of
Acquisi-
tion
After
Acquisi-
tion
Interest on new debt (10.7%) + RTO
Operating income
$46.3
Analysis of Investing Activities 379
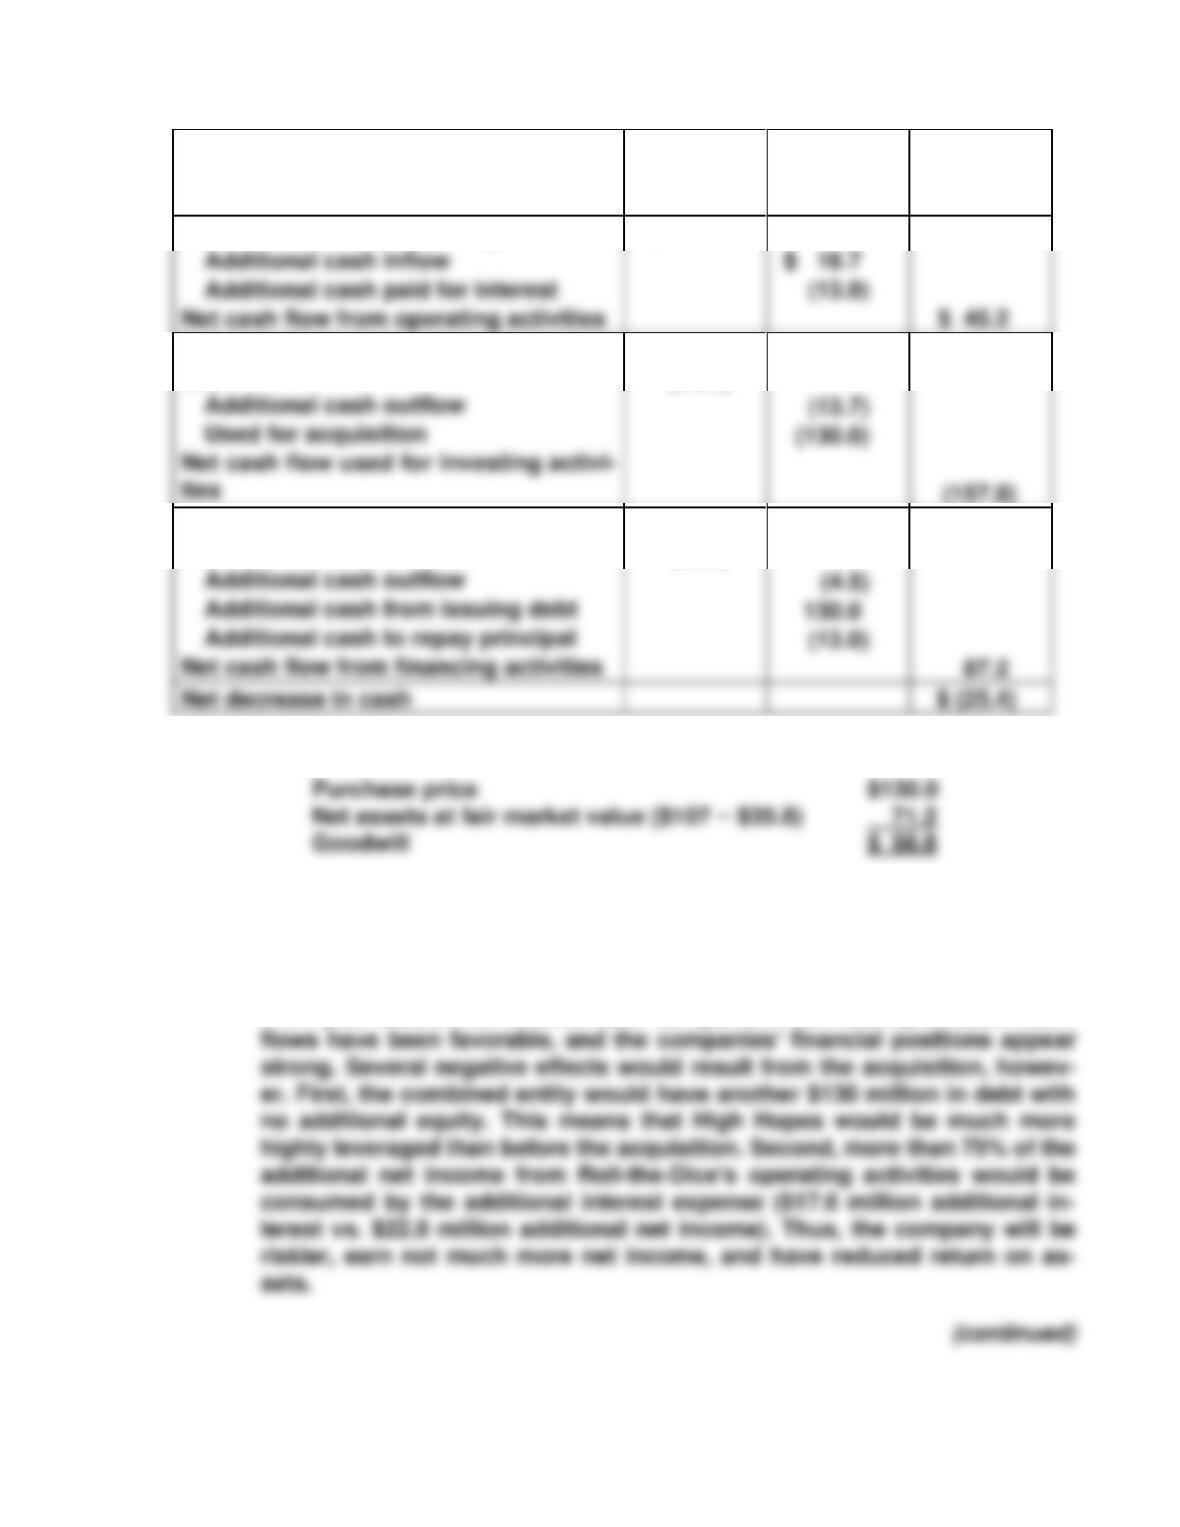
PRO FORMA STATEMENT OF CASH
FLOWS
(In millions)
Before
Acquisi-
tion
Effect of
Acquisi-
tion
After
Acquisi-
tion
Net cash flow from operating activities
$ 40.4
Net cash flow used for investing activi-
ties
(14.1)
Net cash flow used for financing activi-
ties
(25.3)
Goodwill is computed as follows:
The $130 million cash used for acquisition and $130 million cash obtained
from issuing debt is a wash and could be omitted from the pro forma
cash flow statement above. Either way, the net decrease in cash is $25.4
million.
Prior year statements indicate both companies have been profitable. Cash
380 Chapter 12
High Hopes Company
Before
After
value of identifiable assets acquired) + $58.8 (goodwill) = $471.5
The biggest problem with the acquisition is the need for additional cash
flow. The added operating cash flow from Roll-the-Dice ($18.7) is not suf-
The pro forma statements for 2008 are only a part of the information to be
Note to instructor: The above analysis has ignored any change in depre-
C12-3 Under the current projections, return on assets would be 9.4% (net in-
come of $150,000 divided by total assets of $1,590,000). The effect on
ROA of each suggestion is as follows:
Analysis of Investing Activities 381
(4) The writedown of old equipment reduces both net income and total
(5) If the accounting department has projected the inclusion of the new
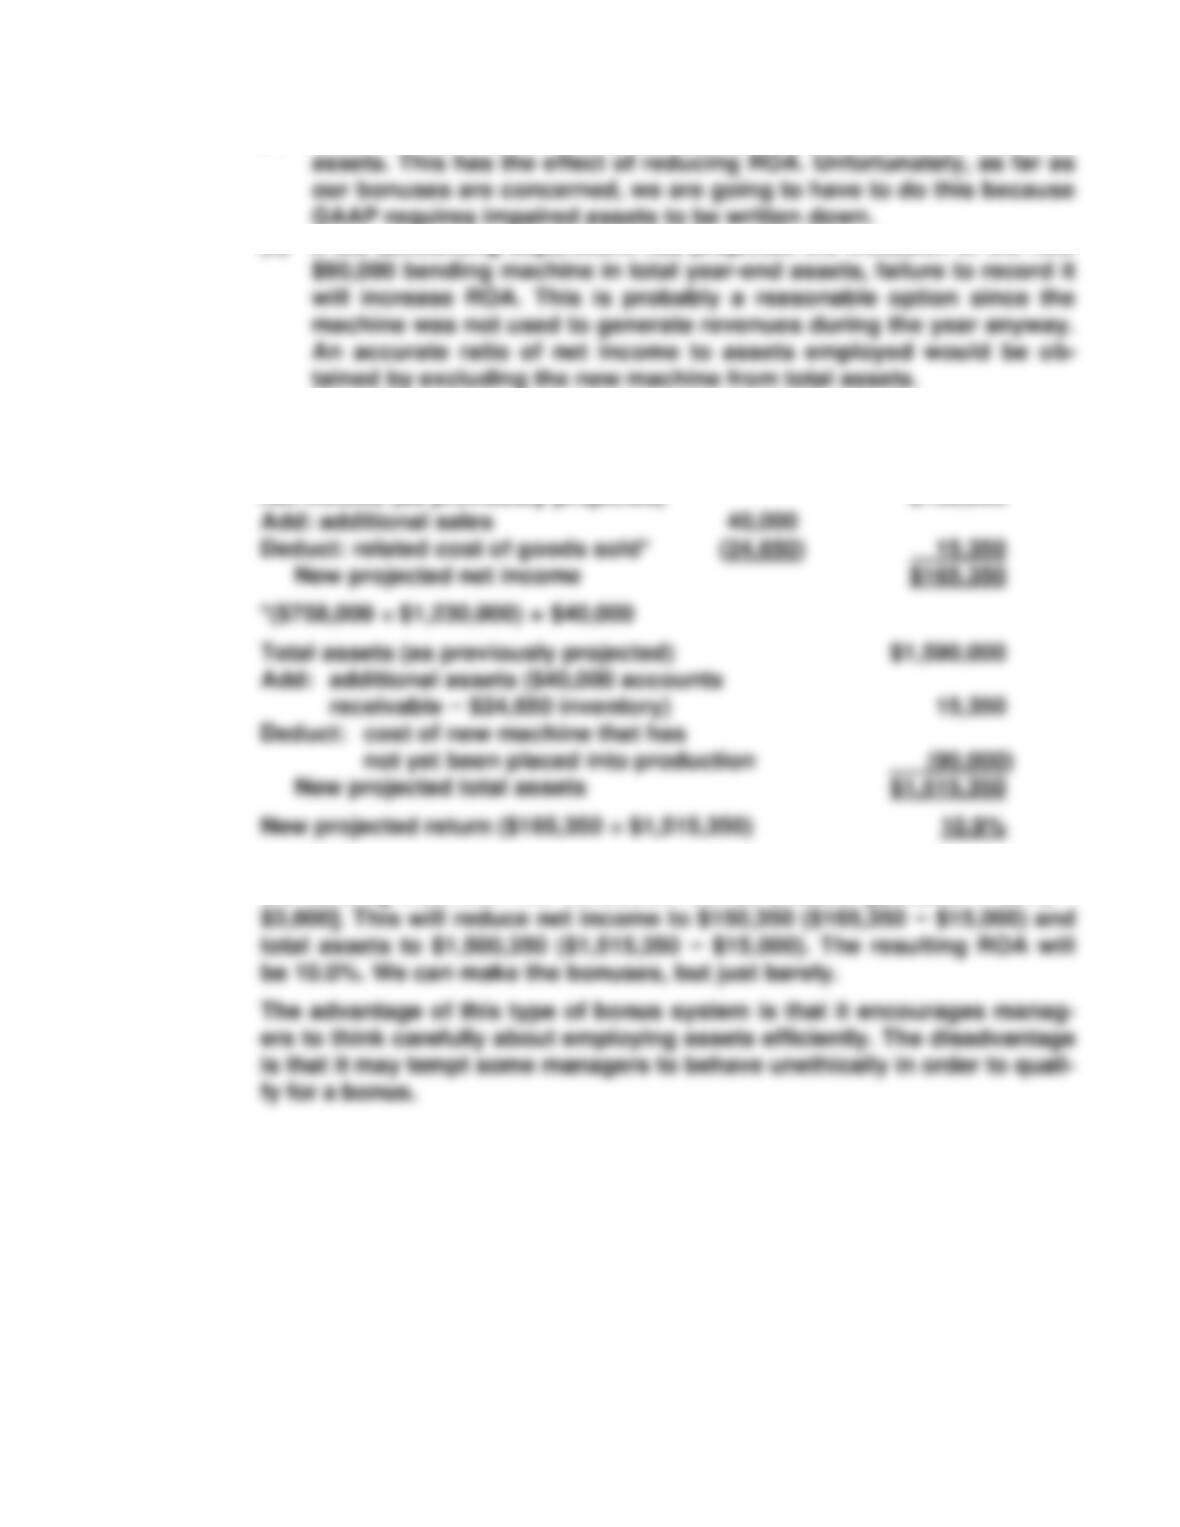
If we adopt only those options that are both in accordance with GAAP
and raise ROA, the results would be as follows.
Net income (as previously projected) $150,000
Unfortunately, however, we must also writedown the carrying value of the
old forming machine. The writedown will be $15,000 [($60,000 × 30%) −